Mayo 2013
Mayo 2013
Mayo 2013

Create successful ePaper yourself
Turn your PDF publications into a flip-book with our unique Google optimized e-Paper software.
<strong>Mayo</strong> <strong>2013</strong> COYUNTURA EN UN CLIC<br />
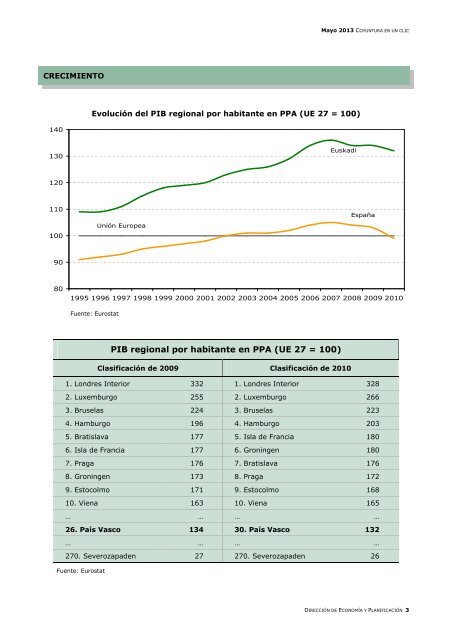
CRECIMIENTO<br />
140<br />
Evolución del PIB regional por habitante en PPA (UE 27 = 100)<br />
130<br />
Euskadi<br />
120<br />
110<br />
100<br />
Unión Europea<br />
España<br />
90<br />
80<br />
1995 1996 1997 1998 1999 2000 2001 2002 2003 2004 2005 2006 2007 2008 2009 2010<br />
Fuente: Eurostat<br />
PIB regional por habitante en PPA (UE 27 = 100)<br />
Clasificación de 2009 Clasificación de 2010<br />
1. Londres Interior 332 1. Londres Interior 328<br />
2. Luxemburgo 255 2. Luxemburgo 266<br />
3. Bruselas 224 3. Bruselas 223<br />
4. Hamburgo 196 4. Hamburgo 203<br />
5. Bratislava 177 5. Isla de Francia 180<br />
6. Isla de Francia 177 6. Groningen 180<br />
7. Praga 176 7. Bratislava 176<br />
8. Groningen 173 8. Praga 172<br />
9. Estocolmo 171 9. Estocolmo 168<br />
10. Viena 163 10. Viena 165<br />
… … … …<br />
26. País Vasco 134 30. País Vasco 132<br />
… … … …<br />
270. Severozapaden 27 270. Severozapaden 26<br />
Fuente: Eurostat<br />
DIRECCIÓN DE ECONOMÍA Y PLANIFICACIÓN 3