
You also want an ePaper? Increase the reach of your titles
YUMPU automatically turns print PDFs into web optimized ePapers that Google loves.
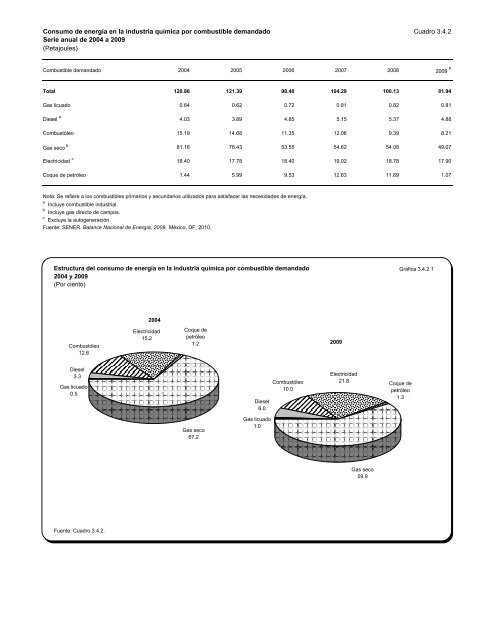
Consumo de energía en la industria química por combustible demandado Cuadro 3.4.2<br />
Serie anual de 2004 a 2009<br />
(Petajoules)<br />
Combustible demandado 2004 2005 2006 2007 2008 2009 P<br />
Total 120.86 121.39 98.40 104.29 100.13 81.94<br />
Gas licuado 0.64 0.62 0.72 0.81 0.82 0.81<br />
Diesel a 4.03 3.89 4.85 5.15 5.37 4.88<br />
Combustóleo 15.19 14.68 11.35 12.06 9.39 8.21<br />
Gas seco b 81.16 78.43 53.55 54.62 54.08 49.07<br />
Electricidad c 18.40 17.78 18.40 19.02 18.78 17.90<br />
Coque de petróleo 1.44 5.99 9.53 12.63 11.69 1.07<br />
Nota: Se refiere a los combustibles primarios y secundarios utilizados para satisfacer las necesidades de energía.<br />
a<br />
Incluye combustible industrial.<br />
b<br />
Incluye gas directo de campos.<br />
c<br />
Excluye la autogeneración.<br />
Fuente: SENER. Balance Nacional de Energía, 2009. México, DF, 2010.<br />
Estructura del consumo de energía en la industria química por combustible demandado<br />
2004 y 2009<br />
(Por ciento)<br />
Gráfica 3.4.2.1<br />
2004<br />
Combustóleo<br />
12.6<br />
Electricidad<br />
15.2<br />
Coque de<br />
petróleo<br />
1.2<br />
2009<br />
Diesel<br />
3.3<br />
Gas licuado<br />
0.5<br />
.<br />
Diesel<br />
6.0<br />
Combustóleo<br />
10.0<br />
Electricidad<br />
21.8<br />
Coque de<br />
petróleo<br />
1.3<br />
Gas seco<br />
67.2<br />
Gas licuado<br />
1.0<br />
.<br />
Gas seco<br />
59.9<br />
Fuente: Cuadro 3.4.2.