Censo del arbolado urbano - ISA Hispana
Censo del arbolado urbano - ISA Hispana
Censo del arbolado urbano - ISA Hispana

Create successful ePaper yourself
Turn your PDF publications into a flip-book with our unique Google optimized e-Paper software.
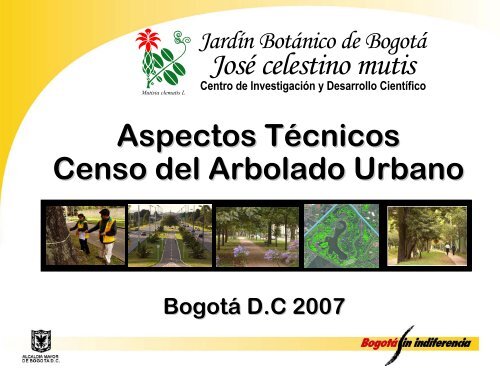
Aspectos Técnicos T<br />
<strong>Censo</strong> <strong>del</strong> Arbolado Urbano<br />
Bogotá D.C 2007
Instituciones Participantes<br />
Entidades Aportantes<br />
Entidades Ejecutoras<br />
_______________________________<br />
UNIDAD ADMINISTRATIVA<br />
ESPECIAL DE SERVICIOS<br />
PÚBLICOS<br />
___________________________<br />
Secretaría a Distrital<br />
AMBIENTE<br />
____________________________<br />
Instituto Distrital<br />
RECREACIÓN N Y DEPORTE
¿ Qué es
Base Legal
¿ Dónde <br />
Perímetro Urbano<br />
Espacio Público P<br />
de Uso PúblicoP
¿ Dónde
Inició: Septiembre 15 de 2005<br />
Finalizó: : Noviembre 26 2007
Datos Técnicos T<br />
<strong>del</strong> Operativo<br />
Mas de 300 personas<br />
en terreno<br />
Más s de 540 díasd<br />
4.320 Horas /<br />
persona<br />
Tecnología a Innovadora y<br />
de Punta
No es un Inventario es un <strong>Censo</strong><br />
Leptospermun<br />
43 Variables<br />
Georreferenciación<br />
Submétrica<br />
Identificación n de la Especie<br />
Dasometría<br />
Raices Caucho<br />
Chicala<br />
Estado FísicoF<br />
Estado Sanitario
Metodología<br />
Formulario de Captura<br />
Marco Geoestadístio<br />
Producción Estadística
Sincronización n Remota
Control de Calidad<br />
Aseguramiento<br />
de Calidad<br />
Validación<br />
Evaluación
Calidad <strong>del</strong> CAU<br />
Calidad <strong>del</strong> CAU<br />
C312 ene-06<br />
86%<br />
C312 sep-06<br />
C312 nov-06<br />
C520 feb-07<br />
C520 jul-07<br />
C312 sep-07<br />
C469 jun-07<br />
C469 sep-07<br />
89%<br />
91%<br />
90%<br />
93%<br />
95%<br />
97%<br />
99%<br />
100%<br />
95%<br />
90%<br />
85%<br />
80%<br />
Indicador de Calidad<br />
Límite aceptación<br />
Evaluación<br />
%
RESULTADOS
1.066.463 Árboles<br />
Localizados en Zona Urbana<br />
dentro <strong>del</strong> Espacio Público P<br />
de<br />
Uso Público P<br />
de Bogotá D.C.<br />
Mapa <strong>Censo</strong> Total
Bogotá D.C.<br />
6.763.325325 Habitantes*<br />
1.066.463 Árboles<br />
0,16 Árboles/ Habitante<br />
0,16<br />
/<br />
Árboles Localizados en Zona Urbana dentro <strong>del</strong><br />
Espacio Público P<br />
de Uso Público P<br />
de Bogotá D.C.<br />
*Fuente: DANE (2005), Población de la cabecera de Bogotá D.C.
Árboles por cada 100.000 Habitantes*<br />
300.000<br />
250.000<br />
200.000<br />
Fuente: USDA Forest Service – Nowak et al. (2007)<br />
ÁRBOLES / 100.000 HABITANTES<br />
138.381<br />
89.988<br />
29.411<br />
27.777<br />
25.000<br />
16.111<br />
15.768<br />
12.000<br />
11.893<br />
331.244<br />
150.000<br />
100.000<br />
50.000<br />
0<br />
Washington<br />
Fila<strong>del</strong>fia<br />
San Francisco<br />
Madrid<br />
Santiago de<br />
Chile<br />
Brooklyn-<br />
New York<br />
Montevideo<br />
Bogotá<br />
Sevilla<br />
Buenos Aires<br />
CIUDAD
Cobertura Arbórea<br />
rea<br />
Espacio Público P<br />
de Uso Público P<br />
de Bogotá D.C.<br />
COBERTURA<br />
ARBÓREA<br />
2.47 %<br />
COBERTURA<br />
ARBOREA<br />
2,47 %<br />
OTRAS<br />
COBERTURAS<br />
97,53 %<br />
947,6 Ha<br />
Equivalente al 2.47%<br />
de la Zona Urbana<br />
Mapa Cobertura Arbórea
35%<br />
30%<br />
Cobertura Arbórea rea Ciudades*<br />
28,6%<br />
COBERTURA (%)<br />
25%<br />
20%<br />
15%<br />
10%<br />
15,7%<br />
11,9%<br />
5%<br />
5,0%<br />
2,5%<br />
0%<br />
Washington Fila<strong>del</strong>fia San Francisco Los Angeles Bogotá<br />
CIUDAD<br />
* Fuente: USDA Forest Service - Nowak et al. (2007). <strong>Censo</strong> <strong>del</strong> Arbolado Urbano 2007.
Especies Dominantes<br />
Especies Dominantes<br />
51.195<br />
49.814<br />
40.205<br />
40.105<br />
35.659<br />
29.734<br />
29.635<br />
27.759<br />
26.422<br />
4,9% 4,8% 3,8% 3,8% 3,4% 2,8% 2,8% 2,6% 2,5%<br />
Mapa Especies Dominantes<br />
82.053<br />
100.000<br />
80.000<br />
60.000<br />
40.000<br />
20.000<br />
0<br />
7,8%<br />
Sauco<br />
Jazmín <strong>del</strong><br />
cabo<br />
Acacia negra<br />
Acacia<br />
japonesa<br />
Urapán<br />
Pino ciprés<br />
Acacia<br />
bracatinga<br />
Holly liso<br />
Chicalá<br />
Cerezo
Composición<br />
750.000<br />
500<br />
Cantidad de árboles<br />
600.000<br />
450.000<br />
300.000<br />
150.000<br />
0<br />
679.450<br />
63%<br />
347.052<br />
32%<br />
136 127<br />
51,7% 48,3%<br />
2%<br />
Foranea Nativa Indeterminado<br />
1 2 3<br />
Origen<br />
400<br />
300<br />
200<br />
100<br />
0<br />
Cantidad de especies
4.523<br />
0,4%<br />
101.866<br />
97.203<br />
85.747<br />
83.700<br />
58.400<br />
52.778<br />
51.412<br />
45.100<br />
44.115<br />
36.859<br />
32.500<br />
30.775<br />
29.056<br />
28.767<br />
19.791<br />
9.411<br />
5.833<br />
Can<strong>del</strong>aria<br />
248.600<br />
250.000<br />
200.000<br />
150.000<br />
100.000<br />
50.000<br />
0<br />
Árboles por Localidad<br />
Bogotá: 1.066.436 Árboles<br />
23,3% 9,6% 9,1% 8,0% 7,8% 5,5% 4,9% 4,8% 4,2% 4,1% 3,5% 3,0% 2,9%<br />
2,7% 2,7% 1,9%<br />
0,9%<br />
0,5%<br />
Suba<br />
Usaquén<br />
Kennedy<br />
Engativá<br />
Santa Fe<br />
Usme<br />
Teusaquillo<br />
Rafael Uribe<br />
San Cristóbal<br />
Fontibón<br />
Puente Aranda<br />
Ciudad Bolívar<br />
Barrios Unidos<br />
Chapinero<br />
Tunjuelito<br />
Bosa<br />
Antonio Nariño<br />
Los Mártires<br />
LOCALIDAD<br />
Mapa Árboles por Localidad<br />
Nº Árboles
Árboles por cada 100.000 Habitantes<br />
81.588<br />
41.321<br />
27.261<br />
24.989<br />
24.324<br />
19.815<br />
15.592<br />
14.802<br />
13.728<br />
13.687<br />
13.652<br />
13.615<br />
11.153<br />
10.783<br />
10.365<br />
7.865<br />
5.948<br />
5.776<br />
3.946<br />
80.000<br />
60.000<br />
40.000<br />
20.000<br />
Bogotá: 15.768<br />
0<br />
Santa Fe<br />
Teusaquillo<br />
Suba<br />
Chapinero<br />
Usaquén<br />
Usme<br />
Tunjuelito<br />
Fontibón<br />
Barrios Unidos<br />
Rafael Uribe<br />
Can<strong>del</strong>aria<br />
Puente Aranda<br />
San Cristobal<br />
Engativá<br />
Kennedy<br />
Antonio Nariño<br />
Los Mártires<br />
Ciudad Bolívar<br />
Bosa<br />
LOCALIDAD<br />
Mapa Árboles per Capita<br />
ÁRBOLES / 100.000 HABITANTES
8,70<br />
Usaquén<br />
104,82<br />
84,93<br />
82,43<br />
78,10<br />
67,50<br />
67,03<br />
62,31<br />
48,70<br />
45,17<br />
45,17<br />
43,63<br />
41,55<br />
30,68<br />
10,17<br />
9,90<br />
9,80<br />
4,80<br />
Can<strong>del</strong>aria<br />
Los Mártires<br />
Engativá<br />
102,22<br />
Teusaquillo<br />
Kennedy<br />
Suba<br />
Rafael Uribe<br />
Chapinero<br />
Fontibón<br />
Tunjuelito<br />
San Cristóbal<br />
Usme<br />
Barrios Unidos<br />
Puente Aranda<br />
Santa Fe<br />
Antonio Nariño<br />
Bosa<br />
Ciudad Bolívar<br />
120,00<br />
100,00<br />
80,00<br />
60,00<br />
40,00<br />
20,00<br />
0,00<br />
Cobertura Arbórea rea (Ha)<br />
Bogotá: 947,61 Ha<br />
LOCALIDADES<br />
COBERTURA POR LOCALIDAD (Ha)
9,0<br />
8,0<br />
7,0<br />
6,0<br />
5,0<br />
4,0<br />
3,0<br />
2,0<br />
1,0<br />
0,0<br />
8,1<br />
6,0<br />
Cobertura Arbórea rea (%)<br />
Bogotá: 2,47%<br />
5,9<br />
5,5 5,1 4,8<br />
4,1 3,8 3,8 3,7<br />
3,0 2,9<br />
2,4<br />
2,1 2,1 1,9 1,5 1,5 1,3<br />
Santa Fe<br />
Teusaquillo<br />
Suba<br />
Chapinero<br />
Rafael Uribe<br />
Can<strong>del</strong>aria<br />
Tunjuelito<br />
San Cristóbal<br />
Usme<br />
Barrios Unidos<br />
Usaquén<br />
Engativá<br />
Puente Aranda<br />
Kennedy<br />
Antonio Nariño<br />
Fontibón<br />
Bosa<br />
Ciudad Bolívar<br />
Los Mártires<br />
LOCALIDADES<br />
Mapa Cobertura Arbórea por Localidad<br />
COBERTURA POR LOCALIDAD %
Planes<br />
Locales de<br />
Arborización<br />
Urbana
Relación n Calidad Aire<br />
Relación n PM10 Necrosis<br />
Puente Aranda<br />
% de Árboles con Necrosis<br />
80,0 %<br />
70,0 %<br />
60,0 %<br />
50,0 %<br />
40,0 %<br />
30,0 %<br />
20,0 %<br />
10,0 %<br />
0,0 %<br />
73,0 %<br />
60,6 %<br />
49,8 % 52,8 %<br />
84-99 99-115 115-130 130-145<br />
Nivel de PM10 μg/m 3<br />
Calle 6 – Av. Comuneros entre<br />
Av. N.Q.S. y Av. Américas
Estimación n Captura CO2<br />
LOCALIDAD<br />
TOTAL DE<br />
ÁRBOLES<br />
ÁRBOLES<br />
MODELO<br />
ÁREA<br />
(Ha)<br />
Densidad<br />
Árboles<br />
Mo<strong>del</strong>o<br />
Total CO<br />
Total CO2<br />
CO<br />
Capturado<br />
(Ton/Ha)<br />
CO<br />
Capturado<br />
por árbol<br />
(Ton)<br />
Usaquén 81.384 39.572 3.521,66 11,24 5.186,17 19.015,95 1,47 0,1311<br />
Chapinero 30.509 17.665 1.206,91 14,64 2.810,64 10.305,69 2,33 0,1591<br />
Engativá 85.739 48.373 3.588,12 13,48 2.089,20 7.660,00 0,58 0,0432<br />
Teusaquillo 56.684 29.276 1.419,32 20,63 2.019,77 7.405,83 1,42 0,0690<br />
Kennedy 97.203 41.647 3.857,43 10,80 1.742,32 6.388,52 0,45 0,0418<br />
Barrios Unidos 30.825 15.381 1.190,32 12,92 1.242,16 4.554,60 1,04 0,0808<br />
Puente Aranda 34.987 15.304 1.731,12 8,84 713,15 2.614,90 0,41 0,0466<br />
Antonio Nariño 9.106 4.158 487,96 8,52 196,2 719,3 0,40 0,0472<br />
Can<strong>del</strong>aria 3.224 1.801 206,30 8,73 155,09 568,68 0,75 0,0861<br />
Los Mártires 5.695 2.744 651,41 4,21 139,14 510,17 0,21 0,0507<br />
435.356 215.921 17.861 114 16.294 59.744 0,91 0,08<br />
Total 0,8<br />
Fuente: <strong>Censo</strong> <strong>del</strong> Arbolado Urbano. 2007<br />
Promedio 0,1
Captura de CO2<br />
Engativá CO2<br />
Mapa General<br />
Captura CO2
Distribución n <strong>del</strong> Arbolado
300.000<br />
Sistemas Urbanos<br />
260.083<br />
250.000<br />
CANTIDAD DE ARBOLES<br />
200.000<br />
150.000<br />
100.000<br />
50.000<br />
121.311<br />
67.000<br />
46.776<br />
2.325<br />
8<br />
0<br />
52,3% 24,4% 13,5% 9,4%<br />
Sistema<br />
Circulación<br />
Urbana<br />
Sistema<br />
Lúdico<br />
Sistema<br />
Hídrico<br />
SISTEMA URBANO<br />
Sistema de<br />
Protección<br />
0,5%<br />
Franja<br />
Servidumbre<br />
0,0%<br />
Áreas<br />
Degradadas
Emplazamientos<br />
67.000<br />
57.062<br />
46.776<br />
44.441<br />
8.071<br />
6.875<br />
2.747<br />
2.422<br />
2.259<br />
1.860<br />
1.808<br />
1.250<br />
119.509<br />
132.760<br />
140.000<br />
120.000<br />
100.000<br />
80.000<br />
60.000<br />
40.000<br />
20.000<br />
0<br />
8<br />
26,8% 24,2% 13,5% 11,5% 9,5% 9,0%<br />
0,6% 0,49% 0,5% 0,4% 0,4%<br />
1,6% 1,4%<br />
0,25% 0,00%<br />
Andenes<br />
Parques<br />
Rondas<br />
Hídricas<br />
Separadores<br />
Franjas de<br />
Control<br />
Vías<br />
peatonales<br />
Conformación<br />
Espacio<br />
Arbol al lado<br />
de Ciclorrutas<br />
Corredores<br />
Férreos<br />
Glorietas<br />
Orejas de<br />
puente<br />
Alamedas<br />
Plazoletas,<br />
Plazas<br />
Líneas<br />
Conducción<br />
Chircales<br />
EMPLAZAMIENTO<br />
CANTIDAD DE ARBOLES
Distribución n por Uso <strong>del</strong> Suelo<br />
350.000<br />
50<br />
300.000<br />
250.000<br />
200.000<br />
150.000<br />
100.000<br />
50.000<br />
0<br />
306.738<br />
31<br />
29<br />
23<br />
18<br />
Nº Arboles<br />
Ha<br />
19<br />
16<br />
58.537<br />
11<br />
11<br />
37.225 22.461<br />
5.768 23 16<br />
3<br />
45<br />
40<br />
35<br />
30<br />
25<br />
20<br />
15<br />
10<br />
5<br />
0<br />
Residencial<br />
Dotacional<br />
Protección<br />
Comercio<br />
Industrial<br />
Multiple<br />
Actividad<br />
central<br />
Institucional<br />
ARBOLES POR HÉCTAREA<br />
CANTIDAD DE ARBOLES<br />
USOS DEL SUELO
Estado Sanitario
120<br />
146<br />
0,03%0,03%<br />
Pudrición<br />
Sanidad <strong>del</strong> Follaje<br />
Sanidad <strong>del</strong> Follaje<br />
46.202<br />
13.969<br />
11.574<br />
7.525<br />
3.616<br />
2.599<br />
1.021<br />
516<br />
81.872<br />
132.661<br />
Cáncer<br />
131.203<br />
180.000<br />
150.000<br />
120.000<br />
90.000<br />
60.000<br />
30.000<br />
0<br />
30,6% 30,3%18,9% 10,7% 3,2% 2,7%<br />
1,7%<br />
0,8% 0,6%<br />
0,2% 0,1%<br />
Clorosis<br />
Necrosis<br />
Herbivoría<br />
Puntos de<br />
Succión<br />
Marchitamiento<br />
Antracnosis<br />
Agallas<br />
Mildeos<br />
Royas<br />
Carbones<br />
Tumores<br />
SINTOMAS Y SIGNOS<br />
CANTIDAD DE ARBOLES
Sanidad <strong>del</strong> Tronco<br />
Sanidad <strong>del</strong> Tronco<br />
9.000<br />
8.000<br />
7.000<br />
6.000<br />
7.803<br />
7.252<br />
6.578<br />
5.000<br />
4.000<br />
3.000<br />
2.000<br />
3.959<br />
3.263<br />
1.493<br />
1.000<br />
0<br />
25,7% 23,9% 21,7% 13,0% 10,8% 4,9%<br />
Pudriciones<br />
Tumores<br />
Gomosis<br />
Agallas<br />
Insectos<br />
barrenadores<br />
Chancros<br />
SINTOMAS Y SIGNOS<br />
CANTIDAD DE ARBOLES
Valoración n Integrada <strong>del</strong><br />
Estado Fitosanitario Localidades<br />
LOCALIDAD<br />
DESCRIPCIÓN<br />
Bueno Regular Deficiente Malo Crítico Total<br />
Antonio Nariño 2.612 3.730 1.730 550 484 9.106<br />
Barrios Unidos 12.437 9.366 4.583 2.070 2.369 30.825<br />
Can<strong>del</strong>aria 646 925 840 391 422 3.224<br />
Engativá 54.756 535 11.281 4.330 3.797 74.699<br />
Kennedy 52.989 2.959 12.641 5.104 6.440 80.133<br />
Los Mártires 1.442 2.152 1.085 465 551 5.695<br />
Teusaquillo 10.579 19.780 13.126 5.672 7.527 56.684<br />
Usaquén 15.872 23.190 16.024 9.323 15.863 80.272<br />
Puente Aranda 5.423 15.143 5.679 2.065 2.299 30.609<br />
Fontibón 7.925 16.944 6.750 3.590 2.926 38.135<br />
Bosa 2.711 8.967 1.996 573 568 14.815<br />
Total 167.392 103.691 75.735 34.133 43.246 424.197<br />
% 39% 24% 18% 8% 10% 100%<br />
El 18%, 1<br />
77.379 árboles, se encuentran en estado fitosanitario<br />
entre malo y crítico.
Valoración n Integrada <strong>del</strong><br />
Estado Fitosanitario<br />
160.000<br />
167.392<br />
No. Árboles<br />
120.000<br />
80.000<br />
103.691<br />
75.735<br />
40.000<br />
34.133<br />
43.246<br />
0<br />
39% 24% 18% 8% 10%<br />
Bueno Regular Deficiente Malo Crítico<br />
Estado Sanitario
Estado Fitosanitario<br />
(Puente Aranda)<br />
Corredor Río R Fucha<br />
Zona Industrial
RIESGO
SUSCEPTIBILIDAD<br />
Árboles con Susceptibilidad al<br />
Volcamiento - Localidades<br />
BAJA MEDIA ALTA<br />
Los árboles clasificados en este<br />
rango presentan susceptibiladad al<br />
volcamiento, sin embargo por sus<br />
características de estabilidad,<br />
permiten una holgura de tiempo<br />
para su atención y mitigación.<br />
Los árboles que componen este<br />
grupo demandan con prontitud<br />
una atención para la correción de<br />
su condición de susceptibilidad al<br />
volcamiento.<br />
Los áboles que se encuentran<br />
dentro de este grupo, presentan<br />
un alto grado de susceptibilidad al<br />
volcamiento manifestándose en<br />
alarma roja para ser atendidos de<br />
manera inmediata.<br />
Antonio Nariño 20 5 5 30 0,33%<br />
Barrios Unidos 129 57 33 219 0,71%<br />
Can<strong>del</strong>aria 11 4 7 22 0,68%<br />
Los Mártires 3 1 0 4 0,07%<br />
Teusaquillo 227 81 37 345 0,61%<br />
Usaquén 170 196 140 506 0,62%<br />
Chapinero 117 91 53 261 0,86%<br />
Kennedy 209 144 47 400 0,41%<br />
Engativá 192 84 48 324 0,38%<br />
Puente Aranda 80 25 9 114 0,33%<br />
Fontibón 182 67 23 272 0,62%<br />
Bosa 42 17 4 63 0,33%<br />
Total 1.382 772 406<br />
% 54% 30% 16%<br />
2.560 árboles representan el 0,52% <strong>del</strong> total de árboles de las<br />
Localidades<br />
Total<br />
PROPORCIÓN<br />
DE ÁRBOLES<br />
SUSCEPTIBLES<br />
2.560 0,52%
Susceptibilidad al Volcamiento<br />
Barrios Unidos<br />
Árboles con Especies Susceptibilidad Baja<br />
Árboles con Especies Susceptibilidad Media<br />
Árboles con Especies Susceptibilidad Alta<br />
Árboles con Susceptibilidad Baja<br />
Árboles con Susceptibilidad Media<br />
Árboles con Susceptibilidad Alta
Árboles en Riesgo<br />
VULNERABILIDAD<br />
EMPLAZAMIENTO O<br />
INFRAESTRUCTURA<br />
PARQUES Y<br />
ELEMENTOS<br />
ASOCIADOS AL<br />
SISTEMA LÚDICO<br />
INSTITUCIONES<br />
EDUCATIVAS E<br />
INFRAESTRUCTURA<br />
DEL SISTEMA DE<br />
SALUD<br />
CORREDORES<br />
VIALES Y ANDENES<br />
Localidad<br />
RIESGO<br />
BAJA MEDIA ALTA BAJA MEDIA ALTA BAJA MEDIA ALTA<br />
Antonio Nariño 1 0 0 0 0 0 0 0 0<br />
Barrios Unidos 65 46 45 0 1 1 0 0 1<br />
Can<strong>del</strong>aria 0 0 0 0 0 3 0 0<br />
Engativá 13 16 1 2 1 0 10 2 1<br />
Kennedy 16 3 2 1 4 0 24 6 2<br />
Los Mártires 0 0 0 0 0 0 1 0 0<br />
Teusaquillo 15 18 10 1 0 1 22 8 3<br />
Usaquén 6 6 11 2 0 2 8 21 27<br />
Puente aranda 8 3 0 1 11 7 1<br />
Fontibón 5 6 0 7 0 2<br />
Total 116 98 69 6 6 5 86 44 37
Árboles en Riesgo<br />
240<br />
208<br />
200<br />
160<br />
148<br />
No. Árboles<br />
120<br />
80<br />
40<br />
44,5%<br />
31,7%<br />
111<br />
23,8%<br />
0<br />
Bajo Medio Alto<br />
Riesgo<br />
467 árboles que representan el<br />
0,09%
Riesgo de Volcamiento<br />
Barrios Unidos<br />
Kennedy
Corredores
www.jbb.gov.co