El comercio de la Argentina con Corea - Centro de EconomÃa ...
El comercio de la Argentina con Corea - Centro de EconomÃa ...
El comercio de la Argentina con Corea - Centro de EconomÃa ...

You also want an ePaper? Increase the reach of your titles
YUMPU automatically turns print PDFs into web optimized ePapers that Google loves.
<strong>El</strong> <strong>comercio</strong> <strong>de</strong> <strong>la</strong> <strong>Argentina</strong> <strong>con</strong> <strong>Corea</strong><br />
Agosto 2009<br />
1. Año 2008<br />
2. La visión <strong>de</strong> <strong>la</strong>rgo p<strong>la</strong>zo<br />
3. Sectores <strong>con</strong> mayor potencialidad <strong>de</strong> <strong>comercio</strong><br />
4. Comercio exterior y barreras comerciales <strong>de</strong> <strong>Corea</strong><br />
5. Evolución <strong>de</strong>l PIB <strong>de</strong> <strong>Corea</strong><br />
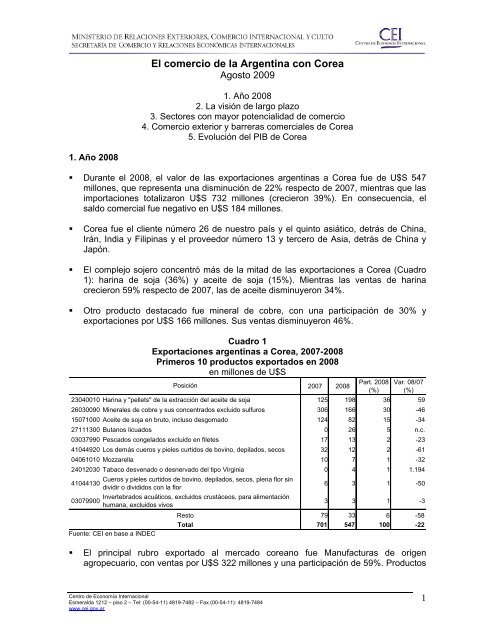
1. Año 2008<br />
• Durante el 2008, el valor <strong>de</strong> <strong>la</strong>s exportaciones argentinas a <strong>Corea</strong> fue <strong>de</strong> U$S 547<br />
millones, que representa una disminución <strong>de</strong> 22% respecto <strong>de</strong> 2007, mientras que <strong>la</strong>s<br />
importaciones totalizaron U$S 732 millones (crecieron 39%). En <strong>con</strong>secuencia, el<br />
saldo comercial fue negativo en U$S 184 millones.<br />
• <strong>Corea</strong> fue el cliente número 26 <strong>de</strong> nuestro país y el quinto asiático, <strong>de</strong>trás <strong>de</strong> China,<br />
Irán, India y Filipinas y el proveedor número 13 y tercero <strong>de</strong> Asia, <strong>de</strong>trás <strong>de</strong> China y<br />
Japón.<br />
• <strong>El</strong> complejo sojero <strong>con</strong>centró más <strong>de</strong> <strong>la</strong> mitad <strong>de</strong> <strong>la</strong>s exportaciones a <strong>Corea</strong> (Cuadro<br />
1): harina <strong>de</strong> soja (36%) y aceite <strong>de</strong> soja (15%). Mientras <strong>la</strong>s ventas <strong>de</strong> harina<br />
crecieron 59% respecto <strong>de</strong> 2007, <strong>la</strong>s <strong>de</strong> aceite disminuyeron 34%.<br />
• Otro producto <strong>de</strong>stacado fue mineral <strong>de</strong> cobre, <strong>con</strong> una participación <strong>de</strong> 30% y<br />
exportaciones por U$S 166 millones. Sus ventas disminuyeron 46%.<br />
Cuadro 1<br />
Exportaciones argentinas a <strong>Corea</strong>, 2007-2008<br />
Primeros 10 productos exportados en 2008<br />
en millones <strong>de</strong> U$S<br />
2007 2008<br />
Part. 2008<br />
(%)<br />
Var. 08/07<br />
(%)<br />
23040010 Harina y "pellets" <strong>de</strong> <strong>la</strong> extracción <strong>de</strong>l aceite <strong>de</strong> soja 125 198 36 59<br />
26030090 Minerales <strong>de</strong> cobre y sus <strong>con</strong>centrados excluido sulfuros 306 166 30 -46<br />
15071000 Aceite <strong>de</strong> soja en bruto, incluso <strong>de</strong>sgomado 124 82 15 -34<br />
27111300 Butanos licuados 0 26 5 n.c.<br />
03037990 Pescados <strong>con</strong>ge<strong>la</strong>dos excluido en filetes 17 13 2 -23<br />
41044920 Los <strong>de</strong>más cueros y pieles curtidos <strong>de</strong> bovino, <strong>de</strong>pi<strong>la</strong>dos, secos 32 12 2 -61<br />
04061010 Mozzarel<strong>la</strong> 10 7 1 -32<br />
24012030 Tabaco <strong>de</strong>svenado o <strong>de</strong>snervado <strong>de</strong>l tipo Virginia 0 4 1 1.194<br />
41044130<br />
03079900<br />
Cueros y pieles curtidos <strong>de</strong> bovino, <strong>de</strong>pi<strong>la</strong>dos, secos, plena flor sin<br />
dividir o divididos <strong>con</strong> <strong>la</strong> flor<br />
Invertebrados acuáticos, excluidos crustáceos, para alimentación<br />
humana, excluidos vivos<br />
Fuente: CEI en base a INDEC<br />
Posición<br />
Resto<br />
Total<br />
6 3 1 -50<br />
3 3 1 -3<br />
79 33 6 -58<br />
701 547 100 -22<br />
• <strong>El</strong> principal rubro exportado al mercado coreano fue Manufacturas <strong>de</strong> origen<br />
agropecuario, <strong>con</strong> ventas por U$S 322 millones y una participación <strong>de</strong> 59%. Productos<br />
<strong>Centro</strong> <strong>de</strong> E<strong>con</strong>omía Internacional<br />
Esmeralda 1212 – piso 2 – Tel: (00-54-11) 4819-7482 – Fax (00-54-11): 4819-7484<br />
www.cei.gov.ar<br />
1
primarios <strong>con</strong> ventas por U$S 186 millones y una participación <strong>de</strong> 34%, le siguió en<br />
importancia aunque sus exportaciones disminuyeron 49%.<br />
• <strong>El</strong> 7% restante se repartió entre Combustibles (5% y ventas por U$S 26 millones) y<br />
Manufacturas <strong>de</strong> origen industrial (2% y U$S 13 millones). Mientras en 2007 no se<br />
registraron exportaciones <strong>de</strong> Combustibles, <strong>la</strong>s ventas <strong>de</strong> MOI disminuyeron 51%.<br />
• Como se observa en el Cuadro 2, los principales productos importados por <strong>la</strong><br />
<strong>Argentina</strong> <strong>de</strong>s<strong>de</strong> <strong>Corea</strong> correspondieron a Material <strong>de</strong> transporte –principalmente<br />
Vehículos automóviles– (26% <strong>de</strong> <strong>la</strong>s importaciones) y a Máquinas y aparatos<br />
eléctricos (21%) y mecánicos (20%) –entre los eléctricos se <strong>de</strong>stacan teléfonos<br />
celu<strong>la</strong>res, y entre los mecánicos sobresalen partes <strong>de</strong> cal<strong>de</strong>ras.–<br />
• Estos rubros incrementaron sus niveles <strong>de</strong> compra: Material <strong>de</strong> transporte 181%,<br />
Máquinas y aparatos eléctricos 42% y mecánicos 24%.<br />
Cuadro 2<br />
Importaciones argentinas <strong>de</strong>s<strong>de</strong> <strong>Corea</strong>, 2007-2008<br />
Primeros 10 productos importados en 2008<br />
en millones <strong>de</strong> U$S<br />
2007 2008<br />
Part. 2008<br />
(%)<br />
Var. 08/07<br />
(%)<br />
Vehículos diesel o semidiesel para transporte a 1500cm3 y
totales. En 2008, se redujo el valor exportado al mismo tiempo que <strong>la</strong> participación se<br />
ubicó en 0,8%).<br />
Gráfico 1<br />
Comercio <strong>de</strong> <strong>la</strong> <strong>Argentina</strong> <strong>con</strong> <strong>Corea</strong><br />
en millones <strong>de</strong> U$S<br />
900<br />
732<br />
600<br />
547<br />
300<br />
0<br />
-300<br />
-600<br />
1980 1984 1988 1992 1996 2000 2004 2008<br />
Saldo Exportaciones Importaciones<br />
Fuente: CEI en base a INDEC<br />
• Asimismo, a partir <strong>de</strong> 1991 se observó un mayor dinamismo <strong>de</strong> <strong>la</strong>s importaciones<br />
<strong>de</strong>s<strong>de</strong> <strong>Corea</strong>, que promediaron U$S 43 millones en <strong>la</strong> década <strong>de</strong>l ochenta, hasta<br />
alcanzar en 2008 una participación <strong>de</strong> 1,3%. Sin embargo, <strong>la</strong> participación coreana en<br />
<strong>la</strong>s importaciones argentinas totales aún se mantiene por <strong>de</strong>bajo <strong>de</strong>l 3,8% observado<br />
en 1992 (Gráfico 2).<br />
<strong>Centro</strong> <strong>de</strong> E<strong>con</strong>omía Internacional<br />
Esmeralda 1212 – piso 2 – Tel: (00-54-11) 4819-7482 – Fax (00-54-11): 4819-7484<br />
www.cei.gov.ar<br />
3
Gráfico 2<br />
Participación <strong>de</strong> <strong>Corea</strong> en el <strong>comercio</strong> exterior argentino<br />
en %<br />
4<br />
3<br />
2<br />
1<br />
0<br />
1980 1984 1988 1992 1996 2000 2004 2008<br />
Exportaciones<br />
Importaciones<br />
Fuente: CEI en base a INDEC<br />
2.2. Comercio sectorial<br />
• En el último trienio, <strong>la</strong>s exportaciones argentinas a <strong>Corea</strong> se <strong>con</strong>centraron en<br />
Productos minerales –principalmente mineral <strong>de</strong> cobre– <strong>con</strong> ventas por U$S 217<br />
millones y <strong>con</strong> una participación <strong>de</strong> 40 % en el total exportado a dicho mercado<br />
(Gráfico 3).<br />
• Dicho rubro registró un importante crecimiento en su participación (participaba <strong>con</strong> el<br />
11% en el promedio <strong>de</strong> 1996-1998), en <strong>de</strong>trimento <strong>de</strong> <strong>la</strong> participación <strong>de</strong> Productos <strong>de</strong>l<br />
reino vegetal (disminuyó <strong>de</strong> 41% a 2% en los últimos diez años) y Animales vivos y<br />
productos <strong>de</strong>l reino animal (<strong>de</strong> 17% a 6%).<br />
<strong>Centro</strong> <strong>de</strong> E<strong>con</strong>omía Internacional<br />
Esmeralda 1212 – piso 2 – Tel: (00-54-11) 4819-7482 – Fax (00-54-11): 4819-7484<br />
www.cei.gov.ar<br />
4
Gráfico 3<br />
Composición sectorial <strong>de</strong> <strong>la</strong>s exportaciones argentinas a <strong>Corea</strong><br />
Animales<br />
vivos y prod.<br />
<strong>de</strong>l reino<br />
animal<br />
17%<br />
Prod. <strong>de</strong>l reino<br />
vegetal<br />
41%<br />
Promedio 1996-1998<br />
Total: U$S 179 millones<br />
Alimentos,<br />
bebidas y<br />
tabaco<br />
13%<br />
Resto<br />
2%<br />
Prod.<br />
minerales<br />
11%<br />
Metales<br />
8%<br />
Prod. químicos<br />
4%<br />
Pieles y<br />
cueros<br />
2%<br />
Textiles<br />
1%<br />
Ma<strong>de</strong>ra y<br />
carbón<br />
1%<br />
Alimentos,<br />
bebidas y<br />
tabaco<br />
26%<br />
Prod. minerales<br />
40%<br />
Promedio 2006-2008<br />
Total: U$S 559 millones<br />
Aceites<br />
18%<br />
Resto<br />
2%<br />
Animales vivos<br />
y prod. <strong>de</strong>l<br />
reino animal<br />
6%<br />
Pieles y cueros<br />
5%<br />
Prod. <strong>de</strong>l reino<br />
vegetal<br />
2%<br />
Metales<br />
1%<br />
Fuente: CEI en base a INDEC<br />
• Por su parte, como muestra el Gráfico 4, el 44% <strong>de</strong> <strong>la</strong>s compras <strong>de</strong> <strong>la</strong> <strong>Argentina</strong> a<br />
<strong>Corea</strong> en el promedio 2006-2008 se <strong>con</strong>centraron en Máquinas y aparatos –partes<br />
para aparatos receptores <strong>de</strong> radiotelefonía, tubos catódicos para televisores y<br />
teléfonos celu<strong>la</strong>res– que redujo su participación en 13 puntos porcentuales (el 57% <strong>de</strong><br />
<strong>la</strong>s compras a <strong>Corea</strong> en el promedio 1996-1998 correspondían a este rubro). En<br />
términos absolutos, <strong>la</strong>s importaciones <strong>de</strong> este rubro disminuyeron <strong>de</strong> U$S 333<br />
millones a U$S 245 millones en igual período. Dicha reducción se produjo a partir <strong>de</strong><br />
<strong>la</strong> mayor participación <strong>de</strong> Plástico y caucho (aumentó <strong>de</strong> 7% a 16%) y Material <strong>de</strong><br />
tranporte (<strong>de</strong> 14% a 17%).<br />
• Material <strong>de</strong> transporte –vehículos automóviles diesel o semidiesel– <strong>con</strong> importaciones<br />
por U$S 97 millones y una participación <strong>de</strong> 17% en <strong>la</strong>s compras a <strong>Corea</strong> <strong>de</strong>l último<br />
trienio, fue el segundo rubro en importancia.<br />
Gráfico 4<br />
Composición sectorial <strong>de</strong> <strong>la</strong>s importaciones argentinas <strong>de</strong>s<strong>de</strong> <strong>Corea</strong><br />
Máquinas y<br />
aparatos<br />
57%<br />
Promedio 1996-1998<br />
Total: U$S 573 millones<br />
Material <strong>de</strong><br />
transporte<br />
14%<br />
Textiles<br />
12%<br />
Plástico y<br />
caucho<br />
7%<br />
Metales<br />
2%<br />
Prod. químicos<br />
2%<br />
Máquinas y<br />
aparatos<br />
44%<br />
Material <strong>de</strong><br />
transporte<br />
17%<br />
Promedio 2006-2008<br />
Total: U$S 566 millones<br />
Plástico y<br />
caucho<br />
16%<br />
Textiles<br />
9%<br />
Prod. químicos<br />
6%<br />
Metales<br />
4%<br />
Resto<br />
4%<br />
Inst. <strong>de</strong> óptica<br />
2%<br />
Resto<br />
2%<br />
Inst. <strong>de</strong> óptica<br />
2%<br />
Fuente: CEI en base a INDEC<br />
<strong>Centro</strong> <strong>de</strong> E<strong>con</strong>omía Internacional<br />
Esmeralda 1212 – piso 2 – Tel: (00-54-11) 4819-7482 – Fax (00-54-11): 4819-7484<br />
www.cei.gov.ar<br />
5
3. Sectores <strong>con</strong> mayor potencialidad <strong>de</strong> <strong>comercio</strong><br />
3.1. Oportunida<strong>de</strong>s para <strong>la</strong> <strong>Argentina</strong><br />
• Los sectores <strong>con</strong> mayor complementariedad comercial son aquellos que combinan <strong>la</strong><br />
especialización exportadora <strong>de</strong> <strong>la</strong> <strong>Argentina</strong> <strong>con</strong> el patrón <strong>de</strong> importaciones <strong>de</strong> <strong>la</strong><br />
e<strong>con</strong>omía coreana.<br />
• <strong>El</strong> Cuadro 3 muestra el caso <strong>de</strong> productos que actualmente se ven<strong>de</strong>n a <strong>Corea</strong>,<br />
mientras que el Cuadro 4 <strong>con</strong>temp<strong>la</strong> productos <strong>con</strong> potencialidad <strong>de</strong> <strong>comercio</strong> pero<br />
que actualmente no se exportan a dicho país.<br />
• Los productos para los cuales <strong>la</strong> <strong>Argentina</strong> presenta oportunida<strong>de</strong>s para expandir sus<br />
ventas, representan un mercado <strong>de</strong> importaciones totales <strong>de</strong> <strong>Corea</strong> <strong>de</strong> U$S 13.356<br />
millones (el 84% correspon<strong>de</strong> a los primeros veinte productos), <strong>con</strong> una participación<br />
argentina promedio entre 2003 y 2007 <strong>de</strong> 3,3%.<br />
• Los productos <strong>de</strong>l complejo sojero registran <strong>la</strong> mayor participación <strong>de</strong> <strong>la</strong> <strong>Argentina</strong> en<br />
<strong>la</strong>s compras coreanas: aceite 79,8% y harina 20,7%. Ambos productos ingresan <strong>con</strong><br />
un arancel inferior a 10% (5,4% aceite y 1,8% harina).<br />
• Los productos <strong>con</strong> mayores oportunida<strong>de</strong>s que enfrentan un arancel alto para<br />
ingresar a <strong>Corea</strong> son pescados <strong>con</strong>ge<strong>la</strong>dos, maíz y porotos <strong>de</strong> soja. Estos últimos, a<br />
pesar <strong>de</strong> tener que pagar un elevado arancel (428% y 487%, respectivamente),<br />
pue<strong>de</strong>n ingresar por una cuota <strong>con</strong> un arancel <strong>de</strong> 1,8% y 5%, respectivamente.<br />
<strong>Centro</strong> <strong>de</strong> E<strong>con</strong>omía Internacional<br />
Esmeralda 1212 – piso 2 – Tel: (00-54-11) 4819-7482 – Fax (00-54-11): 4819-7484<br />
www.cei.gov.ar<br />
6
Cuadro 3<br />
Sectores <strong>con</strong> oportunida<strong>de</strong>s a expandir por <strong>la</strong> <strong>Argentina</strong><br />
Complementariedad <strong>de</strong> <strong>la</strong>s exportaciones argentinas <strong>con</strong> <strong>la</strong>s importaciones <strong>de</strong> <strong>Corea</strong><br />
Subpartidas <strong>con</strong> mayor valor <strong>de</strong> importaciones coreanas <strong>de</strong>s<strong>de</strong> el mundo<br />
Subpartida<br />
Des<strong>de</strong> el<br />
Mundo<br />
Des<strong>de</strong> <strong>la</strong><br />
<strong>Argentina</strong><br />
Particip. Arg<br />
en %<br />
260300 Minerales <strong>de</strong> cobre y sus <strong>con</strong>centrados 2.080.487 135.419 6,5 0,0<br />
382490<br />
Productos químicos y preparaciones <strong>de</strong> <strong>la</strong> industria química o <strong>de</strong> <strong>la</strong>s industrias<br />
<strong>con</strong>exas<br />
1.361.949 1 0,1 6,4<br />
100590 Maíz, excluido para siembra 1.355.085 24.804 1,8 428,7<br />
271112 Propano 1.227.050 3.272 0,3 3,0<br />
271113 Butanos licuados 860.410 576 0,1 3,0<br />
030379 Pescados <strong>con</strong>ge<strong>la</strong>dos 641.750 12.804 2,0 10,0<br />
760120 Aleaciones <strong>de</strong> aluminio 537.364 9.857 1,8 1,7<br />
290511 Metanol - alcohol metílico - 417.913 4 0,0 2,0<br />
120100 Porotos <strong>de</strong> soja 401.399 1.063 0,3 487 (2)<br />
230400 Tortas y otros residuos sólidos <strong>de</strong> <strong>la</strong> extracción <strong>de</strong>l aceite <strong>de</strong> soja 400.563 82.990 20,7 1,8<br />
170111 Azúcar <strong>de</strong> caña, en bruto 394.870 1.757 0,4 3,0<br />
841480 Compresores <strong>de</strong> aire y <strong>de</strong> gases 370.323 598 0,2 8,0<br />
390810 Poliamidas 244.812 669 0,3 6,5<br />
730410 Tubos sin costura, <strong>de</strong> hierro o acero, utilizados oleoductos o gasoductos 156.769 8.016 5,1 0,0<br />
150710 Aceite <strong>de</strong> soja en bruto, incluido <strong>de</strong>sgomado 141.710 113.052 79,8 5,4<br />
030613 Camarones, <strong>la</strong>ngostinos y simi<strong>la</strong>res <strong>con</strong>ge<strong>la</strong>dos 137.425 153 0,1 20,0<br />
030490 Carnes <strong>de</strong> pescado <strong>con</strong>ge<strong>la</strong>das 133.265 1.059 0,8 10,0<br />
510529 Lana peinada 123.865 596 0,5 0,0<br />
847982 Las <strong>de</strong>más máquinas y aparatos para mezc<strong>la</strong>r, amasar o sobar 119.629 79 0,1 8,0<br />
730439 Los <strong>de</strong>más tubos y perfiles huevos, <strong>de</strong> sección circu<strong>la</strong>r, <strong>de</strong> hierro o acero sin alear 113.689 2.544 2,2 0,0<br />
Suma primeros 20 11.220.327 399.313 3,6 27,2<br />
Resto 2.136.327 36.464 1,7<br />
Total 13.356.654 435.776 3,3<br />
Nota: La complementariedad muestra <strong>la</strong>s subpartidas don<strong>de</strong> <strong>la</strong> <strong>Argentina</strong> reve<strong>la</strong> especialización exportadora y <strong>Corea</strong> especialización importadora.<br />
(1) Arancel aplicado, promedio 2008, fuente OMC.<br />
(2) Si el AVE representa menos <strong>de</strong> 956 won por kilo, se pasa a cobrar este último.<br />
Fuente: CEI en base a COMTRADE<br />
Descripción<br />
Importaciones <strong>de</strong> <strong>Corea</strong><br />
Prom. 2003-2007 en miles <strong>de</strong> U$S<br />
Arancel<br />
<strong>Corea</strong> (1)<br />
• Las ventas <strong>de</strong> los productos para los cuales <strong>la</strong> <strong>Argentina</strong> presenta oportunida<strong>de</strong>s aún<br />
no aprovechadas, ya que sus productos no ingresan actualmente al mercado<br />
coreano, representan un mercado <strong>de</strong> importaciones totales <strong>de</strong> <strong>Corea</strong> por U$S 27.483<br />
millones (Cuadro 4).<br />
• Entre los productos <strong>con</strong> oportunida<strong>de</strong>s no aprovechadas, sobresalen aceites <strong>de</strong><br />
petróleo livianos, oro en bruto y productos <strong>de</strong> fundición <strong>de</strong> hierro y acero. Estos<br />
productos enfrentan bajos aranceles al ingreso ya que ninguno llega a 10%. Los<br />
aranceles más altos se observan en carne bovina (40%).<br />
<strong>Centro</strong> <strong>de</strong> E<strong>con</strong>omía Internacional<br />
Esmeralda 1212 – piso 2 – Tel: (00-54-11) 4819-7482 – Fax (00-54-11): 4819-7484<br />
www.cei.gov.ar<br />
7
Cuadro 4<br />
Sectores <strong>con</strong> oportunida<strong>de</strong>s aún no aprovechadas por <strong>la</strong> <strong>Argentina</strong><br />
Complementariedad <strong>de</strong> <strong>la</strong>s exportaciones argentinas <strong>con</strong> <strong>la</strong>s importaciones <strong>de</strong> <strong>Corea</strong><br />
Subpartidas <strong>con</strong> mayor valor <strong>de</strong> importaciones coreanas sin participación <strong>de</strong> <strong>la</strong> <strong>Argentina</strong><br />
Subpartida<br />
271011 Aceites livianos (ligeros) <strong>de</strong> petróleo y preparaciones 7.208.356 3,3<br />
760110 Aluminio sin alear 1.974.914 1,0<br />
710812 Oro no monetario en bruto 1.598.658 3,0<br />
720712<br />
Productos intermedios <strong>de</strong> hierro o acero sin alear, <strong>con</strong> <strong>con</strong>tenido <strong>de</strong> carbono inferior al 0,25%<br />
en peso<br />
1.349.981 0,0<br />
720839 Productos p<strong>la</strong>nos <strong>de</strong> hierro o acero <strong>la</strong>minados en caliente, <strong>de</strong> espesor inferior a 3 mm 1.123.009 0,0<br />
720838 Productos p<strong>la</strong>nos <strong>de</strong> hierro o acero <strong>la</strong>minados en caliente, <strong>de</strong> espesor superior o igual a 3 mm 1.096.124 0,0<br />
870840 Cajas <strong>de</strong> cambio 810.757 8,0<br />
270730 Xiloles 739.759 3,0<br />
100190 Trigo excluido duro y morcajo o tranquillón 684.131 1,7<br />
290243 Hidrocarburo cíclico (p-Xileno) 642.373 3,0<br />
903289<br />
Intrumentos y aparatos para regu<strong>la</strong>ción o <strong>con</strong>trol automáticos, excluidos termostatos y<br />
manóstatos<br />
489.275 6,5<br />
270799 Aceites y productos <strong>de</strong> <strong>de</strong>sti<strong>la</strong>ción <strong>de</strong> los alquitranes <strong>de</strong> hul<strong>la</strong> 413.774 5,8<br />
721391 A<strong>la</strong>mbrón <strong>de</strong> hierro o acero sin alear, <strong>de</strong> sección circu<strong>la</strong>r <strong>con</strong> diámetro inferior a 14 mm 406.709 0,0<br />
020230 Carne bovina, <strong>de</strong>shuesada, <strong>con</strong>ge<strong>la</strong>da 394.531 40,0<br />
841330<br />
Bombas <strong>de</strong> carburante, <strong>de</strong> aceite o <strong>de</strong> refrigerante para motores <strong>de</strong> encendido por chispa o<br />
compresión<br />
382.467 8,0<br />
470321 Pasta química <strong>de</strong> ma<strong>de</strong>ra <strong>de</strong> <strong>con</strong>ífera 322.687 0,0<br />
720837<br />
Productos p<strong>la</strong>nos <strong>de</strong> hierro o acero sin alear, <strong>la</strong>minados en caliente, <strong>de</strong> ancho >= a 600 mm<br />
sin chapar ni revestir, <strong>de</strong> espesor >= a 4,75 mm pero < a 10 mm<br />
320.465 0,0<br />
260700 Minerales <strong>de</strong> plomo y sus <strong>con</strong>centrados 317.555 0,0<br />
281410 Amoníaco anhidro 308.269 1,0<br />
841989 Apartos y dispositivos que tratan materias y cambian <strong>la</strong> temperatura 291.127 8,0<br />
Suma primeros 20 20.874.920 4,6<br />
Resto 6.608.852<br />
Total 27.483.772<br />
Nota: La complementariedad muestra <strong>la</strong>s subpartidas don<strong>de</strong> <strong>la</strong> <strong>Argentina</strong> reve<strong>la</strong> especialización exportadora y <strong>Corea</strong> especialización importadora.<br />
(1) Arancel aplicado 2008, fuente OMC.<br />
Fuente: CEI en base a COMTRADE<br />
Descripción<br />
Importaciones <strong>de</strong> <strong>Corea</strong><br />
Prom.2003-2007 en miles <strong>de</strong> U$S<br />
Arancel<br />
<strong>Corea</strong> (1)<br />
3.2. Oportunida<strong>de</strong>s para <strong>Corea</strong><br />
• Los Cuadros 5 y 6 muestran productos en los cuales <strong>Corea</strong> tiene complementariedad<br />
comercial <strong>con</strong> <strong>la</strong> <strong>Argentina</strong>, or<strong>de</strong>nados <strong>de</strong> acuerdo al valor <strong>de</strong> <strong>la</strong>s importaciones <strong>de</strong> <strong>la</strong><br />
<strong>Argentina</strong>.<br />
• Los productos para los cuales <strong>Corea</strong> presenta oportunida<strong>de</strong>s para expandir sus ventas<br />
a <strong>la</strong> <strong>Argentina</strong> representan un mercado <strong>de</strong> importaciones argentinas totales por U$S<br />
14.530 millones para el promedio <strong>de</strong>l período 2004-2008, <strong>de</strong> los cuales el 55%<br />
correspon<strong>de</strong> a los primeros veinte productos.<br />
• Como pue<strong>de</strong> observarse, a excepción <strong>de</strong> aceites <strong>de</strong> petróleo o <strong>de</strong> mineral bituminoso,<br />
todos los productos correspon<strong>de</strong>n a manufacturas industriales, <strong>de</strong>stacándose <strong>la</strong><br />
presencia <strong>de</strong> Vehículos automóviles y sus partes, Máquinas y aparatos, mecánicos y<br />
eléctricos, Productos químicos y Plásticos (Cuadro 5).<br />
• Los vehículos automóviles y los volquetes son los que pagan los aranceles más altos<br />
para ingresar a <strong>la</strong> <strong>Argentina</strong> (35%).<br />
<strong>Centro</strong> <strong>de</strong> E<strong>con</strong>omía Internacional<br />
Esmeralda 1212 – piso 2 – Tel: (00-54-11) 4819-7482 – Fax (00-54-11): 4819-7484<br />
www.cei.gov.ar<br />
8
Cuadro 5<br />
Sectores <strong>con</strong> oportunida<strong>de</strong>s a expandir por <strong>Corea</strong><br />
Complementariedad <strong>de</strong> <strong>la</strong>s exportaciones coreanas<br />
<strong>con</strong> <strong>la</strong>s importaciones <strong>de</strong> <strong>la</strong> <strong>Argentina</strong><br />
Veinte subpartidas <strong>con</strong> mayor valor <strong>de</strong> importaciones argentinas <strong>de</strong>s<strong>de</strong> el mundo<br />
Subpartida<br />
Des<strong>de</strong> el<br />
Mundo<br />
Des<strong>de</strong> <strong>Corea</strong><br />
Particip. <strong>Corea</strong><br />
en %<br />
870323 Vehículos <strong>de</strong> cilindrada mayor a 1500 cm3 pero menor o igual a 3000 cm3 1.439.437 11.233 0,8 35,0<br />
852520 Aparatos emisores <strong>con</strong> un aparato receptor incorporado 1.262.657 20.720 1,6 3,0<br />
271019 Aceites <strong>de</strong> petróleo o <strong>de</strong> mineral bituminoso 1.214.327 825 0,1 0,8<br />
293100 Compuestos órgano-inorgánicos 462.336 86 0,0 9,3<br />
870899 Partes y accesorios <strong>de</strong> vehículos automóviles 431.331 559 0,1 18,0<br />
870421 Volquetes <strong>con</strong> carga menor o igual a 5 t 345.005 9.270 2,7 35,0<br />
870322 Vehículos <strong>de</strong> cilindrada mayor a 1000 cm3 pero menor a 1500 cm3 302.328 896 0,3 35,0<br />
870332 Vehículos, <strong>con</strong> motor <strong>de</strong> émbolo, <strong>de</strong> cilindrada entre 1500 y 2500 cm3 274.968 25.575 9,3 35,0<br />
847330 Partes y accesorios <strong>de</strong> máquinas para procesamiento <strong>de</strong> datos 243.219 3.156 1,3 6,2<br />
847160 Unida<strong>de</strong>s <strong>de</strong> entrada o salida para procesamiento <strong>de</strong> datos 235.725 1.606 0,7 14,4<br />
871120 Motocicletas <strong>con</strong> motor <strong>de</strong> émbolo o pistón alternativo 201.691 63 0,0 20,0<br />
852990 Partes <strong>de</strong> equipos electrónicos 199.709 17.914 9,0 6,4<br />
390110 Polietileno <strong>de</strong> <strong>de</strong>nsidad inferior a 0,94 198.926 1.021 0,5 14,0<br />
310530 Fosfato diamónico 189.787 2.482 1,3 3,0<br />
870850 Ejes <strong>con</strong> diferencial, incluso <strong>con</strong> otros órganos <strong>de</strong> transmisión 165.171 46 0,0 14,3<br />
291736 Acido tereftálico y sus sales 163.346 3.319 2,0 2,0<br />
840999 Partes <strong>de</strong> motores <strong>de</strong> encendio por chispa o compresión 162.906 676 0,4 16,0<br />
841430 Compresores utilizados en los equipos frigoríficos 148.521 748 0,5 12,8<br />
401120 Neumáticos utilizados en autobuses y camiones 146.941 6.047 4,1 16,0<br />
382490<br />
Productos químicos y preparaciones <strong>de</strong> <strong>la</strong> industria química o <strong>de</strong> <strong>la</strong>s industrias<br />
<strong>con</strong>exas<br />
143.838 88 0,1 8,2<br />
Suma primeros 20 7.932.172 106.330 1,3 15,2<br />
Resto 6.598.670 276.475 4,2<br />
Total 14.530.842 382.805 2,6<br />
Nota: La complementariedad muestra <strong>la</strong>s subpartidas don<strong>de</strong> <strong>Corea</strong> reve<strong>la</strong> especialización exportadora y <strong>la</strong> <strong>Argentina</strong> especialización importadora<br />
(1) Derecho <strong>de</strong> importación extrazona correspondiente al promedio <strong>de</strong> <strong>la</strong> subpartida (año 2009). Fuente AFIP.<br />
Fuente: CEI en base a COMTRADE<br />
Descripción<br />
Importaciones <strong>de</strong> <strong>Argentina</strong><br />
Prom. 2004-2008 en miles <strong>de</strong> U$S<br />
Arancel<br />
<strong>Argentina</strong> (1)<br />
• <strong>El</strong> Cuadro 6 presenta los veinte productos <strong>con</strong> mayor valor <strong>de</strong> importaciones <strong>de</strong> <strong>la</strong><br />
<strong>Argentina</strong>, pero en los cuales <strong>Corea</strong> aún no ven<strong>de</strong> nada a nuestro país. Todos los<br />
productos correspon<strong>de</strong>n a manufacturas <strong>de</strong> origen industrial. Sobresalen<br />
cosechadoras-tril<strong>la</strong>doras, tractores y tubos soldados.<br />
• Los aranceles más altos correspon<strong>de</strong>n a vehículos automóviles (35%).<br />
<strong>Centro</strong> <strong>de</strong> E<strong>con</strong>omía Internacional<br />
Esmeralda 1212 – piso 2 – Tel: (00-54-11) 4819-7482 – Fax (00-54-11): 4819-7484<br />
www.cei.gov.ar<br />
9
Cuadro 6<br />
Sectores <strong>con</strong> oportunida<strong>de</strong>s aún no aprovechadas por <strong>Corea</strong><br />
Complementariedad <strong>de</strong> <strong>la</strong>s exportaciones coreanas<br />
<strong>con</strong> <strong>la</strong>s importaciones <strong>de</strong> <strong>la</strong> <strong>Argentina</strong><br />
Veinte subpartidas <strong>con</strong> mayor valor <strong>de</strong> importaciones argentinas <strong>de</strong>s<strong>de</strong> el mundo<br />
Subpartida<br />
843351 Cosechadoras-tril<strong>la</strong>doras 2.690.594 14,0<br />
870190 Tractores 14.172.856 14,0<br />
730511 Tubos soldados 3.410.184 14,0<br />
290531 Etilenglicol (etanodiol) 8.144.345 0,0<br />
870331 Vehículos <strong>con</strong> motor <strong>de</strong> émbolo, <strong>de</strong> cilindrada < o = a 1500 cm3 15.309.343 35,0<br />
380810 Insecticidas 3.875.946 9,7<br />
290220 Benceno 5.513.394 4,0<br />
740811 A<strong>la</strong>mbre <strong>de</strong> cobre refinado 12.300.814 10,0<br />
850239 Los <strong>de</strong>más grupos electrógenos 3.401.832 0,0<br />
850213 Grupos electrógenos <strong>de</strong> potencia superior a 375 kva 3.442.928 14,0<br />
480100 Papel prensa en bovinas o en hojas 10.645.278 9,0<br />
721049 Productos p<strong>la</strong>nos <strong>de</strong> hierro o acero, no cincados electrolíticamente 16.754.118 12,0<br />
290124 Buta-1,3-dieno e isopreno 2.011.588 2,0<br />
292119 Monoaminas acíclicas, sus <strong>de</strong>rivados y sales <strong>de</strong> estos productos 1.075.834 6,4<br />
722830 Barras <strong>de</strong> otros aceros aleados ncop.,<strong>la</strong>m.cal. 4.447.198 13,3<br />
854210 Circuitos integrados monolíticos 4.679.392 0,0<br />
481039 Papel y cartón kraft, excepto los usados para escribir, imprimir u otros fines gráficos 774.307 14,4<br />
790111 Cinc en bruto, sin alear, <strong>con</strong> un <strong>con</strong>tenido en peso, superior o igual al 99,99% 5.516.796 8,0<br />
310221 Sulfato <strong>de</strong> amonio 1.338.837 4,0<br />
550130 Cables acrílicos o modacrílicos 872.039 16,0<br />
Suma primeros 20 120.377.623 10,0<br />
Resto 146.481.666<br />
Total 266.859.289<br />
Nota: La complementariedad muestra <strong>la</strong>s subpartidas don<strong>de</strong> <strong>Corea</strong> reve<strong>la</strong> especialización exportadora y <strong>la</strong> <strong>Argentina</strong> especialización importadora<br />
(1) Derecho <strong>de</strong> importación extrazona correspondiente al promedio <strong>de</strong> <strong>la</strong> subpartida (año 2009). Fuente AFIP.<br />
Fuente: CEI en base a COMTRADE<br />
Descripción<br />
Importaciones <strong>de</strong> <strong>Argentina</strong><br />
Prom.2002-2005 en miles <strong>de</strong> U$S<br />
Arancel<br />
<strong>Argentina</strong> (1)<br />
4. Comercio exterior y Barreras comerciales <strong>de</strong> <strong>Corea</strong><br />
4.1. Comercio total<br />
• <strong>El</strong> <strong>comercio</strong> exterior <strong>de</strong> <strong>Corea</strong> refleja una ten<strong>de</strong>ncia ascen<strong>de</strong>nte que se acentuó en los<br />
últimos siete años, alcanzando en 2008 ventas por U$S 422.007 millones y compras<br />
por U$S 435.275 millones, más <strong>de</strong>l doble <strong>de</strong> los valores <strong>de</strong>l año 2000 (Gráfico 5).<br />
<strong>Centro</strong> <strong>de</strong> E<strong>con</strong>omía Internacional<br />
Esmeralda 1212 – piso 2 – Tel: (00-54-11) 4819-7482 – Fax (00-54-11): 4819-7484<br />
www.cei.gov.ar<br />
10
Gráfico 5<br />
Comercio exterior <strong>de</strong> <strong>Corea</strong><br />
en millones <strong>de</strong> U$S<br />
450<br />
422 435<br />
350<br />
250<br />
150<br />
50<br />
-50<br />
1980 1984 1988 1992 1996 2000 2004 2008<br />
Fuente: CEI en base a FMI<br />
4.2. Comercio por país<br />
Saldo Exportaciones Importaciones<br />
• Entre 2006 y 2008, China fue el principal socio comercial <strong>de</strong> <strong>Corea</strong> <strong>con</strong> una<br />
participación promedio <strong>de</strong> 23,1% en <strong>la</strong>s ventas coreanas y <strong>de</strong> 17,7% en <strong>la</strong>s compras<br />
<strong>de</strong> ese país (Cuadro 7). Otros importantes socios fueron Estados Unidos y Japón,<br />
tanto como <strong>de</strong>stino <strong>de</strong> <strong>la</strong>s exportaciones como orígenes <strong>de</strong> <strong>la</strong>s importaciones.<br />
Cuadro 7<br />
Comercio exterior <strong>de</strong> <strong>Corea</strong>: Principales <strong>de</strong>stinos y orígenes<br />
promedio 2006-2008<br />
Exportaciones<br />
Importaciones<br />
Destino<br />
millones<br />
<strong>de</strong> U$S part. en % Origen<br />
millones<br />
<strong>de</strong> U$S<br />
part. en %<br />
China 86.023 23,1 China 64.910 17,7<br />
Estados Unidos 44.833 12,0 Japón 57.854 15,8<br />
Japón 26.566 7,1 Estados Unidos 36.493 9,9<br />
Hong Kong, RAE <strong>de</strong> China 17.143 4,6 Arabia Saudita 22.721 6,2<br />
Singapur 12.604 3,4 Emiratos Arabes Unidos 13.801 3,8<br />
Alemania 10.707 2,9 Australia 13.760 3,7<br />
Rusia 7.838 2,1 Alemania 12.983 3,5<br />
Resto 167.274 44,8 Resto 144.647 39,4<br />
Mundo 372.987 100,0 Mundo 367.168 100,0<br />
Fuente: CEI en base a COMTRADE<br />
4.3. Comercio sectorial<br />
• <strong>El</strong> Gráfico 6 muestra que durante el bienio 2006-2007, <strong>la</strong>s exportaciones coreanas se<br />
<strong>con</strong>centraron en Máquinas y aparatos (38% promedio) y <strong>la</strong>s importaciones en<br />
<strong>Centro</strong> <strong>de</strong> E<strong>con</strong>omía Internacional<br />
Esmeralda 1212 – piso 2 – Tel: (00-54-11) 4819-7482 – Fax (00-54-11): 4819-7484<br />
www.cei.gov.ar<br />
11
Productos minerales (30% promedio). Otros sectores importantes fueron Material <strong>de</strong><br />
transporte (20%) en el caso <strong>de</strong> <strong>la</strong>s ventas y Máquinas y aparatos (27%) en <strong>la</strong>s<br />
compras.<br />
Gráfico 6<br />
Composición sectorial <strong>de</strong>l <strong>comercio</strong> exterior <strong>de</strong> <strong>Corea</strong><br />
promedio 2006-2007 1<br />
Material <strong>de</strong><br />
transporte<br />
20%<br />
Exportaciones<br />
Total: U$S 348 millones<br />
Metales<br />
9%<br />
Prod.<br />
minerales<br />
7%<br />
Máquinas y<br />
aparatos<br />
27%<br />
Importaciones<br />
Total: U$S 333 millones<br />
Metales<br />
12%<br />
Prod. químicos<br />
8%<br />
Inst. <strong>de</strong> óptica<br />
4%<br />
Máquinas y<br />
aparatos<br />
38%<br />
Resto<br />
3%<br />
Papel y cartón<br />
1%<br />
Plástico y<br />
caucho<br />
6%<br />
Prod. químicos<br />
6%<br />
Textiles<br />
4%<br />
Inst. <strong>de</strong> óptica<br />
6%<br />
Prod. minerales<br />
30%<br />
Resto<br />
9%<br />
Animales vivos<br />
y prod. <strong>de</strong>l<br />
reino animal<br />
1%<br />
Material <strong>de</strong><br />
transporte<br />
3%<br />
Plástico y<br />
caucho<br />
3%<br />
Textiles<br />
3%<br />
Fuente: CEI en base a COMTRADE<br />
4.4. Barreras comerciales<br />
• <strong>El</strong> promedio <strong>de</strong>l arancel ad valorem aplicado 2 <strong>de</strong> <strong>Corea</strong> es <strong>de</strong> 11,9%, para productos<br />
agríco<strong>la</strong>s es <strong>de</strong> 48,5% y para no agríco<strong>la</strong>s es <strong>de</strong> 6,8%.<br />
• A nivel <strong>de</strong> secciones <strong>de</strong>l sistema armonizado, los aranceles más altos se <strong>con</strong>centran<br />
en Productos <strong>de</strong>l reino vegetal, Alimentos, bebidas y tabaco y Animales vivos (Cuadro<br />
8).<br />
• <strong>El</strong> mayor nivel <strong>de</strong> protección se refleja en el porcentaje <strong>de</strong> posiciones (10 dígitos <strong>de</strong>l<br />
sistema armonizado) <strong>con</strong> aranceles no ad valorem. Aunque en porcentajes bajos,<br />
estas posiciones se encuentran principalmente en <strong>la</strong> sección Productos <strong>de</strong>l reino<br />
vegetal y en menor medida en Productos químicos.<br />
1 No se dispone <strong>de</strong> información <strong>de</strong> <strong>comercio</strong> exterior sectorial <strong>de</strong> <strong>Corea</strong> para el año 2008.<br />
2 Arancel aplicado 2008, fuente OMC. No incluye el equivalente ad valorem <strong>de</strong> los específicos.<br />
<strong>Centro</strong> <strong>de</strong> E<strong>con</strong>omía Internacional<br />
Esmeralda 1212 – piso 2 – Tel: (00-54-11) 4819-7482 – Fax (00-54-11): 4819-7484<br />
www.cei.gov.ar<br />
12
Cuadro 8<br />
Estructura arance<strong>la</strong>ria <strong>de</strong> <strong>Corea</strong><br />
aranceles aplicados, año 2008<br />
Secciones <strong>de</strong>l sistema armonizado<br />
Promedio simple<br />
% <strong>de</strong> posiciones <strong>con</strong> arancel<br />
no ad valorem<br />
I Animales vivos 20,0 0,2<br />
II Productos <strong>de</strong>l reino vegetal 90,7 7,1<br />
III Grasas y aceites 9,4 1,0<br />
IV Alimentos, bebidas y tabaco 23,5 0,2<br />
V Productos minerales 3,5 0,0<br />
VI Productos químicos 7,6 1,3<br />
VII Plástico y caucho y sus manufacturas 6,9 0,0<br />
VIII Pieles y cueros 8,3 0,0<br />
IX Ma<strong>de</strong>ra y sus manufacturas 5,5 0,0<br />
X Papel y sus manufacturas 0,1 0,0<br />
XI Materias textiles y sus manufacturas 9,6 0,4<br />
XII Calzados y accesorios 10,3 0,0<br />
XIII Manufacturas <strong>de</strong> piedra, yeso, cerámicos; vidrio 7,7 0,0<br />
XIV Piedras y metales preciosos 5,2 0,0<br />
XV Metales comunes y sus manufacturas 4,3 0,0<br />
XVI Máquinas y aparatos eléctricos y sus partes 5,7 0,0<br />
XVII Material <strong>de</strong> transporte 5,9 0,0<br />
XVIII Optica y relojería 6,6 0,0<br />
XIX Armas, municiones y sus partes y accesorios 3,7 0,0<br />
XX Mercancías y productos diversos 5,3 0,0<br />
XXI Objetos <strong>de</strong> arte o colección y antigüeda<strong>de</strong>s 0,0 0,0<br />
Nota: el promedio simple correspon<strong>de</strong> únicamente a los aranceles ad valorem<br />
Fuente: CEI en base a OMC<br />
• Como se aprecia en el Cuadro 9, el sector Cuero, textiles y calzado <strong>con</strong>centra <strong>la</strong><br />
mayor cantidad <strong>de</strong> posiciones <strong>con</strong> aranceles altos –>=10% y = 30% Arancel ad valorem >= 10% y < 30%<br />
Cantidad % en el total Cantidad % en el total<br />
Agroalimentos y pesca 421 95,9 687 42,8<br />
Minerales y combustibles 0 0,0 0 0,0<br />
Cuero, textiles y calzado 0 0,0 854 53,2<br />
Resto <strong>de</strong> prod. industriales 18 4,1 63 3,9<br />
Total 439 100,0 1.604 100,0<br />
Nota: Posiciones a 10 dígitos.<br />
Fuente: CEI en base a OMC<br />
<strong>Centro</strong> <strong>de</strong> E<strong>con</strong>omía Internacional<br />
Esmeralda 1212 – piso 2 – Tel: (00-54-11) 4819-7482 – Fax (00-54-11): 4819-7484<br />
www.cei.gov.ar<br />
13
• <strong>Corea</strong> presenta picos arance<strong>la</strong>rios mayores a 100% en trece capítulos <strong>de</strong>l sistema<br />
armonizado. De esos capítulos los aranceles ad valorem máximos están en Hortalizas,<br />
Cereales y Harinas (Cuadro 10).<br />
Cuadro 10<br />
Picos arance<strong>la</strong>rios<br />
aranceles aplicados, año 2008, capítulos seleccionados<br />
Capítulo<br />
% arancel ad valorem<br />
07 Hortalizas 887<br />
10 Cereales 800<br />
11 Harinas 800<br />
12 Semil<strong>la</strong>s oleaginosas 754<br />
13 Gomas, resinas; extractos vegetales 754<br />
21 Preparaciones alimenticias diversas 754<br />
33 Perfumería 754<br />
09 Café, té y yerba mate 514<br />
35 Albúminas 386<br />
22 Bebidas 270<br />
17 Azúcares 243<br />
04 Lácteos, huevos y miel 176<br />
08 Frutas 144<br />
Fuente: CEI en base a OMC<br />
5. Evolución <strong>de</strong>l PIB <strong>de</strong> <strong>Corea</strong><br />
• En los últimos veinte años, <strong>la</strong> e<strong>con</strong>omía coreana creció a una tasa cercana al 6% <strong>de</strong><br />
promedio anual, aumentando su participación en el producto mundial. De esta forma<br />
<strong>Corea</strong> ocupa el <strong>de</strong>cimoquinto lugar, en términos <strong>de</strong> PIB corriente, entre <strong>la</strong>s principales<br />
e<strong>con</strong>omías <strong>de</strong>l mundo y el cuarto entre <strong>la</strong>s e<strong>con</strong>omías asiáticas <strong>de</strong>trás <strong>de</strong> Japón,<br />
China e India.<br />
• En 2008 el PIB corriente <strong>de</strong> <strong>Corea</strong> alcanzó U$S 947 miles <strong>de</strong> millones (Gráfico 7).<br />
<strong>Centro</strong> <strong>de</strong> E<strong>con</strong>omía Internacional<br />
Esmeralda 1212 – piso 2 – Tel: (00-54-11) 4819-7482 – Fax (00-54-11): 4819-7484<br />
www.cei.gov.ar<br />
14
Gráfico 7<br />
PIB <strong>de</strong> <strong>Corea</strong>: valores corrientes y tasa <strong>de</strong> crecimiento<br />
en millones <strong>de</strong> U$S y %<br />
1.200<br />
12,0<br />
miles <strong>de</strong> millones <strong>de</strong> dó<strong>la</strong>res<br />
1.000<br />
800<br />
600<br />
400<br />
200<br />
10,0<br />
8,0<br />
6,0<br />
4,0<br />
2,0<br />
0,0<br />
-2,0<br />
-4,0<br />
-6,0<br />
en %<br />
0<br />
1990 1992 1994 1996 1998 2000 2002 2004 2006 2008<br />
-8,0<br />
PIB corriente<br />
Tasa <strong>de</strong> crecimiento <strong>de</strong>l PIB<br />
Fuente: CEI en base a FMI<br />
<strong>Centro</strong> <strong>de</strong> E<strong>con</strong>omía Internacional<br />
Esmeralda 1212 – piso 2 – Tel: (00-54-11) 4819-7482 – Fax (00-54-11): 4819-7484<br />
www.cei.gov.ar<br />
15