Balanza Comercial de la Industria de Autopartes de Nuevo León de ...
Balanza Comercial de la Industria de Autopartes de Nuevo León de ...
Balanza Comercial de la Industria de Autopartes de Nuevo León de ...

Create successful ePaper yourself
Turn your PDF publications into a flip-book with our unique Google optimized e-Paper software.
Código<br />
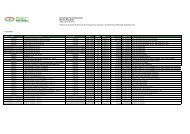
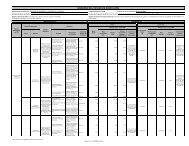
CRECIMIENTO EN LAS EXPORTACIONES DE LA INDUSTRIA DE AUTOPARTES DE NUEVO LEÓN,<br />
2008 - 2009 - 2010<br />
Sistema<br />
Exportaciones (Dó<strong>la</strong>res)<br />
2008 2009 2010<br />
Crecimiento<br />
2009/2008<br />
Crecimiento<br />
2010/2009<br />
1 Motores 26,187,080 78,452,713 120,260,361 199.6% 53.3%<br />
2 Partes para motor 547,754,964 605,951,125 1,217,885,369 10.6% 101.0%<br />
3 Alimentación <strong>de</strong> combustible 2,959,664 21,999,023 48,480,755 643.3% 120.4%<br />
4 Sistema <strong>de</strong> enfriamiento <strong>de</strong>l motor 12,584,934 13,592,137 20,128,200 8.0% 48.1%<br />
5 Sistema <strong>de</strong> escape 428,333,021 95,699,484 100,162,237 -77.7% 4.7%<br />
6 Sistema eléctrico 712,384,978 824,797,628 969,136,526 15.8% 17.5%<br />
7 L<strong>la</strong>ntas y neumáticos 1,335,947 7,265 61,179 -99.5% 742.1%<br />
8 Te<strong>la</strong>s, alfombras y asientos 25,269,240 19,617,920 18,503,522 -22.4% -5.7%<br />
9 Panel <strong>de</strong> instrumentos 34,189,340 65,050,896 112,773,679 90.3% 73.4%<br />
10 Componentes interiores 49,308,420 119,306,408 15,873,992 142.0% -86.7%<br />
11 Dirección y sus partes 28,867,275 26,640,194 54,862,475 -7.7% 105.9%<br />
12 Transmisiones y sus partes 8,693,771 21,566,773 21,773,886 148.1% 1.0%<br />
13 Ejes y flechas <strong>de</strong> tracción 47,109,190 28,007,153 73,645,282 -40.5% 163.0%<br />
14 Embragues y sus partes 275,324 275,942 383,257 0.2% 38.9%<br />
15 Suspensión y sus partes 12,306,076 11,117,402 9,549,352 -9.7% -14.1%<br />
16 Frenos y sus partes 12,603 4,334 8,428 -65.6% 94.5%<br />
17 Carrocerías ensamb<strong>la</strong>das (ind. carrocera) 196,182,275 84,225,802 175,891,883 -57.1% 108.8%<br />
18 Estampados 272,325,353 202,067,630 285,751,948 -25.8% 41.4%<br />
19 Vidrios, cristales y parabrisas 125,930,461 76,836,445 103,058,075 -39.0% 34.1%<br />
20 Accesorios 58,488,998 60,035,979 24,161,331 2.6% -59.8%<br />
21 Componentes exteriores 93,436,997 79,025,056 110,043,768 -15.4% 39.3%<br />
22 Productos automotrices <strong>de</strong> hule 460 528 3,369 14.8% 538.1%<br />
23 Aceites, lubricantes y líquidos 336,778 764,572 964,672 127.0% 26.2%<br />
24<br />
Sistema <strong>de</strong> aire acondicionado,<br />
calefacción y sus partes<br />
3,981,687 1,479,807 1,886,410 -6.80% 27.5%<br />
25 Productos automotrices <strong>de</strong> plástico 2,239,761 10,309,376 14,566,823 360.3% 41.3%<br />
26 Otros 126,073,376 164,227,085 178,642,797 30.3% 8.8%<br />
Total 2,816,567,973 2,611,058,679 3,678,459,576 -7.3% 40.9%<br />
Fuente: SEDEC con información <strong>de</strong> Aduanas