

Manual-de-Arroz-PDF
Manual-de-Arroz-PDF
Manual-de-Arroz-PDF

You also want an ePaper? Increase the reach of your titles
YUMPU automatically turns print PDFs into web optimized ePapers that Google loves.
Producción <strong>de</strong> <strong>Arroz</strong>: Buenas Prácticas Agrícolas (BPA)<br />
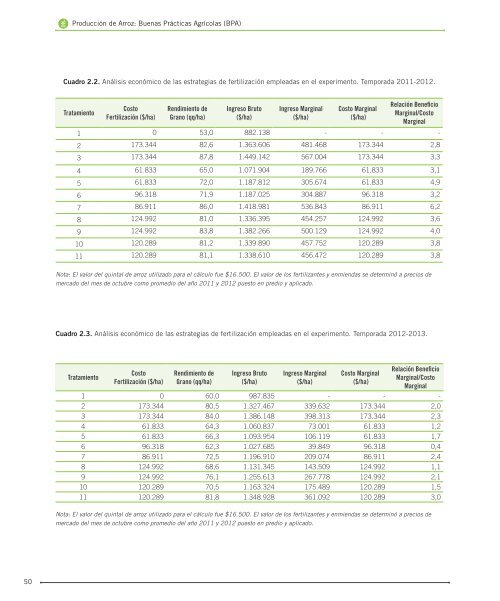
Cuadro 2.2. Análisis económico <strong>de</strong> las estrategias <strong>de</strong> fertilización empleadas en el experimento. Temporada 2011-2012.<br />
Tratamiento<br />
Costo<br />
Fertilización ($/ha)<br />
Rendimiento <strong>de</strong><br />
Grano (qq/ha)<br />
Ingreso Bruto<br />
($/ha)<br />
Ingreso Marginal<br />
($/ha)<br />
Costo Marginal<br />
($/ha)<br />
Relación Beneficio<br />
Marginal/Costo<br />
Marginal<br />
1 0 53,0 882.138 - - -<br />
2 173.344 82,6 1.363.606 481.468 173.344 2,8<br />
3 173.344 87,8 1.449.142 567.004 173.344 3,3<br />
4 61.833 65,0 1.071.904 189.766 61.833 3,1<br />
5 61.833 72,0 1.187.812 305.674 61.833 4,9<br />
6 96.318 71,9 1.187.025 304.887 96.318 3,2<br />
7 86.911 86,0 1.418.981 536.843 86.911 6,2<br />
8 124.992 81,0 1.336.395 454.257 124.992 3,6<br />
9 124.992 83,8 1.382.266 500.129 124.992 4,0<br />
10 120.289 81,2 1.339.890 457.752 120.289 3,8<br />
11 120.289 81,1 1.338.610 456.472 120.289 3,8<br />
Nota: El valor <strong>de</strong>l quintal <strong>de</strong> arroz utilizado para el cálculo fue $16.500. El valor <strong>de</strong> los fertilizantes y enmiendas se <strong>de</strong>terminó a precios <strong>de</strong><br />
mercado <strong>de</strong>l mes <strong>de</strong> octubre como promedio <strong>de</strong>l año 2011 y 2012 puesto en predio y aplicado.<br />
Cuadro 2.3. Análisis económico <strong>de</strong> las estrategias <strong>de</strong> fertilización empleadas en el experimento. Temporada 2012-2013.<br />
Tratamiento<br />
Costo<br />
Fertilización ($/ha)<br />
Rendimiento <strong>de</strong><br />
Grano (qq/ha)<br />
Ingreso Bruto<br />
($/ha)<br />
Ingreso Marginal<br />
($/ha)<br />
Costo Marginal<br />
($/ha)<br />
Relación Beneficio<br />
Marginal/Costo<br />
Marginal<br />
1 0 60,0 987.835 - - -<br />
2 173.344 80,5 1.327.467 339.632 173.344 2,0<br />
3 173.344 84,0 1.386.148 398.313 173.344 2,3<br />
4 61.833 64,3 1.060.837 73.001 61.833 1,2<br />
5 61.833 66,3 1.093.954 106.119 61.833 1,7<br />
6 96.318 62,3 1.027.685 39.849 96.318 0,4<br />
7 86.911 72,5 1.196.910 209.074 86.911 2,4<br />
8 124.992 68,6 1.131.345 143.509 124.992 1,1<br />
9 124.992 76,1 1.255.613 267.778 124.992 2,1<br />
10 120.289 70,5 1.163.324 175.489 120.289 1,5<br />
11 120.289 81,8 1.348.928 361.092 120.289 3,0<br />
Nota: El valor <strong>de</strong>l quintal <strong>de</strong> arroz utilizado para el cálculo fue $16.500. El valor <strong>de</strong> los fertilizantes y enmiendas se <strong>de</strong>terminó a precios <strong>de</strong><br />
mercado <strong>de</strong>l mes <strong>de</strong> octubre como promedio <strong>de</strong>l año 2011 y 2012 puesto en predio y aplicado.<br />
50