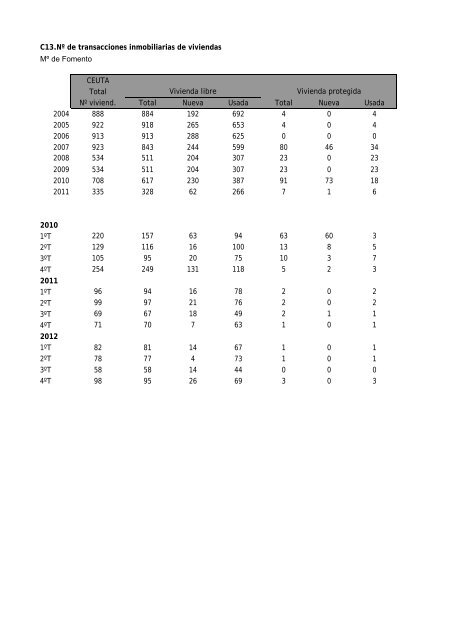
C13.Nº de transacciones inmobiliarias de viviendasMº de FomentoCEUTATotalNº viviend. TotalVivienda libreNueva Usada TotalVivienda protegidaNueva Usada2004 888 884 192 692 4 0 42005 922 918 265 653 4 0 42006 913 913 288 625 0 0 02007 923 843 244 599 80 46 342008 534 511 204 307 23 0 232009 534 511 204 307 23 0 232010 708 617 230 387 91 73 182011 335 328 62 266 7 1 620101ºT 220 157 63 94 63 60 32ºT 129 116 16 100 13 8 53ºT 105 95 20 75 10 3 74ºT 254 249 131 118 5 2 320111ºT 96 94 16 78 2 0 22ºT 99 97 21 76 2 0 23ºT 69 67 18 49 2 1 14ºT 71 70 7 63 1 0 120121ºT 82 81 14 67 1 0 12ºT 78 77 4 73 1 0 13ºT 58 58 14 44 0 0 04ºT 98 95 26 69 3 0 3
C14.Valor de las transacciones inmobiliarias de viviendasMº de Fomento(miles de euros)CEUTAVivienda libreValor medioTotal Nueva Segunda mano Total Nueva Segunda mano2007 132.417 46.975 85.442 157.390,1 157.390,1 142.749,62008 101.173 40.394 60.779 171.102,0 220.083,9 148.521,82009 95.021 48.303 46.717 185.732,9 239.808,7 152.912,42010 103.227,1 45.150,2 58.076,9 163.486,1 193.802,5 149.999,42011 51.401,6 14.917,6 36.484,0 155.570,6 234.335,3 136.812,220102010.1ºT 22.714,7 9.949,1 12.765,5 144.679,5 157.922,8 135.803,62010.2ºT 17.683,7 3.191,5 14.492,2 152.445,8 199.467,3 144.922,32010.3ªT 16.050,8 4.094,6 11.956,3 168.955,9 204.728,0 159.416,72010.4ªT 46.777,9 27.915,0 18.862,9 187.863,0 213.091,7 159.854,820112011.1ºT 11.860,3 2.805,0 9.055,3 126.173,4 175.310,4 116.094,02011.2ºT 18.946,6 6.645,2 12.301,4 195.325,4 316.437,9 161.860,12011.3ºT 10.276,6 3.842,6 6.434,0 153.381,5 213.477,5 131.305,52011.4ºT 10.318,1 1.624,8 8.693,3 147.401,9 232.115,5 137.989,320122012.1ºT 13.719,4 4.234,3 9.485,1 169.375,8 302.453,1 141.568,62012.2ºT 8.941,0 623,5 8.317,5 116.116,9 155.868,0 113.938,82012.3ºT 8.792,6 3.793,2 4.999,4 151.596,6 270.940,7 113.623,52012.4ºT 13.791,4 4.760,4 9.031,0 145.172,6 183.094,1 130.883,3
- Page 1 and 2:
BOLETIN DE COYUNTURA DE CEUTAMARZO
- Page 3 and 4:
RESUMEN DE INDICADORESCEUTAAño act
- Page 5 and 6:
B. Consumo 82 82 346 346 -76,3 -76,
- Page 7 and 8:
Vivienda. Actividad mercantilPrecio
- Page 9 and 10:
Edificacion 0 3.249 0 51.225 … -9
- Page 11 and 12:
Servicios 7,4 7,4 6,9 7,0 0,5 0,5 A
- Page 13 and 14:
Transporte 0,1 0,1 Casi estableComu
- Page 15 and 16: Tasa sobre importes 10,3 10,3 8,0 8
- Page 17 and 18: General 74,1 80,6 82,9 89,2 -10,6 -
- Page 19 and 20: Sectores de actividadIndustria 2.02
- Page 21 and 22: Total 842.632 849.679 855.103 870.2
- Page 23 and 24: Indice de ventas, precios constante
- Page 25 and 26: Sectores de actividadIndustria -10,
- Page 27 and 28: ANEXO DE TABLAS ESTADISTICAS
- Page 29 and 30: A1.Demanda de energia electrica (ge
- Page 31 and 32: A2BIS.RECAUDACION TRIBUTARIA DE LA
- Page 33 and 34: B1.Matriculaciones de vehiculosESPA
- Page 35 and 36: B2.MATRICULACION DE CICLOMOTORESFue
- Page 37 and 38: B3bis.TRANSFERENCIAS DE VEHICULOS F
- Page 39 and 40: B5.Pernoctaciones en establecimient
- Page 41 and 42: B7.Encuesta de establecimientos hot
- Page 43 and 44: B8.Tarifa media diaria (hoteles)Ine
- Page 45 and 46: B10.Indice de precios hoteleros. Ba
- Page 47 and 48: B12.EXPORTACIONES E IMPORTACIONES P
- Page 49 and 50: B12BIS.EXPORTACIONES E IMPORTACIONE
- Page 51 and 52: B14.Indice de comercio al por menor
- Page 53 and 54: C1.Estadisticas del Colegio de Arqu
- Page 55 and 56: C3.Vivienda protegida (total planes
- Page 57 and 58: C5.Construcción de edificios (lice
- Page 59 and 60: C7.Nº de viviendas a construir (se
- Page 61 and 62: C9.Indice de precios de vivienda. B
- Page 63 and 64: C.11.Licitación oficial (miles de
- Page 65: C12.Licitación oficial (miles de e
- Page 69 and 70: C15.Estadistica de transmisiones de
- Page 71 and 72: C.17.Estadistica de transmisiones d
- Page 73 and 74: C19.Estadistica de transmisiones de
- Page 75 and 76: C21.Transacciones de suelo urbanoM
- Page 77 and 78: D1.Tráfico portuario.Tráfico port
- Page 79 and 80: D3.Tráfico portuario. Mº FomentoO
- Page 81 and 82: D4.Transporte aéreo interior de pa
- Page 83 and 84: E1.Paro registrado. Total y por gé
- Page 85 and 86: ESPAÑASectoresAgricultura Industri
- Page 87 and 88: ESPAÑATotal < 20 20-24 25-29 30-44
- Page 89 and 90: E5.Colocaciones según tipo de colo
- Page 91 and 92: E5bis.Colocaciones por edad.(Estadi
- Page 93 and 94: ESPAÑATotal Indefinidos Temporales
- Page 95 and 96: E7.Beneficiarios de prestaciones po
- Page 97 and 98: E8.Afiliados medios a la SS en alta
- Page 99 and 100: E10.Afiliados por sectores y seccio
- Page 101 and 102: E10.Afiliados por sectores y seccio
- Page 103 and 104: E10.Afiliados por sectores y seccio
- Page 105 and 106: E12.Afiliados extranjeros por secto
- Page 107 and 108: Secciones de actividadComer. Rep. T
- Page 109 and 110: Org. ExtraterritorialesTotalU0 1.80
- Page 111 and 112: E14.Codigos de cuentas de cotizacio
- Page 113 and 114: E15.Encuesta de población activa.
- Page 115 and 116: E16.Encuesta de población activa.
- Page 117 and 118:
E18.Ocupados por situación profesi
- Page 119 and 120:
E19.Encuesta de población activa.
- Page 121 and 122:
E20.Encuesta de población activa.
- Page 123 and 124:
E22.Encuesta de población activa.
- Page 125 and 126:
F1.IPC CEUTA, Total y grupos COICOP
- Page 127 and 128:
F3.IPC ESPAÑA Total y grupos COICO
- Page 129 and 130:
F5.IPC CEUTA, Total y grupos COICOP
- Page 131 and 132:
G1.Efectos de comercio. (importes e
- Page 133 and 134:
G3.Efectos de comercio en cartera.
- Page 135 and 136:
G5.Efectos recibidos en gestión de
- Page 137 and 138:
G7.Créditos en el sistema bancario
- Page 139 and 140:
G8bis.Depósitos en el sistema banc
- Page 141 and 142:
G10.Deudores por tipo de concurso y
- Page 143 and 144:
G12.Deudores consursados por natura
- Page 145 and 146:
G13.Deudores consursados empresas p
- Page 147 and 148:
G14.Deudores consursados empresas p
- Page 149 and 150:
G16.Estadistica de hipotecas. Nº d
- Page 151 and 152:
G17.Hipotecas por tipo de entidadIn
- Page 153 and 154:
G19.Hipotecas fincas urbanas por ti
- Page 155 and 156:
G21.Hipotecas canceladas registralm
- Page 157 and 158:
G23.Sociedades mercantiles. Resumen
- Page 159 and 160:
G24.Creación de sociedades mercant