libro
libro
libro
- No tags were found...

You also want an ePaper? Increase the reach of your titles
YUMPU automatically turns print PDFs into web optimized ePapers that Google loves.
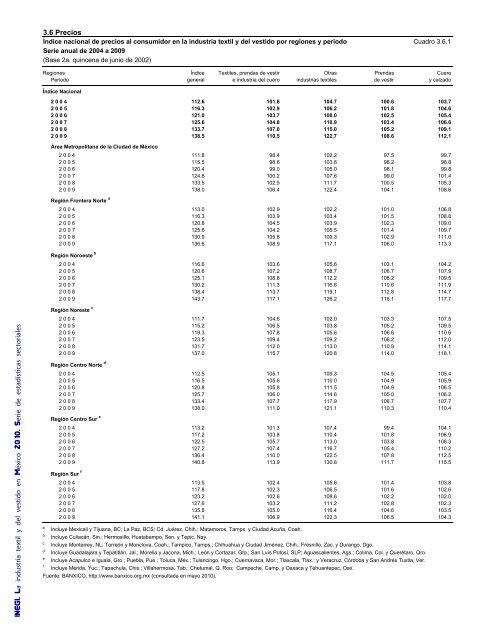
3.6 PreciosÍndice nacional de precios al consumidor en la industria textil y del vestido por regiones y periodo Cuadro 3.6.1Serie anual de 2004 a 2009(Base 2a. quincena de junio de 2002)Regiones Índice Textiles, prendas de vestir Otras Prendas CueroPeriodo general e industria del cuero industrias textiles de vestir y calzadoÍndice Nacional2 0 0 4 112.6 101.8 104.7 100.6 103.72 0 0 5 116.3 102.9 106.2 101.8 104.62 0 0 6 121.0 103.7 108.0 102.5 105.42 0 0 7 125.6 104.8 110.9 103.4 106.62 0 0 8 133.7 107.0 115.0 105.2 109.12 0 0 9 138.5 110.5 122.7 108.6 112.1Área Metropolitana de la Ciudad de México2 0 0 4 111.8 98.4 102.2 97.5 99.72 0 0 5 115.5 98.6 103.6 98.2 98.82 0 0 6 120.4 99.0 105.0 98.1 99.82 0 0 7 124.8 100.2 107.6 99.0 101.42 0 0 8 133.5 102.5 111.7 100.5 105.32 0 0 9 138.0 106.4 122.4 104.1 108.6Región Frontera Norte a2 0 0 4 113.0 102.9 102.2 101.0 106.82 0 0 5 116.3 103.9 103.4 101.5 108.82 0 0 6 120.8 104.5 103.9 102.3 109.02 0 0 7 125.6 104.2 105.5 101.4 109.72 0 0 8 130.9 105.8 109.3 102.9 111.02 0 0 9 136.6 108.9 117.1 106.0 113.3Región Noroeste b2 0 0 4 116.6 103.6 105.6 103.1 104.22 0 0 5 120.6 107.2 108.7 106.7 107.92 0 0 6 125.1 108.8 112.2 108.2 109.52 0 0 7 130.2 111.3 116.6 110.6 111.92 0 0 8 138.4 113.7 119.1 112.8 114.72 0 0 9 143.7 117.1 126.2 116.1 117.7INEGI. La industria textil y del vestido en México 2010. Serie de estadísticas sectorialesRegión Noreste c2 0 0 4 111.7 104.6 102.0 103.3 107.52 0 0 5 115.2 106.5 103.8 105.2 109.52 0 0 6 119.3 107.8 105.6 106.6 110.62 0 0 7 123.5 109.4 109.2 108.2 112.02 0 0 8 131.7 112.0 113.0 110.9 114.12 0 0 9 137.0 115.7 120.8 114.0 118.1Región Centro Norte d2 0 0 4 112.5 105.1 109.3 104.5 105.42 0 0 5 116.5 105.6 110.0 104.9 105.92 0 0 6 120.8 105.8 111.5 104.9 106.52 0 0 7 125.7 106.0 114.6 105.0 106.22 0 0 8 133.4 107.7 117.9 106.7 107.72 0 0 9 138.0 111.0 121.1 110.3 110.4Región Centro Sur e2 0 0 4 113.2 101.3 107.4 99.4 104.12 0 0 5 117.2 103.8 110.4 101.8 106.92 0 0 6 122.5 105.7 113.0 103.8 108.32 0 0 7 127.2 107.4 116.7 105.4 110.22 0 0 8 136.4 110.0 122.5 107.8 112.52 0 0 9 140.8 113.9 130.8 111.7 115.5Región Sur f2 0 0 4 113.5 102.4 105.6 101.4 103.82 0 0 5 117.8 102.3 106.5 101.6 102.62 0 0 6 123.2 102.6 108.6 102.2 102.02 0 0 7 127.6 103.2 111.2 102.8 102.32 0 0 8 135.8 105.0 116.4 104.6 103.52 0 0 9 141.1 106.9 122.3 106.5 104.3a Incluye Mexicali y Tijuana, BC; La Paz, BCS; Cd. Juárez, Chih.; Matamoros, Tamps. y Ciudad Acuña, Coah.b Incluye Culiacán, Sin.; Hermosillo, Huatabampo, Son. y Tepic, Nay.c Incluye Monterrey, NL; Torreón y Monclova, Coah.; Tampico, Tamps.; Chihuahua y Ciudad Jiménez, Chih.; Fresnillo, Zac. y Durango, Dgo.d Incluye Guadalajara y Tepatitlán, Jal.; Morelia y Jacona, Mich.; León y Cortazar, Gto.; San Luís Potosí, SLP; Aguascalientes, Ags.; Colima, Col. y Querétaro, Qro.eIncluye Acapulco e Iguala, Gro.; Puebla, Pue.; Toluca, Méx.; Tulancingo, Hgo.; Cuernavaca, Mor.; Tlaxcala, Tlax.; y Veracruz, Córdoba y San Andrés Tuxtla, Ver.f Incluye Mérida, Yuc.; Tapachula, Chis.; Villahermosa, Tab.; Chetumal, Q. Roo; Campeche, Camp. y Oaxaca y Tehuantepec, Oax.Fuente: BANXICO. http://www.banxico.org.mx (consultada en mayo 2010).