

Análisis de pérdidas energéticas por infiltración de aire
4ptAOdseF
4ptAOdseF

Create successful ePaper yourself
Turn your PDF publications into a flip-book with our unique Google optimized e-Paper software.
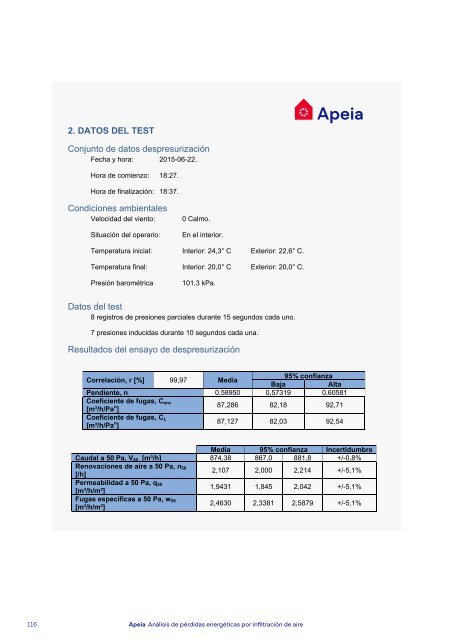
2. DATOS DEL TEST<br />
Conjunto <strong>de</strong> datos <strong>de</strong>spresurización<br />
Fecha y hora: 2015-06-22.<br />
Hora <strong>de</strong> comienzo: 18:27.<br />
Hora <strong>de</strong> finalización: 18:37.<br />
Condiciones ambientales<br />
Velocidad <strong>de</strong>l viento:<br />
Situación <strong>de</strong>l operario:<br />
0 Calmo.<br />
En el interior.<br />
Media <strong>de</strong> presiones estáticas<br />
Inicial [Pa] ∆P01 -1,37 ∆P01- -1,37 ∆P01+ 0,00<br />
Final [Pa] ∆P02 -1,70 ∆P02- -1,70 ∆P02+ 0,00<br />
Línea base inicial [Pa] -1,92 -1,97 -1,97 -1,23 -0,72 -0,72 -1,06<br />
Línea base final [Pa] -2,25 -2,02 -1,65 -1,23 -1,07 -1,64 -2,06<br />
Gráficos <strong>de</strong>spresurización<br />
Temperatura inicial: Interior: 24,3° C Exterior: 22,6° C.<br />
Temperatura final: Interior: 20,0° C Exterior: 20,0° C.<br />
Presión barométrica<br />
101,3 kPa.<br />
Datos <strong>de</strong>l test<br />
8 registros <strong>de</strong> presiones parciales durante 15 segundos cada uno.<br />
7 presiones inducidas durante 10 segundos cada una.<br />
Resultados <strong>de</strong>l ensayo <strong>de</strong> <strong>de</strong>spresurización<br />
Presión inducida vs. Caudal<br />
Presiones inducidas<br />
Correlación, r [%] 99,97 Media<br />
95% confianza<br />
Baja<br />
Alta<br />
Pendiente, n 0,58950 0,57319 0,60581<br />
Coeficiente <strong>de</strong> fugas, C env<br />
[m³/h/Pa n ]<br />
87,286 82,18 92,71<br />
Coeficiente <strong>de</strong> fugas, C L<br />
[m³/h/Pa n ]<br />
87,127 82,03 92,54<br />
Media 95% confianza Incertidumbre<br />
Caudal a 50 Pa, V 50 [m³/h] 874,38 867,0 881,8 +/-0,8%<br />
Renovaciones <strong>de</strong> <strong>aire</strong> a 50 Pa, n 50<br />
[/h]<br />
2,107 2,000 2,214 +/-5,1%<br />
Permeabilidad a 50 Pa, q 50<br />
[m³/h/m²]<br />
1,9431 1,845 2,042 +/-5,1%<br />
Fugas específicas a 50 Pa, w 50<br />
[m³/h/m²]<br />
2,4630 2,3381 2,5879 +/-5,1%<br />
3. EQUIPOS<br />
Para realizar el test se han empleado los siguientes equipos:<br />
Ventilador Nº <strong>de</strong> serie Manómetros Nº <strong>de</strong> serie<br />
#1 Retrotec 1000 Nº <strong>de</strong> serie DM32 Nº <strong>de</strong> serie<br />
Página 2 <strong>de</strong> 3<br />
Página 3 <strong>de</strong> 3<br />
116 Apeia <strong>Análisis</strong> <strong>de</strong> <strong>pérdidas</strong> <strong>energéticas</strong> <strong>por</strong> <strong>infiltración</strong> <strong>de</strong> <strong>aire</strong><br />
12. Redacción <strong>de</strong>l informe técnico<br />
117