Pobreza y derechos sociales de niñas niños y adolescentes en México 2014
23bbzCj
23bbzCj

You also want an ePaper? Increase the reach of your titles
YUMPU automatically turns print PDFs into web optimized ePapers that Google loves.
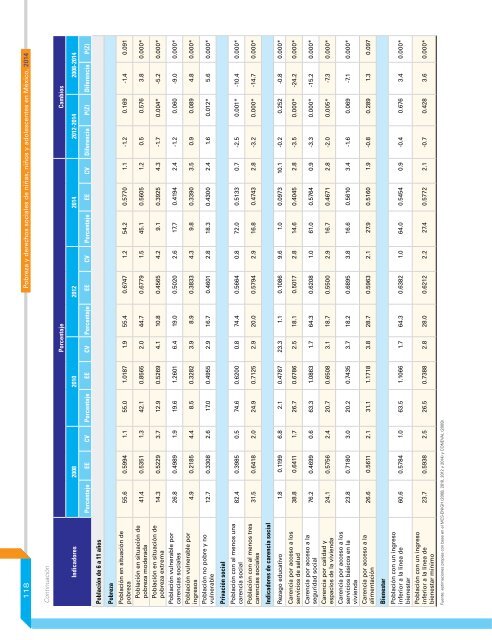
118<br />
<strong>Pobreza</strong> y <strong><strong>de</strong>rechos</strong> <strong>sociales</strong> <strong>de</strong> <strong>niñas</strong>, <strong>niños</strong> y <strong>adolesc<strong>en</strong>tes</strong> <strong>en</strong> <strong>México</strong>, <strong>2014</strong><br />
Continuación<br />
Porc<strong>en</strong>taje Cambios<br />
Indicadores<br />
2008 2010 2012 <strong>2014</strong> 2012-<strong>2014</strong> 2008-<strong>2014</strong><br />
Porc<strong>en</strong>taje EE CV Porc<strong>en</strong>taje EE CV Porc<strong>en</strong>taje EE CV Porc<strong>en</strong>taje EE CV Difer<strong>en</strong>cia P(Z) Difer<strong>en</strong>cia P(Z)<br />
Población <strong>de</strong> 6 a 11 años<br />
<strong>Pobreza</strong><br />
Población <strong>en</strong> situación <strong>de</strong><br />
pobreza<br />
Población <strong>en</strong> situación <strong>de</strong><br />
pobreza mo<strong>de</strong>rada<br />
Población <strong>en</strong> situación <strong>de</strong><br />
pobreza extrema<br />
Población vulnerable por<br />
car<strong>en</strong>cias <strong>sociales</strong><br />
Población vulnerable por<br />
ingresos<br />
Población no pobre y no<br />
vulnerable<br />
55.6 0.5994 1.1 55.0 1.0187 1.9 55.4 0.6747 1.2 54.2 0.5770 1.1 -1.2 0.169 -1.4 0.091<br />
41.4 0.5351 1.3 42.1 0.8565 2.0 44.7 0.6779 1.5 45.1 0.5605 1.2 0.5 0.576 3.8 0.000*<br />
14.3 0.5229 3.7 12.9 0.5269 4.1 10.8 0.4565 4.2 9.1 0.3925 4.3 -1.7 0.004* -5.2 0.000*<br />
26.8 0.4989 1.9 19.6 1.2601 6.4 19.0 0.5020 2.6 17.7 0.4194 2.4 -1.2 0.060 -9.0 0.000*<br />
4.9 0.2185 4.4 8.5 0.3282 3.9 8.9 0.3833 4.3 9.8 0.3390 3.5 0.9 0.089 4.8 0.000*<br />
12.7 0.3308 2.6 17.0 0.4955 2.9 16.7 0.4601 2.8 18.3 0.4300 2.4 1.6 0.012* 5.6 0.000*<br />
Privación social<br />
Población con al m<strong>en</strong>os una<br />
car<strong>en</strong>cia social<br />
Población con al m<strong>en</strong>os tres<br />
car<strong>en</strong>cias <strong>sociales</strong><br />
82.4 0.3985 0.5 74.6 0.6200 0.8 74.4 0.5664 0.8 72.0 0.5133 0.7 -2.5 0.001* -10.4 0.000*<br />
31.5 0.6418 2.0 24.9 0.7125 2.9 20.0 0.5794 2.9 16.8 0.4743 2.8 -3.2 0.000* -14.7 0.000*<br />
Indicadores <strong>de</strong> car<strong>en</strong>cia social<br />
Rezago educativo 1.8 0.1199 6.8 2.1 0.4787 23.3 1.1 0.1086 9.6 1.0 0.0973 10.1 -0.2 0.252 -0.8 0.000*<br />
Car<strong>en</strong>cia por acceso a los<br />
servicios <strong>de</strong> salud<br />
Car<strong>en</strong>cia por acceso a la<br />
seguridad social<br />
Car<strong>en</strong>cia por calidad y<br />
espacios <strong>de</strong> la vivi<strong>en</strong>da<br />
Car<strong>en</strong>cia por acceso a los<br />
servicios básicos <strong>en</strong> la<br />
vivi<strong>en</strong>da<br />
Car<strong>en</strong>cia por acceso a la<br />
alim<strong>en</strong>tación<br />
38.8 0.6411 1.7 26.7 0.6786 2.5 18.1 0.5017 2.8 14.6 0.4045 2.8 -3.5 0.000* -24.2 0.000*<br />
76.2 0.4699 0.6 63.3 1.0863 1.7 64.3 0.6208 1.0 61.0 0.5764 0.9 -3.3 0.000* -15.2 0.000*<br />
24.1 0.5756 2.4 20.7 0.6508 3.1 18.7 0.5500 2.9 16.7 0.4671 2.8 -2.0 0.005* -7.3 0.000*<br />
23.8 0.7180 3.0 20.2 0.7435 3.7 18.2 0.6895 3.8 16.6 0.5610 3.4 -1.6 0.069 -7.1 0.000*<br />
26.6 0.5611 2.1 31.1 1.1718 3.8 28.7 0.5963 2.1 27.9 0.5160 1.9 -0.8 0.289 1.3 0.097<br />
Bi<strong>en</strong>estar<br />
Población con un ingreso<br />
inferior a la línea <strong>de</strong><br />
bi<strong>en</strong>estar<br />
Población con un ingreso<br />
inferior a la línea <strong>de</strong><br />
bi<strong>en</strong>estar mínimo<br />
60.6 0.5784 1.0 63.5 1.1066 1.7 64.3 0.6382 1.0 64.0 0.5454 0.9 -0.4 0.676 3.4 0.000*<br />
23.7 0.5938 2.5 26.5 0.7388 2.8 28.0 0.6212 2.2 27.4 0.5772 2.1 -0.7 0.428 3.6 0.000*<br />
Fu<strong>en</strong>te: estimaciones propias con base <strong>en</strong> el MCS-ENIGH (2008, 2010, 2012 y <strong>2014</strong>) y CONEVAL (2009).