INFORME SEMANAL DEL MERCADO INTERNACIONAL DEL COBRE NOTICIAS LA
20160930121718_MERC%202016%2009%2030
20160930121718_MERC%202016%2009%2030

You also want an ePaper? Increase the reach of your titles
YUMPU automatically turns print PDFs into web optimized ePapers that Google loves.
<strong>INFORME</strong> <strong>SEMANAL</strong> <strong>DEL</strong><br />
<strong>MERCADO</strong> <strong>INTERNACIONAL</strong> <strong>DEL</strong> <strong>COBRE</strong><br />
Semana del 26 al 30 de septiembre de 2016<br />
<strong>NOTICIAS</strong> ECONÓMICAS DE <strong>LA</strong> SEMANA CON<br />
INFLUENCIA SOBRE EL PRECIO <strong>DEL</strong> <strong>COBRE</strong><br />
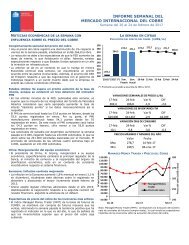
Comportamiento semanal del precio del cobre.<br />
• Esta semana el precio del cobre aumentó levemente en 0,4%,<br />
situándose hoy en ¢US$/lb 219,176. Este incremento se debe a<br />
signos de una estabilización de la economía china, a pesar del<br />
mayor riesgo en los mercados financieros generado por la<br />
debilidad de la banca europea. Además se observa una<br />
tendencia a la baja en los inventarios de las bolsas oficiales.<br />
Estados Unidos: Mejores cifras de crecimiento en el segundo<br />
trimestre.<br />
• La cifra final de crecimiento del PIB Estados Unidos en el<br />
segundo trimestre fue mejor a la estimada inicialmente,<br />
anotando una tasa anual de 1,4% de expansión. El dato<br />
informado el mes pasado fue 1,1%.<br />
• El dato de pedidos de bienes durables cayó levemente en 0,4%<br />
en agosto.<br />
• Las ventas pendientes de casas usadas bajó en agosto 2,4% a<br />
108,5 puntos. Un indicar sobre los 100 puntos evidencia un<br />
mercado inmobiliario sano.<br />
• El índice de confianza del consumidor del Conference Board<br />
aumentó a 104,1 puntos, sobre los 99 esperados. Registrando<br />
el mayor nivel en 9 años.<br />
• Durante su intervención ante la Cámara de Representantes, la<br />
presidenta de la Reserva Federal señaló que la entidad subiría<br />
las tasas de interés este año si los datos macroeconómicos<br />
evolucionan como los últimos meses.<br />
China: Crecimiento 2016 en línea con las estimaciones del<br />
gobierno<br />
• La desaceleración de la economía y la sobrecapacidad industrial<br />
han reducido las oportunidades de inversión en el país, de<br />
acuerdo a un miembro del comité de política monetaria del<br />
banco central chino.<br />
• De acuerdo a la Academia China de Ciencias Sociales, la<br />
economía del país crecería a una tasa interanual de un 6,6% en<br />
el cuarto trimestre. Por su parte, el Banco Asiático de Desarrollo<br />
elevó su pronóstico de crecimiento a 6,6% para el año 2016,<br />
desde el 6,5% estimado previamente.<br />
• Las utilidades de las mayores empresas industriales subieron un<br />
19,5% en agosto con respecto al año anterior, dando señales<br />
de una mayor estabilización de la economía.<br />
• El PMI manufacturero elaborado por Caixin/Markit subió a 50,1<br />
puntos, en línea con las estimaciones del mercado.<br />
Eurozona: Debilidad del sistema bancario<br />
• El indicador del clima de negocios de Alemania Ifo del mes de<br />
septiembre aumentó a 109,5 puntos, situándose sobre lo<br />
esperado. Esta cifra atenúa los temores generados por el Brexit.<br />
• El presidente del BCE señaló que las bajas tasas de interés<br />
definidas por la entidad son necesarias para reactivar la<br />
economía.<br />
• El sector bancario europeo nuevamente se encuentra golpeado<br />
por dudas sobre la estabilidad del Deutsche Bank, atendiendo<br />
la fuerte multa que le aplicó la justicia norteamericana<br />
relacionada a la crisis subprime.<br />
Expectativas de precio del cobre de los inversores más<br />
activos.<br />
• El índice Managed Money Trader (MMT) de la bolsa de futuros<br />
de COMEX continúa evidenciando una posición de venta, sin<br />
embargo está es menor a la semana pasada, lo cual refleja<br />
mejores expectativas respecto al precio del cobre por parte de<br />
los inversionistas.<br />
265<br />
255<br />
245<br />
235<br />
225<br />
215<br />
205<br />
195<br />
258,1<br />
<strong>LA</strong> SEMANA EN CIFRAS<br />
EVOLUCIÓN <strong>DEL</strong> PRECIO <strong>DEL</strong> <strong>COBRE</strong><br />
(¢US$/LB)<br />
214,3 216,2 218,0 217,5 216,6 218,1 218,5 219,2<br />
2015 (*)2016 (*) Sem.<br />
Pasada<br />
Sem.<br />
Actual<br />
(*) Promedio acumulado al igual dia de 2015 y 2016.<br />
40.000<br />
30.000<br />
20.000<br />
10.000<br />
0<br />
-10.000<br />
-20.000<br />
-30.000<br />
-40.000<br />
26-sep 27-sep 28-sep 29-sep 30-sep<br />
VARIACIONES <strong>SEMANAL</strong>ES DE PRECIO (c/lb)<br />
23-sep 30-sep Var % DIF<br />
218,4 219,2 0,4 0,8<br />
VARIACIONES DE INVENTARIOS TM<br />
23-sep 30-sep Var % DIF<br />
551.418 543.308 -1,5 -8.111<br />
VARIACIÓN DÍAS DE CONSUMO<br />
23-sep 30-sep Var % DIF<br />
8,8 8,7 -1,1 -0,1<br />
PRECIOS MÁXIMOS Y MÍNIMOS <strong>DEL</strong> AÑO<br />
Valor Fecha<br />
Max 231,5 18-mar-16<br />
Min 195,5 15-ene-16<br />
MANAGED MONEY TRADER Y PRECIO <strong>DEL</strong> <strong>COBRE</strong><br />
N° De Contratos Precio<br />
(c/lb)<br />
Managed Money<br />
Trader<br />
Precio del cobre<br />
-50.000<br />
195<br />
jul-16 ago-16 sep-16<br />
Nota: Managed Money Trader (MMT): corresponde a la evolución del número<br />
neto de contratos de futuros (compra-venta), la cual revela las expectativas<br />
implícitas de los inversores sobre la evolución del precio del cobre.<br />
225<br />
215<br />
205
<strong>INFORME</strong> <strong>SEMANAL</strong> <strong>DEL</strong><br />
<strong>MERCADO</strong> <strong>INTERNACIONAL</strong> <strong>DEL</strong> <strong>COBRE</strong><br />
Semana del 26 al 30 de septiembre de 2016<br />
DETALLE DE INVENTARIOS EN BODEGAS<br />
Al cierre de esta semana los inventarios en las bolsas de metales<br />
registraron una caída de 8.111 toneladas respecto al viernes de<br />
la semana anterior, con un retroceso de 1,5%. La caída tuvo su<br />
origen en las bodegas de la SHFE (-23.722 toneladas). A la fecha<br />
los inventarios acumulan un aumento anual de 65.950 toneladas<br />
de cobre fino (13,8%) respecto del cierre del año 2015.<br />
Bodegas<br />
30-sep<br />
T.M Semana Año Semana Año<br />
Asia 276.825 9.550 197.125 3,6% 247,3%<br />
Dubai<br />
Corea del Sur 136.575 2.650 121.975 2,0% 835,4%<br />
Malasia 78.075 6.875 30.000 9,7% 62,4%<br />
Singapur 62.175 25 49.400 0,0% 386,7%<br />
Estados Unidos 64.075 6.775 -18.625 11,8% -22,5%<br />
Baltimore<br />
Chicago 10.950 100 9.000 0,9% 461,5%<br />
New Orleans 46.575 6.675 -34.150 16,7% -42,3%<br />
Mobile 25<br />
St. Louis<br />
Panamá 2.275 2.275 -57,6%<br />
Europa 31.325 -975 -42.500 -57,6%<br />
Alemania<br />
Bélgica 700 -15.550 -95,7%<br />
España 3.025 3.000 12000,0%<br />
Holanda 5.500 -44.150 -88,9%<br />
Italia 1.300 -5.800 -82%<br />
Reino Unido 20.800 -975 20.000 -4,5% 2500,0%<br />
Suecia<br />
Var. T.M Var. %<br />
Total BML 372.225 15.350 136.000 4,3% 57,6%<br />
Comex 64.025 261 746 0,4% 1,2%<br />
SHFE 107.058 -23.722 -70.796 -18,1% -39,8%<br />
Total 543.308 -8.111 65.950 -1,5% 13,8%<br />
Los warrants cancelados 1 registraron un alza semanal de 40,4%,<br />
totalizando 80.125 toneladas, lo que equivale al 21,5% de los<br />
stocks disponibles en bodegas de la bolsa de metales de Londres.<br />
AGENDA DE <strong>LA</strong> PRÓXIMA SEMANA<br />
Indicadores EE.UU. EUROZONA CHINA<br />
Balanza comercial<br />
•<br />
Desempleo<br />
•<br />
Reservas internacionales<br />
•<br />
Nuevos subsidios de desempleo<br />
•<br />
Pedidos de fábrica<br />
•<br />
PMI (Markit) compuesto • • •<br />
PMI (Markit) manufacturas • • •<br />
PMI (Markit) servicios • • •<br />
Ventas minoristas<br />
•<br />
INDICADORES ECONÓMICOS DE LOS PRINCIPALES<br />
PAÍSES / BLOQUES CONSUMIDORES DE <strong>COBRE</strong><br />
EE.UU. Eurozona China<br />
Var. PIB (% anualizado)<br />
T1-2013 1,1 -1,1 7,7<br />
T2-2013 2,5 -0,6 7,5<br />
T3-2013 4,1 -0,3 7,8<br />
T4-2013 2,6 0,5 7,7<br />
T1-2014 -2,1 0,9 7,4<br />
T2-2014 4,6 0,8 7,5<br />
T3-2014 5,0 0,8 7,3<br />
T4-2014 2,2 0,9 7,3<br />
T1-2015 0,6 1,0 7,0<br />
T2-2015 3,9 1,2 7,0<br />
T3-2015 2,0 1,6 6,9<br />
T4-2015 1,4 1,5 6,9<br />
T1-2016 0,8 1,7 6,7<br />
T2-2016 1,2 1,6 6,7<br />
Producción Industrial (Var. % 12 meses)<br />
ago-15 1,1 0,9 6,1<br />
sep-15 0,4 1,4 5,7<br />
oct-15 0,3 2,3 5,6<br />
nov-15 -1,2 2,0 6,2<br />
dic-15 -1,8 0,3 5,9<br />
ene-16 -1,2 3,0 5,4<br />
feb-16 -1,6 1,1 5,4<br />
mar-16 -1,9 0,1 6,8<br />
abr-16 -1,1 2,0 6,0<br />
may-16 -1,4 0,4 6,0<br />
jun-16 -0,7 0,4 6,2<br />
jul-16 -0,5 -0,6 6,0<br />
ago-16 -1,1 6,3<br />
PMI Manufacturero Markit<br />
jul-15 53,8 52,4 47,8<br />
ago-15 54,0 52,3 47,1<br />
sep-15 53,1 52,0 47,2<br />
oct-15 54,1 52,3 48,3<br />
nov-15 52,8 52,8 48,6<br />
dic-15 51,2 53,2 48,2<br />
ene-16 52,4 52,3 48,4<br />
feb-16 51,3 51,2 48,0<br />
mar-16 51,5 51,6 49,7<br />
abr-16 50,8 53,0 49,4<br />
may-16 50,7 53,1 49,2<br />
jun-16 51,5 52,8 48,6<br />
jul-16 51,8 52,0 49,9<br />
ago-16 52,0 51,7 50,4<br />
China Precio de Viviendas China (Var. % 12 meses)<br />
Mar Abr May Jul<br />
4,9 6,2 6,9 7,3<br />
1<br />
Indicador que anticipa la salida de inventarios respondiendo a expectativas<br />
de demanda.
<strong>INFORME</strong> <strong>SEMANAL</strong> <strong>DEL</strong><br />
<strong>MERCADO</strong> <strong>INTERNACIONAL</strong> <strong>DEL</strong> <strong>COBRE</strong><br />
Semana del 26 al 30 de septiembre de 2016<br />
ESTADÍSTICAS MINERAS<br />
Resumen Anual<br />
PRECIOS<br />
2014 2015 Var. %<br />
Prom. Semana<br />
26/09 al 30/09<br />
Cobre (cUS$/lb) 311,3 249,2 -20,0% 218,0<br />
Oro (US$/Oz Troy) 1.266,1 1.160,6 -8,3% 1.329,1<br />
Plata (US$/Oz Troy) 19,9 15,7 -21,0% 19,3<br />
Molibdeno (US$/lb) 11,9 6,6 -43,9% 6,9<br />
Acero (US$/TM) 415,5 255,0 -38,6% 325,0<br />
Mineral de Hierro (Base 62% US$/TM) 96,8 57,3 -40,8% 55,4<br />
INVENTARIOS EN BOLSA DE METALES<br />
30 de<br />
2014 2015 Var. %<br />
A fin de cada periodo, TM<br />
septiembre<br />
BML 177.025 236.225 33,4% 356.875<br />
COMEX 24.150 64.183 165,8% 63.763<br />
Shanghái 111.915 177.854 58,9% 130.780<br />
Total Inventarios 313.090 478.262 52,8% 551.418<br />
Días de Consumo 5,4 7,6 40,7% 8,8<br />
PRODUCCIÓN CHILENA DE <strong>COBRE</strong><br />
Enero - julio acumulado<br />
2014 2015 Var. %<br />
Miles de TM 2015 2016 Var. %12 m.<br />
Producción Cobre Mina 5.750 5.764 0,3 3.377 3.209 -5,0<br />
Cátodos SX-EW 1.844 1.778 -3,6 1.024 972 -5,1<br />
Concentrados 3.906 3.986 2,0 2.353 2.237 -4,9<br />
Producción Cobre Refinado 2.729 2.688 -1,5 1.513 1.544 2,0<br />
Oro (kg. De fino) 44.115 48.565 10,1 23.239 23.320 0,3<br />
Plata (Kg. De fino) 1.573.584 1.217.780 -22,6 871.700 885.818 1,6<br />
Molibdeno (TM fino) 48.770 52.579 7,8 28.429 33.154 16,6<br />
Concentrados 48.770 52.579 7,8 28.429 33.154 16,6<br />
Óxidos - - -<br />
PRINCIPALES PRODUCTORES DE <strong>COBRE</strong><br />
Enero - julio acumulado<br />
2014 2015 Var. %<br />
Miles de TM 2015 2016 Var. %12 m.<br />
Chile 5.750 5.764 0,3 3.377 3.209 -5,0<br />
Perú 1.380 1.705 23,6 896 1.324 47,7<br />
China 1.632 1.669 2,3 956 964 0,9<br />
Estados Unidos 1.383 1.373 -0,7 787 815 3,6<br />
Total Mundo 18.478 19.265 4,26 11.027 11.683 5,9<br />
PRINCIPALES IMPORTADORES NETOS<br />
Enero - junio acumulado<br />
2014 2015 Var. %<br />
Miles de TM 2015 2016 Var. %12 m.<br />
Refinado 8.314 8.782 5,6 4.363 4.383 0,5<br />
China 3.590 3.678 2,5 1.881 1.679 -10,7<br />
Alemania 664 685 3,3 355 323 -9,0<br />
Estados Unidos 614 664 8,0 285 355 24,7<br />
Italia 622 622 0,1 340 333 -2,3<br />
Blister 1.040 1.010 -2,9 528 490 -7,3<br />
China 585 530 -9,3 316 272 -14,0<br />
Bélgica 225 225 0,1 118 99 -16,3<br />
Canadá 50 71 42,8 24 28 16,7<br />
Corea del Sur 72 65 -8,9 24 37 52,9<br />
Alemania 49 51 2,9 24 37 52,9<br />
Concentrados 6.693 6.862 2,5 3.230 320 -90,1<br />
China 2.966 3.330 12,3 1.359 1.505 10,8<br />
Japón 1.300 1.214 -6,7 680 679 -0,1<br />
España 447 446 -0,4 204 215 5,5<br />
Corea del Sur 395 442 11,9 192 217 13,2<br />
Total Mundo 16.046 16.654 3,8 8.121 5.193 -36,1<br />
Fuentes: World Metal Statistics, BML, Comex, SHFE Y COCHILCO.
<strong>INFORME</strong> <strong>SEMANAL</strong> <strong>DEL</strong><br />
<strong>MERCADO</strong> <strong>INTERNACIONAL</strong> <strong>DEL</strong> <strong>COBRE</strong><br />
Semana del 26 al 30 de septiembre de 2016<br />
ESTADÍSTICAS MINERAS MENSUALES<br />
Últimos 12 meses<br />
PRODUCTOS<br />
2015 2016<br />
PRECIOS Jun Jul Ago Sep Oct Nov Dic Ene Feb Mar Abr Mayo Junio Julio Agosto<br />
Cobre (cUS$/lb) 264,6 247,5 230,8 236,2 236,9 218,1 210,0 202,4 208,5 224,4 220,0 213,6 210,0 220,3 215,8<br />
Oro (US$/Oz Troy) 1.182,2 1.131,6 1.117,5 1.124,9 1.157,1 1.088,4 1.068,3 1.095,7 1.194,9 1.246,3 1.241,5 1.259,8 1.273,6 1.337,4 1.340,8<br />
Plata (US$/Oz Troy) 16,1 15,1 14,9 14,7 15,8 14,5 14,1 14,0 15,1 15,4 16,3 16,9 17,2 19,9 19,6<br />
Molibdeno (US$/lb) 7,0 5,9 5,9 5,7 4,7 4,6 5,1 5,4 5,3 5,4 5,6 7,456 7,3 7,0 7,3<br />
Acero (US$/TM) 168,4 150,0 150,0 156,7 156,7 220,0 220,0 220,0 220,0 114,4 100,0 100,0 325,0 325,0 325,0<br />
Mineral de Hierro (Base 62% US$/TM) 68,9 52,2 55,7 57,0 53,2 46,6 53,2 41,8 47,1 56,3 60,0 54,6 51,7 50,095 56,1<br />
INVENTARIOS EN BOLSA DE METALES<br />
A fin de cada periodo, TM<br />
BML 324.100 345.575 367.650 320.400 267.775 244.375 236.225 242.375 195.625 144.750 149.500 151.725 190.700 210.625 293.525<br />
COMEX 27.324 33.823 33.439 36.426 48.639 65.997 64.183 59.525 61.237 65.309 59.416 55.378 54.688 60.222 61.037<br />
Sanghai 112.925 103.177 123.223 150.321 180.157 187.152 177.854 211.965 276.023 368.725 311.894 221.212 166.105 172.619 165.803<br />
Total Inventarios 464.349 482.575 524.312 507.147 496.571 497.524 478.262 513.865 532.885 578.784 520.810 428.315 411.493 443.466 520.365<br />
Días de Consumo 7,4 7,7 8,4 8,0 7,9 8,0 7,6 8,2 8,4 9,1 8,3 6,8 6,6 7,1 8,3<br />
PRODUCCIÓN CHILENA DE <strong>COBRE</strong><br />
Miles de TM<br />
Producción Cobre Mina 510 456 456 468 498 484 495 461 447 487 431 472 469 445<br />
Cátodos SX-EW 152 139 143 144 158 155 153 146 135 146 139 140 140 128<br />
Concentrados 358 317 299 324 340 329 342 314 312 340 293 332 329 317<br />
Producción Cobre Refinado 228 204 219 226 246 242 243 226 218 234 224 214 220 208<br />
Oro (kg. De fino) 3.371 3.101 3.346 3.549 3.335 3.771 3.591 3.278 3.579 3.416 3.079 3.207 3.539 3.242<br />
Plata (Kg. De fino) 136.152 129.864 125.591 127.873 125.246 121.519 139.367 124.958 120.174 130.228 127.608 140.529 128.440 113.878<br />
Molibdeno (TM fino) 4.773 4.593 4.291 4.268 5.223 5.345 5.024 4.871 5.150 4.676 4.068 4.560 4.857 4.972<br />
Concentrados 4.773 4.593 4.291 4.267 5.223 5.345 5.024 4.871 5.150 4.676 4.068 4.560 4.857 4.972<br />
Oxidos - - - - - - - - - - - - - -<br />
PRINCIPALES PRODUCTORES DE <strong>COBRE</strong><br />
Miles de TM<br />
Chile 510 456 442 466 497 485 495 461 447 487 431 472 469 445<br />
Perú 146 155 156 148 159 159 187 157 169 188 188 212 207 201,9<br />
China 131 154 154 154 136 153 151 112 112 112 112 112 148 148<br />
Estados Unidos 107 117 117 117 120 116 124 121 118 118 116 120 120 112<br />
Total Mundo 1.627 1.605 1.586 1.606 1.691 1.669 1.739 1.597 1.568 1.700 1.675 1.737 1.722 1.695<br />
PRINCIPALES IMPORTADORES NETOS<br />
Miles de TM<br />
Refinado 675 720 651 547 774 766 803 778 815 968 868 842 857 486<br />
China 255,1 259,7 262,7 352,0 343,5 358,7 423,2 323,9 328,6 458,1 341,7 319,3 305,3 251,2<br />
Alemania 51,2 66,6 60,2 55,8 73,2 73,2 45,1 48,1 89,3 71,3 65,1 49,9 67,5 -<br />
Estados Unidos 56,4 77,8 45,2 47,1 45,0 43,5 44,8 56,0 43,8 43,4 52,4 52,4 63,4 68,2<br />
Italia 53,8 57,4 26,3 60,3 49,9 49,9 37,2 50,4 54,8 62,0 60,5 55,6 58,3 -<br />
Blister 70 83 84 56 55 58 105 106 87 116 90 89 106 73<br />
China 42,3 37,1 32,4 47,6 33,6 55,2 52,6 67,7 55,9 67,2 57,7 56,5 67,0 56,7<br />
Bélgica 15,2 20,7 21,2 21,7 21,4 65,2 52,6 21,1 11,5 17,4 10,1 15,5 15,6 -<br />
Canadá 0,6 7,8 11,4 1,3 10,4 1,7 10,6 0,6 1,0 13,5 0,8 1,3 1,0 0,3<br />
Corea del Sur 1,4 5,6 5,8 6,8 4,9 0,3 5,1 10,4 8,1 11,3 7,2 8,6 11,1 14,6<br />
Alemania 6,4 3,8 5,4 5,0 5,0 6,3 3,9 1,5 6,4 2,0 3,2 3,0 2,6 -<br />
Concentrados 538 592 574 465 567 568 670 604 645 589 524 519 516 428<br />
China 247,1 241,5 288,0 303,4 263,2 359,3 369,3 292,6 364,5 343,6 315,6 357,6 337,8 345,2<br />
Japón 126,4 106,5 104,0 106,0 94,5 46,8 80,5 110,0 124,2 97,0 107,2 113,8 127,0 -<br />
España 19,7 60,0 29,4 23,7 43,6 40,4 32,1 53,3 21,7 34,3 38,9 32,3 36,4 -<br />
Corea del Sur 34,7 41,6 35,2 33,9 43,8 35,3 35,9 33,9 30,6 39,0 35,1 34,1 36,3 37,0<br />
Total Mundo 1.283 1.396 1.309 1.067 1.395 1.392 1.578 1.488 1.547 1.673 1.482 1.450 1.479 987<br />
Fuentes: World Metal Statistics, BML, Comex, SHFE y COCHILCO.