

Guia-de-Negocios-e-Inversion-en-el-Peru-2014-2015

Create successful ePaper yourself
Turn your PDF publications into a flip-book with our unique Google optimized e-Paper software.
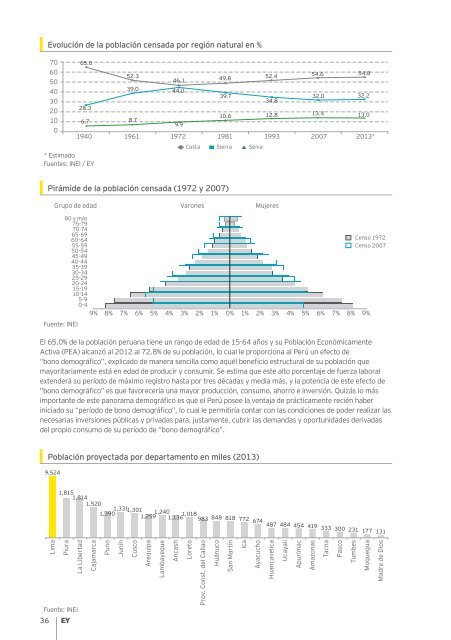
Evolución <strong>de</strong> la población c<strong>en</strong>sada por región natural <strong>en</strong> %<br />
70 65.0<br />
60<br />
50<br />
40<br />
30<br />
20<br />
10<br />
0<br />
28.3<br />
* Estimado<br />
Fu<strong>en</strong>tes: INEI / EY<br />
6.7 8.7<br />
1940<br />
52.3<br />
39.0<br />
46.1<br />
44.0<br />
9.9<br />
49.8 52.4<br />
39.7<br />
10.6<br />
34.8<br />
12.8 13.4<br />
32.0 32.2<br />
1961 1972 1981 1993 2007 2013*<br />
Costa<br />
Sierra<br />
S<strong>el</strong>va<br />
54.6<br />
54.8<br />
13.0<br />
Pirámi<strong>de</strong> <strong>de</strong> la población c<strong>en</strong>sada (1972 y 2007)<br />
Grupo <strong>de</strong> edad Varones Mujeres<br />
Fu<strong>en</strong>te: INEI<br />
80 y más<br />
75-79<br />
70-74<br />
65-69<br />
60-64<br />
55-59<br />
50-54<br />
45-49<br />
40-44<br />
35-39<br />
30-34<br />
25-29<br />
20-24<br />
15-19<br />
10-14<br />
5-9<br />
0-4<br />
9%<br />
8% 7% 6% 5% 4% 3% 2% 1% 0% 1% 2% 3% 4% 5% 6% 7% 8% 9%<br />
C<strong>en</strong>so 1972<br />
C<strong>en</strong>so 2007<br />
El 65.0% <strong>de</strong> la población peruana ti<strong>en</strong>e un rango <strong>de</strong> edad <strong>de</strong> 15-64 años y su Población Económicam<strong>en</strong>te<br />
Activa (PEA) alcanzó al 2012 al 72.8% <strong>de</strong> su población, lo cual le proporciona al Perú un efecto <strong>de</strong><br />
“bono <strong>de</strong>mográfico”, explicado <strong>de</strong> manera s<strong>en</strong>cilla como aquél b<strong>en</strong>eficio estructural <strong>de</strong> su población que<br />
mayoritariam<strong>en</strong>te está <strong>en</strong> edad <strong>de</strong> producir y consumir. Se estima que este alto porc<strong>en</strong>taje <strong>de</strong> fuerza laboral<br />
ext<strong>en</strong><strong>de</strong>rá su período <strong>de</strong> máximo registro hasta por tres décadas y media más, y la pot<strong>en</strong>cia <strong>de</strong> este efecto <strong>de</strong><br />
”bono <strong>de</strong>mográfico” es que favorecería una mayor producción, consumo, ahorro e inversión. Quizás lo más<br />
importante <strong>de</strong> este panorama <strong>de</strong>mográfico es que <strong>el</strong> Perú posee la v<strong>en</strong>taja <strong>de</strong> prácticam<strong>en</strong>te recién haber<br />
iniciado su “período <strong>de</strong> bono <strong>de</strong>mográfico”, lo cual le permitiría contar con las condiciones <strong>de</strong> po<strong>de</strong>r realizar las<br />
necesarias inversiones públicas y privadas para, justam<strong>en</strong>te, cubrir las <strong>de</strong>mandas y oportunida<strong>de</strong>s <strong>de</strong>rivadas<br />
<strong>de</strong>l propio consumo <strong>de</strong> su período <strong>de</strong> “bono <strong>de</strong>mográfico”.<br />
Población proyectada por <strong>de</strong>partam<strong>en</strong>to <strong>en</strong> miles (2013)<br />
9,524<br />
1,815<br />
1,814<br />
1,520<br />
1,390 1,331 1,301<br />
1,259 1,240 1,136 1,018 848 983 818 772 674 487 484 454 419 333 300 231 177 131<br />
Lima<br />
Piura<br />
La Libertad<br />
Cajamarca<br />
Fu<strong>en</strong>te: INEI<br />
36<br />
Puno<br />
Junín<br />
Cusco<br />
Arequipa<br />
Lambayeque<br />
Ancash<br />
Loreto<br />
Prov. Const. <strong>de</strong>l Callao<br />
Huánuco<br />
San Martín<br />
Ica<br />
Ayacucho<br />
Huancav<strong>el</strong>ica<br />
Ucayali<br />
Apurímac<br />
Amazonas<br />
Tacna<br />
Pasco<br />
Tumbes<br />
Moquegua<br />
Madre <strong>de</strong> Dios