134 Annexe 1 suite : Fiches techniques sur les ... - OceanDocs
134 Annexe 1 suite : Fiches techniques sur les ... - OceanDocs
134 Annexe 1 suite : Fiches techniques sur les ... - OceanDocs

Create successful ePaper yourself
Turn your PDF publications into a flip-book with our unique Google optimized e-Paper software.
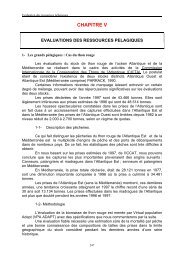
60000<br />
50000<br />
40000<br />
30000<br />
20000<br />
10000<br />
0<br />
Remarques :<br />
1990<br />
1991<br />
1992<br />
1993<br />
1994<br />
1995<br />
1996<br />
1997<br />
1998<br />
1999<br />
2000<br />
ann es<br />
ORIGINE INDETERMINE<br />
SENEGAL<br />
ITALIE<br />
ILES CANARIES<br />
FRANCE<br />
ESPAGNE<br />
Figure 38 : Evolution des exportations de poutargue par pays (source douanes)<br />
• <strong>sur</strong> le plan quantitatif : très large sous estimations ;<br />
• <strong>sur</strong> le plan des débouché commerciaux : absence de débouchés mentionnés <strong>sur</strong> <strong>les</strong><br />
marchés asiatiques (Thaïlande) ?<br />
• Estimation « biologique ».<br />
En 2003, à partir de la base de donnée biologie Sex ratio, RGS et des estimations de captures<br />
de mulets faites lors du GT IMROP 2002 Qté poutargue = Qté mulet pêché en poids vif<br />
X 0,0057] : estimation à environ 810 tonnes<br />
• Estimation empirique.<br />
Selon la FNP (à partir des observations) : Qté poutargue = 12 à 15 % Qté mulet pêché pendant<br />
la période poutargue [octobre - mars]<br />
Production mulet<br />
p r iode poutargue<br />
Quantit<br />
poutargue<br />
estim e en<br />
tm (12% )<br />
Quantit<br />
poutargue<br />
estim e en<br />
tm (15%)<br />
Campagne 2000/2001 8 308 997 1 246<br />
Campagne 2001/2002 8 934 1 072 1 340<br />
Campagne 2002/2003 12 219 1 466 1 833<br />
Campagne 2003/2004 11 553 1 386 1 733<br />
142