- Page 1 and 2: SYSTEME AQUIFERE DU SAHARA SEPTENTR
- Page 3 and 4: II.2 - Structure du Graben de Hun 6
- Page 5 and 6: IX. 2 - Effets de l’hypothèse fo
- Page 7 and 8: INTRODUCTION 1970-2000, trente ans
- Page 9 and 10: 1 E PARTIE CARACTERISATION DU SYSTE
- Page 11 and 12: juxtaposition de réservoirs param
- Page 13 and 14: I.2.1 - La caractérisation hydrog
- Page 15 and 16: Cette définition du Continental In
- Page 17 and 18: • Le Cénomanien : retour de la s
- Page 19 and 20: • Le Sénonien inférieur (format
- Page 21 and 22: Fig. 9 : Coupe méridienne N-S (Mé
- Page 23 and 24: TUNISIE Unité stratigraphique Unit
- Page 25 and 26: Si l’on exclut les aquifères à
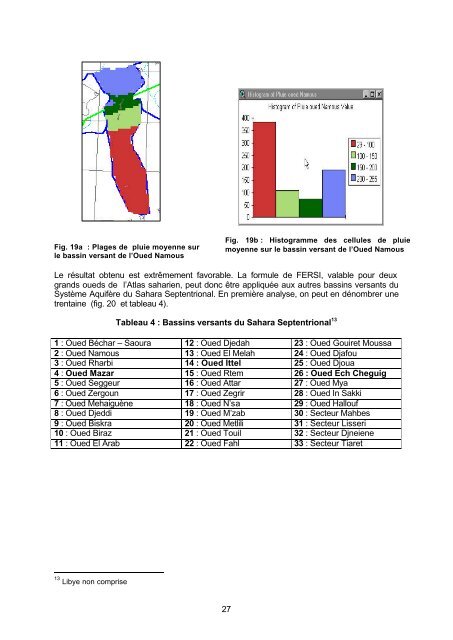
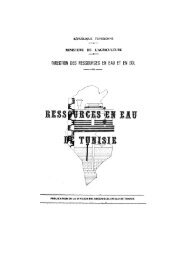
- Page 27 and 28: III - CARACTERISATION HYDROLOGIQUE
- Page 29 and 30: avec Lr : lame ruisselée moyenne e
- Page 31: Fig.18 : les Bassins du versant sud
- Page 35 and 36: Les commentaires du projet ERESS su
- Page 37 and 38: Fig. 22 : Affleurements perméables
- Page 39 and 40: D’autres chercheurs font abstract
- Page 41 and 42: IV - CARACTERISATION HYDRODYNAMIQUE
- Page 43 and 44: Fig. 27: Aquifère du crétacé inf
- Page 45 and 46: IV.2 - Carte piézométrique du CT
- Page 47 and 48: Fig. 33 : Piézometrie de l’aquif
- Page 49 and 50: Fig. 36 : Age des eaux du CI d’ap
- Page 51 and 52: Pays Identifiant Nom ou localisatio
- Page 53 and 54: Fig. 38 : Courbe de distribution de
- Page 55 and 56: Fig. 42: Extension (en vert) de la
- Page 57 and 58: 175 165 155 Chott Fedjej Fig.46 145
- Page 59 and 60: Groupe EL OUED 75 70 GUEMAR 1 H0110
- Page 61 and 62: IV.7 - Historiques des prélèvemen
- Page 63 and 64: L’évolution des prélèvements p
- Page 65 and 66: CHAPITRE 1 - CONSTRUCTION DU MODELE
- Page 67 and 68: 1- Demeurer dans la filiation gén
- Page 69 and 70: Fig. 59 : Coupe N-S dans l’Oued R
- Page 71 and 72: pouvait être intégré au Purbecko
- Page 73 and 74: III - EXTENSION ET DELIMITATION DES
- Page 75 and 76: IV - DISCRETISATION DE L’ESPACE E
- Page 77 and 78: V - LE LOGICIEL DE SIMULATION Etant
- Page 79 and 80: • Limite Est Il n’existe pas de
- Page 81 and 82: • Limite Ouest et Sud-Ouest Elle
- Page 83 and 84:
• Des trois modèles monocouches
- Page 85 and 86:
Fig. 71 : Epaisseurs (en m) des for
- Page 87 and 88:
II - LES PRINCIPALES ETAPES DU CALA
- Page 89 and 90:
endroit de fortes transmissivités
- Page 91 and 92:
Ce Modèle du 30 Septembre peut don
- Page 93 and 94:
tableau 14 : écarts entre modèle
- Page 95 and 96:
Les valeurs des Niveaux Piézométr
- Page 97 and 98:
Enfin sur la même grille, à l’i
- Page 99 and 100:
Fig. 76 : correction de l’effet d
- Page 101 and 102:
Fig. 80 : CT - Régime Permanent -
- Page 103 and 104:
fig.81 : Piézometrie 1950 du Turon
- Page 105 and 106:
Fig. 85 : coefficients de Drainance
- Page 107 and 108:
imposé sont transformées en condi
- Page 109 and 110:
Fig. 86 : Piézométrie retenues po
- Page 111 and 112:
V.2.2.1.3 - Continental Intercalair
- Page 113 and 114:
Fig. 87 : CT - Coefficients d’emm
- Page 115 and 116:
Fig. 90 : CI - Algérie 0 0 20 40 6
- Page 117 and 118:
Fig. 92 : Grès Supérieurs 0 20 40
- Page 119 and 120:
Fig. 94 : CT - Algérie 0 10 20 30
- Page 121 and 122:
VI.2 - La Carte des Rabattements 19
- Page 123 and 124:
Etant donné qu’un rabattement ex
- Page 125 and 126:
Fig. 100-a Fig. 100-b 120
- Page 127 and 128:
3 E PARTIE REALISATION DES SIMULATI
- Page 129 and 130:
un accroissement régulier des pré
- Page 131 and 132:
• A l’horizon 2030, la demande
- Page 133 and 134:
Fig.102 : Localisation du Champ cap
- Page 135 and 136:
Simulation Zéro Tab. 22 : Récapit
- Page 137 and 138:
Fig. 105 Fig. 106 132
- Page 139 and 140:
Fig. 109 II.1.2 - Résultats en ter
- Page 141 and 142:
III.2 - Résultats en termes de Rab
- Page 143 and 144:
Complexe Terminal Fig.112 Fig.113 1
- Page 145 and 146:
IV - ALGERIE : HYPOTHESE FAIBLE IV.
- Page 147 and 148:
Fig.120 V - LIBYE : GHADAMÈS FIELD
- Page 149 and 150:
Fig.123 VII - EVOLUTION TEMPORELLE
- Page 151 and 152:
VII.2 - Complexe Terminal 2000 2010
- Page 153 and 154:
IX - ANALYSE DES RESULTATS DES SIMU
- Page 155 and 156:
fig. 129 : limite d’extension de
- Page 157 and 158:
Si la Libye n’est pratiquement pa
- Page 159 and 160:
CHAPITRE II : MINIATURISATION DU MO
- Page 161 and 162:
La connaissance des coefficients ai
- Page 163 and 164:
Fig. 134 : RAYONS d’INFLUENCE dan
- Page 165 and 166:
III.2 - Linéarité des écoulement
- Page 167 and 168:
700 Pompage à Chott Fejej : Courbe
- Page 169 and 170:
ZELFANA : Fractions en % du rabatte
- Page 171 and 172:
• Inventaire des sites en Tunisie
- Page 173 and 174:
Fig.145 : Sites de Pompage dans le
- Page 175 and 176:
Fig. 146 : Convertisseur Débits-Ra
- Page 177 and 178:
Le point correspondant à l’horiz
- Page 179 and 180:
CHAPITRE III - DEFINITION ET REALIS
- Page 181 and 182:
Fig. 150 Fig. 151 176
- Page 183 and 184:
Le Bilan de cette simulation s’é
- Page 185 and 186:
Simulation 4 : Le CI dans l’ensem
- Page 187 and 188:
Entrées (m 3 /s) Alimentation Drai
- Page 189 and 190:
Fig. 157 Simulation 7 : Résorption
- Page 191 and 192:
Simulation 8 : Exploitation d’Ens
- Page 193 and 194:
Cas d’un Pompage graduellement va
- Page 195 and 196:
Le Bilan de la simulation s’écri
- Page 197 and 198:
Simulation 4 : Champ captant de Oue
- Page 199 and 200:
Fig. 168 Fig. 169 194
- Page 201 and 202:
• au niveau du débit des exutoir
- Page 203 and 204:
• au niveau du débit des exutoir
- Page 205 and 206:
• au niveau du débit des exutoir
- Page 207 and 208:
• au niveau des interférences en
- Page 209 and 210:
4 E PARTIE REPRESENTATIVITE DU MODE
- Page 211 and 212:
I - TRANSMISSIVITES ET DEBIT DE L
- Page 213 and 214:
Tous ces écrits semblent converger
- Page 215 and 216:
II - EMMAGASINEMENT EN NAPPE LIBRE
- Page 217 and 218:
Limite du COD sous le CI IV - LIMIT
- Page 219 and 220:
Niveau Piézometrique Simulation CI
- Page 221 and 222:
Le calage du modèle dans la régio
- Page 223 and 224:
En effet, en Algérie la zone des c
- Page 225 and 226:
‣ sur les autres limites, le mod
- Page 227 and 228:
X - COMPARAISON DES MODELES On peut
- Page 229 and 230:
XII - L’EMMAGASINEMENT DANS LES A
- Page 231 and 232:
1 avec T 1 ' = αT et α T T π 2 2
- Page 233 and 234:
Sénonien lagunaire - coefficients
- Page 235 and 236:
• au CT : en Tunisie, Il a fallu
- Page 237 and 238:
Poids du COD Le Cambro-Ordovicien c
- Page 239 and 240:
Réserves du Bassin Occidental Les
- Page 241 and 242:
N° Identification Longitude Lamber
- Page 243 and 244:
N° Identification Longitude Lamber
- Page 245 and 246:
ANNEXE : 2 Transmissivités du Cont
- Page 247 and 248:
N° P Numéro Nom Tx 10 -3 m 2 /s O
- Page 249 and 250:
N° Identification_ Référence Lon
- Page 251 and 252:
ANNEXE 5 Transmissivités du Comple
- Page 253 and 254:
N° Pays NCLAS Nom TxE -3 m 2 /s Or
- Page 255 and 256:
ANNEXE 7 Calage en Régime Permanen
- Page 257 and 258:
Tableau 2 : Nappe du Continental In
- Page 259 and 260:
Tableau 3 : Nappe du Turonien Name
- Page 261 and 262:
CI - Algérie CI - Tunisie nom BOU
- Page 263 and 264:
CT - TUNISIE 2 1981 78.62 78.6 78.6
- Page 265 and 266:
ANNEXE 9 : Piézomètres de Référ
- Page 267 and 268:
ANNEXE 10 Annexe 10.1 : CI : Potent
- Page 269:
Annexe 10.5 : CT : Potentiels Impos