Rapport annuel 2010 de TELNET HOLDING
Rapport annuel 2010 de TELNET HOLDING
Rapport annuel 2010 de TELNET HOLDING

Create successful ePaper yourself
Turn your PDF publications into a flip-book with our unique Google optimized e-Paper software.
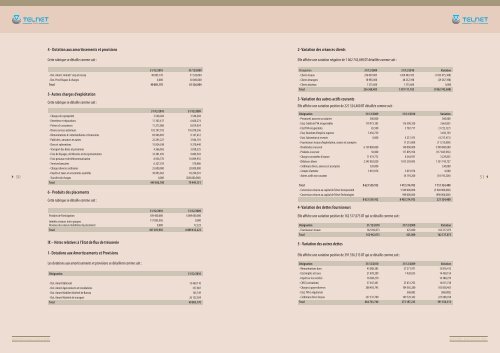
4 - Dotation aux amortissements et provisions<br />
2- Variation <strong>de</strong>s créances clients<br />
Cette rubrique se détaille comme suit :<br />
Elle affiche une variation négative <strong>de</strong> 1 062 742,698 DT détaillée comme suit :<br />
50<br />
31/12/<strong>2010</strong> 31/12/2009<br />
- Dot. Amort. Immob° corp et incorp 40 085,170 31 526,004<br />
- Dot. Prov Risques & charges 0,000 30 000,000<br />
Total 40 085,170 61 526,004<br />
5- Autres charges d’exploitation<br />
Cette rubrique se détaille comme suit :<br />
31/12/<strong>2010</strong> 31/12/2009<br />
- Charges <strong>de</strong> copropriété 3.540,284 3.540,284<br />
- Entretiens et réparations 11.103,417 6.660,274<br />
- Primes d>assurances 11.275,086 8.819,924<br />
- Divers services extérieurs 192.197,192 176.078,246<br />
- Rémunérations d>intermédiaires et honoraires 83.966,893 9.147,612<br />
- Publicités, annonces et autres 22.293,227 3.944,101<br />
- Dons et subventions 15.924,248 9.370,440<br />
- Transport <strong>de</strong>s biens et personnes 4.366,965 3.038,525<br />
- Frais <strong>de</strong> Voyages, <strong>de</strong> Missions et <strong>de</strong> représentation 33.381,495 9.089,503<br />
- Frais postaux et <strong>de</strong> télécommunication 8.936,770 10.899,935<br />
- Services bancaires 6.327,559 570,086<br />
- Charges diverses ordinaires 25.000,000 20.000,000<br />
- Impôts et taxes et versements assimilés 30.993,062 18.290,201<br />
- Transfert <strong>de</strong> charges 0,000 (200.000,000)<br />
Total 449 306,198 79 449,131<br />
6 - Produits <strong>de</strong>s placements<br />
Cette rubrique se détaille comme suit :<br />
31/12/<strong>2010</strong> 31/12/2009<br />
Produits <strong>de</strong> Participation 189 400,000 6 089 600,000<br />
Intérêts créances inter-groupes 117 895,956 0,000<br />
Revenus <strong>de</strong>s valeurs mobilières <strong>de</strong> placement 0,000 12,223<br />
Total 307 295,956 6 089 612,223<br />
Désignation 31/12/2009 31/12/<strong>2010</strong> Variation<br />
- Clients locaux 236 007,805 1 269 483,105 (1 033 475,300)<br />
- Clients étrangers 18 985,000 48 252,398 (29 267,398)<br />
- Clients douteux 1 375,600 1 375,600 0,000<br />
Total 256 368,405 1 319 111,103 (1 062 742,698)<br />
3- Variation <strong>de</strong>s autres actifs courants<br />
Elle affiche une variation positive <strong>de</strong> 221 324,400 DT détaillée comme suit :<br />
Désignation 31/12/2009 31/12/<strong>2010</strong> Variation<br />
- Personnel, avances sur salaires 300,000 300,000<br />
- Etat, Crédit <strong>de</strong> TVA récupérables 119 973,185 116 309,350 3 663,835<br />
- Etat TVA récupérables 65,590 3 787,717 (3 722,127)<br />
- Etat, Excé<strong>de</strong>nt d’impôt à reporter 3 450,759 3 450,759<br />
- Etat, Subvention à recevoir 0,000 4 217,473 (4 217,473)<br />
- Fournisseurs locaux d’exploitation, avance et acomptes 11 215,000 (11 215,000)<br />
- Divi<strong>de</strong>n<strong>de</strong>s à recevoir 6 139 800,000 140 000,000 5 999 800,000<br />
- Produits à recevoir 50,000 117 895,956 (117 845,956)<br />
- Charges constatées d’avance 11 474,772 8 244,937 3 229,835<br />
- Débiteurs divers 2 345 002,820 1 013 259,093 1 331 743,727<br />
- Créditeurs divers, avances et acomptes 330,000 330,000<br />
- Compte d’attente 3 091,976 3 091,976 0,000<br />
- Autres actifs non courants 54 193,200 (54 193,200)<br />
Total 8 623 539,102 1 472 214,702 7 151 324,400<br />
- Conversion créance au capital <strong>de</strong> Telnet Incorporated 5 940 000,000 (5 940 000,000)<br />
- Conversion créance au capital <strong>de</strong> Telnet Technologies 990 000,000 (990 000,000)<br />
8 623 539,102 8 402 214,702 221 324,400<br />
4- Variation <strong>de</strong>s <strong>de</strong>ttes fournisseurs<br />
Elle affiche une variation positive <strong>de</strong> 162 517,073 DT qui se détaille comme suit :<br />
Désignation 31/12/<strong>2010</strong> 31/12/2009 Variation<br />
- Fournisseurs locaux 162 942,073 425,000 162 517,073<br />
Total 162 942,073 425,000 162 517,073<br />
51<br />
IX – Notes relatives à l’Etat <strong>de</strong> flux <strong>de</strong> trésorerie<br />
5 - Variation <strong>de</strong>s autres <strong>de</strong>ttes<br />
1- Dotations aux Amortissements et Provisions<br />
Elle affiche une variation positive <strong>de</strong> 391 556,513 DT qui se détaille comme suit :<br />
Les dotations aux amortissements et provisions se détaillent comme suit :<br />
Désignation 31/12/<strong>2010</strong><br />
- Dot. Amort Bâtiment 13 469,110<br />
- Dot. Amort Agencements et installations 337,807<br />
- Dot. Amort Mobilier Matériel <strong>de</strong> Bureau 145,749<br />
- Dot. Amort Matériel <strong>de</strong> transport 26 132,504<br />
Total 40 085,170<br />
Désignation 31/12/<strong>2010</strong> 31/12/2009 Variation<br />
- Rémunérations dues 43 088,383 27 271,971 15 816,412<br />
- Etat impôts et taxes 21 878,209 7 420,055 14 458,154<br />
- Impôt sur les sociétés 16 388,270 16 388,270<br />
- CNSS (cotisations) 37 647,441 23 631,703 14 015,738<br />
- Charges à payer diverses 208 403,743 104 565,280 103 838,463<br />
- Etat, TVA à régulariser 568,882 (568,882)<br />
- Créditeurs divers locaux 337 337,700 109 729,342 227 608,358<br />
Total 664 743,746 273 187,233 391 556,513<br />
RAPPORT D’ACTIVITE <strong>2010</strong><br />
RAPPORT D’ACTIVITE <strong>2010</strong>