etude et performance du soft handover dans le reseau umts
etude et performance du soft handover dans le reseau umts
etude et performance du soft handover dans le reseau umts

Create successful ePaper yourself
Turn your PDF publications into a flip-book with our unique Google optimized e-Paper software.
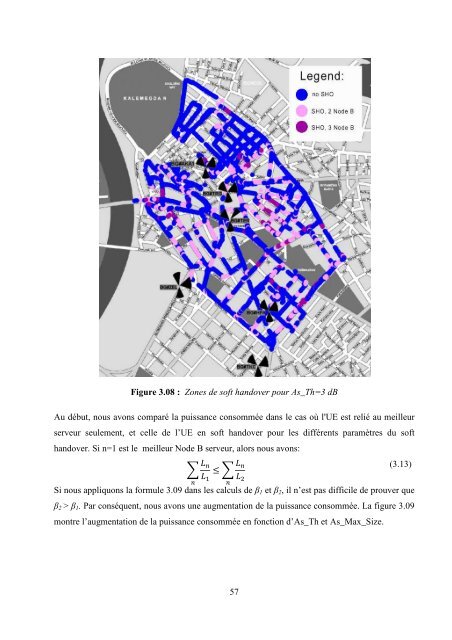
Figure 3.08 : Zones de <strong>soft</strong> <strong>handover</strong> pour As_Th=3 dB<br />
Au début, nous avons comparé la puissance consommée <strong>dans</strong> <strong>le</strong> cas où l'UE est relié au meil<strong>le</strong>ur<br />
serveur seu<strong>le</strong>ment, <strong>et</strong> cel<strong>le</strong> de l’UE en <strong>soft</strong> <strong>handover</strong> pour <strong>le</strong>s différents paramètres <strong>du</strong> <strong>soft</strong><br />
<strong>handover</strong>. Si n=1 est <strong>le</strong> meil<strong>le</strong>ur Node B serveur, alors nous avons:<br />
<br />
≤ <br />
<br />
<br />
<br />
<br />
(3.13)<br />
Si nous appliquons la formu<strong>le</strong> 3.09 <strong>dans</strong> <strong>le</strong>s calculs de β 1 <strong>et</strong> β 2 , il n’est pas diffici<strong>le</strong> de prouver que<br />
β 2 > β 1 . Par conséquent, nous avons une augmentation de la puissance consommée. La figure 3.09<br />
montre l’augmentation de la puissance consommée en fonction d’As_Th <strong>et</strong> As_Max_Size.<br />
57