PDF (Chap. 5,6,7,8, Annexes A,B,C) - Les thèses en ligne de l'INP ...
PDF (Chap. 5,6,7,8, Annexes A,B,C) - Les thèses en ligne de l'INP ...
PDF (Chap. 5,6,7,8, Annexes A,B,C) - Les thèses en ligne de l'INP ...
- No tags were found...

Create successful ePaper yourself
Turn your PDF publications into a flip-book with our unique Google optimized e-Paper software.
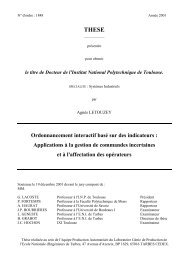
106 CHAPITRE 5. ETUDE EXPÉRIMENTALE DES ACTIONNEURS(a) Atomiseur coaxial (Coax) : Dim<strong>en</strong>sions et vue 3D(b) Vue 3D <strong>de</strong> l’injecteur équipé d’un système <strong>de</strong> déviation(Dev)(c) Vue 3D <strong>de</strong> l’injecteur équipé d’une pastille (Sw)Figure 5.1 – Schéma <strong>de</strong>s trois configurations d’injection (Coax), (Dev) et (Sw)
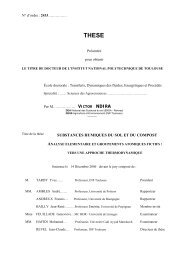
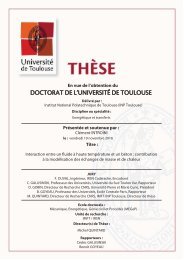
108 CHAPITRE 5. ETUDE EXPÉRIMENTALE DES ACTIONNEURSFarago et Chigier [26] est W e sp = 833. Le spray (Coax) est donc superpulsant.Table 5.2 – Conditions d’écoulem<strong>en</strong>t pour la configuration sans contrôle (Coax)Gaz d’atomisationJet liqui<strong>de</strong>Atomisationṁ g (g/s) 2.14U ginj (m/s) 166Re g 30000ṁ l (g/s) 6.8U l (m/s) 0.962Re l 2886W e sp 833W e 1343Pour les cas avec contrôle, le débit massique <strong>de</strong> gaz est séparé <strong>en</strong>tre l’injecteur : ṁ inj et lesactionneurs :ṁ ac tel que :ṁ g = ṁ inj + ṁ ac (5.2)On caractérise alors l’int<strong>en</strong>sité du contrôle par le paramètre R ac :R ac = ṁacṁ g(5.3)Ce rapport <strong>de</strong> contrôle varie <strong>en</strong>tre 0 et 0.6. L’évaluation du régime d’atomisation n’est pastrès simple pour les cas avec contrôle. L’hypothèse la plus pessimiste consiste à supposer quel’écoulem<strong>en</strong>t issu <strong>de</strong>s jets actionneurs ne participe pas à l’atomisation du jet liqui<strong>de</strong>. Le nombre <strong>de</strong>Weber doit donc être calculé <strong>en</strong> utilisant uniquem<strong>en</strong>t la vitesse débitante <strong>de</strong> gaz dans l’injecteurU ginj . La Figure 5.3 prés<strong>en</strong>te l’évolution <strong>de</strong> ce nombre <strong>de</strong> Weber <strong>en</strong> fonction du rapport <strong>de</strong>contrôle ainsi que les limites du régime fibre et du régime superpulsant (cf. Section 2.2.2 ). Pourtoutes les valeurs <strong>de</strong> R ac , W e reste au <strong>de</strong>ssus <strong>de</strong> la limite pour le régime fibre mais est inférieurau nombre <strong>de</strong> Weber superpulsant W e sp pour R ac < 0.3. Il peut donc se passer une transition<strong>en</strong>tre régime superpulsant et régime fibre pour certaines configurations <strong>de</strong> contrôle, <strong>en</strong> particulierpour les cas avec swirl (Sw) où le rapport <strong>de</strong> contrôle peut atteindre 0.6.5.1.3 Critères d’efficacitéLa Figure prés<strong>en</strong>te <strong>de</strong>s vues strioscopiques <strong>de</strong> trois configurations avec et sans injection <strong>de</strong>liqui<strong>de</strong> : (Coax), (Dev55) pour R ac = 0.2 et (Sw2) pour R ac = 0.5. L’effet souhaité <strong>en</strong> activant lecontrôle est différ<strong>en</strong>t selon le type d’actionneur. Dans le cas (Dev), on cherche à dévier le spraytandis que pour (Sw) on agit sur le mélange <strong>en</strong>tre le spray et le flui<strong>de</strong> ambiant. ceci se caractérisepar une augm<strong>en</strong>tation <strong>de</strong> l’épanouissem<strong>en</strong>t du spray. Toutefois que ce soit dans le cas (Dev) ou(Sw) il faut aussi veiller à ne pas dégra<strong>de</strong>r l’atomisation.
5.1. CONCEPTS 109140012001000Regime superpulsantWe=f(R ac)We=833We=80We800600400Regime fibre20000 0.1 0.2 0.3 0.4 0.5 0.6R acFigure 5.3 – Evolution du nombre <strong>de</strong> Weber W e calculé à partir <strong>de</strong> la vitesse débitante d’airdans l’injecteur U ginj <strong>en</strong> fonction du rapport <strong>de</strong> contrôle R ac .
110 CHAPITRE 5. ETUDE EXPÉRIMENTALE DES ACTIONNEURS(a) (Coax) Rac = 0 (b) (Dev55) Rac = 0.2 (c) (Sw2) Rac = 0.5(d) (Coax) Rac = 0 (e) (Dev55) Rac = 0.2 (f) (Sw2) Rac = 0.5Figure 5.4 – Visualisation strioscopique du jet gazeux et du spray. Ecoulem<strong>en</strong>t sans contrôle (Coax) (gauche) et prés<strong>en</strong>tation <strong>de</strong>s effetsdu contrôle : <strong>de</strong>viation (Dev) (C<strong>en</strong>tre) et swirl (Sw) (Droite).
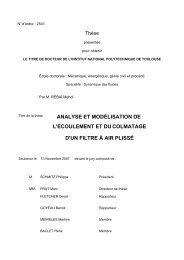
5.2. DÉVIATION DU SPRAY (DEV) 111Epanouissem<strong>en</strong>t du sprayLe contrôle augm<strong>en</strong>te fortem<strong>en</strong>t l’épanouissem<strong>en</strong>t <strong>de</strong> l’écoulem<strong>en</strong>t que ce soit le jet d’air(Figure 5.4(c)) ou le spray (Figure 5.4(f)). Cet effet peut être quantifié par différ<strong>en</strong>tes métho<strong>de</strong>s :traitem<strong>en</strong>t <strong>de</strong>s images <strong>de</strong> strioscopie (contour turbul<strong>en</strong>t du jet d’air chaud ou <strong>en</strong>veloppe <strong>de</strong>sgouttes pour le spray) ou analyse <strong>de</strong>s profils <strong>de</strong> vitesse moy<strong>en</strong>ne du gaz d’atomisation ou <strong>de</strong>sgouttes (largeur <strong>de</strong> <strong>de</strong>mi vitesse). Nous avons choisi d’utiliser les images <strong>de</strong> strioscopie diphasique.Pour chaque point <strong>de</strong> fonctionnem<strong>en</strong>t, une série d’images est moy<strong>en</strong>née et binarisée selon lamétho<strong>de</strong> décrite dans la Section 3.4.3. On <strong>en</strong> déduit la largeur du spray L(z) à la position axialez. On définit alors le coeffici<strong>en</strong>t d’élargissem<strong>en</strong>t Λ Swp (z) :Λ Swp (z) = L(z, R ac) − L(z, 0)L(z, 0)(5.4)où L(z, 0) ets la largeur du spray pour la configuration (Coax).Déviation du sprayLa mesure <strong>de</strong> l’angle <strong>de</strong> déviation peut s’effectuer à partir <strong>de</strong>s images binarisées du spray.Mais l’effet important du contrôle sur la dispersion <strong>de</strong>s gouttes (Figure 5.4(e)) r<strong>en</strong>d son évaluationdélicate. Nous avons préféré utiliser les mesures <strong>de</strong> vitesses axiales <strong>de</strong> gouttes par PDA.La position transverse ypmax du maximum <strong>de</strong> vitesse moy<strong>en</strong>ne axiale W p permet <strong>de</strong> quantifieraisém<strong>en</strong>t l’angle <strong>de</strong> déviation du spray α Devp :( yαpDevmax )p(z) = −atanz(5.5)Effet du contrôle sur la granulométrieLa spécificité <strong>de</strong> cette étu<strong>de</strong> est <strong>de</strong> concevoir un système <strong>de</strong> contrôle pour un spray. <strong>Les</strong>actionneurs agiss<strong>en</strong>t non pas uniquem<strong>en</strong>t sur l’écoulem<strong>en</strong>t <strong>de</strong> gaz mais aussi sur la phase dispersée<strong>en</strong> modifiant la dynamique <strong>de</strong>s gouttes. De plus une partie <strong>de</strong> l’énergie d’atomisation est utiliséepour alim<strong>en</strong>ter les actionneurs. Il faut donc veiller à ce que le dispositif <strong>de</strong> contrôle ne dégra<strong>de</strong> paspas <strong>de</strong> manière trop importante l’atomisation. Pour étudier ces phénomènes, <strong>de</strong>s mesures PDAont été effectuées <strong>en</strong> z/D ge = 8 afin d’<strong>en</strong> extraire <strong>de</strong>s profils radiaux <strong>de</strong> vitesse axiale moy<strong>en</strong>neet RMS <strong>de</strong> goutte d’une part et <strong>de</strong>s profils <strong>de</strong> diamètres moy<strong>en</strong>s :D 10 et D 32 d’autre part.5.2 Déviation du spray (Dev)5.2.1 Effet du diamètre <strong>de</strong> sortie sur la déviationL’effet principal recherché pour les actionneurs (Dev) est <strong>de</strong> dévier le spray. Il est donc important<strong>de</strong> vérifier si les <strong>de</strong>ux pastilles (Dev55) et (Dev75) permett<strong>en</strong>t ce résultat. La Figure5.5 prés<strong>en</strong>te <strong>de</strong>s visualisations <strong>de</strong> l’écoulem<strong>en</strong>t actionné pour chaque configuration. <strong>Les</strong> prises <strong>de</strong>vues ont d’abord été effectuées sur le jet d’air d’atomisation chauffé sans injection <strong>de</strong> gouttes(Strioscopie monophasique) puis sur le spray (Strioscopie diphasique). <strong>Les</strong> rapports <strong>de</strong> contrôlesont R ac = 0.2 et 0.4.
112 CHAPITRE 5. ETUDE EXPÉRIMENTALE DES ACTIONNEURS<strong>Les</strong> images <strong>de</strong> strioscopie monophasique montr<strong>en</strong>t que le jet d’air est dévié vers le bas parles actionneurs. Toutefois les <strong>de</strong>ux configurations (Dev55) et (Dev75) prés<strong>en</strong>t<strong>en</strong>t <strong>de</strong>ux comportem<strong>en</strong>tsdiffér<strong>en</strong>ts. La déviation du jet dans le cas (Dev55) est obt<strong>en</strong>u dès R ac = 0.2 mais ilsemble y avoir une saturation du contrôle pour R ac = 0.4, l’angle du jet ayant peu évolué <strong>en</strong>treles <strong>de</strong>ux valeurs <strong>de</strong> R ac . A l’inverse l’effet <strong>de</strong> déviation généré par l’actionneur (Dev75) est trèsfaible pour R ac = 0.2 et est très fort pour R ac = 0.4.<strong>Les</strong> images <strong>de</strong> strioscopie diphasique (Figures 5.5(c),5.5(d), 5.5(g), 5.5(d) ) mett<strong>en</strong>t aussi<strong>en</strong> évid<strong>en</strong>ce la déviation du spray par les <strong>de</strong>ux dispositifs (Dev). On observe <strong>de</strong> plus un effetimportant <strong>de</strong>s actionneurs sur l’expansion du jet <strong>en</strong> particulier pour les fortes int<strong>en</strong>sités <strong>de</strong>contrôle. Le spray très resserré sans contrôle s’élargit fortem<strong>en</strong>t pour R ac = 0.4. Ceci n’estpas observé sur les images <strong>de</strong> strioscopie monophasique où le jet d’air reste très compact. Ence qui concerne la comparaison <strong>de</strong>s <strong>de</strong>ux configurations (Dev55) et (Dev75), les conclusionssont semblables au gaz. La valeur du diamètre <strong>de</strong> sortie <strong>de</strong> la pastille influe donc fortem<strong>en</strong>tsur la déviation du spray. Lorsque D = D ge l’effet <strong>de</strong> déviation apparaît pour <strong>de</strong>s rapports <strong>de</strong>contrôle faible ; toutefois cela s’accompagne par une faible dynamique du contrôle avec un effet<strong>de</strong> saturation pour R ac = 0.4. En revanche si D > D ge , on peut générer une déviation très fortedu spray sans saturation pour les gran<strong>de</strong>s valeurs <strong>de</strong> R ac mais le contrôle est moins efficace pourles faibles rapports <strong>de</strong> contrôle (R ac < 0.2).5.2.2 Granulométrie du spray déviéLa section précéd<strong>en</strong>te démontre les propriétés <strong>de</strong> déviation du spray <strong>de</strong>s actionneurs (Dev). Ils’agit maint<strong>en</strong>ant d’évaluer l’effet du contrôle sur la granulométrie du spray et sur la dynamique<strong>de</strong>s gouttes.Effet du contrôle sur la vitesse axiale <strong>de</strong>s gouttesLa Figure 5.6 décrit l’évolution <strong>de</strong>s profils selon −→ y <strong>de</strong> vitesse moy<strong>en</strong>ne et RMS axiale pourles configurations (Dev55) et (Dev75). La position axiale <strong>de</strong> ces profils est z/D ge = 8 et lesrapports <strong>de</strong> contrôle prés<strong>en</strong>tés sont R ac = 0, 0.1, 0.2, 0.3. L’effet <strong>de</strong> déviation généré par les actionneursse caractérise par le déplacem<strong>en</strong>t du maximum <strong>de</strong> vitesse moy<strong>en</strong>ne ypmax vers la gauche(y < 0).L’influ<strong>en</strong>ce du diamètre <strong>de</strong> sortie du dispositif <strong>de</strong> contrôle est une nouvelle fois mise<strong>en</strong> évid<strong>en</strong>ce ici. Le cas (Dev55) prés<strong>en</strong>te un saturation <strong>de</strong> l’angle <strong>de</strong> déviation pour R ac > 0.2tandis que l’on observe une translation monotone vers la gauche <strong>de</strong>s profils <strong>de</strong> vitesses du cas(Dev75) (Figure 5.6(c)). Eq. 5.5 permet d’évaluer l’angle <strong>de</strong> déviation αpDev pour chaque point<strong>de</strong> fonctionnem<strong>en</strong>t <strong>de</strong>s <strong>de</strong>ux configurations. Le résultat est reporté sur la Figure 5.7. La pastille(Dev55) permet <strong>de</strong> dévier le jet jusq’à 11 ◦ pour un rapport <strong>de</strong> contrôle R ac < 0.2 puis l’angleαp Dev sature au <strong>de</strong>là. Pour la pastille (Dev75), la déviation atteint 30 ◦ .Toutefois, cette différ<strong>en</strong>ce <strong>de</strong> performance se fait au prix d’une forte modification <strong>de</strong> la dynamique<strong>de</strong>s gouttes pour (Dev75). Pour R ac = 0.2, la configuration (Dev75) prés<strong>en</strong>te une baisse <strong>de</strong>vitesse moy<strong>en</strong>ne W p égale à 56% par rapport à (Coax) (Figure 5.6(c)) sur l’axe du spray dévié.De plus, les profils <strong>de</strong> WpRMS (Figure5.6(d)) s’étal<strong>en</strong>t fortem<strong>en</strong>t dans la direction d’actionnem<strong>en</strong>t<strong>en</strong> <strong>de</strong>v<strong>en</strong>ant très disymétriques et le maximum diminue <strong>de</strong> 35% par rapport à (Coax). Dans lecas d’une application à la combustion <strong>de</strong> (Dev75), le contrôle risque donc <strong>de</strong> modifier les caractéristiques<strong>de</strong> la flamme. En revanche, pour (Dev55) si les effets <strong>de</strong> déviation sont plus modérés,le contrôle <strong>en</strong>traîne une réduction plus limitée <strong>de</strong> la vitesse moy<strong>en</strong>ne <strong>de</strong>s gouttes (20 %) et lesniveaux <strong>de</strong> vitesse RMS sont id<strong>en</strong>tiques à (Coax) avec une très faible déformation. L’utilisation
5.2. DÉVIATION DU SPRAY (DEV) 113(a) (Dev55) - Strioscopie monophasique : R ac = 0.2 (b) (Dev55) - Strioscopie monophasique : R ac = 0.4(c) (Dev55) - Strioscopie diphasique : R ac = 0.2 (d) (Dev55) - Strioscopie diphasique : R ac = 0.4(e) (Dev75) - Strioscopie monophasique : R ac = 0.2 (f) (Dev75) - Strioscopie monophasique : R ac = 0.4(g) (Dev75) - Strioscopie diphasique : R ac = 0.2 (h) (Dev75) - Strioscopie diphasique : R ac = 0.4Figure 5.5 – Strioscopie du jet et du spray déviés : comparaison <strong>en</strong>tre (Dev55) et (Dev75) pourR ac = 0.2 et R ac = 0.4.
114 CHAPITRE 5. ETUDE EXPÉRIMENTALE DES ACTIONNEURS<strong>de</strong> (Dev55) permet donc <strong>de</strong> limiter l’impact du contrôle sur les caractéristiques du spray.5010454035R ac=0R ac=0.1R ac=0.2R ac=0.3987R ac=0R ac=0.1R =0.2 acR =0.3 acWp (m/s)302520W p RM S (m/s)654153102510−40 −30 −20 −10 0 10 20y (mm)(a) Configuration (Dev55) - W p (b) Configuration (Dev55) - W RMS−40 −30 −20 −10 0 10 20y (mm)0p5010454035R ac=0R ac=0.1R =0.2 acR ac=0.3987R ac=0R ac=0.1R ac=0.2R ac=0.3Wp (m/s)302520W p RM S (m/s)654153102510−40 −30 −20 −10 0 10 20y (mm)(c) Configuration (Dev75) - W p (d) Configuration (Dev75)- W RMS−40 −30 −20 −10 0 10 20y (mm)0pFigure 5.6 – Profils <strong>de</strong> vitesse moy<strong>en</strong>ne W p (gauche) et RMS W RMSp (droite) <strong>en</strong> z/D ge = 8pour les configurations (Dev55) (haut) et (Dev75) (bas) : R ac = 0.1, 0.2, 0.3.Effet du contrôle sur la distribution <strong>de</strong> tailleLe contrôle modifie aussi la distribution <strong>de</strong> tailles <strong>de</strong> gouttes. La Figure 5.8 prés<strong>en</strong>te les profils<strong>de</strong> diamètre moy<strong>en</strong> D 10 et <strong>de</strong> Sauter D 32 pour les <strong>de</strong>ux configurations (Dev) <strong>en</strong> z/D ge = 8. <strong>Les</strong>rapports <strong>de</strong> contrôle sont R ac = 0, 0.1, 0.2 et 0.3. L’analyse <strong>de</strong>s courbes <strong>de</strong> D 10 semble montrerdans un premier temps un faible impact du contrôle sur l’atomisation. La valeur du diamètremoy<strong>en</strong> sur l’axe du jet reste stable autour <strong>de</strong> 40 µm pour (Dev55) et diminue légèrem<strong>en</strong>t pour(Dev75). En revanche, le contrôle augm<strong>en</strong>te s<strong>en</strong>siblem<strong>en</strong>t le diamètre <strong>de</strong> Sauter D 32 par rapportà (Coax) <strong>en</strong> particulier pour (Dev75). Ces <strong>de</strong>ux observations sembl<strong>en</strong>t <strong>en</strong> contradiction. Cecis’explique par <strong>de</strong>ux phénomènes antagonistes. La Figure 5.9 prés<strong>en</strong>te la distribution numériquef n sur l’axe du jet <strong>en</strong> z/D ge pour (Coax) et les <strong>de</strong>ux configurations (Dev55) et (Dev75) pourR ac = 0.2. On observe un décalage du pic vers les petites gouttes pour (Dev75) ce qui explique ladiminution <strong>de</strong> D 10 . La limite maximale pour d p sur la Figure 5.9 est <strong>de</strong> 150 µm. <strong>Les</strong> gouttes <strong>de</strong>
5.2. DÉVIATION DU SPRAY (DEV) 1153025Dev55Dev7520α Devp ( ◦ )1510500 0.05 0.1 0.15 0.2 0.25 0.3 0.35 0.4R acFigure 5.7 – Evolution <strong>de</strong> l’angle <strong>de</strong> déviation α Devp <strong>en</strong> fonction du paramètre <strong>de</strong> contrôle R ac .L’estimation <strong>de</strong> cet angle est effectuée à partir <strong>de</strong> la position maximum <strong>de</strong> vitesse moy<strong>en</strong>ne axial<strong>de</strong>s particule W RMSp <strong>en</strong> z/D ge = 8.taille supérieure sont très peu nombreuses et sont quasim<strong>en</strong>t indistinguables sur la distributionnumérique. La Figure 5.10 permet <strong>de</strong> mieux observer l’effet du contrôle sur leur nombre. Cellecimontre les corrélations w p = f(d p ). On note clairem<strong>en</strong>t une augm<strong>en</strong>tation du nombre <strong>de</strong>gouttes dont le diamètre est supérieur à 200 µm. Le poids relatif <strong>de</strong> ces gouttes dans le calculdu diamètre <strong>de</strong> Sauter plus important que pour D 10 . Ceci explique l’augm<strong>en</strong>tation du diamètre<strong>de</strong> Sauter sur la Figure 5.8(d) pour (Dev75) et semble indiquer une dégradation <strong>de</strong> l’atomisationpar le contrôle pour cette configuration. En revanche, cette évolution est moins forte pour laconfiguration (Dev55).
5.2. DÉVIATION DU SPRAY (DEV) 1174.5 x 104 D (µm)4CoaxDev55Dev753.5fn(D) (m −1 )32.521.510.500 50 100 150Figure 5.9 – Distribution numérique <strong>de</strong> taille f n (D) sur l’axe du jet pour R ac = 0.2. Comparaison<strong>de</strong>s cas (Coax) <strong>en</strong> ypmax = 0, (Dev55) et (Dev75) <strong>en</strong> ypmax = −9 mm.(a) Configuration (Coax) - R ac = 0 (b) Configuration (Dev55) - R ac = 0.2(c) Configuration (Dev75) - R ac = 0.2Figure 5.10 – Corrélation w p = f(d p ) sur l’axe du jet <strong>en</strong> z/D ge = 8 : comparaison <strong>de</strong> (Coax)<strong>en</strong> y = 0 (R ac = 0) avec (Dev55) et (Dev75) <strong>en</strong> y = −9 mm pour R = 0.2
118 CHAPITRE 5. ETUDE EXPÉRIMENTALE DES ACTIONNEURS5.3 Contrôle du spray par effet swirl (Sw)5.3.1 Effet <strong>de</strong>s pastillesL’effet principal recherché pour les actionneurs (Sw) est d’améliorer le mélange <strong>en</strong>tre le sprayet son <strong>en</strong>vironnem<strong>en</strong>t. Cela se traduit <strong>en</strong> particulier par une augm<strong>en</strong>tation <strong>de</strong> l’épanouissem<strong>en</strong>t duspray. Il est donc important <strong>de</strong> vérifier si les <strong>de</strong>ux pastilles (Sw2) et (Sw3) permett<strong>en</strong>t ce résultat.La Figure 5.11 prés<strong>en</strong>te <strong>de</strong>s visualisations <strong>de</strong> l’écoulem<strong>en</strong>t actionné pour chaque configuration.<strong>Les</strong> prises <strong>de</strong> vues ont d’abord été effectuées sur le jet d’air d’atomisation chauffé sans injection<strong>de</strong> gouttes (Strioscopie monophasique) puis sur le spray (Strioscopie diphasique). <strong>Les</strong> rapports<strong>de</strong> contrôle sont R ac = 0.2 et 0.5.<strong>Les</strong> images <strong>de</strong> strioscopie monophasique permett<strong>en</strong>t <strong>de</strong> retrouver les résultats obt<strong>en</strong>us parFaivre et Poinsot [14] et Boushaki [16] sur le cas du jet plein avec le même type d’actionneurs. lesvisualisations montr<strong>en</strong>t une désorganisation croissante <strong>de</strong> la turbul<strong>en</strong>ce du jet (Figures 5.11(a),5.11(b), 5.11(e) et 5.11(f)). Pour R ac = 0.5, les <strong>de</strong>ux configurations d’actionneurs génèr<strong>en</strong>t <strong>de</strong>plus un forte augm<strong>en</strong>tation <strong>de</strong> la largeur du jet. Au <strong>de</strong>là <strong>de</strong> ce rapport <strong>de</strong> contrôle, le jet sedésorganise complètem<strong>en</strong>t et son <strong>en</strong>veloppe n’est plus visible. <strong>Les</strong> dispositifs (Sw) permett<strong>en</strong>tdonc <strong>de</strong> modifier fortem<strong>en</strong>t le mélange pour le jet d’air.<strong>Les</strong> images <strong>de</strong> strioscopie diphasique (Figures 5.11(c), 5.11(d), 5.11(g) et 5.11(h)) mett<strong>en</strong>tégalem<strong>en</strong>t <strong>en</strong> évid<strong>en</strong>ce un élargissem<strong>en</strong>t du spray par les pastilles (Sw). Le spray très resserrésans contrôle s’élargit fortem<strong>en</strong>t pour R ac = 0.5. En ce qui concerne la comparaison <strong>de</strong>s <strong>de</strong>uxconfigurations (Sw2) et (Sw3), les images <strong>de</strong> strioscopie sembl<strong>en</strong>t montrer un effet assez équival<strong>en</strong>tsur le spray. La Figure 5.12 prés<strong>en</strong>te l’évolution du facteur d’élargissem<strong>en</strong>t Λ Swp <strong>en</strong> fonctiondu rapport <strong>de</strong> contrôle R ac pour (Sw2) et (Sw3). Λ Swp est calculé par binarisation <strong>de</strong>s imagesmoy<strong>en</strong>nes du spray <strong>en</strong> z/D ge = 8, 12, 16. Pour les <strong>de</strong>ux pastilles, l’évolution <strong>de</strong> Λ Swp est linéaireet ne dép<strong>en</strong>d pas <strong>de</strong> la position, les trois courbes étant superposées. Le coeffici<strong>en</strong>t directeur <strong>de</strong>sdroites est très semblable pour les <strong>de</strong>ux configurations et est égal à 2. En R = 0.4, le swirl génèreune augm<strong>en</strong>tation <strong>de</strong> 40% <strong>de</strong> l’élargissem<strong>en</strong>t du spray.5.3.2 Granulométrie du spray<strong>Les</strong> visualisations <strong>de</strong> strioscopie mett<strong>en</strong>t <strong>en</strong> évid<strong>en</strong>ce l’effet du contrôle sur l’épanouissem<strong>en</strong>tdu spray. mais ne permett<strong>en</strong>t pas d’id<strong>en</strong>tifier <strong>de</strong> différ<strong>en</strong>ces importantes <strong>en</strong>tre les <strong>de</strong>ux configurationstestées : (Sw2) et (Sw3). Cette section se base sur <strong>de</strong>s résultats issus <strong>de</strong> mesures <strong>de</strong> PDA.Son objectif est <strong>de</strong> prés<strong>en</strong>ter l’effet du swirl sur la vitesse axiale <strong>de</strong>s gouttes et sur leur distribution<strong>de</strong> taille mais aussi <strong>de</strong> mettre <strong>en</strong> lumière l’impact du dim<strong>en</strong>sionnem<strong>en</strong>t <strong>de</strong>s actionneurs surla maitrise <strong>de</strong> l’atomisation.5.3.3 Vitesse axiale <strong>de</strong>s gouttesLa Figure 5.13 compare l’évolution du profil radial <strong>de</strong> vitesse axial <strong>de</strong>s gouttes <strong>en</strong> z/D ge = 8lorsque l’int<strong>en</strong>sité du contrôle augm<strong>en</strong>te : R ac = 0 (Coax), 0.2, 0.4, 0.6. Le contrôle par Swirl<strong>en</strong>traîne une forte baisse <strong>de</strong> la vitesse moy<strong>en</strong>ne et RMS sur l’axe du jet. Pour R = 0.4, <strong>en</strong> y = 0le maximum <strong>de</strong> vitesse diminue <strong>de</strong> 56% par rapport à (Coax) pour (Sw2) et <strong>de</strong> 65 % pour (Sw3).Pour R = 0.6 les profils <strong>de</strong>vi<strong>en</strong>n<strong>en</strong>t quasim<strong>en</strong>t plats.5.3.4 Distribution <strong>de</strong> taillesLa Figure 5.14 prés<strong>en</strong>te l’évolution du profil radial du diamètre moy<strong>en</strong> D 10 et <strong>de</strong> Sauter D 32<strong>en</strong> z/D ge pour (Sw2) et (Sw3). <strong>Les</strong> rapports <strong>de</strong> contrôle son R ac = 0.2, 0.4 et 0.6. Comme pour
Figure 5.11 – Strioscopie du jet et du spray avec swirl : comparaison <strong>en</strong>tre (Dev55) et (Dev75)pour R = 0.2 et R = 0.5.5.3. CONTRÔLE DU SPRAY PAR EFFET SWIRL (SW) 119(a) (Sw2) - Strioscopie monophasique :R ac = 0.2(b) (Sw2) - Strioscopie monophasique :R ac = 0.5(c) (Sw2) - Strioscopie diphasique : R ac = 0.2 (d) (Sw2) - Strioscopie diphasique : R ac =0.5(e) (Sw3) - Strioscopie monophasique : R ac =0.2(f) (Sw3) - Strioscopie monophasique : R ac =0.5(g) (Sw3) - Strioscopie diphasique : R ac =0.2(h) (Sw3) - Strioscopie diphasique : R ac =0.5
120 CHAPITRE 5. ETUDE EXPÉRIMENTALE DES ACTIONNEURS10.80.6z/D ge=8z/D ge=12z/D ge=1610.80.6z/D ge=8z/D ge=12z/D ge=16ΛΛ0.40.40.20.200 0.1 0.2 0.3 0.4 0.5 0.6 0.7R ac(a) Configuration (Sw2)00 0.1 0.2 0.3 0.4 0.5 0.6 0.7R ac(b) Configuration (Sw3)Figure 5.12 – Evolution <strong>de</strong> l’élargissem<strong>en</strong>t du spray Λ Swp <strong>en</strong> fonction du rapport <strong>de</strong> contrôleR ac pour 3 positions axiales z/D ge = 8, 12, 16. Comparaison <strong>de</strong>s <strong>de</strong>ux configurations swirl (Sw2)et (Sw3).les configurations (Dev), le contrôle par swirl agit peu sur D 10 , mais fortem<strong>en</strong>t sur le diamètre<strong>de</strong> Sauter D 32 . <strong>Les</strong> conclusions quant à l’effet <strong>de</strong>s actionneurs sur l’atomisation sont d’ailleursid<strong>en</strong>tiques à celles obt<strong>en</strong>ues dans la Section 5.2.2. L’analyse <strong>de</strong> la distribution <strong>de</strong> taille sur l’axe duspray (y = 0) (Figure 5.15) et <strong>de</strong>s corrélations w p = f(d p ) (Figure 5.16) montre respectivem<strong>en</strong>tune augm<strong>en</strong>tation du nombre <strong>de</strong> petites gouttes dans les <strong>de</strong>ux cas (Sw) et une augm<strong>en</strong>tation dunombre <strong>de</strong> grosses gouttes (d p > 150 µm). <strong>Les</strong> actionneurs jet dégrad<strong>en</strong>t donc l’atomisation <strong>en</strong>favorisant la formation <strong>de</strong> grosses gouttes. Toutefois cet effet est moindre pour la pastille (Sw2)que pour la pastille (Sw3).
5.3. CONTRÔLE DU SPRAY PAR EFFET SWIRL (SW) 12150454035R =0 acR ac=0.2R ac=0.4R ac=0.610987R ac=0R ac=0.2R ac=0.4R ac=0.6Wp (m/s)30252015105W p RM S (m/s)6543210−20 −15 −10 −5 0 5 10 15 20y (mm)(a) Configuration (Sw2) - W p (b) Configuration (Sw2) - W RMS−20 −15 −10 −5 0 5 10 15 20y (mm)0p50454035R =0 acR ac=0.2R ac=0.4R =0.6 ac10987R ac=0R ac=0.2R ac=0.4R ac=0.6Wp (m/s)30252015105W p RM S (m/s)6543210−20 −15 −10 −5 0 5 10 15 20y (mm)(c) Configuration (Sw3) - W p (d) Configuration (Sw3)- W RMS−20 −15 −10 −5 0 5 10 15 20y (mm)0pFigure 5.13 – Profils <strong>de</strong> vitesse moy<strong>en</strong>ne W p (gauche) et RMS W RMSp (droite) <strong>en</strong> z/D ge = 8pour les configurations (Sw2) (haut) et (Sw3) (bas) : R ac = 0.2, 0.3, 0.4.
122 CHAPITRE 5. ETUDE EXPÉRIMENTALE DES ACTIONNEURS9080R ac=0R ac=0.2R ac=0.4R ac=0.6240220200R =0 acR ac=0.2R ac=0.4R ac=0.6D10 (µm)7060D32 (µm)180160501401204010030−20 −15 −10 −5 0 5 10 15 20y (mm)(a) Configuration (Sw2) - D 10 (b) Configuration (Sw2) - D 32−20 −15 −10 −5 0 5 10 15 20y (mm)809080R ac=0R ac=0.2R ac=0.4R ac=0.6240220200R ac=0R ac=0.2R ac=0.4R ac=0.6D10 (µm)7060D32 (µm)180160501401204010030−20 −15 −10 −5 0 5 10 15 20y (mm)(c) Configuration (Sw3) - D 10 (d) Configuration (Sw3) - D 32−20 −15 −10 −5 0 5 10 15 20y (mm)80Figure 5.14 – Profils du diamètre moy<strong>en</strong>ne D 10 (gauche) et du diamètre <strong>de</strong> Sauter D 32 (droite)<strong>en</strong> z/D ge = 8 pour les configurations (Sw2) (haut) et (Sw3) (bas) : R ac = 0.2, 0.3, 0.4.
5.3. CONTRÔLE DU SPRAY PAR EFFET SWIRL (SW) 1234.5 x 104 d p (µm)4(Coax)(Sw2)(Sw3)3.5fn(dp) (m −1 )32.521.510.500 50 100 150Figure 5.15 – Distribution numérique <strong>de</strong> taille f n (D) sur l’axe du jet pour R ac = 0.2. Comparaison<strong>de</strong>s cas (Coax) <strong>en</strong> ypmax = 0, (Dev55) et (Dev75) <strong>en</strong> ypmax = −9 mm.(a) Configuration (Coax) - R ac = 0 (b) Configuration (Sw2) - R ac = 0.4(c) Configuration (Sw3) - R ac = 0.4Figure 5.16 – Corrélation w p = f(d p ) sur l’axe du jet <strong>en</strong> z/D ge = 8 : comparaison <strong>de</strong> (Coax)(R ac = 0) avec (Sw2) et (Sw3) pour R ac = 0.4
124 CHAPITRE 5. ETUDE EXPÉRIMENTALE DES ACTIONNEURS5.4 Bilan <strong>de</strong> l’étu<strong>de</strong> paramétrique <strong>de</strong>s actionneursL’étu<strong>de</strong> paramétrique <strong>de</strong>s configurations (Dev) et (Sw) démontre l’efficacité <strong>de</strong>s jets actionneurspour contrôler l’expansion d’un spray. L’utilisation d’un unique jet impactant (Dev), permet<strong>de</strong> dévier le spray jusquà 30 ◦ . De même, la géométrie <strong>de</strong> type (Sw) composée <strong>de</strong> 4 actionneurstang<strong>en</strong>ts permet d’augm<strong>en</strong>ter significativem<strong>en</strong>t le taux d’expansion du spray.Le test <strong>de</strong> 2 pastilles différ<strong>en</strong>tes pour chaque type <strong>de</strong> géométrie permet <strong>de</strong> plus <strong>de</strong> dégagerquelques premières règles <strong>de</strong> dim<strong>en</strong>sionnem<strong>en</strong>t. Le tableau résume le comportem<strong>en</strong>t <strong>de</strong>s 4 configurationtestées. Pour dévier fortem<strong>en</strong>t le spray, il faut augm<strong>en</strong>ter les dim<strong>en</strong>sions <strong>de</strong> la zoned’interaction <strong>en</strong>tre le spray et le jet actionneur. Dans le cas <strong>de</strong>s pastilles (Dev), ceci se traduitpar l’augm<strong>en</strong>tation du diamètre <strong>de</strong> sortie du dispositif D. On évite ainsi tout effet <strong>de</strong> blocagelimitant la déviation (Cas Dev55). Toutefois, augm<strong>en</strong>ter D amplifie l’effet du contrôle sur l’atomisationet la dynamique <strong>de</strong>s gouttes. Si l’on cherche à conserver la même qualité d’atomisationet la même dynamique pour les gouttes, il est préférable <strong>de</strong> conserver D = D ge . Dans le cas ducontrôle par swirl (configurations (Sw)), il faut <strong>en</strong> revanche minimiser le diamètre <strong>de</strong> sortie D etla section (d 3 , d 4 ) <strong>de</strong>s actionneurs pour limiter la dégradation <strong>de</strong> l’atomisation et la réduction <strong>de</strong>vitesse axiale <strong>de</strong>s gouttes.L’<strong>en</strong>semble <strong>de</strong> ces résultats a été utilisé pour dim<strong>en</strong>sionner les systèmes <strong>de</strong> contrôle d’unbrûleur expérim<strong>en</strong>tal chez Air Liqui<strong>de</strong> (<strong>Chap</strong>itre 7). Avant <strong>de</strong> prés<strong>en</strong>ter cette application industrielle,le chapitre suivant propose une comparaison LES/Expéri<strong>en</strong>ce sur 3 cas : (Coax), (Dev55)et (Sw2).
5.4. BILAN DE L’ÉTUDE PARAMÉTRIQUE DES ACTIONNEURS 125Table 5.3 – Bilan <strong>de</strong> l’étu<strong>de</strong> paramétrique. Lég<strong>en</strong><strong>de</strong> : – Forte diminution <strong>de</strong> la gran<strong>de</strong>ur, - Diminution <strong>de</strong> la gran<strong>de</strong>ur, = Peu ou pasd’évolution <strong>de</strong> la gran<strong>de</strong>ur, + augm<strong>en</strong>tation <strong>de</strong> la gran<strong>de</strong>ur, ++ Forte augm<strong>en</strong>tation <strong>de</strong> la gran<strong>de</strong>urAmplitu<strong>de</strong> Dynamique AtomisationNom Contrôle Dim<strong>en</strong>sionsRemarquesdu contrôle Wp W p RMS D10 D32(Dev55) Déviation D = Dge = 5.5mm α pmax Dev = 11 ◦ - = = = Saturation pour Rac > 0.2d1 = 2mmd2 = 3mm(Dev75) Déviation D = 7.5mm α Devpmax = 30 ◦ - - - - - + Peu d’effet <strong>de</strong> déviationd1 = 2mm pour Rac < 0.2d2 = 3mm(Sw2) Swirl D = 7mm Λ Swpmax = 0.8 - - - - = ++ La pastille (Sw2) réduitd3 = 2mm (56% ∗ ) (47% ∗ ) (50% ∗ ) l’impact du contrôle surd4 = 2mm la dynamique et l’atomisation(Sw2) Swirl D = 7mm Λ Swpmax = 0.8 - - - - + ++ du spray tout <strong>en</strong> conservantd3 = 2mm (65% ∗ ) (57% ∗ ) (75% ∗ ) les mêmes performances sur Λ Swpd4 = 3mm * Rac = 0.4 et y = 0
126 CHAPITRE 5. ETUDE EXPÉRIMENTALE DES ACTIONNEURS
<strong>Chap</strong>itre 6Comparison of LES and experim<strong>en</strong>taldataCe chapitre propose une comparaison LES/Expéri<strong>en</strong>ce <strong>de</strong> trois configurations parmi cellesexplorées dans le <strong>Chap</strong>itre 5 : la configuration sans contrôle (Coax) et <strong>de</strong>ux configurations aveccontrôle (Dev55) qui permet <strong>de</strong> dévier le spray et (Sw2) qui introduit un effet <strong>de</strong> swirl dansl’écoulem<strong>en</strong>t et permet <strong>de</strong> modifier le taux <strong>de</strong> mélange et d’expansion du jet. L’objectif est <strong>de</strong>tester si la LES d’un spray actionné, utilisant une formulation Lagrangi<strong>en</strong>ne pour la simulation<strong>de</strong> la phase dispersée, permet <strong>de</strong> prédire les performances <strong>de</strong>s actionneurs. La Section 6.1 comm<strong>en</strong>cepar effectuer quelques rappels sur les trois configurations étudiées (dim<strong>en</strong>sions, débits...)et les métho<strong>de</strong>s expérim<strong>en</strong>tales utilisées : fil chaud et PDA. <strong>Les</strong> principaux paramètres <strong>de</strong>s simulationsnumériques y sont <strong>en</strong>suite prés<strong>en</strong>tés. En particulier, on y détaille la métho<strong>de</strong> d’injection<strong>de</strong>s gouttes dans la LES. La Section 6.2 décrit <strong>en</strong>suite les résultats obt<strong>en</strong>us pour les LES monophasiquessans injection <strong>de</strong> liqui<strong>de</strong>. Cette section a <strong>de</strong>ux objectifs : vali<strong>de</strong>r les développem<strong>en</strong>tseffectués pour l’injection <strong>de</strong> turbul<strong>en</strong>ce dans le cas du jet d’air annulaire (Coax) puis démontrerla capacité <strong>de</strong> la LES à correctem<strong>en</strong>t représ<strong>en</strong>ter l’écoulem<strong>en</strong>t d’air d’atomisation avec et sanscontrôle. Enfin la Section 6.3 décrit les résultats obt<strong>en</strong>us pour la LES avec le spray.127
128 CHAPITRE 6. COMPARISON OF LES AND EXPERIMENTAL DATA6.1 Simulation and experim<strong>en</strong>tal approach6.1.1 Flow configuration and experim<strong>en</strong>tal methodsThe expon<strong>en</strong>tial growth of computer power in the last years has s<strong>en</strong>sibly reduced the costof LES computations. However, calculating all the configurations of <strong>Chap</strong>ter 5 remains out ofreach in the case of the thesis. Therefore, three configurations have be<strong>en</strong> selected to perform LEScomputations :– (Coax) : This configuration corresponds to the injector without any actuation system. It isused as the refer<strong>en</strong>ce case for comparisons with controlled configurations (Figure 6.1(a)).– (Dev55) : This configuration uses a unique radial actuator which <strong>de</strong>viates the main flow(Figure 6.1(b)).– (Sw2) : This configuration is composed of four tang<strong>en</strong>tial jets to add swirl to the flow(Figure 6.1(c)).(a) Coaxial injector (Coax) : geometrical dim<strong>en</strong>sions and 3D visualisation(b) 3D visualisation of the injector with the <strong>de</strong>viationcontrol system (Dev55)(c) 3D visualisation of the injector with the swirlcontrol system (Sw2)Figure 6.1 – Schematic of the flow configurationsCharacteristic dim<strong>en</strong>sions and flow parameters for the three configurations are sumarized intable 6.1. Dim<strong>en</strong>sions of the injector and the liqui<strong>de</strong> and gas flow rates are id<strong>en</strong>tical to <strong>Chap</strong>ter5. For each controlled configuration a unique value of R ac was studied : R ac = 0.2 for (Dev55)and R ac = 0.4 for (Sw2).
6.1. SIMULATION AND EXPERIMENTAL APPROACH 129Table 6.1 – Characteristic dim<strong>en</strong>sions and flow parameters(Coax) (Dev55) (Sw2)D l (mm) 3D gi (mm) 4D ge (mm) 5.5ṁ l (g/s) 6.8U l (m/s) 0.962ṁ g (g/s) 2.14Actuators 0 1 4Dim<strong>en</strong>sions (mm) - d 1 d 2 d 3 d 4- 2 3 2 2D (mm) 5.5 5.5 7R ac 0 0.2 0.4U ginj (m/s) 166 130 100U gac (m/s) 0 66 35To provi<strong>de</strong> experim<strong>en</strong>tal data for the validation of calculations, two test facilities includingthe injector and the control apparatus were built. These facilities and their diagnostic equipm<strong>en</strong>tare <strong>de</strong>tailed in <strong>Chap</strong>ter 3. The first one was <strong>de</strong>dicated to gas velocity measurem<strong>en</strong>ts with hotwireanemometry without spray (Sections 3.3.2 and 3.5). The two-dim<strong>en</strong>sional traversing system<strong>en</strong>ables to trace maps and profiles of averaged hot-wire velocity. The second facility was usedto perform PDA (Phase Doppler Anemometry) measurem<strong>en</strong>ts on the spray and provi<strong>de</strong> dropletsize and axial velocity distributions (Sections 3.3.1 and 3.6).6.1.2 Numerical setupThe computational gridsLES simulations have be<strong>en</strong> performed with and without spray for the three experim<strong>en</strong>talconfigurations (Coax), (Dev55) and (Sw2). Experim<strong>en</strong>tal geometries have be<strong>en</strong> slightly simplifiedbut they all inclu<strong>de</strong> the zone where actuators are mounted (cf. Figure 6.2). As <strong>de</strong>fined in Figure6.1(a), the refer<strong>en</strong>ce point O is at the c<strong>en</strong>ter of the injector exit. For the gaseous computations(without spray), the liquid pipe extremity is replaced by a wall while it corresponds to the plane ofliquid injection for spray computation (cf. Figure 6.3). For the configuration (Coax) the injectorduct l<strong>en</strong>gth is 6mm (Figure 6.2(a)). For the configurations (Dev55) and (Sw2) the injector andactuators pipes are short<strong>en</strong>ed to 3mm (Figures 6.2(b) and 6.2(c)). For all configurations, the restof the computational domain is a cylin<strong>de</strong>r with a radius R box = 0.1 m and a l<strong>en</strong>gth L box = 0.2 m.Geometries are meshed using unstructured tetrahedra. The refinem<strong>en</strong>t is maximal in the injectorand the actuators with a minimal cell volume around 10 −13 m 3 (Table 6.2).Boundary conditions and numerical parameters for the gaseous flowThe boundary conditions applied to the gaseous flow are summarized in table 6.3. Syntheticturbul<strong>en</strong>ce is imposed at the inlet of the injector and the actuators (Section 1 and 1 ac ) to mimica fully turbul<strong>en</strong>t incoming flow. The mean axial velocity profile is built following the classical1/7 power law. An isotropic turbul<strong>en</strong>t perturbation is constructed using the Kraichnan method(cf. Section 4.2.2 ) and ad<strong>de</strong>d to the incoming mean flow. The turbul<strong>en</strong>t velocity U p is uniform
130 CHAPITRE 6. COMPARISON OF LES AND EXPERIMENTAL DATA(a) Grid for the configuration (Coax)(b) Grid for the configuration (Dev55)(c) Grid for the configuration (Sw2)Figure 6.2 – Grids for the three configurations
6.1. SIMULATION AND EXPERIMENTAL APPROACH 131Table 6.2 – Computational grid properties.Coax Dev SwCells 5019217 3661088 4961307No<strong>de</strong>s 86603 634877 861206Minimal cellvolume (m 3 )1.1e-13 1.01e-13 9.1e-14CPU time (h) 20000 11000 20000Processors 384 384 384on each inlet section :U p ={0.1Uginj on Section 10.1U gac on Section 1 ac(6.1)and the integral l<strong>en</strong>gth scale Λ f is equal to 0.4 mm. The non-reflecting boundary conditionVFCBC <strong>de</strong>rived in Section for turbul<strong>en</strong>ce injection in compressible flows is coupled with theLRM for a relax coeffici<strong>en</strong>t K = 20000 rad/s. A logarithmic law-of-the-wall is imposed on thewalls of the injector and of the actuators (Section 2).A very slow laminar coaxial flow (0.1 m/s) is imposed on the inlet of the computation box(Section 3) using a semi-reflecting characteristic boundary condition [84]. The lateral surface isan adiabatic slip-wall and the outlet is nearly non-reflecting at atmospheric pressure.Table 6.3 – Boundary conditions of the gaseous flow.Boundary conditionsCharacteristic inlet conditionInjector inlet (Section 1)VFCBC + LRM : K = 20000Actuator inlet (Section 1ac)Actuator and injector wall (Section 2)Box inlet (Section 3)Box wall (section 4)Box outlet (Section 5)Characteristic inlet conditionVFCBC+LRM : K = 20000Adiablatic law of wallCharacteristic inlet conditionNSCBC +LRM : K = 1000Adiabatic slip wallCharacteristic outlet conditionNSCBC +LRM : K = 3000Calculations are run with the Lax-W<strong>en</strong>droff scheme. Most run parameters are id<strong>en</strong>tical inthe three cases excepted the artificial viscosity. The 2nd and 4th or<strong>de</strong>r coeffici<strong>en</strong>ts have be<strong>en</strong>increased for the controlled configurations (Dev55) and (Sw2). The most important numericalparameters are listed in table 6.4.
132 CHAPITRE 6. COMPARISON OF LES AND EXPERIMENTAL DATATable 6.4 – Numerical parameters used for the gaseous flow calculations.Configuration (Coax) (Dev55) (Sw2)Numerical schemeLax-W<strong>en</strong>droffScheme spatial or<strong>de</strong>r2nd or<strong>de</strong>rScheme temporal or<strong>de</strong>r 2nd or<strong>de</strong>rSGS mo<strong>de</strong>lStandard SmagorinsyArtificial viscosity Colin S<strong>en</strong>sor [57]2nd or<strong>de</strong>r coeffici<strong>en</strong>t 0.05 0.1 0.14th or<strong>de</strong>r coeffici<strong>en</strong>t 0.01 0.05 0.05Methodology for injection of dropletsPrimary atomization can not be studied with the pres<strong>en</strong>t method and the LES begins afterthis zone. Particles are injected within a cylin<strong>de</strong>r at the exit of the liquid pipe (Figure 6.3). Thediameter of the injection cylin<strong>de</strong>r is D inj = D l and its l<strong>en</strong>gth is L inj = 1.7D l corresponding to thetypical l<strong>en</strong>gth of the liquid core for the superpulsating mo<strong>de</strong> of a coaxial injector [104, 105, 106].Figure 6.3 – Injection of dropletsDroplet diameters are sampled in a log-normal distribution whose d<strong>en</strong>sity number functionis :⎛ ( ) 2⎞1ln dp− µf n (d p ) = √2πdp σ exp ⎜⎝ − D inj102σ 2 ⎟(6.2)⎠where D inj10 is the injected mean diameter. The parameters σ and µ <strong>de</strong>p<strong>en</strong>d of D inj10 and the
6.1. SIMULATION AND EXPERIMENTAL APPROACH 133injected RMS diameter D injRMS :⎡(√σ = √ln ⎣)D inj 2 lnRMSD inj + 1⎤⎦ and µ = −10[ ( ) 2D injRMS+ 1]D inj102(6.3)A direct measurem<strong>en</strong>t of the injected mean and RMS diameters (D inj10 , Dinj RMS) in the injectionplane is not possible since the spray is too d<strong>en</strong>se in this part of the flow. Therefore, these twoparameters are estimated using the closest experim<strong>en</strong>tal data to the injector at z/D ge = 4. Theyare obtained by averaging all droplets measured with the PDA at z/D ge = 4 :∑ M ∑ Ni10 = i=1∑ Mi=1 N iD injj=1 d pj√ √√√√∑ M ∑ Niand D injRMS = i=1j=1(∑ Mi=1 N id pj − D inj10) 2(6.4)where the in<strong>de</strong>x j corresponds to the summations of droplets in individual samples at differ<strong>en</strong>ttransverse positions y and the in<strong>de</strong>x i corresponds to the summation over all samplesat z/D ge = 4. Figure 6.4 compares the injected log-normal distribution with the experim<strong>en</strong>talpdf of all droplets measured at z/D ge = 4. The agreem<strong>en</strong>t is good for most diameters d p exceptedaround d p = 20 µm where f n is un<strong>de</strong>restimated by the log-normal interpolation. For thethree configurations, the coaxial atomizer g<strong>en</strong>erates a large range of droplet sizes. Therefore, thediameter distribution was split in four size classes : 1) d p < 20µm, 2) 20µm ≤ d p < 50µm,3) 50µm ≤ d p < 100µm, 4) 50µm ≤ d p . Dashed vertical lines on Figure 6.4 materializes theseparation betwe<strong>en</strong> classes. For the biggest droplets in class 4), the duration of LES computationwas not long <strong>en</strong>ough to provi<strong>de</strong> perfectly converged data and no results will be pres<strong>en</strong>ted forclass 4) in the rest of the paper.The initial velocity of the droplets is :−−→u injp= U injp−→ ez + −−→u ′injp (6.5)where Upinj is the mean injected velocity which is purely axial and −−→u ′injp is a three-dim<strong>en</strong>sionalwhite noise with a maximal amplitu<strong>de</strong> u ′injpmax for each cartesian direction. The fluctuations ad<strong>de</strong>don the droplet velocities are supposed to be uncorrelated to the gas turbul<strong>en</strong>t velocitiesfluctuations. Table 6.5 pres<strong>en</strong>ts the values of the parameters used to inject particles for eachconfiguration. As for the mean diameters, the choice of Upinj and u ′injpmax is difficult. An evaluationof Upinj interpolating experim<strong>en</strong>tal data at z/D ge = 4 and assuming a linear relationship betwe<strong>en</strong>z = 0 and z/D ge = 4 gives U p (z = 0) ≃ 15 m/s for (Coax). In several primary break-up mo<strong>de</strong>ls[34, 107], the <strong>en</strong>trainm<strong>en</strong>t velocity of liquid from the liquid core U e is estimated by :U e ∝√ρgρ lU ginj (6.6)In the case of (Coax), this equation gives U e ≃ 6m/s. Therefore, using these two evaluations, U injpis set equal to 10m/s and this value is kept constant for all configurations. The value of u ′injpmaxis also set by interpolating the experim<strong>en</strong>tal value of the axial RMS droplet velocity WpRMS atz/D ge = 4 : u ′injpmax = 10 m/s.
134 CHAPITRE 6. COMPARISON OF LES AND EXPERIMENTAL DATA1.21Experim<strong>en</strong>t at z /D ge =4Log-normal interpolationD inj10 f n(dp)0.80.60.40.200 50 100 150 200d p (µm)(a) (Coax)1.21Experim<strong>en</strong>t at z /D ge =4Log-normal interpolationD inj10 f n(dp)0.80.60.40.200 50 100 150 200d p (µm)(b) (Dev55)1.21Experim<strong>en</strong>t at z /D ge =4Log-normal interpolationD inj10 f n(dp)0.80.60.40.200 50 100 150 200d p (µm)(c) (Sw2)Figure 6.4 – Inflow conditions for the number distribution f n (d p ). Comparison betwe<strong>en</strong> theexperim<strong>en</strong>tal distribution at z/D ge = 4 and the prescribed Log-normal interpolation.
6.2. CHARACTERISATION OF CONTROL ON THE AIR FLOW 135Table 6.5 – Injection of dropletsCoax Dev SwD inj10 (µm) 43 50 50D injRMS(µm) 33 40 48D min (µm) 3D max (µm) 200Up inj (m/s) 10u ′injpmax (m/s) 106.2 Characterisation of control on the air flowBefore <strong>de</strong>scribing the effects of actuation on the liquid jet, it is useful to characterize theeffects of control on the carrier phase (air) without spray. This is done in this section by usingboth simulation and experim<strong>en</strong>ts in the the case where no liquid is injected. First, Section 6.2.1compares two LES computations of the annular air jet (Coax) with and without injection ofturbul<strong>en</strong>ce at the injector inlet. Th<strong>en</strong> Section 6.2.2 focuses on the comparison LES/experim<strong>en</strong>tfor the three configurations (Coax), (Dev55) and (Sw2). The objective is here to un<strong>de</strong>rstand theeffect of actuators on the carrier phase.6.2.1 Influ<strong>en</strong>ce of the turbul<strong>en</strong>ce injection on the LES of the annular jet(Coax)ContextThe objective of Section 4.2 was to propose a method to inject turbul<strong>en</strong>ce with correct statisticson the inlets of the computation domain for the LES of the IMFT experim<strong>en</strong>t. The Kraichnanmethod was selected as the technique to g<strong>en</strong>erate the turbul<strong>en</strong>t signal. It was also <strong>de</strong>monstratedthat the classical NSCBC procedure could not impose the mean profile, inject turbul<strong>en</strong>ceand still <strong>de</strong>fine a non-reflecting inlet boundary condition for acoustic waves. A new boundarycondition called VFCBC has be<strong>en</strong> <strong>de</strong>velopped to overcome this problem. The objective is nowto <strong>de</strong>monstrate the interest of injecting turbul<strong>en</strong>ce in LES especially for the cases pres<strong>en</strong>ted inthis chapter. This section pres<strong>en</strong>ts two LES computation of the annular jet (Coax) :1. (Coax NT ) : The (Coax) configuration is simulated by only injecting the mean velocityprofile following the 1/7 power law on the inlet patch (Figure 6.2(a) : Section 1). It impliesthat the incoming flow is laminar .2. (Coax T ) : The (Coax) configuration is computed by injecting the same velocity mean profileon the inlet. However, a 10% turbul<strong>en</strong>t perturbation is ad<strong>de</strong>d on the incoming flow.Characteristics of the initial region of the jet (z/D ge < 5) are extracted from these two simulations.They are compared with literature for similar geometries and with Hot-wire measurem<strong>en</strong>tsperformed on the IMFT experim<strong>en</strong>t.Initial region of annular jetBefore pres<strong>en</strong>ting results on the (Coax) configuration, it is interesting to give some <strong>de</strong>tailsabout annular jets. This type of flow has be<strong>en</strong> the subject of many studies and publications
136 CHAPITRE 6. COMPARISON OF LES AND EXPERIMENTAL DATA[108, 109, 110, 111, 112, 113] for the last <strong>de</strong>ca<strong>de</strong>s owing to its incorporation into the <strong>de</strong>sign ofmany burning or fluidic <strong>de</strong>vices. The flow in an annular configuration is forced to circumv<strong>en</strong>ta c<strong>en</strong>tral obstacle (disk, cone or cylin<strong>de</strong>r) placed on the exit of the nozzle. This object, oft<strong>en</strong>called "bluff body", strongly modify the structure of the near-field of the jet. Ko and Chan [109]propose to divi<strong>de</strong> the initial region of annular jet in three zones (Figure 6.5) :1. The initial merging zone which is the nearest zone to the nozzle exit and <strong>en</strong>ds where thepot<strong>en</strong>tiel core disappears. As for a single jet, the pot<strong>en</strong>tial core is the zone where the meanvelocity remains equal to the exit velocity. However, here, the pot<strong>en</strong>tial core is annular. Itsurrounds an internal recirculating zone occuring behind the bluff body whithin the axialcompon<strong>en</strong>t of the gas velocity is negative. This recirculating region <strong>en</strong>ds at the stagnationpoint which is <strong>de</strong>fined by the point of the jet axis where u z = 0 .2. The intermediate zone imediadiately downstream of the initial merging zone. In this partof the flow, the annular jet and the outer mixing region merge at the c<strong>en</strong>tral axis of th<strong>en</strong>ozzle (Reattachm<strong>en</strong>t point).3. The fully merged zone where the flow behaves like a combined jet with characteristicssimilar to those of a single jet [113]Davies and Beer [110] <strong>de</strong>fine the blockage ratio RB as the ratio of the bluff-body exit surfaceto the exit surface of the nozzle. They showed that the l<strong>en</strong>gth of the recirculating zone short<strong>en</strong>swh<strong>en</strong> RB increase. In the case of this study, the bluff body is the internal tube of the coaxialinjector (Figure 6.1(a)). So the blockage ratio is :RB =(DgiD ge) 2= 0.53 (6.7)For Reynolds number (Re g = 33284) and blockage ratio (RB = 0.5) similar to (Coax), Duraoand Whitelaw [111] showed that the l<strong>en</strong>gth of the recirculating was of around 0.7D ge . For a lowerblockage ratio RB = 0.2, Ko and chan [109] find the stagnation point at z/D ge = 1.45 and thereattachm<strong>en</strong>t point at z/D ge = 4.LES of the annular jetFigure 6.6 pres<strong>en</strong>ts two snapshots of instantaneous velocity close to the injector (z/D ge < 5)corresponding respectively to (Coax NT ) (Figure 6.6(a)) and to (Coax T ) (Figure 6.6(b)). It revealsimportant differ<strong>en</strong>ces in the merging regions betwe<strong>en</strong> (Coax NT ) and (Coax T ). First, turbul<strong>en</strong>ceis established in the injector duct in the case (Coax T ) whereas flow remains laminar in the wholetube and in the initial merging zone for (Coax NT ). For this last case, turbul<strong>en</strong>ce is establishedfurther in the intermediate merging zone close to the point of reattachm<strong>en</strong>t. For (Coax T ), theturbul<strong>en</strong>t inlet initiates large coher<strong>en</strong>t structures which are convected to the outlet of the injector(Figure 6.6(b)). These eddies improve the mixing of the pot<strong>en</strong>tial core with the recrculating zoneand the outer mixing layer and accelerate its <strong>de</strong>sintegration.These first observations must be confirmed by the velocity statistics. Figure 6.7 and 6.8pres<strong>en</strong>t respectively average and RMS axial velocity fields. The top of each figure (x = 0, y > 0)corresponds to (Coax NT ) and the bottom corresponds to (Coax T ). This disposition <strong>en</strong>ables tovisualize differ<strong>en</strong>ces betwe<strong>en</strong> the two LES computations. In or<strong>de</strong>r to evaluate the position of thereattachm<strong>en</strong>t point, the curve ∂u z /∂y = 0 is ad<strong>de</strong>d on both si<strong>de</strong>s of Figure 6.7. As noticed oninstantaneous snapshot, the l<strong>en</strong>gth of the pot<strong>en</strong>tial core is sharply reduced wh<strong>en</strong> turbul<strong>en</strong>ce isinjected. The recirculation zone is also s<strong>en</strong>sibly short<strong>en</strong>ed. The stagnation point position is at
516 W. T. Chan and N. W. M. KO6.2. CHARACTERISATION OF CONTROL ON THE AIR FLOW 137Pot<strong>en</strong>tial coreEntrainm<strong>en</strong>t regionC<strong>en</strong>tral axisPoint of -: [--c xInitial merging zone 1IIntermediate merging zoneIFIGURE 1. Schematic diagram of basic annular jet.Figure 6.5 – Schematic profile of initial region of annular jet (Ko and Chan 1978 [109])2. The mo<strong>de</strong>l of flow structuresz/D ge = 1In for earlier (Coaxwork, NT ) versus KO & z/D Chan ge(1978) = 0.7 for have (Coax separated T ). This annular last position jets into coincidates the initial with thevalue measured merging, by intermediate Durao andmerging Whitelaw and [111] fully formerged the same zone. blockage Within ratio these andthree Reynolds zones, number.similarity of the mean velocity and turbul<strong>en</strong>ce int<strong>en</strong>sity profiles has be<strong>en</strong> observed.Turbul<strong>en</strong>ce injection also reduced the transition of the annular jet to a single jet feature, movingThe initial merging zone ext<strong>en</strong>ds from the jet exit plane to the tip of the pot<strong>en</strong>tialthe reattachm<strong>en</strong>t point from z/Dcore (see figure 1). In the intermediate ge = 2.2 to z/Dmerging ge = 1.7.zone, the basic annular jet reattachesat the c<strong>en</strong>tral axis, i.e. the line aD/ay = 0 intersects the c<strong>en</strong>tral axis. Slightly furtherThese downstream differ<strong>en</strong>cesof are the explained point of reattachm<strong>en</strong>t, by a change inthe thejet turbul<strong>en</strong>t is fully <strong>de</strong>veloped mixing process and the betwe<strong>en</strong> fully the annularjet merged and the zone ambi<strong>en</strong>t begins. air. Wh<strong>en</strong> a laminar velocity profile is injected, maxima of RMS axialvelocity are Within reached these indiffer<strong>en</strong>t the intermediate zones a simple zone mo<strong>de</strong>l (Top of is Figure proposed 6.8). to explain Turbul<strong>en</strong>t the mixing basic flow ess<strong>en</strong>tiallyoccurs structures. in the outer The mixing basic structures region byare gasummarized <strong>en</strong>trainm<strong>en</strong>t the fromfollowing the jetsections.periphery. Injecting turbul<strong>en</strong>ceat the In the inlet initial of the merging injector zone, (Bottom the outer of Figure mixing 6.8) region establishes of an annular turbul<strong>en</strong>ce jet, be it inof the the tube andin the pot<strong>en</strong>tial basic annular, core displacing conical or ellipsoidal maxima of type, RMSis velocity the result toof the the initial shearing merging of a single zone. jet Therefore,turbul<strong>en</strong>tof diametermixing doesDo andnotmeanoccurexitonlyvelocityin the go outerby themixingambi<strong>en</strong>tregionfluid. Thus,but alsoas ininthethecasemixingoflayera single jet, this mixing region of the annular jet is occupied by a toroidal vortexbetwe<strong>en</strong> the pot<strong>en</strong>tial core and the recirculating zone.street which is similar to that of a single jet (figure 1). According to the results for asingle jet, these vortices convect downstream with a velocity of N 0.6 go. The axialIf the separation injectionbetwe<strong>en</strong> of turbul<strong>en</strong>ce these successive s<strong>en</strong>sibly modifies jet vortices the topology is - 1.250,. of the The jet corresponding close to the nozzle,it mustStrouhal be <strong>de</strong>termined number fi if D,,/Po it improves of the spectral the agreem<strong>en</strong>t peak is about betwe<strong>en</strong> 0.6. LES and experim<strong>en</strong>t. Figure 6.9comparesIn experim<strong>en</strong>tal the intermediate radialmerging profiles zone of mean vigorous and RMS mixing hot-wire of the flow velocities inherited U hw from and UthehwRMS withthe LES mixing computations region upstream (Coax NT occurs. ) and A (Coax new mixing T ). The region locations is thus of g<strong>en</strong>erated, these profiles resulting areinz/D ge =0.25, 0.75, a new 1.5, spreading 2, 3. The rate. injection It is of also turbul<strong>en</strong>ce within this improves zone that the the agreem<strong>en</strong>t mixing of the betwe<strong>en</strong> two types LES of and experim<strong>en</strong>t.vortices, First, maxima the jet vortices of meanfrom velocity the outer are well mixing predicted region by and (Coax the wake T ) whereas vortices they from are the overestimatedby internal (Coaxrecirculating NT ). The recirculating region, occurs. zone The is characterized Strouhal number by negative f, D+/uo axial of velocity. the wake However,as the hot-wire provi<strong>de</strong>s a positive combinaison of velocity compon<strong>en</strong>ts ( Eq. 3.7), the recirculatingzone appears as a local maximum of velocity on the jet axis. At z/D ge = 0.25, theint<strong>en</strong>sity of this maximum is correct in the case of (Coax T ) but un<strong>de</strong>restimated by (Coax NT ).At z/D ge = 0.75 this maximum has disappeared on the experim<strong>en</strong>tal and the (Coax T ) profilesbut not for (Coax NT ). Both LES computations overestimate the RMS hot-wire velocities.These overshoots may be caused by the limited resolution of the mesh at the exit of the injector.The Smagorinsky subgrid mo<strong>de</strong>l becomes ineffici<strong>en</strong>t to correctly predict the contribution of
138 CHAPITRE 6. COMPARISON OF LES AND EXPERIMENTAL DATA(a) Injection d’un profil laminaire(b) Injection <strong>de</strong> turbul<strong>en</strong>ceFigure 6.6 – LES instantaneous snapshots of axial gaz velocity fields u z in the mid-plane x = 0 :(a) (Coax NT ) : laminar incoming flow, (b) (Coax T ) : turbul<strong>en</strong>t incoming flow
6.2. CHARACTERISATION OF CONTROL ON THE AIR FLOW 139Figure 6.7 – LES mean axial velocity field in the plane x = 0 : top - (Coax NT ) : laminarincoming flow, bottom - (Coax T ) : turbul<strong>en</strong>t incoming flow
140 CHAPITRE 6. COMPARISON OF LES AND EXPERIMENTAL DATAFigure 6.8 – LES RMS axial velocity field in the plane x = 0 : top - (Coax NT ) : laminarincoming flow, bottom - (Coax T ) : turbul<strong>en</strong>t incoming flow
6.2. CHARACTERISATION OF CONTROL ON THE AIR FLOW 141subgrid turbul<strong>en</strong>ce in this zone [114]. However, injection of turbul<strong>en</strong>ce improves this results fromz/D ge = 1.5.
142 CHAPITRE 6. COMPARISON OF LES AND EXPERIMENTAL DATA$""%&'(")$#$""%&'(")*#$""%&'(!)#Uhw (m/s)!#"!""#"Uhw (m/s)!#"!""#"Uhw (m/s)!#"!""#""!!" !# " # !"$""y (mm)%&'($"!!" !# " # !"$""y (mm)%&'($)#-./!01234561752,82.91:3,17;32?>:37/,82.91:3,17;3
6.2. CHARACTERISATION OF CONTROL ON THE AIR FLOW 1436.2.2 Effects of actuators on the carrier phaseFigures 6.10, 6.11 and 6.12 pres<strong>en</strong>t experim<strong>en</strong>tal and LES fields of the gas mean velocity U hwand RMS velocity UhwRMS for the three configurations (Coax), (Dev55) and (Sw2). Velocitiesare compared here in terms of two-dim<strong>en</strong>sional fields because the actuators g<strong>en</strong>erate threedim<strong>en</strong>sionalcomplex flows. Without control, the jet contours are axisymmetric (Figure 6.10), butthe use of one impacting actuator for (Dev55) (Figure 6.11) g<strong>en</strong>erates "heart shape" contoursclose to the injectors. The flow th<strong>en</strong> evolves into an elliptic jet. For the swirl configuration (Sw2)(Figure 6.12), ev<strong>en</strong> if actuators are placed symmetrically around the injector, they actuallyprovi<strong>de</strong> an helicoidal pattern to the jet. Experim<strong>en</strong>tal and numerical fields also reveal a rotatingpattern around the axis of the jet suggesting a spiraling motion around −→ z .These fields qualitatively <strong>de</strong>monstrate the good agreem<strong>en</strong>t betwe<strong>en</strong> experim<strong>en</strong>t and LES.Shapes and expansion of contours are well <strong>de</strong>scribed by the computation. To compare morequantitatively LES and experim<strong>en</strong>t, line profiles at x = 0 extracted from the two-dim<strong>en</strong>sionalfields are pres<strong>en</strong>ted on Figures 6.13, 6.14 and 6.15. For each configuration, LES profiles are ingood agreem<strong>en</strong>t with the experim<strong>en</strong>tal ones. Only a small overshoot of RMS velocity is observedin the near field of the jet (z/D ge ≤ 3). As suggested in Section 6.2.1, these overshoots may becaused by the limited resolution of the mesh at the exit of the injector.20180204020180204015160153515160153510140103010140103051205255120525y(mm)010080y(mm)020y (mm)010080y (mm)020−5−515−5−5156060−1040−1010−1040−1010−1520−155−1520−155z/d ge = 1−20−20 −15 −10 −5 0 5 10 15 20x(mm)0−20−20 −15 −10 −5 0 5 10 15 20x(mm)0−20−20 −15 −10 −5 0 5 10 15 20x (mm)0−20−20 −15 −10 −5 0 5 10 15 20x (mm)020180204020180204015160153515160153510140103010140103051205255120525y(mm)010080y(mm)020y (mm)010080y (mm)020−5−515−5−5156060−1040−1010−1040−1010−1520−155−1520−155z/d ge = 3−20−20 −15 −10 −5 0 5 10 15 20x(mm)0−20−20 −15 −10 −5 0 5 10 15 20x(mm)0−20−20 −15 −10 −5 0 5 10 15 20x (mm)0−20−20 −15 −10 −5 0 5 10 15 20x (mm)020180204020180204015160153515160153510140103010140103051205255120525y(mm)010080y(mm)020y (mm)010080y (mm)020−5−515−5−5156060−1040−1010−1040−1010−1520−155−1520−155z/d ge = 16−20−20 −15 −10 −5 0 5 10 15 20x(mm)(a) Experim<strong>en</strong>t : U hw0−20−20 −15 −10 −5 0 5 10 15 20x(mm)0−20−20 −15 −10 −5 0 5 10 15 20x (mm)0−20−20 −15 −10 −5 0 5 10 15 20x (mm)(b) Experim<strong>en</strong>t : Uhw RMS (c) LES : U hw (c) LES : UhwRMS0Figure 6.10 – (Coax) : Hot-wire mean and RMS velocity fields. Comparison of Experim<strong>en</strong>t andLES.To evaluate the effects of control on the structures of the actuated jets, it is interesting toextract characteristic quantities from experim<strong>en</strong>tal and numerical results and to compare themwith the literature <strong>de</strong>dicated to jets and other free shear flows. Figure 6.16 pres<strong>en</strong>ts the evolutionof the maximal mean hot-wire velocity Uhwmax for the three configurations. A first observation isthe abs<strong>en</strong>ce of pot<strong>en</strong>tial core : the maximal velocity <strong>de</strong>creases for all z values. For an equival<strong>en</strong>tround jet, the pot<strong>en</strong>tial core l<strong>en</strong>gth is typically around 5D ge [115]. In the region z/D ge < 3, theflow is composed of a thin cylindrical layer with high axial velocity surrounding a recirculatingzone. This configuration is unstable and high velocity gases rapidly <strong>en</strong>ter the recirculating zone
144 CHAPITRE 6. COMPARISON OF LES AND EXPERIMENTAL DATA5180540518054001600350160035−5−10140−5−1030−5−10140−5−1030−15120−1525−15120−1525y(mm)−20−2510080y(mm)−20−2520y (mm)−20−2510080y (mm)−20−2520−3060−3015−3060−3015−35−4040−35−4010−35−4040−35−4010−4520−455−4520−455z/d ge = 1−50−20 −10 0 10 20x(mm)0−50−20 −10 0 10 20x(mm)0−50−20 −10 0 10 20x (mm)0−50−20 −10 0 10 20x (mm)05180540518054001600350160035−5−10140−5−1030−5−10140−5−1030−15120−1525−15120−1525y(mm)−20−2510080y(mm)−20−2520y (mm)−20−2510080y (mm)−20−2520−3060−3015−3060−3015−35−4040−35−4010−35−4040−35−4010−4520−455−4520−455z/d ge = 3−50−20 −10 0 10 20x(mm)0−50−20 −10 0 10 20x(mm)0−50−20 −10 0 10 20x (mm)0−50−20 −10 0 10 20x (mm)05180540518054001600350160035−5−10140−5−1030−5−10140−5−1030−15120−1525−15120−1525y(mm)−20−2510080y(mm)−20−2520y (mm)−20−2510080y (mm)−20−2520−3060−3015−3060−3015−35−4040−35−4010−35−4040−35−4010−4520−455−4520−455z/d ge = 16−50−20 −10 0 10 20x(mm)(a) Experim<strong>en</strong>t : U hw0−50−20 −10 0 10 20x(mm)0−50−20 −10 0 10 20x (mm)0−50−20 −10 0 10 20x (mm)(b) Experim<strong>en</strong>t : Uhw RMS (c) LES : U hw (c) LES : UhwRMS0Figure 6.11 – (Dev55) : Hot-wire mean and RMS velocity fields. Comparison of Experim<strong>en</strong>tand LES.2011020302011020301510090152515100901525108010108010570520570520y(mm)06050y(mm)015y (mm)06050y (mm)015−540−510−540−510−1030−10−1030−10205205z/d ge = 1−15−20−20 −15 −10 −5 0 5 10 15 20x(mm)100−15−20−20 −15 −10 −5 0 5 10 15 20x(mm)0−15−20−20 −15 −10 −5 0 5 10 15 20x (mm)100−15−20−20 −15 −10 −5 0 5 10 15 20x (mm)02011020302011020301510090152515100901525108010108010570520570520y(mm)06050y(mm)015y (mm)06050y (mm)015−540−510−540−510−1030−10−1030−10205205z/d ge = 3−15−20−20 −15 −10 −5 0 5 10 15 20x(mm)100−15−20−20 −15 −10 −5 0 5 10 15 20x(mm)0−15−20−20 −15 −10 −5 0 5 10 15 20x (mm)100−15−20−20 −15 −10 −5 0 5 10 15 20x (mm)02011020302011020301510090152515100901525108010108010570520570520y(mm)06050y(mm)015y (mm)06050y (mm)015−540−510−540−510−1030−10−1030−10205205z/d ge = 16−15−20−20 −15 −10 −5 0 5 10 15 20x(mm)(a) Experim<strong>en</strong>t : U hw100−15−20−20 −15 −10 −5 0 5 10 15 20x(mm)0−15−20−20 −15 −10 −5 0 5 10 15 20x (mm)100−15−20−20 −15 −10 −5 0 5 10 15 20x (mm)(b) Experim<strong>en</strong>t : Uhw RMS (c) LES : U hw (c) LES : UhwRMS0Figure 6.12 – (Sw2) : Hot-wire mean and RMS velocity fields at z/D ge = 1, 3, 5, 8, 12, 16.Comparison of Experim<strong>en</strong>t and LES.
6.2. CHARACTERISATION OF CONTROL ON THE AIR FLOW 145z/D ge =12020LESExperim<strong>en</strong>t1515z/D ge =32015z/D ge =52015z/D ge =8 z/D ge = 12 z/D ge = 1620201515101010101010555555y(mm)0−50−50−50−50−50−5−10−10−10−10−10−10−15−15−15−15−15−15−20−20−20−20−20−200 50 100150 0 50 100150 0 50 100150 0 50 100150 0 50 100150 0 50 100150(a) U hwz/D ge =12020LESExperim<strong>en</strong>t1515z/D ge =32015z/D ge =52015z/D ge =8 z/D ge = 122015z/D ge = 162015101010101010y(mm)50−550−550−550−550−550−5−10−10−10−10−10−10−15−15−15−15−15−15−20−20−20−20−20−200 10 20 30 40 0 10 20 30 40 0 10 20 30 40 0 10 20 30 40 0 10 20 30 40 0 10 20 30 40(b) U RMShwFigure 6.13 – Profiles of mean velocity (Top) and RMS velocity (Bottom) at x = 0 for (Coax).Comparison betwe<strong>en</strong> LES and Experim<strong>en</strong>t.
146 CHAPITRE 6. COMPARISON OF LES AND EXPERIMENTAL DATA5z/D ge =15z/D ge =35z/D ge =55z/D ge =8z/D ge = 125z/D ge = 165000000−5−5−5−5−5−5−10−10−10−10−10−10y(mm)−15−20−15−20−15−20−15−20−15−20−15−20−25−30−25LESExperim<strong>en</strong>t−30−25−30−25−30−25−30−25−30−35−35−35−35−35−35−40−40−40−40−40−400 50 100150 0 50 100150 0 50 100150 0 50 100150 0 50 100150 0 50 100150(a) U hw5z/D ge =15z/D ge =35z/D ge =55z/D ge =8z/D ge = 125z/D ge = 165000000−5−5−5−5−5−5−10−10−10−10−10−10y(mm)−15−20−15−20−15−20−15−20−15−20−15−20−25−25LESExperim<strong>en</strong>t−30−30−25−30−25−30−25−30−25−30−35−35−35−35−35−35−40−40−40−40−40−400 10 20 30 40 0 10 20 30 40 0 10 20 30 40 0 10 20 30 40 0 10 20 30 40 0 10 20 30 40(b) U RMShwFigure 6.14 – Profiles of mean velocity (Top) and RMS velocity (Bottom) at x = 0 for (Dev55).Comparison betwe<strong>en</strong> LES and Experim<strong>en</strong>t.
6.2. CHARACTERISATION OF CONTROL ON THE AIR FLOW 147z/D ge =120LESExperim<strong>en</strong>t15z/D ge =32015z/D ge =52015z/D ge =82015z/D ge = 122015z/D ge = 162015101010101010555555y(mm)0−50−50−50−50−50−5−10−10−10−10−10−10−15−15−15−15−15−15−20−20−20−20−20−200 255075100 0 255075100 0 255075100 0 255075100 0 255075100 0 255075100(a) U hwz/D ge =120LES20Experim<strong>en</strong>t1515z/D ge =32015z/D ge =52015z/D ge =8 z/D ge = 12 z/D ge = 1620201515101010101010555555y(mm)0−50−50−50−50−50−5−10−10−10−10−10−10−15−15−15−15−15−15−20−20−20−20−20−200 5 10 15 20 0 5 10 15 20 0 5 10 15 20 0 5 10 15 20 0 5 10 15 20 0 5 10 15 20(b) U RMShwFigure 6.15 – Profiles of mean velocity (Top) and RMS velocity (Bottom) at x = 0 for (SW2).Comparison betwe<strong>en</strong> LES and Experim<strong>en</strong>t.
148 CHAPITRE 6. COMPARISON OF LES AND EXPERIMENTAL DATAleading to a round jet : U maxhw <strong>de</strong>creases hyperbolically from z/D ge ≥ 4 for all configurations :Uhwmax(z)∼ A U × D geU bzThe coeffici<strong>en</strong>t A U is equal for the three configurations : A u = 4.1. This value is s<strong>en</strong>sibly lowerthan the coffici<strong>en</strong>t of <strong>de</strong>crease obtained for the round jet [116, 117, 118, 119] for which moststudies give A u ∼ 5.9.(6.8)200180160(Coax) − LES(Coax) − Experim<strong>en</strong>t(Dev55) − LES(Dev55) − Experim<strong>en</strong>t(Sw2) − LES(Sw2) − Experim<strong>en</strong>t140Umax1201008060402000 2 4 6 8 10 12 14 16z/D geFigure 6.16 – Decrease of the maximum Hot-wire velocity - Comparison of LES and Experim<strong>en</strong>tConcerning the configuration (Dev55), the expansion of the jet on Figure 6.17 can be characterizedby the maximal and the minimal value of y 0.5 , where y 0.5 is <strong>de</strong>fined by :U(0, y 0.5 , z) = 1 2 U hw max (z) (6.9)The jet <strong>de</strong>viation is <strong>de</strong>fined from the position of maximal velocity y max :U(0, y max , z) = Uhw max (z) (6.10)A linear fit for y 0.5min , y max and y 0.5max gives slopes respectively equal to A 0.5min = −0.39,A max = −0.26 and A 0.5max = −0.17. A max corresponds to a <strong>de</strong>viation angle αg Dev = 15.1 ◦ .Figure 6.18 compares the profiles of U hw for (Coax) and (Dev55) at z/D ge = 12. The refer<strong>en</strong>cedim<strong>en</strong>sion for y is the half-width of the coaxial jet without control y Coax0.5 . At this distance of theinjector, the <strong>de</strong>viated jet is an ellipse with a major diameter a<strong>ligne</strong>d along −→ y (cf. Figure 6.11).The relative expansion of the <strong>de</strong>viated jet in this direction compared to (Coax) can be evaluatedusing the ratio :Λ Devg= (y 0.5max + y 0.5min ) /2 − y0.5Coaxy0.5CoaxAt z/D ge = 12, Figure 6.18 gives an expansion ratio Λ Devg equal to 0.35.(6.11)
6.2. CHARACTERISATION OF CONTROL ON THE AIR FLOW 1490−1−2y/Dge−3−4−5−6y0.5max-LESy0.5max- Experim<strong>en</strong>tymax - LESymax - Experim<strong>en</strong>ty0.5min -LESy0.5min -Experim<strong>en</strong>t−70 2 4 6 8 10 12 14 16z/D geFigure 6.17 – Deviation and expansion of the jet for the configuration (Dev55)5045(Coax) − LES(Coax) − Experim<strong>en</strong>t(Dev55) − LES(Dev55) − Experim<strong>en</strong>t40Uhw/U hwmax35302520151050−6 −5 −4 −3 −2 −1 0 1 2 3y/y0.5C oaxFigure 6.18 – Comparison of hot-wire velocity profiles for (Coax) and (Dev55) at z/D ge = 12.
150 CHAPITRE 6. COMPARISON OF LES AND EXPERIMENTAL DATAFigure 6.19 compares the profiles of the hot wire velocity (measured experim<strong>en</strong>tally andreconstructed from LES) U hw for (Coax) and (Sw2) at z/D ge = 3 and 12. The main effect ofswirl is to increase the width of the jet close to the injection [120] : by adapting Eq. 6.11 toconfiguration (Sw2), the expansion ratio Λ Swg is equal to 0.37 for z/D ge = 3 (Figure 6.19(a)).However, this effect <strong>de</strong>creases further in the jet and for z/D ge = 12, the half-widths of the jetsfor (Coax) and (Sw2) are nearly equal (Figure 6.19(b)). This ph<strong>en</strong>om<strong>en</strong>on is due to the factthat for the control rate R = 0.4, swirl effects are still low. The swirl number [120] S <strong>en</strong>ables toUhw (m/s)140130120110100908070605040302010(Coax) − LES(Coax) − Experim<strong>en</strong>t(Sw2) − LES(Sw2) − Experim<strong>en</strong>t0−4 −3 −2 −1 0 1 2 3 4y/y0.5C oax(a) z/D ge = 3Uhw (m/s)5045403530252015105(Coax) − LES(Coax) − Experim<strong>en</strong>t(Sw2) − LES(Sw2) − Experim<strong>en</strong>t0−4 −3 −2 −1 0 1 2 3 4y/y0.5C oax(b) z/D ge = 12Figure 6.19 – Comparison of hot-wire velocity profiles for (Coax) and (Sw2) at z/D ge = 3 andz/D ge = 12.characterize the <strong>de</strong>gree of swirl imparted to the flow by the tang<strong>en</strong>tial actuators of (Sw2). It isthe ratio of the axial flux of swirl mom<strong>en</strong>tum M uφ by the axial flux of axial mom<strong>en</strong>tum M uz :whereandS =M uz (z) =M uφ (z) =M uφ(D ge /2)M uz(6.12)∫ 2π ∫ ∞00∫ 2π ∫ ∞00ρ g u z 2 drdφ (6.13)ρ g ru z u φ drdφ (6.14)The swirl number is difficult to evaluate experim<strong>en</strong>tally. It requires the measurem<strong>en</strong>t of the threevelocity compon<strong>en</strong>ts. In some simple situations, mo<strong>de</strong>ls <strong>en</strong>able an estimation of this number [14]but in our case the interactions betwe<strong>en</strong> actuators and the jet in the injector are complex. LES isa more precise tool to evaluate S since swirl and axial mom<strong>en</strong>ts can be directly computed. Figure6.20 pres<strong>en</strong>ts the evolution of M uz and M uφ obtained with LES for (Coax) and (Sw2). Thesequantities are normalized by the initial mom<strong>en</strong>tum flow rate M 0 wh<strong>en</strong> no control is activated :M 0 = πρ g U 2 bD 2 ge − D 2 gi4(6.15)For a free shear flow, M uz and M uφ are constants [121, 122]. This assumption is verified byLES results for both configuration (Coax) and (Sw2). As expected, since the total air flow rate
6.2. CHARACTERISATION OF CONTROL ON THE AIR FLOW 151is constant, diverting a portion of this air into the swirling actuator jets leads to a substantialreduction of the axial flux M uz for the swirled case (Sw2) compared to the refer<strong>en</strong>ce case (Coax).For the configuration (Sw2), the swirl number is equal to 0.25, which corresponds to a low <strong>de</strong>greeof swirl (S ≤ 0.6).10.90.8(Coax) - M uz(Sw) -M uz(Sw) - M uφMui/M00.70.60.50.40.30.20.100 2 4 6 8 10 12 14 16z/D geFigure 6.20 – Axial flux of axial mom<strong>en</strong>tum M uz and Axial flux of swirl mom<strong>en</strong>tum M uφcomputed from LES. Comparison of (Coax) and (Sw2).6.2.3 Flow structures induced by controlFigures 6.21, 6.22 and 6.23 pres<strong>en</strong>t the int<strong>en</strong>sity and the vector field of U xy : the LES meanvelocity projected on the planes z/D ge = 0.75 and z/D ge = 4 respectively for (Coax), (Dev55)and (SW2). These fields <strong>en</strong>able to visualize the jet topology for each configuration. For theconfiguration (Coax) (Figure 6.21), U xy ess<strong>en</strong>tially reveals a radial flow corresponding to theexpanding jet. At the axial position z/D ge = 0.75, most of the jet expansion is piloted by<strong>en</strong>trainm<strong>en</strong>t to the c<strong>en</strong>ter of the jet. At z/D ge = 4, the expansion of the jet is due to gas<strong>en</strong>trainm<strong>en</strong>t from the periphery of the jet but also from the c<strong>en</strong>ter of the jet to its periphery.This ph<strong>en</strong>om<strong>en</strong>on may explain the fact that the axial velocity <strong>de</strong>creases faster for (Coax) thanfor a classical round jet (Figure 6.16). The use of actuators complicates the nature of <strong>en</strong>trainm<strong>en</strong>tin the jet. In the case of (Dev55) (Figure 6.22) the impacting jet g<strong>en</strong>erates high −→ y velocity levelsaround the jet c<strong>en</strong>ter. This zone is surroun<strong>de</strong>d by two counter-rotating vortices. For the swirledconfiguration (Sw2) (Figure 6.23), the actuators g<strong>en</strong>erate four co-rotating vortical structures.These vortices constitute the bla<strong>de</strong>s of the propeller shape observed on the experim<strong>en</strong>tal andnumerical fields of Figure 6.12. These four structures interact and g<strong>en</strong>erate a fifth c<strong>en</strong>tral vortexwhich explains the spiraling motion of the jet around its axis −→ z . An estimation from Figure 6.23gives a rotation angle equal to 63 ◦ wich corresponds to an angular step of 3.5 ◦ /mm.
152 CHAPITRE 6. COMPARISON OF LES AND EXPERIMENTAL DATA(a) z/D ge = 0.75 (b) z/D ge = 4Figure 6.21 – LES of (Coax). Int<strong>en</strong>sity and vector field of U xy , the mean velocity projected onthe plane.(a) z/D ge = 0.75 (b) z/D ge = 4Figure 6.22 – LES of (Dev55). Int<strong>en</strong>sity and vector field of the mean velocity projected on theplane U xy .6.3 Characterisation of control on the sprayThe effects of the actuators on the carrier phase have be<strong>en</strong> <strong>de</strong>scribed in the previous section.The same tests are now repeated with liquid injection in the c<strong>en</strong>tral duct of Figure 6.1(a).6.3.1 Euler-Lagrange LES of the controlled sprayFigure 6.24 displays LES instantaneous snapshots in the planes x = 0 (left) and z/D ge = 16(right) for the uncontrolled case (Coax). Figure 6.25(a) shows the axial gas velocity contoursand Figure 6.25(b) pres<strong>en</strong>ts the corresponding snapshots for spray droplets. Each size class isrepres<strong>en</strong>ted with a differ<strong>en</strong>t colour : black for 1), grey for 2) and white for 3). As expected, withoutcontrol, the droplets are dispersed by the coaxial air jet and the spray remains axisymmetric.The LES was performed by assuming that secondary atomization was negligible. This assumptioncan be checked a posteriori from the LES data by computing the local Weber numberW e for the uncontrolled case and each size class :W e = ρ g (u z − W p ) 2 D i 10σ(6.16)
6.3. CHARACTERISATION OF CONTROL ON THE SPRAY 153(a) z/D ge = 0.75 (b) z/D ge = 4Figure 6.23 – LES of (Sw2). Int<strong>en</strong>sity and vector field of the mean velocity projected on theplane U xy .where D10 i is the mean diameter of the size class i = 1), 2), 3) and σ = 7.3 · 10−2 N/m is thesurface t<strong>en</strong>sion betwe<strong>en</strong> water and air. Figure 6.25 shows the evolution of the maximal Webernumber W e max (z) obtained from LES in each transverse section of the jet for the three sizeclasses.The Weber number <strong>de</strong>creases rapidly with downstream distance and never exceeds thecritical value of secondary break-up (W e c = 12) for droplets with a diameter d p < 50 µm. Ifd p ≥ 50 µm, W e can become greater than 12 for z/D ge ≤ 1 and secondary break-up mayoccur, especially in the gas shear layer surrounding the droplet injection volume. However, thezone where W e > 12 is small and it is not clear that large droplets will have the time to breakup in this region. In most of the flow, W e
154 CHAPITRE 6. COMPARISON OF LES AND EXPERIMENTAL DATAFigure 6.24 – LES instantaneous snapshots of axial gaz velocity fields uz and spray droplets for the configuration (Coax) : (a) axial gasvelocity in x = 0 (left) and z/Dge = 16 (right), (b) spray droplets in x = 0 (left) and z/Dge = 16 (right) : the color scale corresponds tothe diameter classes : 1) dp < 20µm (black), 2) 20µm ≤ dp < 50µm (grey), 3) 50µm ≤ dp < 100µm (white).(a) uz : planes x = 0 (left) and z/Dge = 16 (right)(b) droplets distribution : planes x = 0 (left) and z/Dge = 16 (right)
6.3. CHARACTERISATION OF CONTROL ON THE SPRAY 1552520d p < 20 µm50 µm≥ d p > 20 µm100 µm≥ d p > 100 µmW e c = 12W emax1510500 2 4 6 8 10 12 14 16z/D geFigure 6.25 – Maximal local Weber number W e max computed with LES for the three dropletsize classes.The effects of control can th<strong>en</strong> be studied by comparing configuration (Coax), (Dev55) and(Sw2). Figures 6.26 and 6.27 display LES instantaneous snapshots in the planes x = 0 (left)and z/D ge = 16 (right) for the controlled configurations (Dev55) and (Sw2). Figures 6.26(a)and 6.27(a) show the axial gas velocity contours. Figures 6.26(b) and 6.27(b) pres<strong>en</strong>t the correspondingsnapshots for spray droplets. The colors of the size classes are the same as Figure6.25(b). These figures <strong>en</strong>able some first qualitative observations betwe<strong>en</strong> (Coax), (Dev55) and(Sw2). In the case without control (Coax) (Figure 6.24), the spray has a low spreading angleand no peculiar structures or segregation ph<strong>en</strong>om<strong>en</strong>on suggests a strong the interaction betwe<strong>en</strong>the gas turbul<strong>en</strong>ce and the dispersed phase. The droplets remain inertial in most of the flow.The impacting jet actuator in the configuration (Dev55) <strong>de</strong>viates gas and droplets. Control alsoimproves the expansion of the spray for this configuration. Finally in the case (Sw2), clustersof droplets are visible showing that interaction betwe<strong>en</strong> droplets and turbul<strong>en</strong>ce is increased byswirl. The spreading angle of the spray also increases significantly compared to the configuration(Coax).
156 CHAPITRE 6. COMPARISON OF LES AND EXPERIMENTAL DATA(a) uz : planes x = 0 (left) and z/Dge = 16 (right)(b) droplets distribution : planes x = 0 (left) and z/Dge = 16 (right)Figure 6.26 – LES instantaneous snapshots of axial gaz velocity fields uz and spray droplets for the configuration (Dev55) : (a) axial gasvelocity in x = 0 (left) and z/Dge = 16 (right), (b) spray droplets in x = 0 (left) and z/Dge = 16 (right) : the color scale corresponds tothe diameter classes : 1) dp < 20µm (black), 2) 20µm ≤ dp < 50µm (grey), 3) 50µm ≤ dp < 100µm (white).
6.3. CHARACTERISATION OF CONTROL ON THE SPRAY 157(a) uz : planes x = 0 (left) and z/Dge = 16 (right)(b) droplets distribution : planes x = 0 (left) and z/Dge = 16 (right)Figure 6.27 – LES instantaneous snapshots of axial gaz velocity fields uz and spray droplets for the configuration (Sw2) : (a) axial gasvelocity in x = 0 (left) and z/Dge = 16 (right), (b) spray droplets in x = 0 (left) and z/Dge = 16 (right) : the color scale corresponds tothe diameter classes : 1) dp < 20µm (black), 2) 20µm ≤ dp < 50µm (grey), 3) 50µm ≤ dp < 100µm (white).
158 CHAPITRE 6. COMPARISON OF LES AND EXPERIMENTAL DATA6.3.2 Effect of control on the droplet velocityFigures 6.28 to 6.36 compare LES predictions to experim<strong>en</strong>tal data for transverse variationsof mean and RMS droplets velocity W p and WpRMS for the size classes 1), 2) and 3) and eachconfiguration (Coax), (Dev55) and (Sw2). The overall agreem<strong>en</strong>t betwe<strong>en</strong> LES and experim<strong>en</strong>tis good. Concerning the (Coax) configuration (Figures 6.28 to 6.30), the shapes and expansionof the radial profiles of mean velocity are well reproduced. For example, experim<strong>en</strong>tal profilesfor z/D ge < 5 pres<strong>en</strong>t a local minimum for W p : close to the injector, droplets <strong>en</strong>trained by thehigh-velocity gas layer surrounding the liquid core are more accelerated than in the c<strong>en</strong>ter of thespray. LES captures this ph<strong>en</strong>om<strong>en</strong>on correctly. RMS levels are also well reproduced. Differ<strong>en</strong>cesappear around the spray where Wp RMS obtained with LES falls to zero too fast for z/D ge ≤ 5.This differ<strong>en</strong>ce vanishes in the far field.Concerning the impacting configuration (Dev55) (Figures 6.31 to 6.33), the levels and positionsof the maximum mean velocity are well predicted by LES. However, on the actuationsi<strong>de</strong>, the mean velocity falls too fast to zero. Conclusions are similar for the RMS velocity (Figures6.31(b), 6.32(b) and 6.33(b)). Maxima are well predicted by LES but the position of themaximum on the actuation si<strong>de</strong> is not well obtained. This discrepancy can be explained by theinjection mo<strong>de</strong>l for the dispersed phase. Droplets are uniformly injected in a cylin<strong>de</strong>r with amean velocity along the −→ z direction. However the impacting actuator may break this symmetryby adding a transverse compon<strong>en</strong>t to the mean gas velocity ev<strong>en</strong> in the spray injection volume.(Figure 6.22). Moreover the actuator may also play a role in the primary atomisation but theseeffects are difficult to evaluate experim<strong>en</strong>tally. Therefore it was chos<strong>en</strong> to keep the same geometryand the same velocity <strong>de</strong>finition −−→u injp for all configurations.Concerning the configuration (Sw2) (Figures 6.34 to 6.36), swirl effects are well <strong>de</strong>scribed byLES in terms of shapes and expansion of the mean and RMS velocity profiles.Figures 6.24 to 6.27 show that the actuators modify both the gas flow and the spray. Measurem<strong>en</strong>ts(Table 6.5) show that for both (Dev55) and (Sw2) cases, the droplet mean diameter atz/D ge = 4 increases : this ph<strong>en</strong>om<strong>en</strong>on is due to the fact that a part of the axial air flux is usedfor tranverse injection by actuators (Figure 6.20). The shape of the spray is modified by control.Figure 6.37 compares profiles of droplets axial velocity betwe<strong>en</strong> (Coax) and (Dev55) for eachdroplet class at z/D ge = 12. The coordinate y is non-dim<strong>en</strong>sionalized with y Coaxp0.5 i. This quantitycorresponds to the half-width of the LES profile for (Coax) and the class i = 1), 2), 3) (cf. Section6.1.2). As noticed in the previous section, LES does not perfectly capture the expansion of thespray but the <strong>de</strong>viation is well predicted by the LES. Table 6.6 pres<strong>en</strong>ts the <strong>de</strong>viation angle αpDevfor the three size classes : both LES and experim<strong>en</strong>t show that the velocity fields of all dropletsclasses are <strong>de</strong>viated by the same amount wh<strong>en</strong> control (Dev55) is on. The value of αpDev is around12 ◦ which is a little smaller than the <strong>de</strong>viation of the single-phase coaxial jet for the same controlparameter R ac = 0.2 (Figure 6.17). For configuration (Sw2) (Figure 6.38), control acts effici<strong>en</strong>tlyon the width of the spray. Table 6.6 pres<strong>en</strong>ts the overexpansion ratio Λ Swp (Eq. 6.11) for the threeclasses at z/D ge = 12. This ratio <strong>de</strong>creases from 0.5 to 0.3 wh<strong>en</strong> droplet sizes increase.6.3.3 Effect of control on the diameter distributionIn or<strong>de</strong>r to un<strong>de</strong>rstand the effect of control on the granulometry in the spray, a joint postprocessingof experim<strong>en</strong>tal instantaneous PDA measurem<strong>en</strong>ts and LES instaneous droplet realizationswas used to evaluate the number-based size distribution function f n (d p ) along the jetaxis. Concerning the LES, droplets were sampled in cylindrical boxes whose positions are shownon Figure 6.39. For (Coax) and (Sw2), the jet axis is −→ z . For (Dev55), the jet axis correspondsto the position of the maxima of the axial droplet mean velocity. The l<strong>en</strong>gth and the radius of
6.3. CHARACTERISATION OF CONTROL ON THE SPRAY 159z /D g e = 430z /D g e = 530z /D g e = 830z /D g e = 12 z /D g e = 163030LESExperim<strong>en</strong>t : PDA20202020201010101010y(mm)00000−10−10−10−10−10−20−20−20−20−20−300 20 40 60−30 −30 −30 −300 20 40 60 0 20 40 60 0 20 40 60 0 20 40 60(a) W p(m/s)z /D g e = 430z /D g e = 530z /D g e = 830z /D g e = 12 z /D g e = 163030LESExperim<strong>en</strong>t : PDA20202020201010101010y(mm)00000−10−10−10−10−10−20−20−20−20−20−30 −30 −30 −30 −300 10 20 0 10 20 0 10 20 0 10 20 0 10 20(b) WpRMS (m/s)Figure 6.28 – (Coax) d p < 20µm : Radial profiles of mean (Top) and RMS (Bottom) axialparticle velocity at x = 0. Comparison betwe<strong>en</strong> LES and Experim<strong>en</strong>t.
160 CHAPITRE 6. COMPARISON OF LES AND EXPERIMENTAL DATAz /D g e = 430z /D g e = 530z /D g e = 830z /D g e = 12 z /D g e = 163030LESExperim<strong>en</strong>t : PDA20202020201010101010y(mm)00000−10−10−10−10−10−20−20−20−20−20−300 20 40 60−30 −30 −30 −300 20 40 60 0 20 40 60 0 20 40 60 0 20 40 60(a) W p(m/s)z /D g e = 430z /D g e = 530z /D g e = 830z /D g e = 12 z /D g e = 163030LESExperim<strong>en</strong>t : PDA20202020201010101010y(mm)00000−10−10−10−10−10−20−20−20−20−20−30 −30 −30 −30 −300 10 20 0 10 20 0 10 20 0 10 20 0 10 20(b) WpRMS (m/s)Figure 6.29 – (Coax) 20µm < d p < 50µm : Radial profiles of mean (Top) and RMS (Bottom)axial particle velocity at x = 0. Comparison betwe<strong>en</strong> LES and Experim<strong>en</strong>t.
6.3. CHARACTERISATION OF CONTROL ON THE SPRAY 161z /D g e = 430z /D g e = 530z /D g e = 830z /D g e = 12 z /D g e = 163030LESExperim<strong>en</strong>t : PDA20202020201010101010y(mm)00000−10−10−10−10−10−20−20−20−20−20−300 20 40 60−30 −30 −30 −300 20 40 60 0 20 40 60 0 20 40 60 0 20 40 60(a) W p(m/s)z /D g e = 430z /D g e = 530z /D g e = 830z /D g e = 12 z /D g e = 163030LESExperim<strong>en</strong>t : PDA20202020201010101010y(mm)00000−10−10−10−10−10−20−20−20−20−20−30 −30 −30 −30 −300 10 20 0 10 20 0 10 20 0 10 20 0 10 20(b) WpRMS (m/s)Figure 6.30 – (Coax) 50µm < d p < 100µm : Radial profiles of mean (Top) and RMS (bottom)axial particle velocity at x = 0. Comparison betwe<strong>en</strong> LES and Experim<strong>en</strong>t.
162 CHAPITRE 6. COMPARISON OF LES AND EXPERIMENTAL DATAz /D g e = 430z /D g e = 530z /D g e = 830z /D g e = 12 z /D g e = 163030LESExperim<strong>en</strong>t : PDA20202020201010101010y(mm)00000−10−10−10−10−10−20−20−20−20−20−300 20 40 60−30 −30 −30 −300 20 40 60 0 20 40 60 0 20 40 60 0 20 40 60(a) W p(m/s)z /D g e = 430z /D g e = 530z /D g e = 830z /D g e = 12 z /D g e = 163030LESExperim<strong>en</strong>t : PDA20202020201010101010y(mm)00000−10−10−10−10−10−20−20−20−20−20−30 −30 −30 −30 −300 10 20 0 10 20 0 10 20 0 10 20 0 10 20(b) WpRMS (m/s)Figure 6.31 – (Sw2) d p < 20µm : Radial profiles of mean (Top) and RMS (bottom) axial particlevelocity at x = 0. Comparison betwe<strong>en</strong> LES and Experim<strong>en</strong>t.
6.3. CHARACTERISATION OF CONTROL ON THE SPRAY 163z /D g e = 430z /D g e = 530z /D g e = 830z /D g e = 12 z /D g e = 163030LESExperim<strong>en</strong>t : PDA20202020201010101010y(mm)00000−10−10−10−10−10−20−20−20−20−20−300 20 40 60−30 −30 −30 −300 20 40 60 0 20 40 60 0 20 40 60 0 20 40 60(a) W p(m/s)z /D g e = 430z /D g e = 530z /D g e = 830z /D g e = 12 z /D g e = 163030LESExperim<strong>en</strong>t : PDA20202020201010101010y(mm)00000−10−10−10−10−10−20−20−20−20−20−30 −30 −30 −30 −300 10 20 0 10 20 0 10 20 0 10 20 0 10 20(b) WpRMS (m/s)Figure 6.32 – (Dev55) 20µm < d p < 50µm : Radial profiles of mean (Top) and RMS (bottom)axial particle velocity at x = 0. Comparison betwe<strong>en</strong> LES and Experim<strong>en</strong>t.
164 CHAPITRE 6. COMPARISON OF LES AND EXPERIMENTAL DATAz /D g e = 430z /D g e = 530z /D g e = 830z /D g e = 12 z /D g e = 163030LESExperim<strong>en</strong>t : PDA20202020201010101010y(mm)00000−10−10−10−10−10−20−20−20−20−20−300 20 40 60−30 −30 −30 −300 20 40 60 0 20 40 60 0 20 40 60 0 20 40 60(a) W p(m/s)z /D g e = 430z /D g e = 530z /D g e = 830z /D g e = 12 z /D g e = 163030LESExperim<strong>en</strong>t : PDA20202020201010101010y(mm)00000−10−10−10−10−10−20−20−20−20−20−30 −30 −30 −30 −300 10 20 0 10 20 0 10 20 0 10 20 0 10 20(b) WpRMS (m/s)Figure 6.33 – (Dev55) 50µm < d p < 100µm : Radial profiles of mean (Top) and RMS (bottom)axial particle velocity at x = 0. Comparison betwe<strong>en</strong> LES and Experim<strong>en</strong>t.
6.3. CHARACTERISATION OF CONTROL ON THE SPRAY 165z /D g e = 430z /D g e = 530z /D g e = 830z /D g e = 12 z /D g e = 163030LESExperim<strong>en</strong>t : PDA20202020201010101010y(mm)00000−10−10−10−10−10−20−20−20−20−20−30 −30 −30 −30 −300 20 40 0 20 40 0 20 40 0 20 40 0 20 40(a) W p(m/s)z /D g e = 430z /D g e = 530z /D g e = 830z /D g e = 12 z /D g e = 163030LESExperim<strong>en</strong>t : PDA20202020201010101010y(mm)00000−10−10−10−10−10−20−20−20−20−20−30 −30 −30 −30 −300 5 10 0 5 10 0 5 10 0 5 10 0 5 10(b) WpRMS (m/s)Figure 6.34 – (Sw2) d p < 20µm : Radial profiles of mean (Top) and RMS (bottom) axial particlevelocity at x = 0. Comparison betwe<strong>en</strong> LES and Experim<strong>en</strong>t.
166 CHAPITRE 6. COMPARISON OF LES AND EXPERIMENTAL DATAz /D g e = 430z /D g e = 530z /D g e = 830z /D g e = 12 z /D g e = 163030LESExperim<strong>en</strong>t : PDA20202020201010101010y(mm)00000−10−10−10−10−10−20−20−20−20−20−30 −30 −30 −30 −300 20 40 0 20 40 0 20 40 0 20 40 0 20 40(a) W p(m/s)z /D g e = 430z /D g e = 530z /D g e = 830z /D g e = 12 z /D g e = 163030LESExperim<strong>en</strong>t : PDA20202020201010101010y(mm)00000−10−10−10−10−10−20−20−20−20−20−30 −30 −30 −30 −300 5 10 0 5 10 0 5 10 0 5 10 0 5 10(b) WpRMS (m/s)Figure 6.35 – (Sw2) 20µm < d p < 50µm : Radial profiles of mean (Top) and RMS (bottom)axial particle velocity at x = 0. Comparison betwe<strong>en</strong> LES and Experim<strong>en</strong>t.
6.3. CHARACTERISATION OF CONTROL ON THE SPRAY 167z /D g e = 430z /D g e = 530z /D g e = 830z /D g e = 12 z /D g e = 163030LESExperim<strong>en</strong>t : PDA20202020201010101010y(mm)00000−10−10−10−10−10−20−20−20−20−20−30 −30 −30 −30 −300 20 40 0 20 40 0 20 40 0 20 40 0 20 40(a) W p(m/s)z /D g e = 430z /D g e = 530z /D g e = 830z /D g e = 12 z /D g e = 163030LESExperim<strong>en</strong>t : PDA20202020201010101010y(mm)00000−10−10−10−10−10−20−20−20−20−20−30 −30 −30 −30 −300 5 10 0 5 10 0 5 10 0 5 10 0 5 10(b) WpRMS (m/s)Figure 6.36 – (Sw2) 50µm < d p < 100µm : Radial profiles of mean (Top) and RMS (bottom)axial particle velocity at x = 0. Comparison betwe<strong>en</strong> LES and Experim<strong>en</strong>t.
168 CHAPITRE 6. COMPARISON OF LES AND EXPERIMENTAL DATA504540(Coax) − LES(Coax) − Experim<strong>en</strong>t(Dev55) − LES(Dev55) − Experim<strong>en</strong>t504540(Coax) − LES(Coax) − Experim<strong>en</strong>t(Dev55) − LES(Dev55) − Experim<strong>en</strong>t3535Wp (m/s)302520Wp (m/s)30252015151010550−4 −3 −2 −1 0 1 2 3y/yp0.5C oax0−4 −3 −2 −1 0 1 2 3y/yp0.5C oax(a) d p < 20 µm(b) 20 µm ≤ d p < 50 µm504540(Coax) − LES(Coax) − Experim<strong>en</strong>t(Dev55) − LES(Dev55) − Experim<strong>en</strong>t35Wp (m/s)302520151050−4 −3 −2 −1 0 1 2 3y/yp0.5C oax(c) 50 µm ≤ d p < 100 µmFigure 6.37 – Comparison of droplets velocity profiles for (Coax) and (Dev55) at z/D ge = 12.Table 6.6 – Effect of control on the spray(Dev55) αp Dev ( ◦ )Size class Experim<strong>en</strong>t LES0-20 µm 11 1320-50 µm 11 1250-100 µm 11 12(Sw2)Λ SwpSize class Experim<strong>en</strong>t LES0-20 µm 0.50 0.5420-50 µm 0.4 0.3350-100 µm 0.32 0.3
6.3. CHARACTERISATION OF CONTROL ON THE SPRAY 169504540(Coax) − LES(Coax) − Experim<strong>en</strong>t(Sw2) − LES(Sw2) − Experim<strong>en</strong>t504540(Coax) − LES(Coax) − Experim<strong>en</strong>t(Sw2) − LES(Sw2) − Experim<strong>en</strong>t3535Wp (m/s)302520Wp (m/s)30252015151010550−3 −2 −1 0 1 2 3y/yp0.5C oax0−3 −2 −1 0 1 2 3y/yp0.5C oax(a) d p < 20 µm(b) 20 µm ≤ d p < 50 µm504540(Coax) − LES(Coax) − Experim<strong>en</strong>t(Sw2) − LES(Sw2) − Experim<strong>en</strong>t35Wp (m/s)302520151050−3 −2 −1 0 1 2 3y/yp0.5C oax(c) 50 µm ≤ d p < 100 µmFigure 6.38 – Comparison of droplets velocity profiles for (Coax) and (Sw2) at z/D ge = 12.
170 CHAPITRE 6. COMPARISON OF LES AND EXPERIMENTAL DATAeach box are respectively ∆z = 4 mm and ∆r = 2mm. These dim<strong>en</strong>sions <strong>en</strong>able to sample betwe<strong>en</strong>1000 and 3000 droplets per box. To improve converg<strong>en</strong>ce, the operation is repeated on 12droplet instantaneous realizations separated with a time <strong>de</strong>lay ∆t = 2.5 ms. For a droplet witha velocity equal to 10 m/s, this duration corresponds to a displacem<strong>en</strong>t of 25 mm, which <strong>en</strong>suresthe in<strong>de</strong>p<strong>en</strong>d<strong>en</strong>ce of the samples in a giv<strong>en</strong> box. Concerning experim<strong>en</strong>t, all PDA measurem<strong>en</strong>tsof the instantaneous droplet diameter d p inclu<strong>de</strong>d in a box were gathered to account for the localvariation in this box.Figure 6.39 – Methology to compute the number based size distribution fonction for the dropletdiameters f n (d p ) : view of computation domain with the positions and the dim<strong>en</strong>sions of thesampling boxes.Figure 6.40 pres<strong>en</strong>ts the evolution of f n along the jet axis for (Coax). LES and experim<strong>en</strong>tare compared to the log-normal distribution fn inj used in the injection volume (Section 6.1.2).Agreem<strong>en</strong>t betwe<strong>en</strong> LES and experim<strong>en</strong>t is good : the reduction of proportion of large droplets(d p > 40µm) wh<strong>en</strong> z increases, is predicted by both the simulation and the experim<strong>en</strong>t. Thisph<strong>en</strong>om<strong>en</strong>on could be analyzed as a secondary break-up effect. However, LES does not inclu<strong>de</strong>any secondary atomization mo<strong>de</strong>l so that this ph<strong>en</strong>om<strong>en</strong>on is certainly due to the differ<strong>en</strong>ce ofresponse of droplets to the carrier gas flow : large droplets with high Stokes numbers are ejectedmore rapidly than small droplets towards the jet surrounding air [123]. Figures 6.41 and 6.42pres<strong>en</strong>t the evolution of f n for the controlled cases (Dev55) and (Sw2). Conclusions are similarconcerning the evolution the big droplets. Their proportion <strong>de</strong>creases wh<strong>en</strong> z increases for thetwo configurations. However, an overestimation on the smallest droplets must also be noticed forLES. This discrepancy may be explained by the lack of collision and coalesc<strong>en</strong>ce mo<strong>de</strong>l in theLES. Note also that this probleme does not occur in the simulations of (Coax) (Figure 6.40).This may suggest that actuators increase coalesc<strong>en</strong>ce in the spray.
6.3. CHARACTERISATION OF CONTROL ON THE SPRAY 1714Experim<strong>en</strong>tInjected distributionLES4Experim<strong>en</strong>tInjected distributionLES3.53.533fn (m −1 )4.5 x 10⁴ dp (µm)2.52fn (m −1 )4.5 x 10⁴ dp (µm)2.521.51.5110.50.500 20 40 60 80 10000 20 40 60 80 100(a) z/D ge = 4(b) z/D ge = 84Experim<strong>en</strong>tInjected distributionLES4Experim<strong>en</strong>tInjected distributionLES3.53.533fn (m −1 )4.5 x 10⁴ dp (µm)2.52fn (m −1 )4.5 x 10⁴ dp (µm)2.521.51.5110.50.500 20 40 60 80 10000 20 40 60 80 100(c) z/D ge = 12(d) z/D ge = 16Figure 6.40 – Evolution of f n (d p ) along the jet axis for (Coax)
172 CHAPITRE 6. COMPARISON OF LES AND EXPERIMENTAL DATA4Experim<strong>en</strong>tInjected distributionLES4Experim<strong>en</strong>tInjected distributionLES3.53.533fn (m −1 )4.5 x 10⁴ dp (µm)2.52fn (m −1 )4.5 x 10⁴ dp (µm)2.521.51.5110.50.500 20 40 60 80 10000 20 40 60 80 100(a) z/D ge = 4, y = −5mm(b) z/D ge = 8, y = −9mm4Experim<strong>en</strong>tInjected distributionLES4Experim<strong>en</strong>tInjected distributionLES3.53.533fn (m −1 )4.5 x 10⁴ dp (µm)2.52fn (m −1 )4.5 x 10⁴ dp (µm)2.521.51.5110.50.500 20 40 60 80 10000 20 40 60 80 100(c) z/D ge = 12, y = −13mm(d) z/D ge = 16, y = −18mmFigure 6.41 – Evolution of f n (d p ) along the jet axis for (Dev55)
6.3. CHARACTERISATION OF CONTROL ON THE SPRAY 1734Experim<strong>en</strong>tInjected distributionLES4Experim<strong>en</strong>tInjected distributionLES3.53.533fn (m −1 )4.5 x 10⁴ dp (µm)2.52fn (m −1 )4.5 x 10⁴ dp (µm)2.521.51.5110.50.500 20 40 60 80 10000 20 40 60 80 100(a) z/D ge = 4(b) z/D ge = 84Experim<strong>en</strong>tInjected distributionLES4Experim<strong>en</strong>tInjected distributionLES3.53.533fn (m −1 )4.5 x 10⁴ dp (µm)2.52fn (m −1 )4.5 x 10⁴ dp (µm)2.521.51.5110.50.500 20 40 60 80 10000 20 40 60 80 100(c) z/D ge = 12(d) z/D ge = 16Figure 6.42 – Evolution of f n (d p ) along the jet axis for (Sw2)
174 CHAPITRE 6. COMPARISON OF LES AND EXPERIMENTAL DATA6.4 ConclusionActive control of an air-assisted coaxial spray was studied using LES and experim<strong>en</strong>tal methodsfor two types of actuators : the first one is used to <strong>de</strong>viate the spray while the second oneintroduces swirl into the spray jet to increase its spreading rate. Both actuators use small rectangularjets placed in the outlet plane of the spray coaxial injector. Results show that LES is ableto predict the flow field for the gas and the droplets with and without control. LES also helps toun<strong>de</strong>rstand the mechanisms affecting the controlled spray : coher<strong>en</strong>t structures are induced bythe actuation jets and modify the gaseous flow, g<strong>en</strong>erating droplet movem<strong>en</strong>ts and segregationwhich <strong>de</strong>p<strong>en</strong>d on the droplet size. For the actuator changing the spray direction (Dev55), at acontrol parameter (actuation flow rate divi<strong>de</strong>d by total air flow rate) of 20 perc<strong>en</strong>t, the gas flowcan be <strong>de</strong>viated by 15 <strong>de</strong>grees and droplets by 12 <strong>de</strong>grees. For the swirling actuator (Sw2), ata control parameter of 40 perc<strong>en</strong>t, the spreading rate of the gaseous jet increases by 40 perc<strong>en</strong>tand the spray by 30 to 50 perc<strong>en</strong>t compared to the uncontrolled case while the droplets diameterincreases by only 16 perc<strong>en</strong>t. This suggests that these actuation <strong>de</strong>vices can be effici<strong>en</strong>t control<strong>de</strong>vices in real combustors. The comparison of size distributions obtained with LES and experim<strong>en</strong>talso suggest that the controlled flows are submitted to more collisions and coalesc<strong>en</strong>cemechanisms.
<strong>Chap</strong>itre 7Application industrielle et valorisationEn parallèle <strong>de</strong> l’étu<strong>de</strong> effectuée à l’IMFT, une démarche <strong>de</strong> valorisation industrielle a étém<strong>en</strong>ée. Elle vise à transférer les résultats obt<strong>en</strong>us au cours <strong>de</strong> la thèse vers <strong>de</strong>s applications <strong>de</strong>combustion industrielle. Cette méthodologie avait déjà été employée avec succès dans le cadre<strong>de</strong> la thèse <strong>de</strong>s travaux <strong>de</strong> T. Le<strong>de</strong>rlin et V. Faivre et avait abouti au développem<strong>en</strong>t <strong>de</strong> latechnologie Dynamical pour la gamme <strong>de</strong> brûleurs monophasiques d’Air Liqui<strong>de</strong>. Tout d’abordun brevet conjoint basé sur les résultats expérim<strong>en</strong>taux obt<strong>en</strong>u à l’IMFT a été déposé <strong>en</strong> janvier2007 et publié <strong>en</strong> juillet 2009 (App<strong>en</strong>dix C). De plus au cours <strong>de</strong> l’été 2009, un premier brûleurFuel Liqui<strong>de</strong>/Oxygène intégrant la technologie <strong>de</strong>s jets actionneurs a été développé au CRCD. Cechapitre prés<strong>en</strong>te le fonctionnem<strong>en</strong>t <strong>de</strong> ce brûleur ainsi que quelques premiers résultats obt<strong>en</strong>usà partir d’essais effectués <strong>en</strong> octobre 2009 dans le four ALICE du CRCD.7.1 Le brûleur ALbatch Dynamical FLLe brûleur ALbatch Dynamical FL a été développé au CRCD au cours <strong>de</strong> l’été 2009. Sesprincipales caractéristiques sont les suivantes :– Brûleur Fuel Liqui<strong>de</strong>/oxygène– Géométrie coaxiale "pipe in pipe"– Gamme <strong>de</strong> puissance : 150 à 500 kW– Contrôle dynamique <strong>de</strong> l’incid<strong>en</strong>ce <strong>de</strong> la flamme : 0 à 25 ◦Ce système apparti<strong>en</strong>t à la gamme <strong>de</strong> brûleur ALbatch <strong>de</strong>stinée aux procédés <strong>de</strong> chauffage <strong>en</strong>"batch" : la charge brute est introduite <strong>en</strong> continu à l’<strong>en</strong>trée du four et extraite affinée à la sortie.Durant cette opération les brûleurs placés <strong>en</strong> paroi du four chauff<strong>en</strong>t la charge. La Figure 7.1prés<strong>en</strong>te une vue 3D du brûleur ALbatch Dynamical FL. La géométrie <strong>de</strong> ce brûleur est <strong>de</strong> typecoaxial : le carburant (ici du fuel liqui<strong>de</strong>) est injecté au c<strong>en</strong>tre d’un écoulem<strong>en</strong>t coaxial d’oxygène.Cette configuration a pour avantage d’être compact et donc facile à intégrer sur différ<strong>en</strong>tesformes <strong>de</strong> fours "batch". L’objectif <strong>de</strong> la technologie "Dynamical" est <strong>de</strong> modifier à volonté letransfert thermique <strong>en</strong> contrôlant l’incid<strong>en</strong>ce <strong>de</strong> la flamme sur la charge. Des actionneurs jetss’inspirant <strong>de</strong>s actionneurs (Dev) testés à l’IMFT ont été utilisés à cet effet.Le spray <strong>de</strong> fuel est généré avec un atomiseur coaxial assisté par air <strong>de</strong> type AL ROBUST(cf. Figure 7.2). Son principe <strong>de</strong> fonctionnem<strong>en</strong>t et ses dim<strong>en</strong>sions sont analogues à l’injecteurutilisé pour cette étu<strong>de</strong> (cf. <strong>Chap</strong>itre 3). Un jet c<strong>en</strong>tral <strong>de</strong> fuel est atomisé par un écoulem<strong>en</strong>t<strong>de</strong> gaz à très gran<strong>de</strong> vitesse. Ce gaz d’atomisation n’est pas nécessairem<strong>en</strong>t <strong>de</strong> l’oxygène. Il peut175
176 CHAPITRE 7. APPLICATION INDUSTRIELLE ET VALORISATIONFigure 7.1 – Vue 3D du brûleur ALbatch Dynamical FL dans son bloc ouvreauaussi s’agir d’air ou <strong>de</strong> vapeur d’eau. Il ne faut pas non plus confondre l’écoulem<strong>en</strong>t du gazd’atomisation avec l’écoulem<strong>en</strong>t coaxial d’oxygène <strong>de</strong>stiné à la combustion du carburant qui esttrès l<strong>en</strong>t et dont les dim<strong>en</strong>sions sont bi<strong>en</strong> plus gran<strong>de</strong>s. La stratégie <strong>de</strong> contrôle est id<strong>en</strong>tique àcelle utilisée au cours <strong>de</strong> la thèse : la déviation <strong>de</strong> la flamme est obt<strong>en</strong>ue <strong>en</strong> déviant uniquem<strong>en</strong>t lespray <strong>de</strong> fuel. En revanche l’écoulem<strong>en</strong>t d’oxygène n’est pas controllé. Un actionneur déviant estinstallé sur l’injecteur <strong>de</strong> fuel. Le dispositif choisi est <strong>de</strong> type "f<strong>en</strong>te " tel que celui prés<strong>en</strong>té surla Figure 3.4(b) du paragraphe 3.1.2. Ceci permet <strong>de</strong> conserver une bonne compacité <strong>de</strong> la canned’atomisation. Le débit total <strong>de</strong> gaz d’atomisation est maint<strong>en</strong>u constant. Il est <strong>en</strong>suite réparti<strong>en</strong>tre l’actionneur et l’injecteur. Le régime <strong>de</strong> contrôle est donc défini par le même paramètreR ac que dans le chapitre 5 (Eq. 5.3). <strong>Les</strong> lois <strong>de</strong> contrôle utilisées s’inspir<strong>en</strong>t directem<strong>en</strong>t <strong>de</strong>srésultats obt<strong>en</strong>us à l’IMFT.7.2 Performances du brûleur DynamicalDes test <strong>de</strong> fonctionnem<strong>en</strong>t du brûleur ALbatch Dynamical FL ont été effectués dans le fourexpérim<strong>en</strong>tal ALICE du CRCD pour trois puissances <strong>de</strong> flamme différ<strong>en</strong>tes : 145, 250 et 450kW. La valeur maximale du paramètre <strong>de</strong> contrôle est 0.35. Cela signifie que 65% du débit total<strong>de</strong> gaz d’atomisation circule dans l’atomiseur coaxial (atomisation du jet liqui<strong>de</strong>) et 35% <strong>de</strong> cegaz alim<strong>en</strong>te l’actionneur (Déviation du spray). La première caractéristique du brûleur, l’angled’incid<strong>en</strong>ce <strong>de</strong> la flamme, est déterminée directem<strong>en</strong>t sur <strong>de</strong>s images <strong>de</strong> la flamme telles que celleprés<strong>en</strong>tée sur la Figure 7.3.La Figure 7.4 prés<strong>en</strong>te l’évolution <strong>de</strong> l’angle d’incid<strong>en</strong>ce <strong>de</strong> la flamme <strong>en</strong> fonction du rapport<strong>de</strong> contrôle R ac pour les trois puissances testées. Cette angle varie quasi-linéairem<strong>en</strong>t jusqu’à23 ◦ ce qui démontre l’efficacité <strong>de</strong>s jets actionneurs pour le contrôle <strong>de</strong> flamme diphasique et <strong>en</strong>
7.2. PERFORMANCES DU BRÛLEUR DYNAMICAL 177Figure 7.2 – Vue 3D du brûleur ALbatch Dynamical FL dans son bloc ouvreau(a) Flamme 450W sans contrôle R ac = 0 (b) Flamme 450W avec contrôle R ac = 0.26Figure 7.3 – Visualisation <strong>de</strong> la flamme déviée issue du brûleur ALbatch Dynamical FL pourune puissance <strong>de</strong> flamme <strong>de</strong> 450 kW : R ac = 0 et R ac = 0.26.
178 CHAPITRE 7. APPLICATION INDUSTRIELLE ET VALORISATIONparticulier la stratégie choisie pour cette thèse : pour dévier la flamme diphasique, il suffit <strong>de</strong>dévier le spray <strong>de</strong> fuel.Figure 7.4 – Evolution <strong>de</strong> l’angle d’incid<strong>en</strong>ce <strong>de</strong> la flamme DYNAMICAL <strong>en</strong> fonction du régime<strong>de</strong> contrôle R ac
<strong>Chap</strong>itre 8ConclusionDans cette thèse, nous avons conçu et testé avec succès <strong>de</strong>s actionneurs permettant <strong>de</strong> contrôlerla trajectoire et le taux d’ouverture <strong>de</strong> sprays assistés par air. Ce travail a été m<strong>en</strong>é <strong>en</strong> s’appuyantsur <strong>de</strong>s outils expérim<strong>en</strong>taux et numériques. Ainsi, un banc expérim<strong>en</strong>tal permettant <strong>de</strong>tester un atomiseur équipé d’actionneurs a été installé à l’IMFT et a été doté d’une métrologiepermettant <strong>de</strong> caractériser l’écoulem<strong>en</strong>t <strong>de</strong> gaz d’atomisation et la phase dispersée. Pour <strong>de</strong>sraisons <strong>de</strong> sécurité, le carburant liqui<strong>de</strong> et l’oxygène habituellem<strong>en</strong>t utilisés pour les applications<strong>de</strong> combustion industrielle ont été remplacés par <strong>de</strong> l’eau et <strong>de</strong> l’air comprimé. <strong>Les</strong> expéri<strong>en</strong>cesont donc été m<strong>en</strong>ées hors <strong>de</strong>s conditions d’évaporation et <strong>de</strong> combustion et seuls les phénomènesd’atomisation et <strong>de</strong> dispersion <strong>de</strong> gouttes ont été étudiés pour définir et tester les actionneurs.L’injecteur utilisé pour cette cette expéri<strong>en</strong>ce modèle est très proche <strong>de</strong>s cannes d’injection<strong>de</strong> carburant <strong>de</strong>s brûleurs développés par Air Liqui<strong>de</strong>. Il s’agit d’un atomiseur coaxial assisté parair : un jet liqui<strong>de</strong> c<strong>en</strong>tral est atomisé par un écoulem<strong>en</strong>t <strong>de</strong> gaz à très gran<strong>de</strong> vitesse. Du fait<strong>de</strong> sa simplicité géométrique, ce type d’injecteur est aussi très utilisé <strong>en</strong> recherche pour étudierles phénomènes d’atomisation. Il constitue donc un excell<strong>en</strong>t outil pour tester et compr<strong>en</strong>dre lesphénomènes mis <strong>en</strong> jeu par les dispositifs <strong>de</strong> contrôle. En pratique, seuls <strong>de</strong>s fonctionnem<strong>en</strong>tsà grand nombre <strong>de</strong> Weber (régimes fibres et superpulsants) ont été testés pour cette étu<strong>de</strong> carils permett<strong>en</strong>t une atomisation plus efficace et sont donc susceptibles <strong>de</strong> fournir <strong>de</strong> meilleursr<strong>en</strong><strong>de</strong>m<strong>en</strong>ts <strong>de</strong> combustion.<strong>Les</strong> actionneurs sont <strong>de</strong>s petits jets transverses à section rectangulaire placés à la sortie<strong>de</strong> l’injecteur. Deux familles d’actionneurs jet ont été testées expérim<strong>en</strong>talem<strong>en</strong>t : un dispositiféquipé d’un actionneur impactant le jet principal (Dev) et dont l’objectif est <strong>de</strong> dévier le spray,et un dispositif équipé <strong>de</strong> 4 actionneurs tang<strong>en</strong>ts au spray (Sw) dont l’objectif est d’augm<strong>en</strong>terle taux d’expansion du spray.Deux configurations du banc expérim<strong>en</strong>tal ont été utilisées au cour <strong>de</strong> la thèse. La première,équipée d’un système d’anémométrie fil chaud placé sur un déplacem<strong>en</strong>t 3D motorisé sur <strong>de</strong>uxaxes, a été dédié à la mesure du champ <strong>de</strong> vitesse <strong>de</strong> l’écoulem<strong>en</strong>t turbul<strong>en</strong>t <strong>de</strong> gaz d’atomisation,sans injection <strong>de</strong> liqui<strong>de</strong> dans la buse c<strong>en</strong>trale <strong>de</strong> l’injecteur. La secon<strong>de</strong> configuration <strong>de</strong>l’expéri<strong>en</strong>ce a permis d’effectuer <strong>de</strong>s visualisations du gaz et du spray par strioscopie ou ombroscopie.Elle était <strong>de</strong> plus équipée d’un granulomètre PDA 1D afin <strong>de</strong> mesurer le champ euléri<strong>en</strong><strong>de</strong> vitesse axiale <strong>de</strong> la phase dispersée et les distributions numériques <strong>de</strong> diamètres <strong>de</strong> gouttes.Pour compléter ce travail expérim<strong>en</strong>tal, cette thèse a <strong>de</strong> plus fait appel à <strong>de</strong>s outils numériquespour effectuer <strong>de</strong>s simulations 3D instationnaires du spray généré par l’injecteur coaxial : lasimulation aux gran<strong>de</strong>s échelles (LES) pour la phase porteuse et le suivi Lagrangi<strong>en</strong> <strong>de</strong>s particulespour la phase dispersée. Nous avons <strong>en</strong> particulier utilisé le co<strong>de</strong> <strong>de</strong> LES, AVBP et son module179
180 CHAPITRE 8. CONCLUSIONLagrangi<strong>en</strong>. Si aucun développem<strong>en</strong>t n’a été effectué au cours <strong>de</strong> la thèse sur le noyau du co<strong>de</strong>,nous avons <strong>en</strong> revanche revisité la métho<strong>de</strong> d’injection <strong>de</strong> turbul<strong>en</strong>ce dans AVBP. En effet, laconfiguration expérim<strong>en</strong>tale <strong>de</strong> l’IMFT comporte plusieurs <strong>en</strong>trées turbul<strong>en</strong>tes sur lesquelles ilest nécessaire <strong>de</strong> pouvoir injecter <strong>de</strong> la turbul<strong>en</strong>ce. <strong>Les</strong> premiers tests effectués au cours <strong>de</strong> cettethèse ont montré <strong>de</strong>s niveaux <strong>de</strong> bruits et <strong>de</strong> vitesse RMS sur les <strong>en</strong>trées qui étai<strong>en</strong>t incorrects.Il a donc été décidé d’étudier ce problème <strong>en</strong> détail.Pour simuler une <strong>en</strong>trée turbul<strong>en</strong>te dans un co<strong>de</strong> LES ou DNS compressible tel AVBP, <strong>de</strong>uxingrédi<strong>en</strong>ts sont nécessaires : une métho<strong>de</strong> <strong>de</strong> génération <strong>de</strong> turbul<strong>en</strong>ce et une condition limitequi impose le le profile <strong>de</strong> vitesse moy<strong>en</strong>, injecte le champ turbul<strong>en</strong>t tout <strong>en</strong> étant non réfléchissantepour les on<strong>de</strong>s acoustiques. L’algorithme <strong>de</strong> génération <strong>de</strong> turbul<strong>en</strong>ce initialem<strong>en</strong>t codédans AVBP est la métho<strong>de</strong> <strong>de</strong> Kraichnan qui permet <strong>de</strong> construire un champ <strong>de</strong> vitesse turbul<strong>en</strong>te3D selon un spectre donnée (ici Passot-Pouquet) mais non périodique. La métho<strong>de</strong> MVT(Multi-Vortex-Turbul<strong>en</strong>ce) a <strong>de</strong> plus été développée au cours <strong>de</strong> cette thèse. Elle permet <strong>de</strong> générerun écoulem<strong>en</strong>t turbul<strong>en</strong>t 2D périodique et a été utilisée pour <strong>de</strong>s cas tests 2D et périodiquesd’injection <strong>de</strong> turbul<strong>en</strong>ce comparant différ<strong>en</strong>tes conditions limites caractéristiques. Ces cas testsont montré que les métho<strong>de</strong>s NSCBC classiques pour l’injection d’on<strong>de</strong> acoustique ne sont pasadaptées à l’injection <strong>de</strong> turbul<strong>en</strong>ce dans un calcul <strong>de</strong> LES. La formulation NSCBC non réfléchissant<strong>en</strong>e permet pas d’obt<strong>en</strong>ir <strong>de</strong>s statistiques correctes. La formulation purem<strong>en</strong>t réfléchissante<strong>de</strong> NSCBC bi<strong>en</strong> qu’elle injecte correctem<strong>en</strong>t le champ <strong>de</strong> vitesse turbul<strong>en</strong>te ne peut être utiliséeque <strong>de</strong>s <strong>de</strong>s co<strong>de</strong>s DNS dont le schéma numérique d’ordre élevé est très peu dispersif. Nous avonsdonc proposé une condition limite caractéristique non-réfléchissante VFCBC (Vortical Flow CharacteristicBoundary Condition) [56] qui permet d’injecter un champ turbul<strong>en</strong>t avec <strong>de</strong>s niveaux<strong>de</strong> RMS corrects tout <strong>en</strong> minimisant le niveau <strong>de</strong> bruit.Ces diagnostics expérim<strong>en</strong>taux et numériques ont été utilisés pour caractériser le fonctionnem<strong>en</strong>t<strong>de</strong> l’injecteur équipé <strong>de</strong> différ<strong>en</strong>ts actionneurs. Pour chaque famille d’actionneurs, <strong>de</strong>uxdim<strong>en</strong>sionnem<strong>en</strong>ts ont été proposés. Leur efficacité et l’ét<strong>en</strong>due <strong>de</strong> leur domaine <strong>de</strong> fonctionnem<strong>en</strong>tont été analysées grâce à <strong>de</strong>s visualisations strioscopiques et <strong>de</strong>s mesures PDA pourdiffér<strong>en</strong>ts rapports <strong>de</strong> contrôle R ac . Chaque actionneur (Dev) permet <strong>de</strong> modifier l’angle d’incid<strong>en</strong>cedu spray. Toutefois augm<strong>en</strong>ter le diamètre <strong>de</strong> sortie <strong>de</strong> la pastille <strong>de</strong> contrôle D augm<strong>en</strong>tefortem<strong>en</strong>t l’amplitu<strong>de</strong> <strong>de</strong> déviation du spray (jusqu’à 30 ◦ ) mais réduit la dynamique <strong>de</strong>s goutteset dégra<strong>de</strong> l’atomisation. Pour la gamme (Sw), optimiser la section débitante <strong>de</strong>s actionneurs etréduire le diamètre <strong>de</strong> sortie D permet <strong>de</strong> réduire l’effet du contrôle sur l’atomisation tout <strong>en</strong>augm<strong>en</strong>tant efficacem<strong>en</strong>t le taux d’expansion du spray.Afin <strong>de</strong> mieux compr<strong>en</strong>dre l’effet du contrôle sur le jet diphasique, mais aussi d’évaluer lesperformances d’une LES diphasique sur ces configurations, une comparaison LES/expéri<strong>en</strong>ce aété effectuée pour trois fonctionnem<strong>en</strong>ts du dispositif expérim<strong>en</strong>tal <strong>de</strong> l’IMFT : la configuration(Coax) qui correspond à l’injecteur coaxial sans système <strong>de</strong> contrôle, la configuration <strong>de</strong> déviation(Dev55) pour un rapport <strong>de</strong> contrôle R ac = 0.2 et la configuration avec swirl (Sw2) pour unrapport <strong>de</strong> contrôle R ac = 0.4. Le fonctionnem<strong>en</strong>t <strong>de</strong> l’injecteur sans injection <strong>de</strong> liqui<strong>de</strong> esttout d’abord analysé <strong>en</strong> effectuant <strong>de</strong>s simulations LES monophasiques <strong>de</strong> chaque configurationet <strong>en</strong> les comparant à <strong>de</strong>s mesures <strong>de</strong> champ <strong>de</strong> vitesse fil chaud. Deux calculs LES du jetannulaire (Coax) avec et sans injection <strong>de</strong> turbul<strong>en</strong>ce démontr<strong>en</strong>t la nécessité d’obt<strong>en</strong>ir uneturbul<strong>en</strong>ce établie à l’<strong>en</strong>trée du domaine <strong>de</strong> calcul pour mieux décrire le champ proche du jet oùse déroul<strong>en</strong>t les principaux phénomènes <strong>de</strong> transition et <strong>de</strong> mélange turbul<strong>en</strong>t. <strong>Les</strong> simulationsLES monophasiques <strong>de</strong>s trois configurations montr<strong>en</strong>t <strong>en</strong>suite un très bon accord avec les mesuresexpérim<strong>en</strong>tales fil chaud. On observe <strong>en</strong> particulier un effet important du contrôle sur la structure
181<strong>de</strong> l’écoulem<strong>en</strong>t. Le jet perd ses propriétés axisymétriques et pr<strong>en</strong>d <strong>de</strong>s formes 3D plus complexesforme <strong>de</strong> coeur puis elliptique dans le cas (Dev55), forme hélicoïdale dans le cas (Sw2). Le contrôlese traduit <strong>de</strong> plus par l’apparition <strong>de</strong> structures tourbillonnaires générées par l’interaction <strong>en</strong>treles jets actionneurs et le jet principal.Dans un second temps, <strong>de</strong>s calculs LES avec injection <strong>de</strong> gouttes et suivi Lagrangi<strong>en</strong> <strong>de</strong> leurtrajectoire ont été effectués pour étudier l’effet du contrôle sur le spray. <strong>Les</strong> fonctionnem<strong>en</strong>t <strong>de</strong>strois configurations (Coax), (Sw2), (Dev55) ont été simulés et comparés aux mesures PDA. <strong>Les</strong>comparaisons <strong>en</strong>tre LES et expéri<strong>en</strong>ces prés<strong>en</strong>t<strong>en</strong>t un bon accord. La LES retrouve <strong>en</strong> particulierl’a déviation obt<strong>en</strong>ue expérim<strong>en</strong>talem<strong>en</strong>t dans le cas (Dev55) ainsi que le taux d’expansion duspray du cas avec swirl (Sw2).L’<strong>en</strong>semble <strong>de</strong> ces résultats démontre l’intérêt <strong>de</strong> la technologie <strong>de</strong>s jets actionneurs pourcontrôler l’angle d’incid<strong>en</strong>ce et le taux d’expansion du spray. La LES couplée à un moduleLagrangi<strong>en</strong> apparaît <strong>de</strong> plus comme un outil prometteur pour dim<strong>en</strong>sionner et optimiser cessystèmes. Il faut <strong>en</strong>suite noter la simplicité <strong>de</strong> fonctionnem<strong>en</strong>t et la robustesse <strong>de</strong>s jets actionneursqui n’utilis<strong>en</strong>t ni composants électroniques ni pièces mobiles. Ce sont donc d’excell<strong>en</strong>ts candidatspour <strong>de</strong>s applications <strong>en</strong> combustion industrielle. Pr<strong>en</strong>ant exemple sur les travaux précéd<strong>en</strong>tseffectués par T. Le<strong>de</strong>rlin et V. Faivre, une démarche <strong>de</strong> valorisation industrielle du procédé <strong>de</strong>contrôle par jet actionneur a débuté <strong>en</strong> Janvier 2007 avec le dépôt d’un brevet conjoint AirLiqui<strong>de</strong>/CNRS-INPT. De plus un brûleur diphasique expérim<strong>en</strong>tal intégrant <strong>de</strong>s actionneurs(Dev) a été développé par Air Liqui<strong>de</strong>. <strong>Les</strong> premiers essais effectués <strong>en</strong> Octobre 2009 ont permisd’obt<strong>en</strong>ir une déviation <strong>de</strong> flamme jusqu’à 25 ◦ .
182 CHAPITRE 8. CONCLUSION
Bibliographie[1] K. K. Kuo. Principles of combustion. John Wiley & Sons, Inc., Hobok<strong>en</strong>, New Jersey, 2n<strong>de</strong>dition, 2005.[2] T. Poinsot and D. Veynante. Theoretical and Numerical Combustion. R.T. Edwards, 2n<strong>de</strong>dition, 2005.[3] T. Lieuw<strong>en</strong> and V. Yang. Combustion instabilities in gas turbine <strong>en</strong>gines. operational experi<strong>en</strong>ce,fundam<strong>en</strong>tal mechanisms and mo<strong>de</strong>ling. In Prog. in Astronautics and AeronauticsAIAA, volume 210, 2005.[4] K. McManus and C. Bowman. Effects of controlling vortex dynamics on the performanceof a dump combustor. In Tw<strong>en</strong>ty-third Symp. (Int.) on Combustion, pages 1093–1099,Orleans, 1990. The Combustion Institute, Pittsburgh.[5] M. A. Heckl. Active control of the noise from a rijke tube. In IUTAM Symposium on Aeroand Hydro-Acoustics, pages 211–216, Ecole C<strong>en</strong>trale <strong>de</strong> Lyon, 1985. Springer Verlag.[6] T. Poinsot and S. Can<strong>de</strong>l. Nonlinear studies of low-frequ<strong>en</strong>cy combustion instabilities. InNijhoff, editor, Mathematic mo<strong>de</strong>ling in combustion and related topics, volume 140, pages185–215. NATO ASI Series, Dordrecht, 1987.[7] W. Lang, T. Poinsot, F. Bouri<strong>en</strong>ne, S. Can<strong>de</strong>l, and E. Esposito. Suppression of combustioninstabilities by active control. In AIAA Paper 87-1876, editor, 23rd Joint PropulsionConfer<strong>en</strong>ce, 1987.[8] G. Billoud, M. Galland, C. Huynh, and S. Can<strong>de</strong>l. Adaptive active control of combustioninstabilities. Combust. Sci. Tech. , 81 :257–283, 1992.[9] O. Delabroy, E. Haile, F. Lacas, S. Can<strong>de</strong>l, A. Pollard, A. Sobiesak, and H. A. Becker. Passiveand active control of nox in industrial burners. Experim<strong>en</strong>tal Thermal Fluid Sci<strong>en</strong>ces,1997.[10] T. Poinsot, W. Lang, F. Bouri<strong>en</strong>ne, S. Can<strong>de</strong>l, and E. Esposito. Suppression of combustioninstabilities by active control. J. Prop. Power , 5 :14–20, 1989.[11] K. McManus, T. Poinsot, and S. Can<strong>de</strong>l. A review of active control of combustion instabilities.Prog. Energy Comb. Sci. , 19 :1–29, 1993.[12] Nicolas Robart. Contrôle actif <strong>de</strong>s instabilités <strong>de</strong> combustion dans les turbines à gaz. PhDthesis, Institut National Polytechnique <strong>de</strong> Toulouse, 2000.[13] Vinc<strong>en</strong>t Faivre. Etu<strong>de</strong> expérim<strong>en</strong>tale et numérique du contrôle actif <strong>de</strong> jets dans <strong>de</strong>schambres <strong>de</strong> combustion. PhD thesis, Institut Nationale Polytechnique <strong>de</strong> Toulouse, 2003.[14] V. Faivre and T. Poinsot. Experim<strong>en</strong>tal and numerical investigations of jet active controlfor combustion applications. J. Turb. , 5 :article–025, 2004.[15] Thomas Le<strong>de</strong>rlin. Conception et étu<strong>de</strong> expérim<strong>en</strong>tale et numérique d’un système <strong>de</strong> contrôle<strong>de</strong> trajectoire et mélange <strong>de</strong>s jets <strong>de</strong> gaz dans les brûleurs à oxygène. PhD thesis, InstitutNational Polytechnique <strong>de</strong> Toulouse, 2007.183
184 BIBLIOGRAPHIE[16] Toufik Boushaki. Du contrôle passif au contrôle actif : application à l’oxy-combustion dans<strong>de</strong>s brûleurs à jets séparés. PhD thesis, Institut National <strong>de</strong>s Sci<strong>en</strong>ces Appliquées <strong>de</strong> Rou<strong>en</strong>,2007.[17] A. H. Lefebvre. Atomization and Sprays. Taylor & Francis, 1989.[18] L. Bayvel and Z. Orzechowski. Liquid Atomization. 1993.[19] L. Rayleigh. The explanation of certain acoustic ph<strong>en</strong>om<strong>en</strong>a. Nature, July 18 :319–321,1878.[20] L. Rayleigh. The Theory of Sound. Mac Millan (reprinted by Dover, New York, 1945),1894.[21] P. G. Drazin and W. H. Reid. Hydrodynamic stability. Cambridge University Press, London,1981.[22] C. Weber and Z. Angrew. The <strong>de</strong>composition of a liquid jet. Math. Mech., 11 :136–154,1931.[23] W.A. Sirignano and C. Mehring. Review of theory of distortion and disintegration of liquidstreams. Prog. Energy Comb. Sci. , 26 :609–655, 2000.[24] J.C. Lasheras, E. Villermaux, and E. J. Hopfinger. Break-up and atomization of a roundwater jet by a high-speed annular air jet. J. Fluid Mech. , 357 :351–379, 1998.[25] G. M. Faeth, L.P. Hsiang, and P.K. Wu. Structure and breakup proper of sprays. Int. J.Multiphase Flow , 21 :99–127, 1995.[26] Z. Farago and N. Chigier. Morphological classification of disintegration of round liquid jetsin a coaxial air stream. Atomization and Sprays , 2 :137–153, 1992.[27] J. O. Hinze. Fundam<strong>en</strong>tal of the hydrodynamic mechanism of splitting in dispersion processes.AIChE J., 1 :289–295, 1955.[28] Christophe Dumouchel. Atomisation and sprays. October 5-10th 2006.[29] A.H. Lefebvre. Gas Turbine Combustion. Taylor & Francis, second edition, 1998.[30] J.C. Lasheras and E.J. Hopfinger. Liquid jet instability and atomisation in a coaxial gasstream. Ann. Rev. Fluid Mech. , 32 :275–308, 2000. ERbib.[31] S.P ; Lin and R.D. Reitz. Drop and spray form from a liquid jet. Ann. Rev. Fluid Mech., 30 :85–105, 1998.[32] Bertrand Leroux. Etu<strong>de</strong> expérim<strong>en</strong>tale <strong>de</strong>s flammes oxygéne - combustible liqui<strong>de</strong>. PhDthesis, Ecole C<strong>en</strong>trale Paris, 2002.[33] W. R. Lane. shatter of drops in stream of air. Ind. Eng. Chem., Fundam., 43(6) :1312–1317,1951.[34] E. Villermaux. Mixing abnd spray form in coaxial jets. J. Prop. Power , 14(5) :807–817,1998.[35] E.J. Gutmark. Flow control with non circular jets. Ann. Rev. Fluid Mech. , 31 :239–272,1999.[36] L.J.S. Bradbury and A.H. Kha<strong>de</strong>m. The distorsion of a jet by tabs. J. Fluid Mech. ,70(4) :801–813, 1975.[37] C.M. Ho and E. Gutmark. Vortex induction and mass <strong>en</strong>trainm<strong>en</strong>t in a small-aspect-ratioelliptic jet. J. Fluid Mech. , 179 :383–405, 1987.[38] H. Suzuki, N. Kasagi, and Y. Suzuki. Active control of an axisymmetric jet with anintellig<strong>en</strong>t nozzle. In First International Symposium on Turbul<strong>en</strong>t Shear Flow, 1999.
BIBLIOGRAPHIE 185[39] B.L. Smith and A. Glezer. Jet vectoring using synthetic jets. J. Fluid Mech. , 458 :1–34,2002.[40] L.G. Pack and A. Seifert. Periodic excitation for jet vectoring and <strong>en</strong>hanced spreading. In37th AIAA Aerospace Sci<strong>en</strong>ce meeting and Exhibit, 1999.[41] Anna A. Pavlova, Kiyoshi Otani, and Michael Amitay. Active control of sprays using asingle synthetic jet actuator. Int. J. Heat Fluid Flow , 2007.[42] M.R. Davis. Variable control of jet <strong>de</strong>cay. AIAA Journal , 20, 1982.[43] S. D<strong>en</strong>is, J. Delville, J.H. Garem, and J.P. Bonnet. Contrôle <strong>de</strong> l’expansion d’un jet rondpar <strong>de</strong>s jets impactants. In 14ème Congrès Français <strong>de</strong> mécanique, 1999.[44] U. Shavit and N. Chigier. Developm<strong>en</strong>t and evaluation of a new turbul<strong>en</strong>ce g<strong>en</strong>erator foratomization research. Exp. Fluids , 20 :291–301, 1996.[45] U. Shavit. Gas-liquid interaction in the liquid breakup region of twin-fluid atomization.Exp. Fluids , 31 :550–557, 2001.[46] Dominique Marro. Contrôle actif <strong>de</strong> la pulvérisation et <strong>de</strong> la vaporisation d’un spray. PhDthesis, Institut National Polytechnique <strong>de</strong> Toulouse, 1998.[47] N. Otsu. A threshold selection method for gray-level histograms. IEE trans. on Systems,Man and Cybernetics, 9 :62–66, 1979.[48] H. H. Bruun. Hot-wire anemometry. Principles and Signal Analysis. Oxford Sci<strong>en</strong>ce Publications,1995.[49] F Jorg<strong>en</strong>s<strong>en</strong>. Directional s<strong>en</strong>sitivity of wire and fiber film probe. DISA Info., 11 :31–37,1971.[50] W.K. George, P.D. Beuther, and J. L. Lumley. Processing of random signals. In Proc.Dynamic Flow Conf., Marseille, pages 757–799, 1978.[51] W. Farmer. Sample space for part size and velocity measuring interferometers. AppliedOptics, 15, 1976.[52] W. D. Bachalo and M. J. Houser. Phase/doppler spray analyser for simultaneous measurem<strong>en</strong>tsof drop size and velocity distributions. Opt. Eng., 23 :583–590, 1984.[53] M. Saffman, P. Buchhave, and H. Tanger. Simultaneous measurem<strong>en</strong>ts of size conc<strong>en</strong>trationand velocity of spherical pearticles by a laser doppler method. In 2nd Int. Symp. on App.of Laser Anemometry To Fluid Mechanics, 1984.[54] W. Bachalo. Spray diagnostics for the tw<strong>en</strong>ty-first c<strong>en</strong>tury. Atomization and Sprays ,10 :439–474, 2000.[55] C. Tropea. Developm<strong>en</strong>ts of specialized phase doppler techniques and refractive in<strong>de</strong>xmeasurem<strong>en</strong>ts. In Lecture Series 1999, volume 1, pages N1–N30. VKI for Fluid Dynamics,1999.[56] N. Guez<strong>en</strong>nec and T. Poinsot. Acoustically non-reflecting and reflecting boundary conditionsfor injection of vorticity in compressible solvers. Am. Inst. Aeronaut. Astronaut. J., 47(7) :1709–1722, 2009.[57] O. Colin. Simulations aux gran<strong>de</strong>s échelles <strong>de</strong> la combustion turbul<strong>en</strong>te prémélangée dansles statoréacteurs. Phd thesis, INP Toulouse, 2000.[58] O. Colin. A finite elem<strong>en</strong>t operator for diffusion terms in avbp. Technical report, IFP,Janvier 2003.[59] V. Moureau. Simulation aux gran<strong>de</strong>s échelles <strong>de</strong> l’aérodynamique interne <strong>de</strong>s moteurs àpiston. Phd thesis, Ecole C<strong>en</strong>trale Paris, 2004.
186 BIBLIOGRAPHIE[60] T. Poinsot, T. Echekki, and M. G. Mungal. A study of the laminar flame tip and implicationsfor premixed turbul<strong>en</strong>t combustion. Combust. Sci. Tech. , 81(1-3) :45–73, 1992.[61] K. W. Thompson. Time <strong>de</strong>p<strong>en</strong>d<strong>en</strong>t boundary conditions for hyperbolic systems. J. Comput.Phys. , 68 :1–24, 1987.[62] D. H. Rudy and J. C. Strikwerda. A non-reflecting outflow boundary condition for subsonicnavier stokes calculations. J. Comput. Phys. , 36 :55–70, 1980.[63] L. Selle, F. Nicoud, and T. Poinsot. The actual impedance of non-reflecting boundaryconditions : implications for the computation of resonators. AIAA Journal , 42(5) :958–964, 2004.[64] M. Baum. Etu<strong>de</strong> <strong>de</strong> l’allumage et <strong>de</strong> la structure <strong>de</strong>s flammes turbul<strong>en</strong>tes. Phd thesis,Ecole C<strong>en</strong>trale Paris, 1994.[65] Marta Garcia. Développem<strong>en</strong>t et validation du formalisme Euler-Lagrange dans un solveurparallèle et non structuré pour la simulation aux gran<strong>de</strong>s échelles. PhD thesis, CERFACS,2009.[66] E. Riber, V. Moureau, M. García., T. Poinsot, and O. Simonin. Evaluation of numericalstrategies for LES of two-phase reacting flows. J. Comput. Phys. , 228 :539–564, 2009.[67] M. R. Maxey. The gravitational settling of aerosol particles in homog<strong>en</strong>eous turbul<strong>en</strong>ceand random flow fields. J. Fluid Mech. , 174 :441–465, 1987.[68] R. Gatignol. The faxén formulae for a rigid particle in an unsteady non-uniform stokesflow. J. Méc. Théor. Appl. , 1(2) :143–160, 1983.[69] S. Sundaram and L. R. Collins. Numerical consi<strong>de</strong>rations in simulating a turbul<strong>en</strong>t susp<strong>en</strong>sionof finite-volume particles. J. Comput. Phys. , 124 :337–350, 1996.[70] M. Hopkins and M. Louge. Inelastic microstructure in rapid granular flows of smooth disks.Phys. Fluids , 3 :47–57, 1991.[71] P. Fe<strong>de</strong> and O. Simonin. Numerical study of the subgrid fluid turbul<strong>en</strong>ce effects on thestatistics of heavy colliding particles. Phys. Fluids , 18(045103), 2006.[72] Dirk Wunsch, Pascal Fe<strong>de</strong>, and Olivier Simonin. Developm<strong>en</strong>t and validation of a binarycollision <strong>de</strong>tection algorithm for polydispersed particle mixture. In 2008 ASME FluidsEngineering Confer<strong>en</strong>ce, 2008.[73] M. Boivin, O. Simonin, and K. D. Squires. Direct numerical simulation of turbul<strong>en</strong>cemodulation by particles in isotropic turbul<strong>en</strong>ce. J. Fluid Mech. , 375 :235–263, 1998.[74] O. Vermorel. Étu<strong>de</strong> numérique et modélisation <strong>de</strong> la turbul<strong>en</strong>ce dans un écoulem<strong>en</strong>t d<strong>en</strong>appe chargée <strong>en</strong> particules. Phd thesis, INP Toulouse, 2003.[75] S. Elghobashi and G. Trues<strong>de</strong>ll. On the two-way interaction betwe<strong>en</strong> homog<strong>en</strong>eous turbul<strong>en</strong>ceand dispersed solid particles. Phys. Fluids , 5(7) :1790–1801, 1993.[76] K. D. Squires and J. K. Eaton. Particle response and turbul<strong>en</strong>ce modification in isotropicturbul<strong>en</strong>ce. Phys. Fluids A, 2(7) :1191–1203, 1990.[77] R. Miller and J. Bellan. Direct numerical simulation and subgrid analysis of a transitionaldroplet lad<strong>en</strong> mixing layer. Phys. Fluids , 12(3), 1999.[78] M. Boivin, O. Simonin, and K. D. Squires. On the prediction of gas-solid flows with two-waycoupling using large eddy simulation. Phys. Fluids , 12(8) :2080–2090, 2000.[79] L. Schiller and A. Nauman. A drag coeffici<strong>en</strong>t correlation. VDI Zeitung, 77 :318–320, 1935.[80] M. Maxey and J. Riley. Equation of motion for a small rigid sphere in a nonuniform flow.Phys. Fluids , 26(4), 1983.
BIBLIOGRAPHIE 187[81] Q. Wang and K. D. Squires. Large eddy simulation of particle-lad<strong>en</strong> turbul<strong>en</strong>t channelflow. Phys. Fluids , 8(5) :1207–1223, 1996.[82] Y. Yamamoto, M. Potthoff, T. Tanaka, T. Kajishima, and Y. Tsuji. Large-eddy simulationof turbul<strong>en</strong>t gas-particle flow in a vertical channel : effect of consi<strong>de</strong>ring inter-particlecollisions. J. Fluid Mech. , 442 :303–334, 2001.[83] S.V. Apte, K.P. Mahesh, P. Moin, and J.C. Oefelein. Large-eddy simulation of swirlingparticle-lad<strong>en</strong> flows in a coaxial-jet combustor. Int. J. Multiphase Flow , 29 :1311–1331,2003.[84] T. Poinsot and S. Lele. Boundary conditions for direct simulations of compressible viscousflows. J. Comput. Phys. , 101(1) :104–129, 1992.[85] L. Guichard, J. Réveillon, and R. Hauguel. Direct numerical simulation of statistically stationaryone and two-phase turbul<strong>en</strong>t combustion : a turbul<strong>en</strong>t injection procedure. Flow,Turb. and Combustion , 73 :133–167, 2004.[86] P. Domingo, L. Vervisch, S. Payet, and R. Hauguel. DNS of a premixed turbul<strong>en</strong>t V-Flameand LES of a ducted flame using a FSD-<strong>PDF</strong> subgri<strong>de</strong> scale closure with FPI-tabulatedchemistry. Combust. Flame , 143(4) :566–586, 2005.[87] M. Klein, A. Sadiki, and J. Janicka. Investigation of the influ<strong>en</strong>ce of the reynolds numberon a plane jet using direct numerical simulation. Int. J. Heat Fluid Flow , 24 :785–794,2003.[88] M. Klein, A. Sadiki, and J. Janicka. A digital filter based g<strong>en</strong>eration of inflow data for spatially<strong>de</strong>veloping direct numerical or large eddy simulations. J. Comput. Phys. , 186 :652–665, 2003.[89] A. Smirnov, S. Shi, and I. Celik. Random flow g<strong>en</strong>eration technique for large eddy simulationsand particle-dynamics mo<strong>de</strong>ling. Trans. ASME. J. Fluids Eng. , 123 :359–371,2001.[90] S. Lee, S. Lele, and P. Moin. Simulation of spatially evolving turbul<strong>en</strong>ce and the applicabilityof taylor’s hypothesis in compressible flows. Phys. Fluids A, 4(7) :1521–1530,1992.[91] R.H. Kraichnan. Diffusion by a random velocity field. Phys. Fluids , 13 :22–31, 1970.[92] R. Prosser. Improved boundary conditions for the direct numerical simulation of turbul<strong>en</strong>tsubsonic flows i : Inviscid flows. J. Comput. Phys. , 207 :736–768, 2005.[93] R. Prosser. Towards improved boundary conditions for the dns and les of turbul<strong>en</strong>t subsonicflows. J. Comput. Phys. , 222 :469–474, 2007.[94] C. Bailly, X. Gloerfelt, and C. Bogey. Report on stochastic noise source mo<strong>de</strong>lling. Technicalreport, LMFA, Ecole C<strong>en</strong>trale <strong>de</strong> Lyon, 2002.[95] W. Bechara, C. Bailly, P. Lafon, and S. Can<strong>de</strong>l. Stochastic approach to noise mo<strong>de</strong>ling forfree turbul<strong>en</strong>t flows. AIAA Journal , 32(3) :455–463, 1990.[96] R. Prosser. Improved boundary conditions for the direct numerical simulation of turbul<strong>en</strong>tsubsonic flows i : Inviscid flows. J. Comput. Phys. , submitted, 2004.[97] T. Colonius, S. Lele, and P. Moin. The free compressible vortex. J. Fluid Mech. , 230 :45–73, 1991.[98] I. Celik, I. Yavuz, and A. Smirnov. Large eddy simulations of in-cylin<strong>de</strong>r turbul<strong>en</strong>ce forinternal combustion <strong>en</strong>gines : a review. Int. J. Engine Research, 2(2) :119–148, 2001.
188 BIBLIOGRAPHIE[99] A. Kaufmann, F. Nicoud, and T. Poinsot. Flow forcing techniques for numerical simulationof combustion instabilities. Combust. Flame , 131 :371–385, 2002.[100] C.S. Yoo, Y. Wang, A. Trouvé, and H.G. Im. Characteristic boundary conditions for directsimulations of turbul<strong>en</strong>t counterflow flames. Combust. Theory and Mo<strong>de</strong>lling , 9 :617–646,2005.[101] C.S. Yoo and H.G. Im. Characteristic boundary conditions for simulations of compressiblereacting flows with multi-dim<strong>en</strong>sional, viscous, and reaction effects. Combust. Theory andMo<strong>de</strong>lling , 11 :259–286, 2007.[102] J.M. Tournier. Turbul<strong>en</strong>ce et lois <strong>de</strong> paroi. Master’s thesis, Institut National Polytechnique,CERFACS, 1993.[103] J. O. Hinze. Turbul<strong>en</strong>ce. McGraw-Hill, mcgraw-hill classic textbook reissue edition, 1987.[104] H Eroglu, N. Chigier, and Z. Farago. Coaxial atomizer liquid intact l<strong>en</strong>gth. Phys. FluidsA, 3(2) :303–308, February 1991.[105] C Engelbert, Y Hardalupas, and JH. Whitelaw. Breakup ph<strong>en</strong>om<strong>en</strong>a in coaxial airblastatomizers. Proc. Math. Phys. Sci., (1941) :189–229, 1995.[106] E. Porcheron, Jean-Louis Carreau, D. Le Visage, and Francis Roger. Effect of injection gasd<strong>en</strong>sity on coaxial liquid atomization. Atomization and Sprays , 12(1-3) :20, 2002.[107] I Caré and M. Ledoux. Study of an airblast coaxial atomizer. experim<strong>en</strong>t and mo<strong>de</strong>lisation.In Proceedings of ICLASS-91, pages 7363–768, 1991.[108] N. Chigier and J. M. Beer. The flow region near the nozzle in double conc<strong>en</strong>tric jets. Trans.A.S.M.E., Journal of Basic Engineering, 86 :797–804, 1964.[109] N.W.M. Ko and W.T. Chan. Similarity in the initial region of annular jets : three configurations.J. Fluid Mech. , 84(4) :641–656, 1978.[110] T.W. Davies and J.M. Beer. Flow in the wake of bluff-body flame stabilizers. In Thirte<strong>en</strong>thsymposium on combustion, c○ the Combustion Institute , pages 631–638, 1971.[111] D.F.G. Durao and J. H. Whitelaw. Velocity char of the flow in the near wake of a disk.J. Fluid Mech. , 85(2) :369–385, 1978.[112] J. M. Beer and N. A. Chigier. Combustion aerodynamics. Krieger, Malabar, Florida, 1983.[113] H.A. Warda, S.Z. Kassab, K.A. Elshorbagy, and E.A. Elsaadawy. An experim<strong>en</strong>tal investigationof the near-field region of free turbul<strong>en</strong>t round c<strong>en</strong>tral and annular jets. FlowMeasurem<strong>en</strong>t and Instrum<strong>en</strong>tation, 10 :1–14, 1999.[114] I. B. Celik, Z. N. Cehreli, and I. Yavuz. In<strong>de</strong>x of resolution quality for large eddy simulations.J. Fluids Eng. , 127(949-958), 2005.[115] S.C. Crow and F.H. Champagne. Or<strong>de</strong>rly structures in jet turbul<strong>en</strong>ce. J. Fluid Mech. ,48 :547–591, 1971.[116] I. Wygnanski and H. Fiedler. Some measurem<strong>en</strong>ts in the self-preserving jet. J. FluidMech. , 38(03) :577–612, 1969.[117] H.J. Hussein, S.P. CAPP, and W. K. George. Velocity measurem<strong>en</strong>t in a high-reynoldsnumber,mom<strong>en</strong>tum-conservative, axisymmetric turbul<strong>en</strong>t jet. J. Fluid Mech. , 258(31-75),1994.[118] S. B. Pope. Turbul<strong>en</strong>t flows. Cambridge University Press, 2000.[119] Patrick Chassaing. Turbul<strong>en</strong>ce <strong>en</strong> mécanique <strong>de</strong>s flui<strong>de</strong>s, Analyse du phénomène dans uneperspective <strong>de</strong> modélisation à l’usage <strong>de</strong> l’ingénieur. Institut National Polytechnique <strong>de</strong>Toulouse, 2000.
BIBLIOGRAPHIE 189[120] A. K. Gupta, D. G. Lilley, and N. Syred. Swirl flows. Abacus Press, 1984.[121] G.N. Abramovich. The theory of turbul<strong>en</strong>t jets. The MIT Press Classics, 1963.[122] N. Rajaratnam. Turbul<strong>en</strong>t jets. Elsevier, Amsterdam, The Netherlands, 1976.[123] P. Fe<strong>de</strong>, P. Février, and O. Simonin. Numerical study of the effect of the fluid turbul<strong>en</strong>cemicroscales on particle segregation and collision in gas-solid turbul<strong>en</strong>t flows. In 5th Int.Conf. Multiphase Flow , Yokohama, Japan, 2004. ICMF.[124] M. <strong>Les</strong>ieur. Turbul<strong>en</strong>ce in fluids. Fluid Mechanics and its applications. Kluwer Aca<strong>de</strong>micPublishers, 1990.[125] T. Von Karman and Howarth L. On the statistical theory of isotropic turbul<strong>en</strong>ce. InProceedings of the Royal Society of London, 1938.[126] M. Baum and T. Poinsot. A direct numerical simulation co<strong>de</strong> for studies of combustionph<strong>en</strong>om<strong>en</strong>a. Technical Report 920201, Laboratoire EM2C du CNRS et <strong>de</strong> l’Ecole C<strong>en</strong>trale<strong>de</strong> Paris, 1992.[127] Christophe Bailly and G<strong>en</strong>eviève Comte-Bellot. Turbul<strong>en</strong>ce. CNRS Editions, 2003.[128] T. Passot and A. Pouquet. Numerical simulation of compressible homog<strong>en</strong>eous flows inthe turbul<strong>en</strong>t regime. J. Fluid Mech. , 181 :441–466, 1987.
190 BIBLIOGRAPHIE
Annexe AMéthodologie expérim<strong>en</strong>taleA.1 Algorithme <strong>de</strong> maximisation <strong>de</strong> la variance interclasseA.1.1FormulationSoit une image composée <strong>de</strong> N pixels dont le niveau <strong>de</strong> gris est compris <strong>en</strong>tre 0 et L−1. Dansnotre cas l’image est codée sur 12 bits ce qui correspond à L = 2 1 2 = 4096. Le nombre <strong>de</strong> pixelsau niveau <strong>de</strong> gris i est noté n i . Un estimateur <strong>de</strong> la distribution <strong>de</strong> probabilité pour les niveaux<strong>de</strong> gris est donc :p i = n i(A.1)NOn suppose que l’image est divisée <strong>en</strong> <strong>de</strong>ux classes C 1 (Fond d’écran noir) et C 2 (Spray blanc)séparées par un niveau <strong>de</strong> gris seuil s. C 1 correspond aux pixels tels que 0 ≤ I ≤ s et C 2correspond à s + 1 ≤ I < L. <strong>Les</strong> probabilités qu’un pixel apparti<strong>en</strong>ne aux classes C 1 ou C 2 sontrespectivem<strong>en</strong>t :ω 1 =s∑p i = ω(s) et ω 2 =i=0L−1∑i=s+1p i = 1 − ω(s)<strong>Les</strong> niveaux <strong>de</strong> gris moy<strong>en</strong>s <strong>de</strong> C 1 et C 2 sont respectivem<strong>en</strong>t µ 1 et µ 2 :(A.2)µ 1 (s) = E(I |C 1 ) =∑ si=0 ip(i)ω 1=∑ si=0 ip(i)ω(s)(A.3)µ 2 (s) = E(I |C 2 ) =Le niveau <strong>de</strong> gris moy<strong>en</strong> <strong>de</strong> l’image est :∑ L−1i=s+1 ip(i) ∑ L−1i=s+1=ip(i)ω 2 1 − ω(s)(A.4)L−1∑µ = E(I) = ip(i)i=0On vérifie aisém<strong>en</strong>t que pour tout choix <strong>de</strong> s :ω 1 µ 1 + ω 2 µ 2 = µ(A.5)(A.6)L’objectif du seuillage est <strong>de</strong> déterminer une valeur optimale <strong>de</strong> s tel que les <strong>de</strong>ux classes C 1et C 2 soit les plus éloignées l’une <strong>de</strong> l’autre. Pour cela, Otsu propose <strong>de</strong> maximiser la varianceinterclasse V i :V i = ω 1 (µ 1 − µ) 2 + ω 2 (µ 2 − µ) 2(A.7)191
192 ANNEXE A. MÉTHODOLOGIE EXPÉRIMENTALELe seuil optimal est alors s ∗ tel que :V i (s ∗ ) =max V i(s)0≤
A.1. ALGORITHME DE MAXIMISATION DE LA VARIANCE INTERCLASSE 193La Figure A.2 prés<strong>en</strong>te l’histogramme <strong>de</strong> la photo <strong>de</strong> la Figure A.1 et l’évolution <strong>de</strong> lavariance interclasse. Sur l’histogramme (Figure A.2(a)), on observe un pic très marqué pour lespixels foncés du fond d’écran (Classe C 1 , i = 300). En revanche, les pixels clairs <strong>de</strong> la zone duspray (Classe C 2 ) s’avèr<strong>en</strong>t beaucoup plus étalés sans prés<strong>en</strong>ce d’un pic marqué. La recherched’une "vallée" permettant <strong>de</strong> discriminer les <strong>de</strong>ux parties <strong>de</strong> l’image ne semble pas a-priori aisée.On observe toutefois que l’évolution <strong>de</strong> V i <strong>en</strong> fonction <strong>de</strong> s reste unimodale et son maximum estatteint pour s∗ = 1377. La métho<strong>de</strong> d’Otsu s’avère suffisam<strong>en</strong>t robuste pour déterminer un seuil.Appliquons maint<strong>en</strong>ant la valeur s ∗ pour binariser l’image. Le résultat est prés<strong>en</strong>té sur la FigureA.3. L’image binarisée décrit une <strong>en</strong>veloppe continue qui conserve la forme du spray et le dareliqui<strong>de</strong> <strong>en</strong> sortie <strong>de</strong> l’injecteur ce qui confirme l’efficacité <strong>de</strong> l’algorithme pour seuiller les images<strong>de</strong> strioscopie du sprayX: 1377Y: 0.04743pi0.120.10.080.060.040.02X = 1.37e+03Y = 0.00384Variance Interclasse Vi0.0450.040.0350.030.0250.020.0150.010.00500 500 1000 1500 2000 2500 3000 3500 4000Niveau <strong>de</strong> gris(a) Histogramme <strong>de</strong> l’image du spray00 500 1000 1500 2000 2500 3000 3500 4000Niveau <strong>de</strong> gris(b) Courbe <strong>de</strong> la variance interclasse V iFigure A.2 – Histogramme et courbe <strong>de</strong> la variance interclasse pour l’image <strong>de</strong> la Figure A.1 .Le seuil obt<strong>en</strong>u avec la métho<strong>de</strong> d’Otsu fournit un seuil s ∗ = 1377.
194 ANNEXE A. MÉTHODOLOGIE EXPÉRIMENTALE(a) Image moy<strong>en</strong>ne du spray(b) Image binarisée du sprayFigure A.3 – Comparaison <strong>en</strong>tre l’image moy<strong>en</strong>ne du spray et l’image binarisée avec le seuils ∗ = 1377 fourni par l’algorithme d’Otsu.
Annexe BThe basics of isotropic homog<strong>en</strong>eousturbul<strong>en</strong>ceB.1 Definition of isotropic homog<strong>en</strong>eous turbul<strong>en</strong>ceTurbul<strong>en</strong>ce corresponds to random motions of the fluid particles [124]. Therefore a turbul<strong>en</strong>tflow can be mo<strong>de</strong>led as a stochastic process and at each point of the space, velocity is <strong>de</strong>composedinto a mean and a fluctuating part :u i = ū i + u ′ i(B.1)We focus on isotropic homog<strong>en</strong>eous turbul<strong>en</strong>ce. This adds two additional properties :– homog<strong>en</strong>eity : properties of turbul<strong>en</strong>ce are invariant with translation of the coordinatesystem.– isotropy : properties of turbul<strong>en</strong>ce are invariant with rotation of the coordinate system.This simplification <strong>en</strong>ables a precise analysis of the statiscal and spectral properties of turbul<strong>en</strong>ce.B.2 Velocity correlations and associated l<strong>en</strong>gth scalesThe correlation t<strong>en</strong>sor in two points of the velocity is <strong>de</strong>fined as follow :Q ij (A, B, t) = u ′ i (A, t)u′ j(B, t)(B.2)where u ′ i is the fluctuating velocity, and¯is the averaging operator. In the case of homog<strong>en</strong>eousand isotropic turbul<strong>en</strong>ce this quantity is only <strong>de</strong>p<strong>en</strong>d<strong>en</strong>t of the distance r betwe<strong>en</strong> the points Aand B. With this hypothesis, we have :Q ij (A, B, t) = Q ij (r, t) ∀ A, B(B.3)This also <strong>en</strong>tails :u ′ i2 = U 2 p ∀ A, ∀i (B.4)The quantity U p is the turbul<strong>en</strong>t velocity and repres<strong>en</strong>ts the int<strong>en</strong>sity of turbul<strong>en</strong>ce in eachdirection. Therefore we obtain by <strong>de</strong>finition the turbul<strong>en</strong>t kinetic <strong>en</strong>ergy :195
196 ANNEXE B. THE BASICS OF ISOTROPIC HOMOGENEOUS TURBULENCEK = u′ i u′ i= 3U p2 (B.5)2 2It is usual to introduce the longitudinal and transverse correlation functions, f(r, t) andg(r, t), and their integral l<strong>en</strong>gth scales, Λ f (t) and Λ g (t) :f(r, t) = Q 11(r, 0, 0, t)Up2 , Λ f (t) =g(r, t) = Q 22(r, 0, 0, t)Up2 , Λ g (t) =∫ ∞0∫ ∞0f(r, t)drg(r, t)dr(B.6)(B.7)Figure B.1 illustrates the signification and the typical shape of f and g. They respectivelycharacterise coher<strong>en</strong>ce betwe<strong>en</strong> two points A and B of the fluctuating velocity along and perp<strong>en</strong>dicularyto the axis −→ AB.f(r)g(r)AvvBA v v Brrλ frλ grFigure B.1 – Typical shape of the longitudinal and transverse correlation functions f and gFor an incompressible turbul<strong>en</strong>t flow, it is possible to <strong>de</strong>monstrate the relation of Kármánand Howarth [125] :g(r, t) = f(r, t) + r ∂f(r, t)2 ∂rThe integration of this expression betwe<strong>en</strong> 0 and ∞ gives :Λ g (t) = Λ f (t) +∫ ∞Since f(r) becomes equal to 0 for r = ∞ (Figure B.1) :∫ ∞0r20r2∂f(r, t)dr∂r∂f(r, t)dr = − Λ f (t)∂r2Therefore, the integral scales Λ f and Λ g are linked by :Λ f (t) = 2Λ g (t)From f, one can also <strong>de</strong>fine the longitudinal micro-scale of Taylor λ f (t) :(B.8)(B.9)(B.10)(B.11)
B.3. CHARACTERISTIC QUANTITIES IN TURBULENCE 1971λ 2 f= − 1 ∂ 2 ∣f(r, t) ∣∣∣r=02 ∂r 2 (B.12)In the neighbourhood of r = 0, the osculator parabol of f(r, t) (Figure B.1) has the followingequation :f(r, t) ≈ 1 −r2λ 2 f (t)(B.13)In the same way, one <strong>de</strong>fines the transverse Taylor micro-scale from the transverse correlationg(r, t) :1λ 2 g= − 1 ∂ 2 ∣g(r, t) ∣∣∣r=02 ∂r 2 (B.14)Th<strong>en</strong>, the relation of Kármán and Howarth <strong>en</strong>ables to link the micro-scale λ f and λ g :λ f (t) = √ 2λ g (t)(B.15)This relation is useful to evaluate the isotropy of a turbul<strong>en</strong>t flow. However, it is important tohighlight the fact that the microscales of Taylor do not correspond to any l<strong>en</strong>gth scale of eddiesin the flow. In particulary, they do not coincidate to the size of the smallest vortices (Kolmogorovscale η k ).B.3 Characteristic quantities in turbul<strong>en</strong>ceThis section <strong>de</strong>scribes dim<strong>en</strong>sionless quantities and the characteristic l<strong>en</strong>gth and time scalesof turbul<strong>en</strong>ce [126]. We recall the <strong>de</strong>finition of turbul<strong>en</strong>t kinetic <strong>en</strong>ergy K.K = u′ i u′ i= 3U p2 (B.16)2 2The dissipation rate ɛ <strong>de</strong>scribes the transfer of turbul<strong>en</strong>t kinetic <strong>en</strong>ergy from the biggesteddies to the smallest eddies. It is <strong>de</strong>fined as follow :ɛ = ν ∂u′ i∂x j∂u ′ i∂x jThe turbul<strong>en</strong>t velocity U p and the dissipation rate ɛ are linked with the following mo<strong>de</strong>l :ɛ = C U 3 pΛ f(B.17)(B.18)where C is a constant <strong>de</strong>p<strong>en</strong>ding on the constant shape. The scales l d , u d and τ d associated withthe dissipation of turbul<strong>en</strong>t kinetic <strong>en</strong>ergy are <strong>de</strong>fined as follow :( ) ν3 1/4 (l d =u d = (νɛ) 1/4 ν) 1/2τ d =(B.19)ɛɛThe scale l<strong>en</strong>gth l d is also called the Kolmogorov l<strong>en</strong>gth scale η k and corresponds to thesmallest vortices in the flow. An important quantity to <strong>de</strong>scribe a turbul<strong>en</strong>t flow is the turbul<strong>en</strong>tReynolds number Re T :
198 ANNEXE B. THE BASICS OF ISOTROPIC HOMOGENEOUS TURBULENCERe T = U pΛ f(B.20)νIt compares the turbul<strong>en</strong>t diffusivity (ν t ≈ U p Λ f ) to the molecular diffusivity (ν). The turbul<strong>en</strong>tReynolds number is linked to the dissipation and production scales :Λ f= Re 3/4Tl dU pu d= Re 1/4TT p= Re 1/2Tτ d(B.21)where T p is the integral time <strong>de</strong>fined by :T p = Λ fU p(B.22)Therefore, increasing of the turbul<strong>en</strong>t Reynolds number increases the gap betwe<strong>en</strong> scales ofproduction and scales of dissipation. The Reynolds number based on the Taylor micro-scale is :Re λ = U pλ f(B.23)νFor turbul<strong>en</strong>t flows with a non-zero mean velocity u, the turbul<strong>en</strong>ce int<strong>en</strong>sity is evaluatedfrom the parameter I u :I u = U pū(B.24)B.4 Spectral analysis of turbul<strong>en</strong>ceSpectral analysis is the best tool to study isotropic homog<strong>en</strong>ous turbul<strong>en</strong>ce and to obtaincharacteristic l<strong>en</strong>gth scales.B.4.1Fourier TransformIf we consi<strong>de</strong>r a giv<strong>en</strong> quantity A(r, t) in the physical space, its Fourier transform (T F )is writt<strong>en</strong> Â(k) where k and r are respectively the wave vector (spectral space) and the spatialcoordinate (physical space). A(r, t) and Â(k, t) are bound by the two following reciprocalexpressions :Â(k, t) =A(r, t) =1(2π) 3 ∫D(r)∫D(k)A(r)e −jk r d 3 r = T F (A(r))Â(r)e jk r d 3 −1k = T F (Â(k))(B.26)(B.25)where j 2 = −1B.4.2Spectral T<strong>en</strong>sorOne can introduce the spectral t<strong>en</strong>sor E ij (k), the Fourier transform of the correlation t<strong>en</strong>sorin two points of the velocity Q ij (r, t) :E ij (k, t) = 1(2π)∫D(r)3 Q ij (r)e −ik r d 3 r = T F (Q ij (r))(B.27)
B.4. SPECTRAL ANALYSIS OF TURBULENCE 199For an incompressible homog<strong>en</strong>eous and isotropic turbul<strong>en</strong>t flow, it is possible to <strong>de</strong>monstratethat the t<strong>en</strong>sor E ij (k) is real and symmetric [119] and its expression is :E ij (k, t) =E(k, t)πk(δ ij − k )ik jk 2(B.28)where k is the norm of k, k i a compon<strong>en</strong>t of k and E(k, t) is the spectrum of turbul<strong>en</strong>t kinetic<strong>en</strong>ergy.K =∫ ∞0E(k, t)dk = 3U 2 p2(B.29)Therefore, knowing the scalar function E(k, t) is <strong>en</strong>ough to <strong>de</strong>fine the t<strong>en</strong>sor E ij (k, t). E(k, t)gives also access to the dissipation rate of turbul<strong>en</strong>t kinetic <strong>en</strong>ergy ɛ and to the longitudinalintegral scale :B.4.3ɛ = 2νΛ f =One-dim<strong>en</strong>sional spectrumπ2U 2 p∫ ∞0∫ ∞0k 2 E(k)dk(B.30)E(k)dk (B.31)kFrom a practical point of view, the t<strong>en</strong>sor E ij (k, t) and the spectrum of turbul<strong>en</strong>t kinetic<strong>en</strong>ergy E(k, t) are difficult to compute from experim<strong>en</strong>tal or simulation data. Therefore, it isconv<strong>en</strong>i<strong>en</strong>t to introduce the notion of one-dim<strong>en</strong>sional spectrum :E i (k 1 , t) =∫ ∞ ∫ ∞−∞−∞E ii (k, t)dk 2 dk 3For an incompressible homog<strong>en</strong>eous isotropic turbul<strong>en</strong>ce, this expression gives :(B.32)E i (k 1 , t) =∫ ∞ ∫ ∞−∞−∞E(k, t)4πk 2 (1 − k2 ik 2 )dk 2dk 3(B.33)Introducing the polar coordinates (σ, ϕ) in the plane P (k 1 ) perp<strong>en</strong>dicular to the axe Ok 1 atthe position k 1 leads to k 2 = k 2 1 + σ2 and for a fixed value of k 1 :E 1 (k 1 , t) == 1 2∫ 2π ∫ ∞0 0∫ ∞0E( √ k 2 1 + σ2 , t)4π(k 2 1 + σ2 )()1 − k2 1k1 2 + σdσdϕσ2E( √ k 2 1 + σ2 , t)(k 2 1 + σ2 ) 2 σ 3 dσ (B.34)Th<strong>en</strong> the change of variable σ 2 = k 2 − k1 2 , σdσ = kdk provi<strong>de</strong>s :E 1 (k 1 , t) = 1 2∫ ∞E(k, t)k 1k( )1 − k2 1k 2 dk(B.35)It is also possible to obtain the expression of E 2 (k, t) and E 3 (k, t) as a function of E(k, t).One must notice that :
200 ANNEXE B. THE BASICS OF ISOTROPIC HOMOGENEOUS TURBULENCEE 2 (k 1 , t) = E 3 (k 1 , t) = 1 2 (E 2(k 1 , t) + E 3 (k 1 , t))By using the same change of variable (σ, ϕ), one obtains :E 2 (k 1 , t) = E 3 (k 1 , t) = 1 4∫ ∞E(k, t)k 1k( )1 + k2 1k 2 dk(B.36)(B.37)B.4.4Grid turbul<strong>en</strong>ce and Taylor hypothesisTurbul<strong>en</strong>ce injected in this manuscrit corresponds to an isotropic homog<strong>en</strong>eous turbul<strong>en</strong>ceg<strong>en</strong>erated without mean velocity gradi<strong>en</strong>ts. It consists in a stationary one-dim<strong>en</strong>sional mean flowwhich is disturbed by an isotropic and homog<strong>en</strong>ous turbul<strong>en</strong>t flow :u= ( U 1 , 0, 0 ) Twith ∂U 1= 0 and ∂U 1∂x i ∂t= 0 (B.38)u ′ = (u ′ 1 , u′ 2 , u′ 3 )T with u ′ i u′ i = U 2 p ∀i (B.39)This type of turbul<strong>en</strong>ce is experim<strong>en</strong>tally observed below a grid installed in a wind tunneland thus it is called "grid turbul<strong>en</strong>ce". For such a flow, the hypothesis of Taylor is commonlyused [127] :∂∂t ≈ −U ∂1∂x 1(B.40)Therefore, the measurem<strong>en</strong>t of the temporal signal at a point of the flow gives access to thespatial properties of turbul<strong>en</strong>ce. The Taylor assumption is the key assumption to inject turbul<strong>en</strong>cein DNS or LES. Turbul<strong>en</strong>ce is g<strong>en</strong>erated in an isotropic box outsi<strong>de</strong> the computational domainand convected within the domain. This property will also be used to compute one-dim<strong>en</strong>sionalspectra from time signals of velocity. In<strong>de</strong>ed, if one consi<strong>de</strong>rs the power spectral d<strong>en</strong>sity ϕ i (f) ofthe time velocity signal u ′ i (t) : ϕ i (f) = 12π∫ ∞0u ′ i(t) 2 e −2πift dtthe Taylor hypothesis writt<strong>en</strong> for the spectral variables <strong>en</strong>ables the change of variable :(B.41)k 1 = 2πfU 1and dk 1 = 2πdf∫ ∞so that u ′ 2U 1U i=1 0 2π ϕ i(f = U 1k 12π )dk 1(B.42)The one-dim<strong>en</strong>sional spectrum E i (k 1 ) is <strong>de</strong>fined for waves number −∞ < k 1 < ∞ but itsparity <strong>en</strong>ables to write :From this equation, one obtains :u ′ 2i= 2∫ ∞0E i (k 1 )dk 1(B.43)E i (k 1 ) = U 14π ϕ i(f = U 1k 12π ) ∀k 1 > 0(B.44)
B.4. SPECTRAL ANALYSIS OF TURBULENCE 201B.4.5The Passot Pouquet SpectrumAn example of analytic expression for E(k) is the Passot-Pouquet spectrum [128] :E(k) = 16 U p2 ( ) (k4 ( )k2exp −2k e k e ke)(B.45)This formula is oft<strong>en</strong> used to create pseudo-turbul<strong>en</strong>t initial conditions for direct NavierStokes simulations which mimic a noisy large-scale instability with expon<strong>en</strong>tial fall-off. Thisspectrum has be<strong>en</strong> chos<strong>en</strong> to inject turbul<strong>en</strong>ce with AVBP and many results pres<strong>en</strong>ted in themanuscrit refer to this paragraph. As illustrated on Figure B.2, the maximum of E(k) is reachedfor the wave number k e .Therefore the parameter k e corresponds to the most <strong>en</strong>ergetic eddies.These eddies have a characteristic l<strong>en</strong>gth λ e = 2πk ecorresponding to the size of the largest eddies.Note that in certain papers [89], a l<strong>en</strong>gth L e = 1 k eis used, leading to some confusion on l<strong>en</strong>gth<strong>de</strong>finitions. Here in AVBP starting with 6.1, only λ e will be used to <strong>de</strong>fine k e (see Table B.4.5).E(k) is also almost symetric to k e . Most of the <strong>en</strong>ergy is conc<strong>en</strong>trated around this wave numberand no importance is giv<strong>en</strong> to small eddies.2.52keE(k)U p21.510.500 0.2 0.4 0.6 0.8 1 1.2 1.4 1.6 1.8 2kk eFigure B.2 – Spectrum E(k) for the Passot-Pouquet formula B.45The integration betwe<strong>en</strong> 0 and ∞ of E(k) leads to K = 3U 2 p2as expected. The dissipationrate and the characteric scales and Reynolds numbers are also <strong>de</strong>duced :
202 ANNEXE B. THE BASICS OF ISOTROPIC HOMOGENEOUS TURBULENCEɛ = 15νU p 2 ke2√42πΛ f = = λ e√ ≈ 0.4λ ek e 2π√2λ f = = λ e√k e 2πη k =( 154Re t = √ 2π U pνk√ e2UpRe λ =k e ν) −1/4 (Up k eν(B.46)(B.47)(B.48)) −1/2(B.49)(B.50)(B.51)Eq. (B.47) indicates that the true integral scale Λ f for the Passot-Pouquet spectrum is 0.4 timesthe <strong>en</strong>ergetic scale λ e . Eq. (B.35) and Eq. (B.37) provi<strong>de</strong> the expression of the one-dim<strong>en</strong>sionalPassot-Pouquet spectra :E 1 (k 1 ) =√2πUp2 “ ”e −2 k1 2ke(B.52)k e(E 2 (k 1 ) = E 3 (k 1 ) = √ 1 Up2 1 +2π k e( ) ) 2 “ ”2k1e −2 k1 2ke(B.53)k eApplying the Taylor hypothesis, Eq. (B.44) gives the power spectral d<strong>en</strong>sity for the threecompon<strong>en</strong>ts of the turbul<strong>en</strong>t velocity :√2 Up2 ϕ 1 (f) = 2π“e −2 ffef e√2ϕ 2 (f) = ϕ 3 (f) =π” 2(B.54)(Up2 ( ) )2f2 “ ” 21 + e −2 ffe (B.55)f e f ewhere f = k 1U 12πand f e = keU 12π. Figure B.3 shows the graph of the longitudinal and transverseone-dim<strong>en</strong>sional spectra E 1 (k 1 ) and E 2 (k 1 ). One notices that E 1 (k 1 ) is a gaussian function andreaches its maximum for k 1 = 0 whereas E 2 (k 1 ) is maximum for |k 1 | = ke2 .The correlation function f(r) can be expressed from the one-dim<strong>en</strong>sional spectrum E 1 (k 1 ) :f(r) = 1 ∫ +∞E 1 (k 1 )e ik1r dk 1U pTherefore, for a Passot-Pouquet Spectrum, the analytical expression of f(r) is :−∞(B.56)f(r) = e − (ker)28 (B.57)Th<strong>en</strong> by solving the relation of Kármán and Howarth (B.8), the transversal correlation functionis easily <strong>de</strong>duced :( )g(r) = 1 − (k er) 2e − (ker)28 (B.58)8
B.4. SPECTRAL ANALYSIS OF TURBULENCE 203keEi(k1)U p20.90.80.70.60.50.40.30.20.1E 1(k 1)E 2(k 1)k 1k e0−2 −1.5 −1 −0.5 0 0.5 1 1.5 2Figure B.3 – One-dim<strong>en</strong>sional Spectra E 1 (k 1 ) and E 2 (k 1 ) for the Passot Pouquet SpectrumL<strong>en</strong>gth of most Taylor integral Taylor micro- Kolmogorov Taylor hypothesis<strong>en</strong>ergetic eddies scale scaleλ e Λ f λ f η k f e2πk eEq. (B.47) Eq. (B.48) Eq. (B.49)k eU 12πTable B.1 – Names and <strong>de</strong>finitions of turbul<strong>en</strong>ce scales for a Passot-Pouquet spectrum
204 ANNEXE B. THE BASICS OF ISOTROPIC HOMOGENEOUS TURBULENCE
Annexe CBrevet Air Liqui<strong>de</strong>/CNRS-INPT205
206 ANNEXE C. BREVET AIR LIQUIDE/CNRS-INPT