Profil épidémiologique des intoxications dans la région de Tanger ...
Profil épidémiologique des intoxications dans la région de Tanger ...
Profil épidémiologique des intoxications dans la région de Tanger ...
- No tags were found...

Create successful ePaper yourself
Turn your PDF publications into a flip-book with our unique Google optimized e-Paper software.
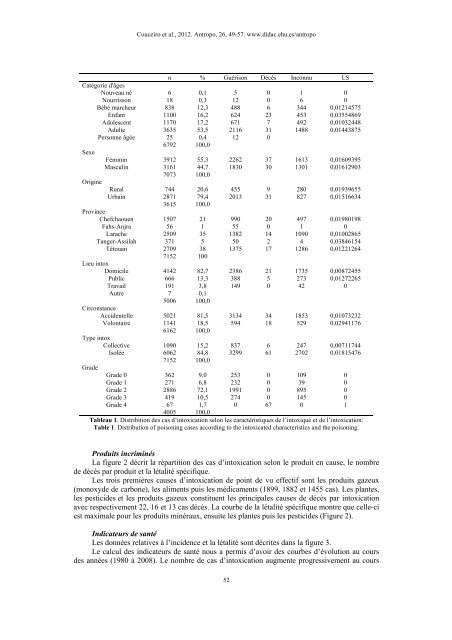
Couceiro et al., 2012. Antropo, 26, 49-57. www.didac.ehu.es/antropon % Guérison Décès Inconnu LSCatégorie d'âgesNouveau né 6 0,1 5 0 1 0Nourrisson 18 0,3 12 0 6 0Bébé marcheur 838 12,3 488 6 344 0,01214575Enfant 1100 16,2 624 23 453 0,03554869Adolescent 1170 17,2 671 7 492 0,01032448Adulte 3635 53,5 2116 31 1488 0,01443875Personne âgée 25 0,4 12 06792 100,0SexeFéminin 3912 55,3 2262 37 1613 0,01609395Masculin 3161 44,7 1830 30 1301 0,016129037073 100,0OrigineRural 744 20,6 455 9 280 0,01939655Urbain 2871 79,4 2013 31 827 0,015166343615 100,0ProvinceChefchaouen 1507 21 990 20 497 0,01980198Fahs-Anjra 56 1 55 0 1 0Larache 2509 35 1382 14 1090 0,01002865<strong>Tanger</strong>-Assi<strong>la</strong>h 371 5 50 2 4 0,03846154Tétouan 2709 38 1375 17 1286 0,012212647152 100Lieu intoxDomicile 4142 82,7 2386 21 1735 0,00872455Public 666 13,3 388 5 273 0,01272265Travail 191 3,8 149 0 42 0Autre 7 0,15006 100,0CirconstanceAcci<strong>de</strong>ntelle 5021 81,5 3134 34 1853 0,01073232Volontaire 1141 18,5 594 18 529 0,029411766162 100,0Type intoxCollective 1090 15,2 837 6 247 0,00711744Isolée 6062 84,8 3299 61 2702 0,018154767152 100,0Gra<strong>de</strong>Gra<strong>de</strong> 0 362 9,0 253 0 109 0Gra<strong>de</strong> 1 271 6,8 232 0 39 0Gra<strong>de</strong> 2 2886 72,1 1991 0 895 0Gra<strong>de</strong> 3 419 10,5 274 0 145 0Gra<strong>de</strong> 4 67 1,7 0 67 0 14005 100,0Tableau 1. Distribition <strong><strong>de</strong>s</strong> cas d’intoxication selon les caractéristiques <strong>de</strong> l’intoxiqué et <strong>de</strong> l’intoxication.Table 1. Distribution of poisoning cases according to the intoxicated characteristics and the poisoning.Produits incriminésLa figure 2 décrit <strong>la</strong> répartition <strong><strong>de</strong>s</strong> cas d’intoxication selon le produit en cause, le nombre<strong>de</strong> décès par produit et <strong>la</strong> létalité spécifique.Les trois premières causes d’intoxication <strong>de</strong> point <strong>de</strong> vu effectif sont les produits gazeux(monoxy<strong>de</strong> <strong>de</strong> carbone), les aliments puis les médicaments (1899, 1882 et 1455 cas). Les p<strong>la</strong>ntes,les pestici<strong><strong>de</strong>s</strong> et les produits gazeux constituent les principales causes <strong>de</strong> décès par intoxicationavec respectivement 22, 16 et 13 cas décès. La courbe <strong>de</strong> <strong>la</strong> létalité spécifique montre que celle-ciest maximale pour les produits minéraux, ensuite les p<strong>la</strong>ntes puis les pestici<strong><strong>de</strong>s</strong> (Figure 2).Indicateurs <strong>de</strong> santéLes données re<strong>la</strong>tives à l’inci<strong>de</strong>nce et <strong>la</strong> létalité sont décrites <strong>dans</strong> <strong>la</strong> figure 3.Le calcul <strong><strong>de</strong>s</strong> indicateurs <strong>de</strong> santé nous a permis d’avoir <strong><strong>de</strong>s</strong> courbes d’évolution au cours<strong><strong>de</strong>s</strong> années (1980 à 2008). Le nombre <strong>de</strong> cas d’intoxication augmente progressivement au cours52