STATISS 2007 - ARS Paca
STATISS 2007 - ARS Paca
STATISS 2007 - ARS Paca

You also want an ePaper? Increase the reach of your titles
YUMPU automatically turns print PDFs into web optimized ePapers that Google loves.
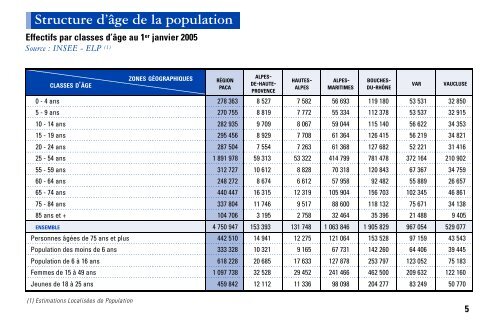
Structure d’âge de la population..Effectifs par classes d’âge au 1 er janvier 2005Source : INSEE - ELP (1)ZONES GÉOGRAPHIQUESCLASSES D’ÂGE0 - 4 ans5 - 9 ans10 - 14 ans15 - 19 ans20 - 24 ans25 - 54 ans55 - 59 ans60 - 64 ans65 - 74 ans75 - 84 ans85 ans et +ENSEMBLEPersonnes âgées de 75 ans et plusPopulation des moins de 6 ansPopulation de 6 à 16 ansFemmes de 15 à 49 ansJeunes de 18 à 25 ans(1) Estimations Localisées de PopulationALPES-RÉGIONDE-HAUTE-HAUTES- ALPES- BOUCHES-PACAALPES MARITIMES DU-RHÔNEPROVENCEVAR VAUCLUSE278 363 8 527 7 582 56 693 119 180 53 531 32 850270 755 8 819 7 772 55 334 112 378 53 537 32 915282 935 9 709 8 067 59 044 115 140 56 622 34 353295 456 8 929 7 708 61 364 126 415 56 219 34 821287 504 7 554 7 263 61 368 127 682 52 221 31 4161 891 978 59 313 53 322 414 799 781 478 372 164 210 902312 727 10 612 8 828 70 318 120 843 67 367 34 759248 272 8 674 6 612 57 958 92 482 55 889 26 657440 447 16 315 12 319 105 904 156 703 102 345 46 861337 804 11 746 9 517 88 600 118 132 75 671 34 138104 706 3 195 2 758 32 464 35 396 21 488 9 4054 750 947 153 393 131 748 1 063 846 1 905 829 967 054 529 077442 510 14 941 12 275 121 064 153 528 97 159 43 543333 328 10 321 9 165 67 731 142 260 64 406 39 445618 228 20 685 17 633 127 878 253 797 123 052 75 1831 097 738 32 528 29 452 241 466 462 500 209 632 122 160459 842 12 112 11 336 98 098 204 277 83 249 50 7705