PETA KEMISKINAN INDONESIA - SMERU Research Institute
PETA KEMISKINAN INDONESIA - SMERU Research Institute
PETA KEMISKINAN INDONESIA - SMERU Research Institute

You also want an ePaper? Increase the reach of your titles
YUMPU automatically turns print PDFs into web optimized ePapers that Google loves.
Peta Kemiskinan Indonesia<br />
Perbandingan Kemiskinan di Tingkat Desa<br />
Di tingkat desa, perbandingan hasil pemetaan kemiskinan dan<br />
hasil FGD dilakukan dengan membandingkan titik dan kisaran<br />
estimasi angka kemiskinan yang dihasilkan pemetaan kemiskinan,<br />
dengan hasil klasifikasi kesejahteraan yang dihasilkan peserta<br />
FGD. Dalam FGD desa, peserta menggolongkan penduduk desa<br />
dalam beberapa kelompok kesejahteraan berdasarkan kriteria lokal<br />
yang telah disepakati. Dari 18 desa sampel, di 7 desa masyarakat<br />
digolongkan dalam 4 kelompok (kaya, sedang, miskin, dan sangat<br />
miskin), di 8 desa ditetapkan adanya 3 kelompok kesejahteraan, dan<br />
hanya di 3 desa masyarakat dikelompokkan menjadi 2 kelompok<br />
(sedang dan miskin).<br />
Perbandingan antara hasil pemetaan kemiskinan dengan hasil<br />
FGD memperlihatkan bahwa hasil FGD untuk 2004 cenderung<br />
lebih mendekati hasil pemetaan kemiskinan dibandingkan dengan<br />
hasil FGD yang memperkirakan kondisi 2000. Juga ditemukan<br />
bahwa proporsi rumah tangga miskin hasil FGD lebih tinggi<br />
daripada nilai maksimum hasil pemetaan kemiskinan di semua<br />
desa yang diklasifikasikan sebagai daerah urban, yang angka<br />
kemiskinannya diestimasi dengan menggunakan model untuk<br />
rumah tangga perkotaan. Gejala semacam ini juga terlihat pada<br />
studi yang mengompilasi berbagai hasil analisis kemiskinan<br />
partisipatoris (Suharyo et al. 2003). Sebaliknya, hasil FGD relatif<br />
lebih sesuai dengan hasil pemetaan kemiskinan di desa-desa<br />
yang berada di Kecamatan Bolaang Uki dan Kecamatan Seteluk,<br />
yang hasil perbandingan pemeringkatan desa-desanya juga lebih<br />
konsisten dengan hasil pemetaan kemiskinan. Hal ini dapat<br />
menandakan bahwa hasil estimasi angka kemiskinan melalui<br />
pemetaan kemiskinan untuk daerah-daerah dengan karakteristik<br />
pedesaan lebih mendekati hasil perkiraan masyarakat, sedangkan<br />
hasil estimasi untuk daerah perkotaan cenderung kurang sesuai.<br />
Catatan Penutup<br />
Penggunaan pendekatan kuantitatif dan<br />
partisipatoris (atau kualitatif secara umum)<br />
secara bersama dalam analisis kemiskinan<br />
makin populer akhir-akhir ini, sejalan dengan<br />
meningkatnya pemahaman bahwa kemiskinan<br />
bersifat multidimensional. Meskipun keduanya<br />
masih sering dipertentangkan karena adanya<br />
Comparing Poverty at the Village Level<br />
At the village level, the comparison of poverty mapping and FGD<br />
results was carried out by comparing the poverty rate estimation point<br />
and range produced by the poverty mapping with the welfare classification<br />
results from the FGD participants. In the village FGD, participants<br />
grouped village inhabitants into a number of welfare groups based on<br />
local criteria which had been agreed on. From 18 sample villages, in 7<br />
villages the community was grouped into 4 groups (rich, average, poor,<br />
very poor), in 8 villages there were 3 welfare groups, and in only 3 villages<br />
the community was classified into 2 groups (average and poor).<br />
The comparison between poverty mapping and FGD results shows<br />
that the FGD results for 2004 tended to be closer to the poverty mapping<br />
results than FGD results estimating the condition in 2000. It was also<br />
found that the proportion of poor households in the FGD results was<br />
higher than the maximum value from poverty mapping results in all<br />
villages which were classified as urban areas, where the poverty rate<br />
was estimated using the urban household model. These tendencies were<br />
also observed in a study which compiled various participatory poverty<br />
analysis results (Suharyo et al. 2003). On the other hand, the FGD<br />
results tended to match more closely with poverty mapping results in<br />
villages in Kecamatan Bolaang Uki and Kecamatan Seteluk, where the<br />
village comparison rankings were also more consistent with the poverty<br />
mapping results. This indicates that the poverty rate estimation results<br />
using poverty mapping for rural areas tend to be closer to the community’s<br />
estimated result, while estimation results for urban areas tend to be less<br />
accurate.<br />
Closing Remarks<br />
The combined use of quantitative and participatory (or qualitative<br />
in general) approaches in poverty analysis has become increasingly<br />
popular in recent years, in line with the increasing understanding that<br />
poverty is multidimensional. Although both approaches are still often<br />
contrasted because there are differences in the way data is compiled<br />
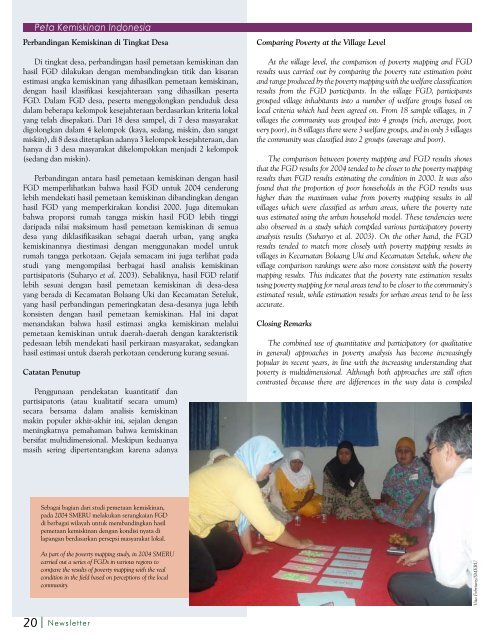
Sebagai bagian dari studi pemetaan kemiskinan,<br />
pada 2004 <strong>SMERU</strong> melakukan serangkaian FGD<br />
di berbagai wilayah untuk membandingkan hasil<br />
pemetaan kemiskinan dengan kondisi nyata di<br />
lapangan berdasarkan persepsi masyarakat lokal.<br />
As part of the poverty mapping study, in 2004 <strong>SMERU</strong><br />
carried out a series of FGDs in various regions to<br />
compare the results of poverty mapping with the real<br />
condition in the field based on perceptions of the local<br />
community.<br />
Vita Febriany/<strong>SMERU</strong><br />
20 Newsletter