

Edisi Agustus 2011 - Badan Pusat Statistik
Edisi Agustus 2011 - Badan Pusat Statistik
Edisi Agustus 2011 - Badan Pusat Statistik

You also want an ePaper? Increase the reach of your titles
YUMPU automatically turns print PDFs into web optimized ePapers that Google loves.
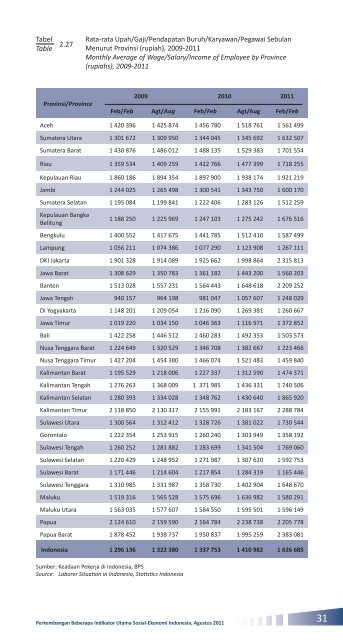
TabelTable 2.27Rata-rata Upah/Gaji/Pendapatan Buruh/Karyawan/Pegawai SebulanMenurut Provinsi (rupiah), 2009-<strong>2011</strong>Monthly Average of Wage/Salary/Income of Employee by Province(rupiahs), 2009-<strong>2011</strong>Provinsi/Province2009 2010 <strong>2011</strong>Feb/Feb Agt/Aug Feb/Feb Agt/Aug Feb/FebAceh 1 420 396 1 425 874 1 456 780 1 518 761 1 561 499Sumatera Utara 1 301 672 1 309 950 1 344 045 1 345 692 1 632 507Sumatera Barat 1 430 876 1 486 012 1 488 135 1 529 383 1 701 554Riau 1 359 534 1 409 259 1 422 766 1 477 399 1 718 255Kepulauan Riau 1 860 186 1 894 354 1 897 900 1 938 174 1 921 219Jambi 1 244 025 1 265 498 1 300 541 1 343 750 1 600 170Sumatera Selatan 1 195 084 1 199 841 1 222 406 1 283 126 1 512 259Kepulauan BangkaBelitung1 188 250 1 225 969 1 247 103 1 275 242 1 676 516Bengkulu 1 400 552 1 417 675 1 441 785 1 512 410 1 587 499Lampung 1 056 211 1 074 386 1 077 290 1 123 908 1 267 111DKI Jakarta 1 901 328 1 914 089 1 925 662 1 998 864 2 315 813Jawa Barat 1 308 629 1 350 783 1 361 182 1 443 200 1 560 203Banten 1 513 028 1 557 231 1 564 443 1 648 618 2 209 252Jawa Tengah 940 157 964 198 981 047 1 057 607 1 248 029DI Yogyakarta 1 148 201 1 209 054 1 216 090 1 269 381 1 260 667Jawa Timur 1 019 220 1 034 150 1 046 363 1 116 971 1 372 852Bali 1 422 258 1 446 512 1 460 283 1 492 353 1 503 573Nusa Tenggara Barat 1 224 649 1 320 529 1 346 708 1 382 667 1 223 466Nusa Tenggara Timur 1 427 204 1 454 380 1 466 074 1 521 483 1 459 840Kalimantan Barat 1 195 529 1 218 006 1 227 337 1 312 590 1 474 371Kalimantan Tengah 1 276 263 1 368 009 1 371 985 1 436 331 1 740 506Kalimantan Selatan 1 280 393 1 334 028 1 348 762 1 430 640 1 865 920Kalimantan Timur 2 118 850 2 130 317 2 155 991 2 183 167 2 288 784Sulawesi Utara 1 300 564 1 312 412 1 328 726 1 381 022 1 730 544Gorontalo 1 222 354 1 253 915 1 260 240 1 303 949 1 358 192Sulawesi Tengah 1 260 252 1 281 882 1 283 699 1 341 504 1 769 060Sulawesi Selatan 1 220 429 1 248 952 1 271 087 1 307 620 1 592 753Sulawesi Barat 1 171 446 1 214 604 1 217 854 1 284 319 1 165 446Sulawesi Tenggara 1 310 985 1 331 987 1 358 730 1 402 904 1 648 670Maluku 1 519 316 1 565 528 1 575 696 1 636 982 1 580 291Maluku Utara 1 563 035 1 577 607 1 584 550 1 595 501 1 596 149Papua 2 124 610 2 159 590 2 164 784 2 238 738 2 205 778Papua Barat 1 878 452 1 938 737 1 950 837 1 995 259 2 383 081Indonesia 1 296 136 1 322 380 1 337 753 1 410 982 1 626 685Sumber: Keadaan Pekerja di Indonesia, BPSSource: Laborer Situation in Indonesia, Statistics IndonesiaPerkembangan Beberapa Indikator Utama Sosial-Ekonomi Indonesia, <strong>Agustus</strong> <strong>2011</strong>31


