

Edisi Agustus 2011 - Badan Pusat Statistik
Edisi Agustus 2011 - Badan Pusat Statistik
Edisi Agustus 2011 - Badan Pusat Statistik

Create successful ePaper yourself
Turn your PDF publications into a flip-book with our unique Google optimized e-Paper software.
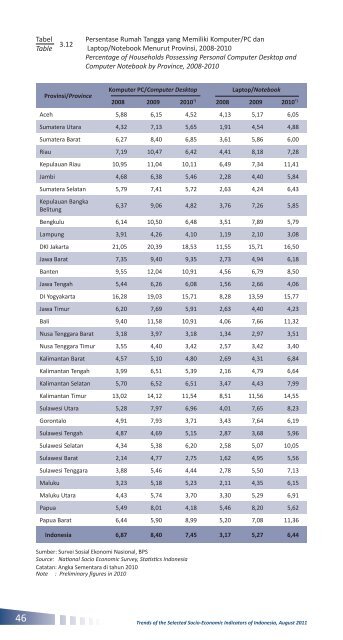
TabelTable 3.12Persentase Rumah Tangga yang Memiliki Komputer/PC danLaptop/Notebook Menurut Provinsi, 2008-2010Percentage of Households Possessing Personal Computer Desktop andComputer Notebook by Province, 2008-2010Provinsi/ProvinceKomputer PC/Computer DesktopLaptop/Notebook2008 2009 2010 *) 2008 2009 2010 *)Aceh 5,88 6,15 4,52 4,13 5,17 6,05Sumatera Utara 4,32 7,13 5,65 1,91 4,54 4,88Sumatera Barat 6,27 8,40 6,85 3,61 5,86 6,00Riau 7,19 10,47 6,42 4,41 8,18 7,28Kepulauan Riau 10,95 11,04 10,11 6,49 7,34 11,41Jambi 4,68 6,38 5,46 2,28 4,40 5,84Sumatera Selatan 5,79 7,41 5,72 2,63 4,24 6,43Kepulauan BangkaBelitung6,37 9,06 4,82 3,76 7,26 5,85Bengkulu 6,14 10,50 6,48 3,51 7,89 5,79Lampung 3,91 4,26 4,10 1,19 2,10 3,08DKI Jakarta 21,05 20,39 18,53 11,55 15,71 16,50Jawa Barat 7,35 9,40 9,35 2,73 4,94 6,18Banten 9,55 12,04 10,91 4,56 6,79 8,50Jawa Tengah 5,44 6,26 6,08 1,56 2,66 4,06DI Yogyakarta 16,28 19,03 15,71 8,28 13,59 15,77Jawa Timur 6,20 7,69 5,91 2,63 4,40 4,23Bali 9,40 11,58 10,91 4,06 7,66 11,32Nusa Tenggara Barat 3,18 3,97 3,18 1,34 2,97 3,51Nusa Tenggara Timur 3,55 4,40 3,42 2,57 3,42 3,40Kalimantan Barat 4,57 5,10 4,80 2,69 4,31 6,84Kalimantan Tengah 3,99 6,51 5,39 2,16 4,79 6,64Kalimantan Selatan 5,70 6,52 6,51 3,47 4,43 7,99Kalimantan Timur 13,02 14,12 11,54 8,51 11,56 14,55Sulawesi Utara 5,28 7,97 6,96 4,01 7,65 8,23Gorontalo 4,91 7,93 3,71 3,43 7,64 6,19Sulawesi Tengah 4,87 4,69 5,15 2,87 3,68 5,96Sulawesi Selatan 4,34 5,38 6,20 2,58 5,07 10,05Sulawesi Barat 2,14 4,77 2,75 1,62 4,95 5,56Sulawesi Tenggara 3,88 5,46 4,44 2,78 5,50 7,13Maluku 3,23 5,18 5,23 2,11 4,35 6,15Maluku Utara 4,43 5,74 3,70 3,30 5,29 6,91Papua 5,49 8,01 4,18 5,46 8,20 5,62Papua Barat 6,44 5,90 8,99 5,20 7,08 11,36Indonesia 6,87 8,40 7,45 3,17 5,27 6,44Sumber: Survei Sosial Ekonomi Nasional, BPSSource: National Socio Economic Survey, Statistics IndonesiaCatatan: Angka Sementara di tahun 2010Note : Preliminary figures in 201046Trends of the Selected Socio-Economic Indicators of Indonesia, August <strong>2011</strong>


