


Create successful ePaper yourself
Turn your PDF publications into a flip-book with our unique Google optimized e-Paper software.
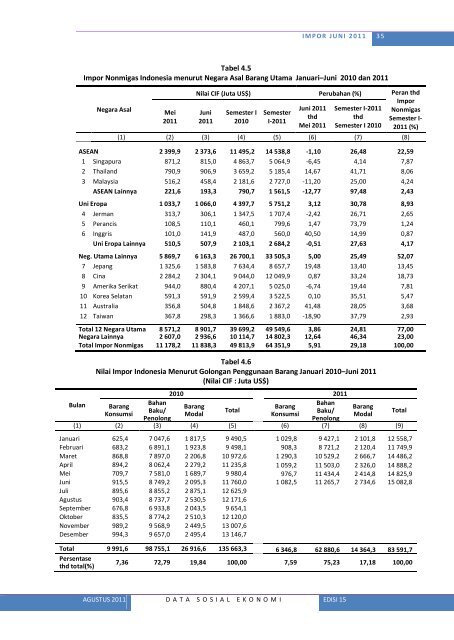
I M P OR J U N I 2 0 1 1 35Tabel 4.5Impor Nonmigas Indonesia menurut Negara Asal Barang Utama Januari–Juni 2010 dan 2011Negara AsalMei2011Nilai CIF (Juta US$) Perubahan (%) Peran thdImporJuni 2011 Semester I-2011Juni Semester I SemesterNonmigasthdthd2011 2010 I-2011Semester I-Mei 2011 Semester I 2010 2011 (%)(1) (2) (3) (4) (5) (6) (7) (8)ASEAN 2 399,9 2 373,6 11 495,2 14 538,8 -1,10 26,48 22,591 Singapura 871,2 815,0 4 863,7 5 064,9 -6,45 4,14 7,872 Thailand 790,9 906,9 3 659,2 5 185,4 14,67 41,71 8,063 Malaysia 516,2 458,4 2 181,6 2 727,0 -11,20 25,00 4,24ASEAN Lainnya 221,6 193,3 790,7 1 561,5 -12,77 97,48 2,43Uni Eropa 1 033,7 1 066,0 4 397,7 5 751,2 3,12 30,78 8,934 Jerman 313,7 306,1 1 347,5 1 707,4 -2,42 26,71 2,655 Perancis 108,5 110,1 460,1 799,6 1,47 73,79 1,246 Inggris 101,0 141,9 487,0 560,0 40,50 14,99 0,87Uni Eropa Lainnya 510,5 507,9 2 103,1 2 684,2 -0,51 27,63 4,17Neg. Utama Lainnya 5 869,7 6 163,3 26 700,1 33 505,3 5,00 25,49 52,077 Jepang 1 325,6 1 583,8 7 634,4 8 657,7 19,48 13,40 13,458 Cina 2 284,2 2 304,1 9 044,0 12 049,9 0,87 33,24 18,739 Amerika Serikat 944,0 880,4 4 207,1 5 025,0 -6,74 19,44 7,8110 Korea Selatan 591,3 591,9 2 599,4 3 522,5 0,10 35,51 5,4711 Australia 356,8 504,8 1 848,6 2 367,2 41,48 28,05 3,6812 Taiwan 367,8 298,3 1 366,6 1 883,0 -18,90 37,79 2,93Total 12 Negara Utama 8 571,2 8 901,7 39 699,2 49 549,6 3,86 24,81 77,00Negara Lainnya 2 607,0 2 936,6 10 114,7 14 802,3 12,64 46,34 23,00Total Impor Nonmigas 11 178,2 11 838,3 49 813,9 64 351,9 5,91 29,18 100,00BulanTabel 4.6Nilai Impor Indonesia Menurut Golongan Penggunaan Barang Januari 2010–Juni 2011(Nilai CIF : Juta US$)BarangKonsumsi2010 2011BahanBahanBarangBarangBaku/TotalModalKonsumsiBaku/PenolongPenolongBarangModal(1) (2) (3) (4) (5) (6) (7) (8) (9)Januari 625,4 7 047,6 1 817,5 9 490,5 1 029,8 9 427,1 2 101,8 12 558,7Februari 683,2 6 891,1 1 923,8 9 498,1 908,3 8 721,2 2 120,4 11 749,9Maret 868,8 7 897,0 2 206,8 10 972,6 1 290,3 10 529,2 2 666,7 14 486,2April 894,2 8 062,4 2 279,2 11 235,8 1 059,2 11 503,0 2 326,0 14 888,2Mei 709,7 7 581,0 1 689,7 9 980,4 976,7 11 434,4 2 414,8 14 825,9Juni 915,5 8 749,2 2 095,3 11 760,0 1 082,5 11 265,7 2 734,6 15 082,8Juli 895,6 8 855,2 2 875,1 12 625,9Agustus 903,4 8 737,7 2 530,5 12 171,6September 676,8 6 933,8 2 043,5 9 654,1Oktober 835,5 8 774,2 2 510,3 12 120,0November 989,2 9 568,9 2 449,5 13 007,6Desember 994,3 9 657,0 2 495,4 13 146,7Total 9 991,6 98 755,1 26 916,6 135 663,3 6 346,8 62 880,6 14 364,3 83 591,7Persentasethd total(%)7,36 72,79 19,84 100,00 7,59 75,23 17,18 100,00TotalAGUSTUS 2011 D A T A S O S I A L E K O N O M I EDISI 15


