Performance and Statistical Information 2014

Create successful ePaper yourself
Turn your PDF publications into a flip-book with our unique Google optimized e-Paper software.
44 Maklumat Prestasi dan Statistik Industri Pembekalan Elektrik di Malaysia <strong>2014</strong> <strong>Performance</strong> <strong>and</strong> <strong>Statistical</strong> <strong>Information</strong> on Electricity Supply Industry in Malaysia<br />
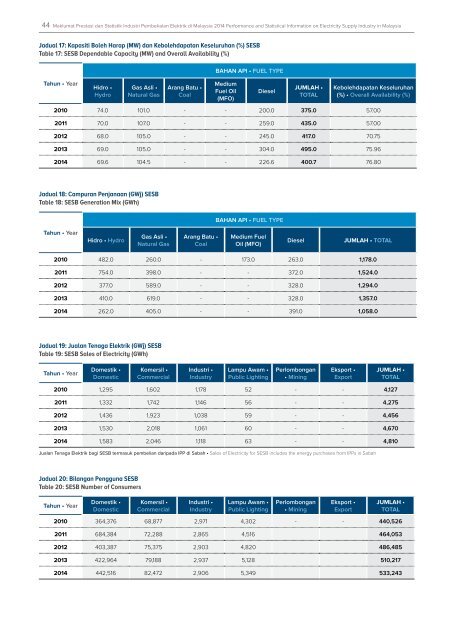
Jadual 17: Kapasiti Boleh Harap (MW) dan Kebolehdapatan Keseluruhan (%) SESB<br />
Table 17: SESB Dependable Capacity (MW) <strong>and</strong> Overall Availability (%)<br />
Tahun • Year<br />
Hidro •<br />
Hydro<br />
Gas Asli •<br />
Natural Gas<br />
Arang Batu •<br />
Coal<br />
BAHAN API • FUEL TYPE<br />
Medium<br />
Fuel Oil<br />
(MFO)<br />
Diesel<br />
JUMLAH •<br />
TOTAL<br />
Kebolehdapatan Keseluruhan<br />
(%) • Overall Availability (%)<br />
2010 74.0 101.0 - - 200.0 375.0 57.00<br />
2011 70.0 107.0 - - 259.0 435.0 57.00<br />
2012 68.0 105.0 - - 245.0 417.0 70.75<br />
2013 69.0 105.0 - - 304.0 495.0 75.96<br />
<strong>2014</strong> 69.6 104.5 - - 226.6 400.7 76.80<br />
Jadual 18: Campuran Penjanaan (GWj) SESB<br />
Table 18: SESB Generation Mix (GWh)<br />
BAHAN API • FUEL TYPE<br />
Tahun • Year<br />
Hidro • Hydro<br />
Gas Asli •<br />
Natural Gas<br />
Arang Batu •<br />
Coal<br />
Medium Fuel<br />
Oil (MFO)<br />
Diesel<br />
JUMLAH • TOTAL<br />
2010 482.0 260.0 - 173.0 263.0 1,178.0<br />
2011 754.0 398.0 - - 372.0 1,524.0<br />
2012 377.0 589.0 - - 328.0 1,294.0<br />
2013 410.0 619.0 - - 328.0 1,357.0<br />
<strong>2014</strong> 262.0 405.0 - - 391.0 1,058.0<br />
Jadual 19: Jualan Tenaga Elektrik (GWj) SESB<br />
Table 19: SESB Sales of Electricity (GWh)<br />
Tahun • Year<br />
Domestik •<br />
Domestic<br />
Komersil •<br />
Commercial<br />
Industri •<br />
Industry<br />
Lampu Awam •<br />
Public Lighting<br />
Perlombongan<br />
• Mining<br />
Eksport •<br />
Export<br />
JUMLAH •<br />
TOTAL<br />
2010 1,295 1,602 1,178 52 - - 4,127<br />
2011 1,332 1,742 1,146 56 - - 4,275<br />
2012 1,436 1,923 1,038 59 - - 4,456<br />
2013 1,530 2,018 1,061 60 - - 4,670<br />
<strong>2014</strong> 1,583 2,046 1,118 63 - - 4,810<br />
Jualan Tenaga Elektrik bagi SESB termasuk pembelian daripada IPP di Sabah • Sales of Electricity for SESB includes the energy purchases from IPPs in Sabah<br />
Jadual 20: Bilangan Pengguna SESB<br />
Table 20: SESB Number of Consumers<br />
Tahun • Year<br />
Domestik •<br />
Domestic<br />
Komersil •<br />
Commercial<br />
Industri •<br />
Industry<br />
Lampu Awam •<br />
Public Lighting<br />
Perlombongan<br />
• Mining<br />
Eksport •<br />
Export<br />
JUMLAH •<br />
TOTAL<br />
2010 364,376 68,877 2,971 4,302 - - 440,526<br />
2011 684,384 72,288 2,865 4,516 464,053<br />
2012 403,387 75,375 2,903 4,820 486,485<br />
2013 422,964 79,188 2,937 5,128 510,217<br />
<strong>2014</strong> 442,516 82,472 2,906 5,349 533,243