Introduzione di specie ittiche alloctone e declino delle specie ... - aiiad
Introduzione di specie ittiche alloctone e declino delle specie ... - aiiad
Introduzione di specie ittiche alloctone e declino delle specie ... - aiiad

You also want an ePaper? Increase the reach of your titles
YUMPU automatically turns print PDFs into web optimized ePapers that Google loves.
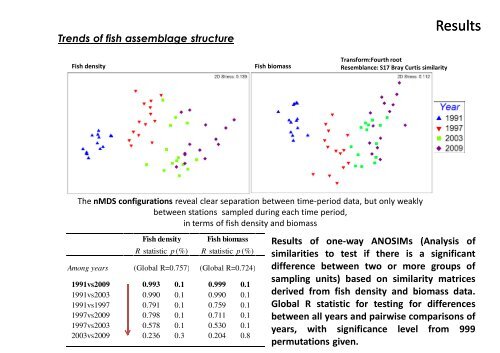
Trends of fish assemblage structure<br />
Fish density Fish biomass<br />
Transform:Fourth root<br />
Resemblance: S17 Bray Curtis similarity<br />
The nMDS configurations reveal clear separation between time-period data, but only weakly<br />
between stations sampled during each time period,<br />
in terms of fish density and biomass<br />
Among years<br />
Fish density<br />
Fish biomass<br />
R statistic p (%) R statistic p (%)<br />
(Global R=0.757) (Global R=0.724)<br />
1991vs2009 0.993 0.1 0.999 0.1<br />
1991vs2003 0.990 0.1 0.990 0.1<br />
1991vs1997 0.791 0.1 0.759 0.1<br />
1997vs2009 0.798 0.1 0.711 0.1<br />
1997vs2003 0.578 0.1 0.530 0.1<br />
2003vs2009 0.236 0.3 0.204 0.8<br />
Results<br />
Results of one-way ANOSIMs (Analysis of<br />
similarities to test if there is a significant<br />
<strong>di</strong>fference between two or more groups of<br />
sampling units) based on similarity matrices<br />
derived from fish density and biomass data.<br />
Global R statistic for testing for <strong>di</strong>fferences<br />
between all years and pairwise comparisons of<br />
years, with significance level from 999<br />
permutations given.