Lezione n. 1 (a cura di Irene Tibidò) - Dipartimento di Statistica
Lezione n. 1 (a cura di Irene Tibidò) - Dipartimento di Statistica
Lezione n. 1 (a cura di Irene Tibidò) - Dipartimento di Statistica

You also want an ePaper? Increase the reach of your titles
YUMPU automatically turns print PDFs into web optimized ePapers that Google loves.
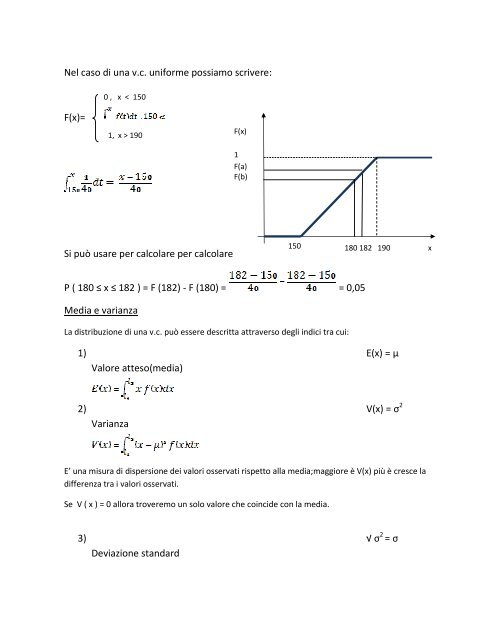
Nel caso <strong>di</strong> una v.c. uniforme possiamo scrivere:<br />
0 , x < 150<br />
F(x)=<br />
1, x > 190<br />
x < 190<br />
F(x)<br />
1<br />
F(a)<br />
F(b)<br />
Si può usare per calcolare per calcolare<br />
150<br />
180 182 190 x<br />
P ( 180 ≤ x ≤ 182 ) = F (182) - F (180) = = 0,05<br />
Me<strong>di</strong>a e varianza<br />
La <strong>di</strong>stribuzione <strong>di</strong> una v.c. può essere descritta attraverso degli in<strong>di</strong>ci tra cui:<br />
1) E(x) = μ<br />
Valore atteso(me<strong>di</strong>a)<br />
2) V(x) = σ 2<br />
Varianza<br />
E’ una misura <strong>di</strong> <strong>di</strong>spersione dei valori osservati rispetto alla me<strong>di</strong>a;maggiore è V(x) più è cresce la<br />
<strong>di</strong>fferenza tra i valori osservati.<br />
Se V ( x ) = 0 allora troveremo un solo valore che coincide con la me<strong>di</strong>a.<br />
3) √ σ 2 = σ<br />
Deviazione standard