Fac-simile esame 1 - Dipartimento di Statistica - Università degli ...
Fac-simile esame 1 - Dipartimento di Statistica - Università degli ...
Fac-simile esame 1 - Dipartimento di Statistica - Università degli ...
- No tags were found...

You also want an ePaper? Increase the reach of your titles
YUMPU automatically turns print PDFs into web optimized ePapers that Google loves.
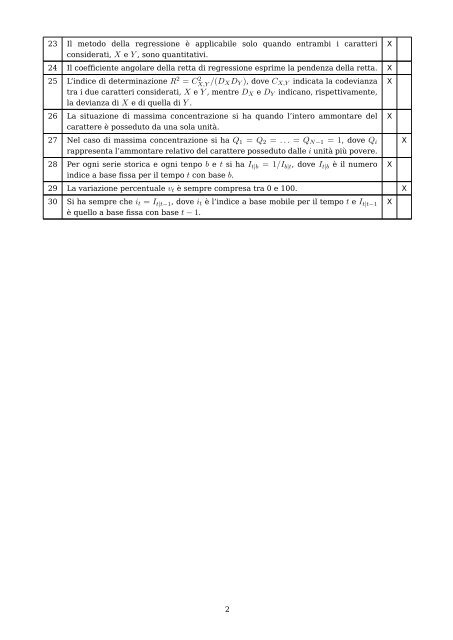
23 Il metodo della regressione è applicabile solo quando entrambi i carattericonsiderati, X e Y , sono quantitativi.24 Il coefficiente angolare della retta <strong>di</strong> regressione esprime la pendenza della retta. X25 L’in<strong>di</strong>ce <strong>di</strong> determinazione R 2 = C 2 X,Y /(D XD Y ), dove C X,Y in<strong>di</strong>cata la codevianzatra i due caratteri considerati, X e Y , mentre D X e D Y in<strong>di</strong>cano, rispettivamente,la devianza <strong>di</strong> X e <strong>di</strong> quella <strong>di</strong> Y .26 La situazione <strong>di</strong> massima concentrazione si ha quando l’intero ammontare delcarattere è posseduto da una sola unità.27 Nel caso <strong>di</strong> massima concentrazione si ha Q 1 = Q 2 = . . . = Q N−1 = 1, dove Q irappresenta l’ammontare relativo del carattere posseduto dalle i unità più povere.28 Per ogni serie storica e ogni tenpo b e t si ha I t|b = 1/I b|t , dove I t|b è il numeroin<strong>di</strong>ce a base fissa per il tempo t con base b.29 La variazione percentuale v t è sempre compresa tra 0 e 100. X30 Si ha sempre che i t = I t|t−1 , dove i t è l’in<strong>di</strong>ce a base mobile per il tempo t e I t|t−1è quello a base fissa con base t − 1.XXXXXX2