Il mercato italiano del private equity venture capital e private debt nel 2015
1LITEjG
1LITEjG

Create successful ePaper yourself
Turn your PDF publications into a flip-book with our unique Google optimized e-Paper software.
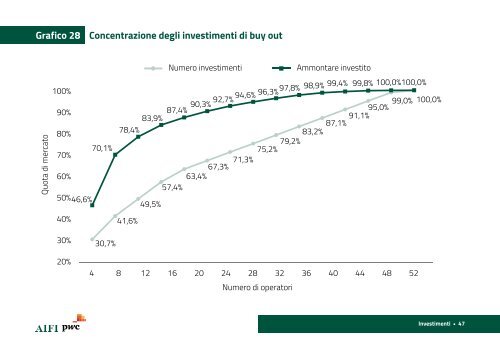
Grafico 28 Concentrazione degli investimenti di buy out<br />
Quota di <strong>mercato</strong><br />
100%<br />
90%<br />
80%<br />
70,1%<br />
70%<br />
60%<br />
50% 46,6%<br />
40%<br />
Numero investimenti<br />
Ammontare investito<br />
83,9% 87,4% 90,3% 92,7% 94,6% 96,3%97,8% 98,9% 99,4% 99,8% 100,0% 100,0%<br />
99,0% 100,0%<br />
91,1%95,0%<br />
87,1%<br />
78,4%<br />
83,2%<br />
75,2% 79,2%<br />
67,3% 71,3%<br />
63,4%<br />
57,4%<br />
41,6%<br />
49,5%<br />
30%<br />
20%<br />
30,7%<br />
4 8 12 16 20 24 28 32 36 40 44 48 52<br />
Numero di operatori<br />
Investimenti • 47