Cover Story Quantifying
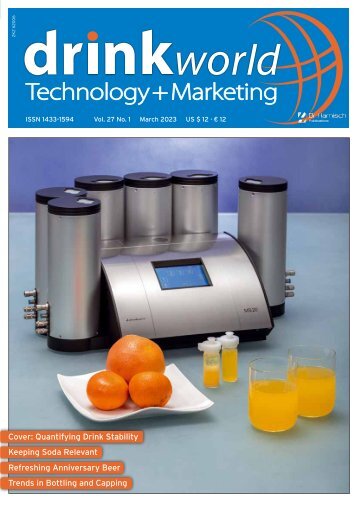
Cover Story Quantifying the Long-Term Stability of Food Formulations Foodstuffs are often mixtures of different ingredients and are therefore liable to separate. It is important to quantify these separation processes to optimize food product formulations. The MultiScan MS 20 dispersion stability analysis system, developed by DataPhysics Instruments, can reliably and efficiently analyze food dispersions regarding their destabilization and aging. The following use case evaluates five milk substitutes and compares the occurring destabilization mechanisms. by Dr. Qiongjie Liu Many food products, such as milk products and mayonnaise, are complex multicomponent mixtures. In their production, a homogeneous composition with good flavor, texture, and nutritional value is desired. Separation processes in these mixtures can strongly influence their taste and mouthfeel. Assuring longterm homogeneity and thus a long shelf life for such products requires thorough optimization during the formulation of the mixtures. The type and concentration of the formulation’s ingredients, its processing temperature, рН, and viscosity are crucial parameters determining its separation behavior. Therefore, understanding the stability of food dispersions is important for research and development departments in the food industry. However, observing separation processes with the naked eye is highly subjective and time-consuming, hindering efficient formulation optimization. MultiScan MS 20: An Ideal Companion to Characterize Dispersions To solve the above issues, the German measuring equipment manufacturer DataPhysics Instruments has developed the MultiScan MS 20 measuring device for automatic optical stability and ageing analysis of liquid dispersions (Figure 1). The device was particularly developed to characterize suspensions was well as emulsions and allow comprehensive time- and temperature-resolved analysis of destabilization mechanisms. The MultiScan MS 20 comprises a base unit to which up to six sample chambers can be added. The base unit of the MultiScan MS 20 features an integrated touch screen, which Figure 1: DataPhysics Instruments’ MultiScan MS 20 dispersion stability analysis system can be fitted with up to six sample chambers. displays status information and can be used to control important functions. Additionally, samples can be registered quickly and conveniently with a built-in scanner as well as an optional handheld barcode scanner. The six sample chambers of the MultiScan MS 20, called ScanTowers, can be individually controlled and operated at different temperatures. Electric heating, with liquid counter-cooling, enables measurements between -10 °C and 80 °C. Visualising and Quantifying Destabilization Processes With a MultiScan MS 20, destabilization mechanisms in dispersions can be visualized and quantified. The device achieves this by tracking changes in light intensity. It measures the sample repeatedly for a predefined period and in a position-resolved manner. The patterns arising in the light intensity can give a trained scientist information on how the dispersion changes over time and what destabilization mechanisms might cause these changes. The experimental setup is as follows: A sample is placed in a glass vial, which is then placed in a measurement chamber. Two light sources and a light detector simultaneously move up and down along the sample (Figure 3). During the measurement, the whole sample height is scanned, detecting global and local changes in the sample. The software analyzes the light intensities transmitted through and backscattered by the sample. The transmission (light penetrating through the sample) and backscattering (light reflected by the sample) intensities depend directly on the number, size, and type of the dispersed particles. Hence, the light 6 food Marketing & Technology • October 2022
Cover Story against their height positions for all five samples. The color-coding of the curves indicates the time they were recorded, from red (start of the experiment, t = 0 s) to purple (end of the experiment, t = 1 day 3 hours). Each curve represents one measurement. Figure 2: The five milk samples, pictured here at the end of the experiment intensity changes when the dispersion destabilizes. Particles can sediment to the bottom of the sample container, so more particles scatter back light in the bottom layer. Particles can also cream, meaning lighter particles collect at the top of the liquid, meaning more light is scattered back in the top layer of the dispersion. In both cases, the measured profile of the dispersion shows decreasing transmission intensities, while the backscattering intensities increase in the respective area of the dispersion. Moreover, particles can cluster, minimising their interfacial area with the surrounding liquid phase. Such changes can be seen as global changes in the transmission and backscattering intensities. Use Case: Vegan Milk Substitutes The following use case compares the destabilization mechanisms of five milk substitutes using the MultiScan MS 20. Milk substitutes are generally produced by mechanically breaking down plant materials, such as nuts, legumes, or seeds. The plant material is then mixed with oil, water, and colloidal matter to form a multiphase dispersion. This study characterizes five milk substitutes based on peas, oats, coconuts, almonds, and soy (Figure 2). zone was between 0 mm (bottom of the glass) and 57 mm (top of the glass). As the samples were opaque, the light cannot penetrate through the sample. Thus, the transmission intensities could not be used for evaluation. Therefore, the backscattering intensities were analyzed to study the stability of all five milk substitutes. The graphs in Figure 4 show the backscattering intensities light source sample scanning The backscattering diagrams show time- and position-dependent changes in the light intensities in all five samples. For example, the backscattering intensity of the oat-based substitute decreases at the bottom of the vial while increasing at the top over time. Thus, the particles migrate from the bottom layer to the top layer in a mechanism described as creaming. Regarding the coconut- and almondbased samples, the backscattering intensities at the top also increase; however, so do the backscattering values at the bottom of the sample vial. In this case, creaming at the top is accompanied by a sedimentation Figure 3: The measurement principle of the MultiScan MS 20: The two light sources and the detector move up and down the sample vial for each measurement. transmitted and backscattered intensities light source change in intensities detector A sample of each substitute with a volume of 20 ml was homogenized using a shaker and then poured into a transparent glass vial to be measured at a constant temperature of 25 °C. The mixtures were measured every 6 minutes for a total experiment time of 1 day and 3 hours. The measured sample vessel food Marketing & Technology • October 2022 7