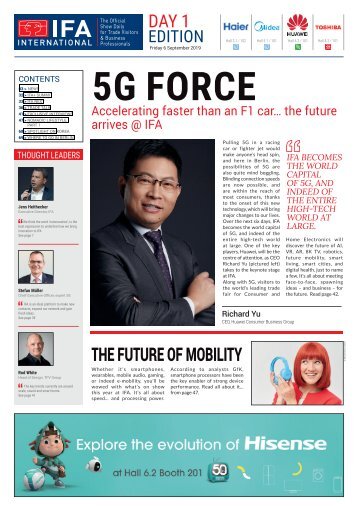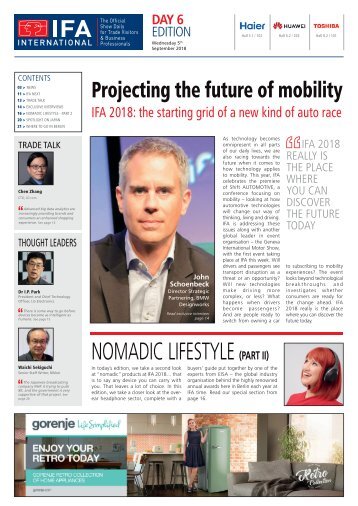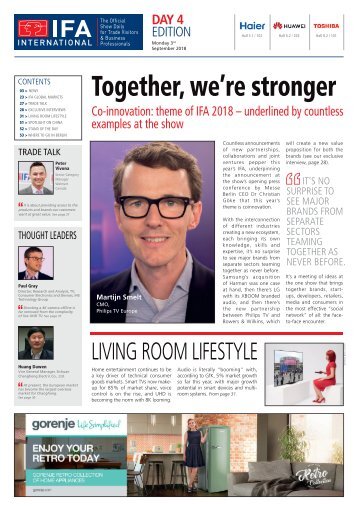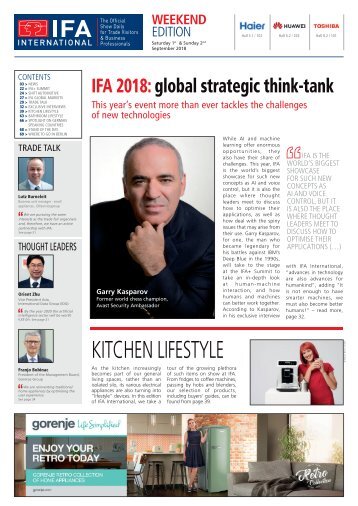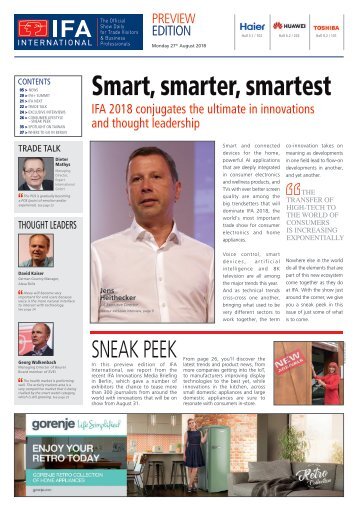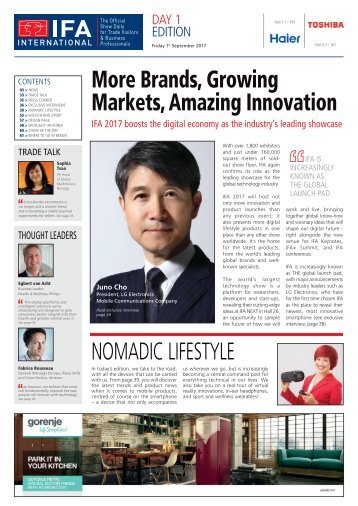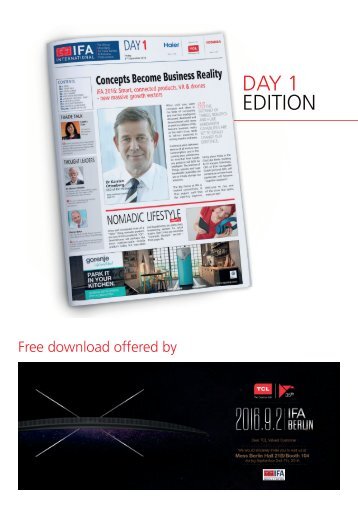
DAY 1 Edition - IFA International 2017
- Text
- Products
- Smartphone
- Global
- September
- Consumers
- Mobile
- Berlin
- Philips
- Audio
- Consumer
NOMADIC LIFESTYLE
NOMADIC LIFESTYLE SMARTPHONES Global Smartphone Demand Peaks Alongside a Leap in Average Sales Price in 2Q17 Global smartphone demand totalled 347 million units in 2Q17 according to GfK, up 4% year-onyear. This makes it the strongest second quarter on record. Emerging Asia led the demand growth with a 13% year-on-year increase, followed by Central and Eastern Europe at 11%, and Latin America at 10%. Market value grew 9% year-on-year, due to rising average sales price (ASP). Arndt Polifke, global director of telecom research at GfK, comments, “The record demand for smartphones in the second quarter this year shows that, despite saturation in some markets, the desire to own a smartphone is a worldwide phenomenon. How that manifests itself differs widely by region. Manufacturers are maximizing all their creativity to ensure their latest devices are irresistible – and to increase ASP as a result. Elsewhere, macroeconomic factors and consumer confidence are having an impact, but operators and retailers are employing localized tactics to ensure the smartphone remains the connected device of choice.” Yotaro Noguchi, product lead in GfK’s trends and forecasting division, adds, “Consumers are willing to pay more for their smartphone as they seek a better user experience. Despite the market reaching high penetration levels, GfK forecasts smartphone demand will continue to see yearon-year growth even in 2018, as innovation from smartphone vendors keeps replacement cycles from lengthening.” WESTERN EUROPE: DEMAND DROPS FOR A THIRD CONSECUTIVE QUARTER Smartphone demand totaled 28.7 million units in 2Q17, down 3% year-on-year. This is the third consecutive quarter of decline, caused by saturation in the largest markets, Germany, Great Britain and France. In these markets yearon-year demand fell -4%, -5% and -7% respectively. However, GfK expects major device launches in 4Q to help moderate full-year declines to -0.4%. CENTRAL AND EASTERN EUROPE: GROWING, AND WITH A POSITIVE OUTLOOK The region continues its recovery, with smartphone demand reaching 18.7 million units in 2Q17, up 11% year-on-year. As the political situation stablises and consumer confidence recovers in Russia and the Ukraine, both markets have posted impressive year-on-year growth. In Russia, demand was up 11% year-onyear in 2Q17, and in the Ukraine it was up 22%. GfK raised its forecast for smartphone demand in the region slightly to 85.2 million in 2017, a rise of nine% year-on-year. NORTH AMERICA: A WELCOME RETURN TO GROWTH Here, the market grew 6% yearon-year to 47.4 million units in 2Q, following falls in demand in the recent quarter. GfK forecasts smartphone demand in the region to total 203 million units in 2017, a rise of two% year-on-year. ASIA: ANTICIPATING THE STRONGEST REGIONAL GROWTH IN 2017 Smartphone demand in the region totaled 56.7 million units, up 13% year-on-year. Bangladesh and Malaysia powered most of this growth. In Bangladesh, smartphone demand grew by a strong 40% year-on-year. Malaysia is maintaining a steady recovery from its 2015 slump, and here demand in 2Q17 grew by 31% year-on-year. Smartphone demand in India also remained resilient in 2Q17, having leveled out slightly to 14% year-onyear. GfK expects the recently announced Goods and Services Tax (GST) will have no impact on smartphone demand in the country. GfK forecasts overall smartphone demand in the region will total 234 million units in 2017, an increase of 11% year-on-year. This represents the strongest growth across all regions for the year. Meanwhile, in China, smartphone demand plateaued in 2Q17 at 110.1 million units, showing no change year-on-year. This moderation of growth in demand for smartphones was caused primarily by saturation in the market. However, as we’re seeing in other regions, higher-priced new products are pushing up market value. GfK forecasts smartphone demand in China to total 461 million units in 2017, an increase of 2% year-on-year. The growth in value terms (USD) is expected to be considerably higher, at 11% year-on-year SMARTPHONE SALES 2Q 2017 VS. 2Q 2016 Units sold (in million) Sales value (in billion USD) 2Q17 2Q16 Y/Y % change 2Q17 2Q16 Y/Y % change Western Europe 28.7 29.8 -4% 12.1 12.2 -1% Central & Eastern Europe 18.7 16.8 11% 4.6 3.7 24% North America 47.4 44.6 6% 18.7 16.2 15% Latin America 27.0 24.6 10% 8.5 7.5 13% Middle East & Africa 42.2 41.6 1% 9.9 10.7 -7% China 110.1 109.7 0% 35.1 32.4 8% Developed Asia 16.1 16.6 -3% 10.0 9.4 6% Emerging Asia 56.7 50.0 13% 10.3 7.9 30% GLOBAL 346.9 333.7 4% 109.2 1000.0 9% SMARTPHONE SALES 2017 VS. 2016 Units sold (in million) Sales value (in billion USD) 2017 sales 2016 sales Y/Y % change 2017 sales 2016 sales Y/Y % change Western Europe 130.7 130.7 0% 55.2 53.4 3% Central & Eastern Europe 85.2 77.9 9% 20.4 17.0 20% North America 203.1 198.5 2% 81.7 77.5 5% Latin America 114.3 106.6 7% 35.1 31.8 10% Middle East & Africa 176.2 167.8 5% 41.7 42.4 -2% China 461.0 450.1 2% 148.3 133.5 11% Developed Asia 73.1 74.1 -1% 46.0 45.1 2% Emerging Asia 234.4 211.7 11% 41.9 34.4 22% GLOBAL 1,478.0 1,417.9 4% 470.3 435.1 8% Source: GfK Point of Sales (POS) Measurement data in 75+ markets, monthly data to the end of May 2017, plus weekly data to 24 June 2017. Percentages are rounded Source: GfK Point of Sales (POS) Measurement data in 75+ markets, monthly data to the end of May 2017, plus weekly data to 24 June 2017. Percentages are rounded www.ifa-international.org IFA International • Friday 1 st September 2017 41
- Page 1: DAY 1 EDITION Hall 3.1 / 109 Friday
- Page 4 and 5: NEWS TV screens are getting bigger:
- Page 9: NEWS IFA 2017 KEYNOTES PROMINENT IN
- Page 13: NEWS UX Design Awards 2017: From Au
- Page 17: Bang & Olufsen Brings Synergy of So
- Page 21: NEWS Philips 65-inch OLED 9 Series
- Page 25 and 26: NEWS Siemens Presents Solutions for
- Page 27 and 28: NEWS Harald Friedrich Bosch's Execu
- Page 29 and 30: THE NEXT LEVEL OF INTELLIGENCE Hall
- Page 31 and 32: NEWS droidcon Berlin 2017 - IFA deb
- Page 33: TRADE TALK BROUGHT TO YOU BY ADVERT
- Page 36 and 37: EXCLUSIVE INTERVIEW Keynote Spotlig
- Page 38 and 39: EXCLUSIVE INTERVIEW THE OPPORTUNITY
- Page 42 and 43: NOMADIC LIFESTYLE SMARTPHONES Smart
- Page 44 and 45: NOMADIC LIFESTYLE SMARTPHONES PRODU
- Page 46 and 47: NOMADIC LIFESTYLE VR: Major Growth
- Page 49 and 50: NOMADIC LIFESTYLE ROBOTS & DRONES S
- Page 51: NOMADIC LIFESTYLE e-MOBILITY WIRELE
- Page 54 and 55: 54
- Page 57 and 58: DESIGNER VIEW Leading by Focused De
- Page 59 and 60: ADVERTORIAL Region SPOTLIGHT ON KOR
- Page 61 and 62: © Thomas Keller HOSPITALITY / REST
- Page 65 and 66: HALL PLAN SHUTTLES Hall 3.1 - Stand
- Page 67 and 68: Hall 26c - Stands 100 & 121 Hall 6.
Inappropriate
Loading...
Mail this publication
Loading...
Embed
Loading...

IFA International
- IFA International 2023
- IFA International 2022
- IFA International 2020
- IFA International 2019
- IFA International 2018
- IFA International 2017
- IFA International 2016
- IFA International 2015
- IFA International 2014
- IFA International 2013
- IFA International 2012
- IFA International 2011
- IFA International 2010
- IFA International 2009
- IFA International 2008
- IFA International 2007
