Statistikk 2010 - Fjord Norway
Statistikk 2010 - Fjord Norway
Statistikk 2010 - Fjord Norway

Create successful ePaper yourself
Turn your PDF publications into a flip-book with our unique Google optimized e-Paper software.
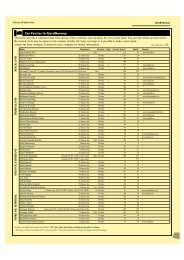
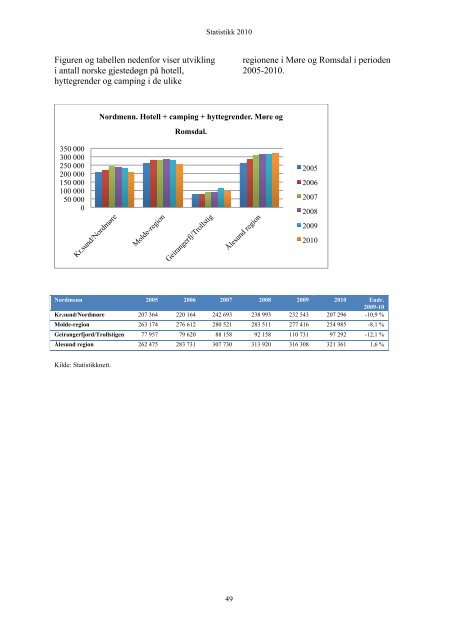
Figuren og tabellen nedenfor viser utvikling<br />
i antall norske gjestedøgn på hotell,<br />
hyttegrender og camping i de ulike<br />
350 000<br />
300 000<br />
250 000<br />
200 000<br />
150 000<br />
100 000<br />
50 000<br />
0<br />
<strong>Statistikk</strong> <strong>2010</strong><br />
49<br />
regionene i Møre og Romsdal i perioden<br />
2005-<strong>2010</strong>.<br />
Nordmenn 2005 2006 2007 2008 2009 <strong>2010</strong> Endr.<br />
2009-10<br />
Kr.sund/Nordmøre 207 364 220 164 242 693 238 993 232 543 207 296 -10,9 %<br />
Molde-region 263 174 276 612 280 521 283 511 277 416 254 985 -8,1 %<br />
Geirangerfjord/Trollstigen 77 957 79 620 88 158 92 158 110 731 97 292 -12,1 %<br />
Ålesund region 262 475 283 731 307 730 313 920 316 308 321 361 1,6 %<br />
Kilde: <strong>Statistikk</strong>nett.<br />
Nordmenn. Hotell + camping + hyttegrender. Møre og<br />
Romsdal.<br />
2005<br />
2006<br />
2007<br />
2008<br />
2009<br />
<strong>2010</strong>