Hotelaria em Números Brasil 2012 Lodging Industry in ... - FOHB
Hotelaria em Números Brasil 2012 Lodging Industry in ... - FOHB
Hotelaria em Números Brasil 2012 Lodging Industry in ... - FOHB

Create successful ePaper yourself
Turn your PDF publications into a flip-book with our unique Google optimized e-Paper software.
®<br />
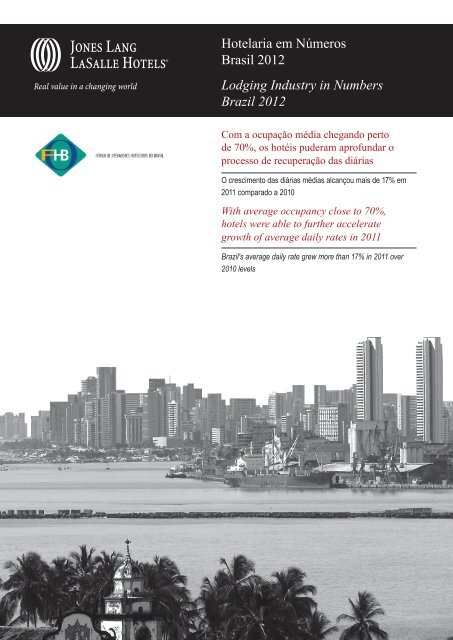
<strong>Hotelaria</strong> <strong>em</strong> <strong>Números</strong><br />
<strong>Brasil</strong> <strong>2012</strong><br />
<strong>Lodg<strong>in</strong>g</strong> <strong>Industry</strong> <strong>in</strong> Numbers<br />
Brazil <strong>2012</strong><br />
Com a ocupação média chegando perto<br />
de 70%, os hotéis puderam aprofundar o<br />
processo de recuperação das diárias<br />
O crescimento das diárias médias alcançou mais de 17% <strong>em</strong><br />
2011 comparado a 2010<br />
With average occupancy close to 70%,<br />
hotels were able to further accelerate<br />
growth of average daily rates <strong>in</strong> 2011<br />
Brazil's average daily rate grew more than 17% <strong>in</strong> 2011 over<br />
2010 levels
Responsáveis | Contributors<br />
Ricardo Mader<br />
+55 11 3071 0747<br />
ricardo.mader@am.jll.com<br />
Manuela Gorni<br />
+55 11 3071 0747<br />
manuela.gorni@am.jll.com<br />
Kuki Di Cunto<br />
+55 11 3071 0747<br />
maria.dicunto@am.jll.com<br />
Lauro Ferroni<br />
+1 312 228 2566<br />
lauro.ferroni@am.jll.com<br />
Rua Joaquim Floriano, 72 – cjto. 97, São Paulo, SP 04534-000 Brazil<br />
www.joneslanglasallehotels.com.br<br />
A Jones Lang LaSalle Hotels é uma consultoria imobiliária com foco exclusivo <strong>em</strong> hotéis e hospitalidade. A <strong>em</strong>presa oferece consultoria<br />
para aquisições e f<strong>in</strong>anciamentos, avaliações, comercialização e gestão de ativos para todas as categorias de hotéis, desde propriedades<br />
luxuosas até hotéis econômicos, além de resorts e pubs, <strong>in</strong>clu<strong>in</strong>do desde um único ativo a grandes portfólios de hotéis e propriedades de<br />
uso misto. Nos últimos c<strong>in</strong>co anos, a Jones Lang LaSalle Hotels realizou cerca de 4.000 trabalhos de assessoria e avaliação e concluiu<br />
transações de vendas, compras e f<strong>in</strong>anciamentos que somaram mais de US$ 30 bilhões. Com 44 escritórios <strong>em</strong> 20 países, a <strong>em</strong>presa<br />
conta com uma equipe global de 265 especialistas e, anualmente, desenvolve 75 estudos e pesquisas.<br />
No perfil da Jones Lang LaSalle no twitter são disponibilizadas <strong>in</strong>formações sobre o mercado imobiliário e as pr<strong>in</strong>cipais matérias sobre a<br />
<strong>em</strong>presa divulgadas na imprensa. Para seguir a Jones Lang LaSalle <strong>Brasil</strong> no twitter, acesse: twitter.com/jllbrasil<br />
Para mais <strong>in</strong>formações, acesse: http://www.joneslanglasallehotels.com<br />
Jones Lang LaSalle Hotels is a global real estate services firm focused exclusively on hotels & hospitality. We provide acquisition and<br />
f<strong>in</strong>anc<strong>in</strong>g advice, valuations, <strong>in</strong>vestment sales and asset manag<strong>em</strong>ent for luxury hotels, select service and budget hotels, smaller hotels and<br />
pubs, from s<strong>in</strong>gle assets to large portfolios and mixed-use developments.<br />
In the last five years we completed nearly 4,000 advisory and valuation assignments and more sale, purchase and f<strong>in</strong>anc<strong>in</strong>g transactions<br />
than any other hotels real estate firm <strong>in</strong> the world …worth over $30 billion. With 44 offices <strong>in</strong> 20 countries and 265 hotels real estate<br />
experts, no other firm is better connected. Through our depth and breadth of research and experience, with 75 Research Reports each<br />
year, we know the market at every level, we know the players and we know how to get results.<br />
www.joneslanglasallehotels.com<br />
Foto: Recife vista de Ol<strong>in</strong>da | Photo: Recife view from Ol<strong>in</strong>da | de by Lyssuel Calvet
Prefácio<br />
Prezado leitor,<br />
Novamente é com grande prazer que apresentamos a publicação<br />
“<strong>Hotelaria</strong> <strong>em</strong> <strong>Números</strong> - <strong>Brasil</strong> <strong>2012</strong>”. A publicação foi elaborada<br />
com base <strong>em</strong> um questionário preenchido por mais de 400 hotéis,<br />
resorts e flats sobre a sua performance no ano de 2011.<br />
Este ano, mais uma vez contamos com a parceria do <strong>FOHB</strong>, Fórum<br />
das Operadoras Hoteleiras do <strong>Brasil</strong>, que atuou junto aos seus<br />
associados <strong>in</strong>centivando a participação na pesquisa.<br />
Esta parceria é de grande importância para a obtenção dos objetivos<br />
da Jones Lang LaSalle Hotels de cada vez mais <strong>in</strong>cr<strong>em</strong>entar a<br />
amostrag<strong>em</strong> e aprimorar as <strong>in</strong>formações, tornando assim a pesquisa<br />
mais abrangente e confiável.<br />
O objetivo deste trabalho é apresentar um panorama da performance<br />
dos hotéis, resorts e flats no país, com ênfase na apresentação do<br />
perfil dos hóspedes nos hotéis e na criação de parâmetros sobre a<br />
distribuição das receitas e despesas da sua operação. Este trabalho<br />
é um grande <strong>in</strong>strumento de referência para os <strong>em</strong>preendimentos<br />
hoteleiros, pr<strong>in</strong>cipalmente durante a elaboração dos seus planos<br />
orçamentários e para tanto procuramos antecipar a disponibilização<br />
dos resultados. Na elaboração dos dados e resultados foi mantida<br />
nossa <strong>in</strong>dependência, b<strong>em</strong> como a confidencialidade dos dados.<br />
Aproveitamos a oportunidade para agradecer a colaboração de<br />
todos os hotéis, resorts e flats que, com a direta participação<br />
do <strong>FOHB</strong>, contribuíram mais uma vez para o crescimento da<br />
amostrag<strong>em</strong> <strong>em</strong> relação ao ano passado, sendo a maior desde<br />
o <strong>in</strong>ício do estudo há 19 anos, e por prover valiosas <strong>in</strong>formações<br />
que permitiram à Jones Lang LaSalle Hotels apresentar aos<br />
gerentes e desenvolvedores um maior entendimento da <strong>in</strong>dústria<br />
da hospitalidade no <strong>Brasil</strong>, através de parâmetros e estatísticas<br />
confiáveis.<br />
Se desejar receber uma cópia eletrônica deste relatório,<br />
favor entrar <strong>em</strong> contato através do e-mail jllh.brasil@am.jll.com.<br />
Ricardo Mader e Manuela Gorni<br />
Jones Lang LaSalle Hotels<br />
Prezado leitor,<br />
Criado <strong>em</strong> 2002, o Fórum de Operadores Hoteleiros do <strong>Brasil</strong><br />
t<strong>em</strong> como missão trabalhar pelo desenvolvimento das redes<br />
hoteleiras associadas e de seus <strong>in</strong>vestidores, parceiros, hóspedes<br />
e colaboradores, junto aos setores público e privado, fomentando<br />
discussões relevantes à classe e ao setor hoteleiro <strong>em</strong> geral.<br />
Para o <strong>FOHB</strong>, compartilhar dados com o mercado é extr<strong>em</strong>amente<br />
importante e estamos certos de que o desenvolvimento sustentável<br />
do setor se dá baseado <strong>em</strong> boas parcerias que proporcion<strong>em</strong><br />
<strong>in</strong>formações confiáveis e determ<strong>in</strong>antes no processo de tomada de<br />
decisão de novos <strong>in</strong>vestimentos.<br />
Por isso, contamos com o profissionalismo da Jones Lang LaSalle<br />
Hotels, que todos os anos faz o estudo <strong>Hotelaria</strong> <strong>em</strong> <strong>Números</strong>, que<br />
t<strong>em</strong> fundamental relevância para o nosso segmento. Estamos muito<br />
satisfeitos <strong>em</strong> ter colaborado para a realização de mais uma edição.<br />
Que a nossa aliança se fortaleça a cada ano.<br />
Boa leitura.<br />
Roberto Rotter<br />
Presidente - <strong>FOHB</strong><br />
<strong>Hotelaria</strong> <strong>em</strong> <strong>Números</strong> – <strong>Brasil</strong> <strong>2012</strong> | <strong>Lodg<strong>in</strong>g</strong> <strong>Industry</strong> <strong>in</strong> Numbers – Brazil <strong>2012</strong> 3<br />
Foreword<br />
Dear reader,<br />
Once aga<strong>in</strong>, we are pleased to present to you <strong>Lodg<strong>in</strong>g</strong> <strong>Industry</strong> <strong>in</strong><br />
Numbers – Brazil <strong>2012</strong>. This research report presents the latest<br />
figures from the Brazilian hospitality market, detail<strong>in</strong>g performance<br />
data provided by more than 400 Brazilian hotels, condo hotels and<br />
resorts dur<strong>in</strong>g 2011.<br />
In this edition, Jones Lang LaSalle Hotels has aga<strong>in</strong> partnered with<br />
the Brazilian Forum of Hotel Operators (<strong>FOHB</strong>), which encouraged<br />
its m<strong>em</strong>bers to participate <strong>in</strong> this research study.<br />
This partnership is of great importance to the achiev<strong>em</strong>ent of Jones<br />
Lang LaSalle Hotels' objective to enhance and improve the sampl<strong>in</strong>g<br />
<strong>in</strong>formation, thus mak<strong>in</strong>g the research more comprehensive<br />
and reliable.<br />
The purpose of this report is to provide a performance analysis of<br />
hotels and condo hotels <strong>in</strong> Brazil, highlight<strong>in</strong>g average operat<strong>in</strong>g<br />
revenues and expenses. This report serves as a reference and<br />
benchmark<strong>in</strong>g tool for hotels and condo hotels, especially dur<strong>in</strong>g<br />
the budget<strong>in</strong>g process. The analysis <strong>in</strong> this report was prepared<br />
<strong>in</strong>dependently by Jones Lang LaSalle Hotels and the underly<strong>in</strong>g data<br />
is kept confidentially by the firm.<br />
We would like to thank all participat<strong>in</strong>g hotels, condo hotels and<br />
resorts which, with the direct participation of <strong>FOHB</strong>, contributed to<br />
yet another <strong>in</strong>crease <strong>in</strong> our sample size <strong>in</strong> relation to last year,<br />
mak<strong>in</strong>g it the largest sample s<strong>in</strong>ce the survey’s <strong>in</strong>ception 19 years<br />
ago. We thank the respondents for submitt<strong>in</strong>g valuable <strong>in</strong>formation<br />
which enables Jones Lang LaSalle Hotels to present hotel managers<br />
and developers with a better understand<strong>in</strong>g of the Brazilian hospitality<br />
<strong>in</strong>dustry through reliable statistical parameters.<br />
If you wish to receive an electronic copy of this report,<br />
please contact us at jllh.brasil@am.jll.com.<br />
Ricardo Mader and Manuela Gorni<br />
Jones Lang LaSalle Hotels<br />
Dear reader,<br />
The Brazilian Forum of Hotel Operators (<strong>FOHB</strong>) was formed <strong>in</strong> 2002<br />
and its mission is to work towards the development of associated<br />
hotel cha<strong>in</strong>s and their <strong>in</strong>vestors, partners, guests and <strong>em</strong>ployees,<br />
along with public and private sectors, foster<strong>in</strong>g discussions relevant<br />
to the sector and the hospitality <strong>in</strong>dustry <strong>in</strong> general.<br />
For <strong>FOHB</strong>, shar<strong>in</strong>g market data is extr<strong>em</strong>ely important and we<br />
are confident that the susta<strong>in</strong>able development of the sector is<br />
made through good partnerships that provide critical and reliable<br />
<strong>in</strong>formation <strong>in</strong> the decision-mak<strong>in</strong>g process on new <strong>in</strong>vestments.<br />
Therefore, we rely on the professionalism of Jones Lang LaSalle<br />
Hotels, which each year publishes its study <strong>Lodg<strong>in</strong>g</strong> <strong>Industry</strong> <strong>in</strong><br />
Numbers – Brazil, which is of <strong>in</strong>tegral importance for our segment.<br />
We are delighted to have contributed to the completion of another<br />
issue.<br />
May our partnership strengthen each year.<br />
Enjoy your read<strong>in</strong>g<br />
Roberto Rotter<br />
<strong>FOHB</strong> - President
4 <strong>Hotelaria</strong> <strong>em</strong> <strong>Números</strong> – <strong>Brasil</strong> <strong>2012</strong> | <strong>Lodg<strong>in</strong>g</strong> <strong>Industry</strong> <strong>in</strong> Numbers – Brazil <strong>2012</strong><br />
Índice | Table of contents<br />
Prefácio.....................................................................................................3<br />
Foreword<br />
Perspectiva...............................................................................................5<br />
Outlook<br />
Histórico da performance – hotéis urbanos..........................................6<br />
Historic performance – city hotels<br />
Oferta hoteleira existente no <strong>Brasil</strong>........................................................7<br />
Exist<strong>in</strong>g hotel supply <strong>in</strong> Brazil<br />
Rank<strong>in</strong>g das marcas hoteleiras..............................................................8<br />
Rank<strong>in</strong>g of hotel brands<br />
Rank<strong>in</strong>g das adm<strong>in</strong>istradoras hoteleiras...............................................9<br />
Rank<strong>in</strong>g of hotel manag<strong>em</strong>ent companies<br />
Performance dos hotéis urbanos <strong>em</strong> 2011.........................................10<br />
City hotels performance <strong>in</strong> 2011<br />
Orig<strong>em</strong> dos hóspedes............................................................................10<br />
Orig<strong>in</strong> of guests<br />
Segmentação de d<strong>em</strong>anda........................................................................11<br />
Market mix<br />
Análise de des<strong>em</strong>penho 2011...................................................................12<br />
Analysis of 2011 performance<br />
Número de funcionários..............................................................................13<br />
Number of <strong>em</strong>ployees<br />
Análise dos resultados 2011 – hotéis.......................................................14<br />
Operat<strong>in</strong>g profit analysis 2011 – hotels<br />
Análise dos departamentos operacionais 2011 – hotéis......................15<br />
Analysis of operat<strong>in</strong>g departments 2011 – hotels<br />
Análise dos resultados 2011 – flats..........................................................16<br />
Operat<strong>in</strong>g profit analysis 2011 – condo hotels<br />
Análise dos resultados 2011 - resorts......................................................17<br />
Operat<strong>in</strong>g profit analysis 2011 - resorts<br />
Glossário de termos....................................................................................18<br />
Glossary
Perspectiva Outlook<br />
As pr<strong>in</strong>cipais conclusões obtidas nesta pesquisa são:<br />
• O crescimento da taxa de ocupação dos hotéis urbanos <strong>em</strong><br />
2011 com relação a 2010 foi de 2,2%, acompanhando a taxa de<br />
crescimento do PIB do país neste ano;<br />
• Com a média de ocupação perto dos 70%, os hotéis urbanos<br />
(hotéis e flats) puderam aprofundar o processo de recuperação das<br />
diárias, acima dos níveis dos últimos anos. A diária média destes<br />
hotéis cresceu 17,2% <strong>em</strong> 2011 <strong>em</strong> relação a 2010;<br />
• Como consequência, o REVPAR dos hotéis urbanos apresentou<br />
um crescimento recorde de 20,5%;<br />
• O lucro Operacional Bruto (GOP) dos hotéis foi de 36,5% <strong>em</strong> 2011,<br />
at<strong>in</strong>g<strong>in</strong>do um patamar histórico;<br />
• Desta forma, o crescimento da performance da <strong>in</strong>dústria foi<br />
significativamente acima da apresentada pela economia <strong>Brasil</strong>eira<br />
como um todo. O desequilíbrio entre oferta e d<strong>em</strong>anda, cont<strong>in</strong>ua<br />
afetando positivamente o des<strong>em</strong>penho dos hotéis do país;<br />
• Entre as categorias de hotéis urbanos, a que apresentou um<br />
maior crescimento na sua performance <strong>em</strong> 2011 foi a dos hotéis<br />
superiores com um <strong>in</strong>cr<strong>em</strong>ento de 20,8% no REVPAR;<br />
• Os flats urbanos, a maioria classificado na categoria superior,<br />
apresentou um crescimento a<strong>in</strong>da mais significativo de 24,4% do<br />
REVPAR;<br />
• À medida que a renda per capita do país cresce, o consumo<br />
de viagens de lazer aumenta beneficiando a performance dos<br />
Resorts. Este segmento apresentou uma excelente recuperação<br />
<strong>em</strong> 2011, at<strong>in</strong>g<strong>in</strong>do 50% de ocupação e R$683 de Receìta Total por<br />
apartamento ocupado.<br />
Perspectivas:<br />
• Apesar da d<strong>em</strong>anda hoteleira não estar crescendo <strong>em</strong> <strong>2012</strong> de<br />
acordo com o projetado nos orçamentos dos hotéis, o des<strong>em</strong>penho<br />
da <strong>in</strong>dústria cont<strong>in</strong>ua positivo;<br />
• Segundo análise mercadológica do <strong>FOHB</strong>, os dados acumulados<br />
dos primeiros c<strong>in</strong>co meses do ano <strong>in</strong>dicam que a taxa de ocupação<br />
<strong>em</strong> <strong>2012</strong> está um pouco abaixo da de 2011. No entanto, a diária<br />
média cont<strong>in</strong>ua a apresentar um alto nível de crescimento, de<br />
aproximadamente 17,5%;<br />
• Mais uma vez, o des<strong>em</strong>penho dos hotéis v<strong>em</strong> sendo beneficiado<br />
pelo baixo crescimento da oferta;<br />
• Acreditamos que dentro do ano de <strong>2012</strong> e nos próximos três anos,<br />
o crescimento da oferta poderá ser significativo. Os resultados da<br />
Pesquisa da Jones Lang LaSalle Hotels ´Investimentos <strong>em</strong> Hotéis<br />
na América Lat<strong>in</strong>a´ realizada <strong>em</strong> Maio de <strong>2012</strong> junto a mais de<br />
500 <strong>in</strong>vestidores nacionais e <strong>in</strong>ternacionais, <strong>in</strong>dicam o <strong>Brasil</strong> como<br />
um dos pr<strong>in</strong>cipais países da América Lat<strong>in</strong>a onde eles pretend<strong>em</strong><br />
<strong>in</strong>vestir <strong>em</strong> hotéis;<br />
• Enquanto estes <strong>in</strong>vestimentos estão sendo analisados, o segmento<br />
de Condo Hotéis começa a se aquecer mais uma vez. Em várias<br />
grandes cidades do país, <strong>em</strong>preendimentos deste tipo começam a<br />
ser lançados no mercado;<br />
• Acreditamos que este novo ciclo de desenvolvimento de Condo<br />
Hotéis t<strong>em</strong> um baixo risco de super oferta, como aquele que<br />
ocorreu no <strong>in</strong>ício dos anos 2000, devido ao fato da economia do<br />
país estar agora mais estável e a oferta, de bons terrenos estar<br />
mais escassa;<br />
• No entanto, o fenômeno da descentralização da economia<br />
<strong>Brasil</strong>eira está abr<strong>in</strong>do oportunidades para o desenvolvimento de<br />
hotéis <strong>em</strong> cidades onde estão sendo construídos grandes projetos<br />
de <strong>in</strong>fra estrutura ou m<strong>in</strong>eração (<strong>in</strong>clu<strong>in</strong>do petróleo e gás), e que<br />
não contam com uma boa estrutura de hospedag<strong>em</strong>.<br />
<strong>Hotelaria</strong> <strong>em</strong> <strong>Números</strong> – <strong>Brasil</strong> <strong>2012</strong> | <strong>Lodg<strong>in</strong>g</strong> <strong>Industry</strong> <strong>in</strong> Numbers – Brazil <strong>2012</strong> 5<br />
Key f<strong>in</strong>d<strong>in</strong>gs of the report <strong>in</strong>clude:<br />
• Occupancy rates <strong>in</strong> Brazil marked an <strong>in</strong>crease of 2.2% <strong>in</strong> 2011<br />
compared to 2010, <strong>in</strong> l<strong>in</strong>e with the GDP growth rate for the year;<br />
• With an average occupancy close to 70%, the city hotels (hotels<br />
and condo hotels) <strong>in</strong> our sample were able to further push average<br />
daily rates above the levels recorded dur<strong>in</strong>g recent years. The<br />
average daily average rate of these hotels grew by 17.2% <strong>in</strong> 2011<br />
compared to 2010;<br />
• As a result, RevPAR of city hotels showed record growth of 20.5%;<br />
• Gross Operat<strong>in</strong>g Profit (GOP) for hotels was 36.5% <strong>in</strong> 2011,<br />
reach<strong>in</strong>g a historic high;<br />
• Thus, the <strong>in</strong>dustry’s performance growth significantly exceeded the<br />
country’s GDP growth rate as a whole. The imbalance between<br />
supply and d<strong>em</strong>and cont<strong>in</strong>ues to positively impact the performance<br />
of hotels <strong>in</strong> the country;<br />
• Of the various categories of city hotels (hotels and condo hotels),<br />
superior hotels exhibited the highest RevPAR growth rates <strong>in</strong> 2011<br />
at 20.8%;<br />
• Urban flats, the majority of which rank <strong>in</strong> the highest ADR category,<br />
posted even more significant RevPAR growth rates of 24.4%;<br />
• As the country’s per capita <strong>in</strong>come grows, consumption of leisure<br />
travel is <strong>in</strong>creas<strong>in</strong>g to boost the performance of resort properties.<br />
This segment recorded strong recovery <strong>in</strong> 2011, reach<strong>in</strong>g 50%<br />
occupancy and total revenue of R$683 per occupied room.<br />
Trends:<br />
• Operators have generally budgeted their <strong>2012</strong> performance to be <strong>in</strong><br />
l<strong>in</strong>e with 2011 results, but the performance of the <strong>in</strong>dustry r<strong>em</strong>a<strong>in</strong>s<br />
positive;<br />
• Market analysis conducted by <strong>FOHB</strong> for the first five months of<br />
<strong>2012</strong> <strong>in</strong>dicates that the occupancy rate for the period is slightly<br />
below the same prior-year period of 2011. However, average daily<br />
rates posted a high growth rate of 17.5%;<br />
• Aga<strong>in</strong>, hotel performance has been underp<strong>in</strong>ned by the low supply<br />
growth;<br />
• We expect supply growth to <strong>in</strong>crease notably <strong>in</strong> the r<strong>em</strong>a<strong>in</strong>der of<br />
<strong>2012</strong> and dur<strong>in</strong>g the next three years. The results of Jones Lang<br />
LaSalle Hotels' May <strong>2012</strong> Lat<strong>in</strong> America Hotel Investor Sentiment<br />
Survey, targeted toward more than 500 national and <strong>in</strong>ternational<br />
<strong>in</strong>vestors, <strong>in</strong>dicated Brazil as a major Lat<strong>in</strong> American <strong>in</strong>vestment<br />
target;<br />
• While these <strong>in</strong>vestments are be<strong>in</strong>g analyzed, the segment of<br />
Condo Hotels beg<strong>in</strong>s to warm up aga<strong>in</strong>. In several large cities, such<br />
ventures are beg<strong>in</strong>n<strong>in</strong>g to be launched <strong>in</strong> the market;<br />
• We believe that this expected new development cycle of Condo<br />
Hotels will be accompanied by a low risk of oversupply as<br />
compared to what occurred <strong>in</strong> the early 2000s, because of the<br />
country’s economy is now more stable and the supply of favorable<br />
land sites is scarce;<br />
• The decentralization of the Brazilian economy is open<strong>in</strong>g up<br />
opportunities for the development of hotels <strong>in</strong> cities where large<br />
<strong>in</strong>frastructure projects (such as m<strong>in</strong><strong>in</strong>g and oil and gas) are be<strong>in</strong>g<br />
built, which are currently not served by adequate quality hotel stock;<br />
• Thus, we believe that there is still great room for growth <strong>in</strong> hotel<br />
supply <strong>in</strong> the country, especially outside of Brazil’s major cities.
6 <strong>Hotelaria</strong> <strong>em</strong> <strong>Números</strong> – <strong>Brasil</strong> <strong>2012</strong> | <strong>Lodg<strong>in</strong>g</strong> <strong>Industry</strong> <strong>in</strong> Numbers – Brazil <strong>2012</strong><br />
Histórico da performance –<br />
hotéis urbanos<br />
Os quadros abaixo apresentam um histórico da performance dos<br />
hotéis urbanos (hotéis e flats) nos últimos anos.<br />
Ocupação | Room occupancy<br />
Ano | Year<br />
2003<br />
Hotéis urbanos (hotéis & flats) |<br />
City hotels (hotels & condo hotels)<br />
52.0%<br />
Variação | Change<br />
2004 55.0% 5.8%<br />
2005 60.0% 9.1%<br />
2006 58.0% -3.3%<br />
2007 63.0% 8.6%<br />
2008 65.0% 3.2%<br />
2009 63.0% -3.1%<br />
2010 68.0% 7.9%<br />
2011 69.5% 2.2%<br />
Fonte | Source: Jones Lang LaSalle Hotels<br />
RevPAR (R$)<br />
Ano | Year<br />
2003<br />
Hotéis urbanos (hotéis & flats) |<br />
City hotels (hotels & condo hotels)<br />
72.0<br />
Variação | Change<br />
2004 68.0 -5.6%<br />
2005 78.0 14.7%<br />
2006 82.0 5.1%<br />
2007 93.0 13.4%<br />
2008 99.0 6.5%<br />
2009 104.0 5.1%<br />
2010 122.0 17.3%<br />
2011 147.0 20.5%<br />
Fonte | Source: Jones Lang LaSalle Hotels<br />
Historic performance –<br />
city hotels<br />
The follow<strong>in</strong>g tables show the performance of city hotels (hotels and<br />
condo hotels) over the past years.<br />
Diária média (R$) | Average daily rate (R$)<br />
Ano | Year<br />
2003<br />
Hotéis urbanos (hotéis & flats) |<br />
City hotels (hotels & condo hotels)<br />
138.0<br />
Variação | Change<br />
2004 124.0 -10.1%<br />
2005 131.0 5.6%<br />
2006 140.0 6.9%<br />
2007 148.0 5.7%<br />
2008 153.0 3.4%<br />
2009 165.0 7.8%<br />
2010 180.0 9.1%<br />
2011 211.0 17.2%<br />
Fonte | Source: Jones Lang LaSalle Hotels<br />
Hotéis urbanos performance | City hotels performance<br />
R$<br />
$250<br />
$200 70%<br />
$150 60%<br />
$100 50%<br />
$50 40%<br />
$0<br />
2003 2004 2005 2006 2007 2008 2009 2010<br />
Average daily rate (R$) RevPAR (R$) Room Occupancy<br />
Fonte | Source: Jones Lang LaSalle Hotels<br />
2011<br />
80%<br />
30%<br />
Ocupação Occupancy
Oferta hoteleira existente<br />
no <strong>Brasil</strong><br />
O capítulo a seguir apresenta o resultado de uma pesquisa<br />
elaborada pela Jones Lang LaSalle Hotels sobre a oferta hoteleira<br />
existente no <strong>Brasil</strong>, <strong>in</strong>clu<strong>in</strong>do o total de hotéis e flats adm<strong>in</strong>istrados<br />
por cadeias hoteleiras nacionais e <strong>in</strong>ternacionais e o rank<strong>in</strong>g das<br />
marcas hoteleiras e adm<strong>in</strong>istradoras presentes no país.<br />
Total de hotéis no <strong>Brasil</strong><br />
Para a estimativa do total de hotéis no <strong>Brasil</strong>, utilizamos como base<br />
o nosso banco de dados e <strong>in</strong>formações obtidas do site Hotel On<br />
L<strong>in</strong>e, Guia Quatro Rodas e "Pesquisa de Serviços de Hospedag<strong>em</strong><br />
– 2011" do IBGE. Para tanto, identificamos os hotéis que são<br />
adm<strong>in</strong>istrados por cadeias hoteleiras nacionais e <strong>in</strong>ternacionais<br />
e fiz<strong>em</strong>os uma estimativa dos hotéis <strong>in</strong>dependentes. Os hotéis<br />
pertencentes a cadeias hoteleiras nacionais com menos de 600<br />
quartos também foram considerados como hotéis <strong>in</strong>dependentes.<br />
O percentual de <strong>em</strong>preendimentos afiliados a cadeias hoteleiras<br />
a<strong>in</strong>da é pequeno <strong>em</strong> número de hotéis (7,9%), mas <strong>em</strong> número de<br />
apartamentos é mais representativo, chegando a 27,1% do total de<br />
apartamentos disponíveis no <strong>Brasil</strong>.<br />
Total de hotéis e flats no <strong>Brasil</strong> 1 | Total number of hotels and condo hotels <strong>in</strong> Brazil 1<br />
<strong>Hotelaria</strong> <strong>em</strong> <strong>Números</strong> – <strong>Brasil</strong> <strong>2012</strong> | <strong>Lodg<strong>in</strong>g</strong> <strong>Industry</strong> <strong>in</strong> Numbers – Brazil <strong>2012</strong> 7<br />
Exist<strong>in</strong>g hotel supply <strong>in</strong> Brazil<br />
This section presents research prepared by Jones Lang LaSalle<br />
Hotels about the exist<strong>in</strong>g hotel supply <strong>in</strong> Brazil, <strong>in</strong>clud<strong>in</strong>g the<br />
total number of hotels and condo-hotels managed by national<br />
and <strong>in</strong>ternational cha<strong>in</strong>s and the rank<strong>in</strong>g of the hotel brands and<br />
manag<strong>em</strong>ent companies.<br />
Total number of hotels <strong>in</strong> Brazil<br />
Us<strong>in</strong>g our <strong>in</strong>ternal database and the hotels database on the website<br />
Hotel On L<strong>in</strong>e, Guia 4 Rodas and "Pesquisa de Serviços de<br />
Hospedag<strong>em</strong>" prepared by IBGE, we identified the hotels that are<br />
managed by national or <strong>in</strong>ternational hotel cha<strong>in</strong>s and estimated the<br />
<strong>in</strong>dependent hotels. Hotels managed by national cha<strong>in</strong>s with fewer<br />
than 600 rooms <strong>in</strong> the entire syst<strong>em</strong> were classified as <strong>in</strong>dependent<br />
hotels.<br />
Tipo | Property Type Hotéis | Hotels % Quartos | Rooms %<br />
Hotéis e flats de cadeias nacionais | Hotel and condo hotel national cha<strong>in</strong>s 361 3.8% 52,640 11.6%<br />
Hotéis e flats de cadeias <strong>in</strong>ternacionais | Hotel and condo hotel <strong>in</strong>ternational cha<strong>in</strong>s 392 4.1% 70,229 15.5%<br />
Hotéis <strong>in</strong>dependentes com até 20 qtos | Independent hotels up to 20 rooms 3,489 36.4% 38,545 8.5%<br />
Hotéis <strong>in</strong>dependentes com mais de 20 qtos | Independent hotels with more than 20 rooms 5,350 55.8% 291,433 64.4%<br />
1 Inclui hotéis e flats <strong>in</strong>augurados até julho de <strong>2012</strong> | Includes exist<strong>in</strong>g hotels and condo hotels as of July <strong>2012</strong><br />
Fonte | Source: Jones Lang LaSalle Hotels<br />
Estoque de hotéis e flats no <strong>Brasil</strong> | Hotel and condo hotel stock<br />
<strong>in</strong> Brazil<br />
56%<br />
Hotéis e flats de cadeias nacionais | Hotel and condo hotel national cha<strong>in</strong>s<br />
Hotéis e flats de cadeias <strong>in</strong>ternacionais | Hotel and condo hotel <strong>in</strong>ternational cha<strong>in</strong>s<br />
Hotéis <strong>in</strong>dependentes com até 20 qtos | Independent hotels up to 20 rooms<br />
Hotéis <strong>in</strong>dependentes com mais de 20 qtos | Independent hotels with more than 20 rooms<br />
Fonte | Source: Jones Lang LaSalle Hotels<br />
4%<br />
4%<br />
36%<br />
Total 9,592 100.0% 452,847 100.0%<br />
Estoque de quartos no <strong>Brasil</strong> | Room stock <strong>in</strong> Brazil<br />
64%<br />
Hotéis e flats de cadeias nacionais | Hotel and condo hotel national cha<strong>in</strong>s<br />
Hotéis e flats de cadeias <strong>in</strong>ternacionais | Hotel and condo hotel <strong>in</strong>ternational cha<strong>in</strong>s<br />
Hotéis <strong>in</strong>dependentes com até 20 qtos | Independent hotels up to 20 rooms<br />
Hotéis <strong>in</strong>dependentes com mais de 20 qtos | Independent hotels with more than 20 rooms<br />
Fonte | Source: Jones Lang LaSalle Hotels<br />
12%<br />
15%<br />
9%
8 <strong>Hotelaria</strong> <strong>em</strong> <strong>Números</strong> – <strong>Brasil</strong> <strong>2012</strong> | <strong>Lodg<strong>in</strong>g</strong> <strong>Industry</strong> <strong>in</strong> Numbers – Brazil <strong>2012</strong><br />
Rank<strong>in</strong>g das marcas hoteleiras Rank<strong>in</strong>g of hotel brands<br />
Rank<strong>in</strong>g das marcas hoteleiras 1 | Rank<strong>in</strong>g of hotel brands 1<br />
<strong>2012</strong> Marcas | Brands Número de quartos | Number of rooms Número de hotéis | Number of hotels<br />
1 Accor 25,081 152<br />
2 Choice 9,179 60<br />
3 Louvre Hotels 7,162 39<br />
4 Blue Tree 4,492 24<br />
5 Transamérica 4,447 22<br />
6 Nacional Inn 4,068 35<br />
7 W<strong>in</strong>dsor 2,876 11<br />
8 Bourbon 2,771 12<br />
9 IHG 2,707 12<br />
10 Wyndham 2,636 14<br />
11 Slaviero 2,543 19<br />
12 Othon 2,446 16<br />
13 Posadas 2,111 11<br />
14 Carlson 2,060 9<br />
15 Vila Galé 2,040 6<br />
16 Intercity 1,712 13<br />
17 Estanplaza 1,650 12<br />
18 Starwood 1,639 6<br />
19 Best Western 1,615 17<br />
20 Bristol <strong>Hotelaria</strong> 1,582 14<br />
21 Sauípe 1,564 6<br />
22 Pestana 1,520 9<br />
23 Rede Brístol 1,515 15<br />
24 Travel Inn 1,337 19<br />
25 Marriott 1,245 5<br />
26 Promenade 1,230 14<br />
27 Nobile 1,192 11<br />
28 Deville 1,168 8<br />
29 Iberostar 1,168 2<br />
30 Master Hotéis 1,161 10<br />
31 Solare 1,131 4<br />
32 Rio Quente Resorts 1,076 7<br />
33 Sol Express 1,027 5<br />
34 Plaza Inn 1,011 12<br />
35 Rede Plaza 982 6<br />
36 Club Med 908 3<br />
37 Tropical 864 3<br />
38 <strong>Hotelaria</strong> <strong>Brasil</strong> 863 6<br />
39 Meliá 856 3<br />
40 Hilton 848 2<br />
41 Tauá 841 3<br />
42 Arco Hotel 801 9<br />
43 Harbor 797 10<br />
44 Golden Dolph<strong>in</strong> 746 2<br />
45 Mabu 688 4<br />
46 Royal Palm 662 4<br />
47 Bittar 656 6<br />
48 Fiesta Hoteles 654 1<br />
49 Pontes Hotéis 650 3<br />
50 Serhs 547 3<br />
1 Inclui hotéis e flats <strong>in</strong>augurados até julho de <strong>2012</strong> | 1 Includes exist<strong>in</strong>g hotels and condo hotels as of July <strong>2012</strong><br />
Fonte | Source: Jones Lang LaSalle Hotels
Rank<strong>in</strong>g das<br />
adm<strong>in</strong>istradoras hoteleiras<br />
<strong>Hotelaria</strong> <strong>em</strong> <strong>Números</strong> – <strong>Brasil</strong> <strong>2012</strong> | <strong>Lodg<strong>in</strong>g</strong> <strong>Industry</strong> <strong>in</strong> Numbers – Brazil <strong>2012</strong> 9<br />
Rank<strong>in</strong>g of hotel<br />
manag<strong>em</strong>ent companies<br />
Rank<strong>in</strong>g das adm<strong>in</strong>istradoras hoteleiras que atuam no <strong>Brasil</strong> 1 | Rank<strong>in</strong>g of hotel manag<strong>em</strong>ent companies <strong>in</strong> Brazil 1<br />
<strong>2012</strong> Adm<strong>in</strong>istradora hoteleira |<br />
Hotel manag<strong>em</strong>ent company<br />
Número de quartos | Number of rooms Número de hotéis | Number of hotels<br />
1 Accor 22,431 130<br />
2 Atlantica 12,675 75<br />
3 BHG Brazil Hospitality Group 8,822 48<br />
4 Blue Tree 4,492 24<br />
5 Transamérica 4,447 22<br />
6 Nacional Inn 4,068 35<br />
7 W<strong>in</strong>dsor 2,876 11<br />
8 Meliá Hotels 2,863 12<br />
9 Bourbon 2,771 12<br />
10 Allia Hotels 2,694 28<br />
11 Hotéis Slaviero 2,543 19<br />
12 Othon 2,446 16<br />
13 Intercity 2,405 18<br />
14 Posadas 2,111 11<br />
15 Vila Galé 2,040 6<br />
16 IHG 1,944 6<br />
17 Nobile 1,699 14<br />
18 Estanplaza 1,650 12<br />
19 Bristol <strong>Hotelaria</strong> 1,582 14<br />
20 Sauípe 1,564 6<br />
21 Átrio 1,552 12<br />
22 Pestana 1,520 9<br />
23 Deville 1,482 9<br />
24 Travel Inn 1,337 19<br />
25 Master Hotéis 1,333 11<br />
26 GJP 1,271 9<br />
27 Promenade 1,230 14<br />
28 Iberostar 1,168 2<br />
29 Starwood 1,167 4<br />
30 Rio Quente Resorts 1,076 7<br />
31 Sol Express 1,027 5<br />
32 Rede Plaza 982 6<br />
33 <strong>Hotelaria</strong> <strong>Brasil</strong> 966 7<br />
34 Marriott 931 4<br />
35 Club Med 908 3<br />
36 Tropical 864 3<br />
37 Hilton 848 2<br />
38 Tauá 841 3<br />
39 Arco Hotel 801 9<br />
40 Harbor 797 10<br />
41 Rede Atlantico 741 5<br />
42 Mabu Hotéis 688 4<br />
43 Royal Palm 662 4<br />
44 Bittar 656 6<br />
45 Fiesta Hoteles 654 1<br />
46 Pontes Hotéis 650 3<br />
47 Hotéis Arco 642 6<br />
48 Cont<strong>in</strong>ental 639 4<br />
49 Astron 623 6<br />
50 Serhs 547 3<br />
1 Inclui hotéis e flats <strong>in</strong>augurados até julho de <strong>2012</strong> | 1 Includes exist<strong>in</strong>g hotels and condo hotels as of July <strong>2012</strong><br />
Fonte | Source: Jones Lang LaSalle Hotels
10 <strong>Hotelaria</strong> <strong>em</strong> <strong>Números</strong> – <strong>Brasil</strong> <strong>2012</strong> | <strong>Lodg<strong>in</strong>g</strong> <strong>Industry</strong> <strong>in</strong> Numbers – Brazil <strong>2012</strong><br />
Hotéis urbanos<br />
performance <strong>em</strong> 2011<br />
A tabela abaixo apresenta a performance dos hotéis urbanos (hotéis<br />
+ flats) <strong>em</strong> 2011.<br />
Performance <strong>em</strong> 2011 | Performance <strong>in</strong> 2011<br />
Orig<strong>em</strong> dos hóspedes<br />
O percentual de hóspedes estrangeiros <strong>em</strong> 2011 no total da<br />
amostrag<strong>em</strong> de hotéis foi de 15,6%. A maior concentração encontrase<br />
nos hotéis de cidade com diária média acima de R$ 330, onde<br />
39,7% dos hóspedes são estrangeiros. Em 2011, o <strong>Brasil</strong> recebeu 5,4<br />
milhões de visitantes estrangeiros, cerca de 5,8% a mais do que <strong>em</strong><br />
2010.<br />
Orig<strong>em</strong> dos hóspedes 2011 | Orig<strong>in</strong> of guests 2011<br />
100%<br />
80%<br />
60%<br />
40%<br />
20%<br />
0%<br />
Diária média acima de | Diária média entre | Diária média abaixo de | Total hotéis urbanos |<br />
Average rate Average rate between Average rate below Total city hotels<br />
above R$330 R$190 - R$330<br />
R$190<br />
Fonte | Source: Jones Lang LaSalle Hotels<br />
<strong>Brasil</strong>eiros | Brazilians Estrangeiros | Foreigners<br />
City hotels<br />
performance <strong>in</strong> 2011<br />
The table below presents the performance of city hotels (hotels and<br />
condo hotels) <strong>in</strong> 2011.<br />
Hotéis urbanos (hotéis & flats) | City hotels (hotels & condo hotels) Média hotéis |<br />
Diária média acima de |<br />
Diária média entre |<br />
Diária média abaixo de |<br />
Hotels average<br />
Average rate above R$330 Average rate between R$190 - R$330 Average rate below R$190<br />
Diária média (R$) | Average rate (R$) R$ 431 R$ 241 R$ 142 R$ 211<br />
Ocupação anual | Occupancy rate 65.8% 67.8% 72.3% 69.5%<br />
Fonte | Source: Jones Lang LaSalle Hotels<br />
RevPAR (R$) R$ 284 R$ 163 R$ 103 R$ 147<br />
Orig<strong>em</strong> dos hóspedes 2011 | Orig<strong>in</strong> of guests 2011<br />
<strong>Brasil</strong>eiros | Brazilians<br />
Estrangeiros | Foreigners<br />
Fonte | Source: Jones Lang LaSalle Hotels<br />
Orig<strong>in</strong> of guests<br />
The percentage of <strong>in</strong>ternational guests <strong>in</strong> 2011 <strong>in</strong> our hotel sample<br />
was 15.6%. The largest concentration is <strong>in</strong> the city hotels with<br />
average rates above R$ 330, where 39.7% of the guests are<br />
foreigners. In 2011 Brazil received 5.4 million <strong>in</strong>ternational visitors, a<br />
rise of 5.8% on 2010 levels.<br />
Hotéis urbanos (hotéis & flats) | City hotels (hotels & condo hotels) Total hotéis urbanos |<br />
Diária média acima de |<br />
Diária média entre |<br />
Diária média abaixo de |<br />
Total city hotels<br />
Average rate above R$330 Average rate between R$190 - R$330 Average rate below R$190<br />
60.3% 81.8% 90.8% 84.4%<br />
39.7% 18.2% 9.2% 15.6%<br />
Total 100.0% 100.0% 100.0% 100.0%
Segmentação de d<strong>em</strong>anda Market mix<br />
Os pr<strong>in</strong>cipais segmentos de d<strong>em</strong>anda hoteleira no <strong>Brasil</strong> são:<br />
comercial, turistas e grupos de eventos. Dependendo do tipo do<br />
hotel, a participação percentual de cada um desses segmentos varia<br />
consideravelmente.<br />
Segmentação da d<strong>em</strong>anda 2011 | Market mix <strong>in</strong> 2011<br />
Segmento | Segment<br />
<strong>Hotelaria</strong> <strong>em</strong> <strong>Números</strong> – <strong>Brasil</strong> <strong>2012</strong> | <strong>Lodg<strong>in</strong>g</strong> <strong>Industry</strong> <strong>in</strong> Numbers – Brazil <strong>2012</strong> 11<br />
The ma<strong>in</strong> segments of hotel d<strong>em</strong>and <strong>in</strong> Brazil are corporate travelers,<br />
tourists and groups. The percentage of these segments varies<br />
accord<strong>in</strong>g to hotel category and region of the country.<br />
Hotéis urbanos (hotéis & flats) | City hotels (hotels & condo hotels) Total hotéis urbanos |<br />
Diária média acima de |<br />
Diária média entre |<br />
Diária média abaixo de |<br />
Total city hotels<br />
Average rate above R$330 Average rate between R$190 -<br />
R$330<br />
Average rate below R$190<br />
Comercial corporate | Corporate rates 46.5% 52.3% 54.9% 53.1%<br />
Individual | Transient bus<strong>in</strong>ess/leisure 22.7% 22.1% 20.3% 21.3%<br />
Turistas operadoras | Tour operators 15.3% 8.2% 11.0% 9.8%<br />
Grupos de eventos | Groups 9.2% 9.7% 7.8% 8.9%<br />
Fonte | Source: Jones Lang LaSalle Hotels<br />
Tripulação | Crew 4.8% 2.0% 3.0% 2.6%<br />
Outros | Other 1.6% 5.7% 3.0% 4.3%<br />
Total 100.0% 100.0% 100.0% 100.0%<br />
<strong>Brasil</strong>: segmentação da d<strong>em</strong>anda 2011 | Brazil market mix 2011<br />
% do hóspedes | % of guests<br />
60%<br />
80%<br />
60%<br />
40%<br />
20%<br />
0%<br />
Diária média acima de | Diária média entre | Diária média abaixo de | Hotéis urbanos média |<br />
Average rate Average rate between Average rate below City hotels average<br />
above R$330 R$190 - R$330<br />
R$190<br />
Comercial corporate | Corporate rates<br />
Turistas operadoras | Tour operators<br />
Tripulação | Crew<br />
Fonte | Source: Jones Lang LaSalle Hotels<br />
Individual | Transient bus<strong>in</strong>ess/leisure<br />
Grupos de eventos | Groups<br />
Outros | Other
12 <strong>Hotelaria</strong> <strong>em</strong> <strong>Números</strong> – <strong>Brasil</strong> <strong>2012</strong> | <strong>Lodg<strong>in</strong>g</strong> <strong>Industry</strong> <strong>in</strong> Numbers – Brazil <strong>2012</strong><br />
Análise de des<strong>em</strong>penho 2011 Analysis of 2011 performance<br />
Os dados da análise de des<strong>em</strong>penho são apresentados <strong>em</strong> Reais<br />
e os índices representam os pr<strong>in</strong>cipais <strong>in</strong>dicadores utilizados na<br />
hotelaria atualmente. Tanto esses índices quanto os d<strong>em</strong>ais termos<br />
apresentados nesta publicação encontram-se descritos no Glossário.<br />
A<strong>in</strong>da, as análises de receitas e despesas foram classificadas de<br />
acordo com o “Sist<strong>em</strong>a Uniforme de Contabilidade para Hotéis”.<br />
Para efeito dessas análises a amostrag<strong>em</strong> foi dividida <strong>em</strong> Hotéis,<br />
Resorts e Flats, conforme descrito a seguir:<br />
Hotéis<br />
A amostrag<strong>em</strong> foi dividida de acordo com as diárias médias at<strong>in</strong>gidas<br />
pelos hotéis <strong>em</strong> 2011. Essa classificação assume que as diárias<br />
médias são um reflexo do nível de <strong>in</strong>stalações e serviços. Assim,<br />
a amostrag<strong>em</strong> foi dividida nas segu<strong>in</strong>tes categorias:<br />
• Diárias médias acima de R$330 – São considerados os hotéis<br />
de luxo, e <strong>em</strong> geral <strong>in</strong>clu<strong>em</strong> os hotéis que oferec<strong>em</strong> todas as<br />
<strong>in</strong>stalações e serviços de alto padrão. Com base na amostrag<strong>em</strong>,<br />
esses hotéis possu<strong>em</strong> uma média de 193 apartamentos.<br />
• Diárias médias entre R$190 e R$330 – São os hotéis de categoria<br />
superior. Em geral <strong>in</strong>clu<strong>em</strong> hotéis com <strong>in</strong>stalações e serviços<br />
de padrão médio, variando de três a quatro estrelas dependendo<br />
de cada mercado. Com base na amostrag<strong>em</strong>, esses hotéis<br />
possu<strong>em</strong> uma média de 197 apartamentos.<br />
• Diárias médias abaixo R$190 – São hotéis considerados<br />
econômicos e oferec<strong>em</strong> <strong>in</strong>stalações e serviços enxutos. Com<br />
base na amostrag<strong>em</strong>, esses hotéis possu<strong>em</strong> uma média de 152<br />
apartamentos.<br />
Resorts<br />
Os resorts são hotéis de praia ou campo que contam com amplas<br />
<strong>in</strong>stalações de lazer. Em geral, os resorts têm uma performance<br />
muito dist<strong>in</strong>ta <strong>em</strong> relação aos hotéis urbanos e por isso são<br />
classificados separadamente. Com base na amostrag<strong>em</strong>, esses<br />
hotéis possu<strong>em</strong> uma média de 383 apartamentos.<br />
Flats<br />
Os flats têm uma operação diferente dos hotéis, por causa do pool<br />
de locação e do condomínio, não segu<strong>in</strong>do as normas do Sist<strong>em</strong>a<br />
Uniforme de Contabilidade para Hotéis. Com base na amostrag<strong>em</strong>,<br />
os flats possu<strong>em</strong> uma média de 132 apartamentos no pool<br />
de locação.<br />
The data <strong>in</strong> the performance analysis of the hotels and condo-hotels<br />
is presented <strong>in</strong> Reais and the <strong>in</strong>dices represent the ma<strong>in</strong> <strong>in</strong>dicators<br />
used <strong>in</strong> the hotel <strong>in</strong>dustry. The performance <strong>in</strong>dices and other<br />
term<strong>in</strong>ology used <strong>in</strong> the publication are described <strong>in</strong> the Glossary.<br />
Further, all the account<strong>in</strong>g <strong>in</strong>formation is based on the Uniform<br />
Syst<strong>em</strong> of Accounts for Hotels.<br />
The data was divided <strong>in</strong>to Hotels, Resorts and Condo-Hotels as<br />
described below:<br />
Hotels<br />
The data was divided accord<strong>in</strong>g to the average rates reached <strong>in</strong> 2011.<br />
This classification assumes that the average rates correspond to the<br />
level of facilities and services. Overall, each category presents the<br />
follow<strong>in</strong>g characteristics:<br />
• Average rates above R$330 – Luxury hotels, provid<strong>in</strong>g an extensive<br />
range of facilities and high quality services. Based on the data,<br />
these hotels had an average of 193 available rooms.<br />
• Average rates between R$190 and R$330 – Superior hotels with<br />
mid-scale facilities and services, vary<strong>in</strong>g from three to four stars<br />
depend<strong>in</strong>g on the market. Based on the data, these hotels had an<br />
average of 197 available rooms.<br />
• Average rates below R$190 – Economy, limited service properties.<br />
Based on the data, these hotels had an average of 152 available<br />
rooms.<br />
Resorts<br />
Resorts are hotels located at the beach or countryside with extensive<br />
leisure facilities. In general, resorts have a very dist<strong>in</strong>ct performance<br />
compared to city hotels and therefore were classified separately.<br />
Based on the data, these hotels had an average of 383 available<br />
rooms.<br />
Condo-hotels<br />
Condo-hotels have a different operation from hotels because of the<br />
pool rental syst<strong>em</strong> and the condom<strong>in</strong>ium and do not use the Uniform<br />
Syst<strong>em</strong> of Accounts for Hotels. Based on our sample, condo-hotels<br />
have an average of 132 rooms <strong>in</strong> the rental pool syst<strong>em</strong>.
<strong>Hotelaria</strong> <strong>em</strong> <strong>Números</strong> – <strong>Brasil</strong> <strong>2012</strong> | <strong>Lodg<strong>in</strong>g</strong> <strong>Industry</strong> <strong>in</strong> Numbers – Brazil <strong>2012</strong> 13<br />
Número de funcionários Number of <strong>em</strong>ployees<br />
Para efeito do cálculo do número de funcionários, a amostrag<strong>em</strong><br />
utilizada foi dividida <strong>em</strong>:<br />
• Hotéis<br />
• Flats<br />
• Total <strong>Brasil</strong><br />
O número de funcionários varia de acordo com o tamanho e a<br />
categoria do hotel.<br />
To calculate the number of <strong>em</strong>ployees the sample was divided as<br />
follows:<br />
• Hotels<br />
• Condo hotels<br />
• Brazil average<br />
The number of <strong>em</strong>ployees depends on hotel size and category.<br />
Número de funcionários por apartamento disponível 2011 | Number of <strong>em</strong>ployees per available room 2011<br />
Departamento | Department Diária média acima de |<br />
Average rate above<br />
R$330<br />
Hotéis | Hotels<br />
Diária média entre | Diária média abaixo<br />
Flats | Condo hotels Média <strong>Brasil</strong> |<br />
Brazil average<br />
Average rate between de | Average rate<br />
R$190 - R$330 below R$190<br />
Apartamentos | Rooms 0.31 0.20 0.18 0.18 0.19<br />
Alimentos e Bebidas |<br />
Food & Beverage<br />
0.36 0.20 0.10 0.04 0.10<br />
Telefone | Telephone 0.01 0.00 0.00 0.00 0.00<br />
Outros Deptos Operacionais |<br />
M<strong>in</strong>or Operat<strong>in</strong>g Departments<br />
Adm<strong>in</strong>istração |<br />
Adm<strong>in</strong>istrative & General<br />
Market<strong>in</strong>g e Vendas |<br />
Sales & Market<strong>in</strong>g<br />
0.06 0.03 0.01 0.01 0.02<br />
0.10 0.06 0.03 0.03 0.04<br />
0.04 0.02 0.01 0.01 0.01<br />
Manutenção | Property Ma<strong>in</strong>tenance 0.06 0.04 0.02 0.02 0.02<br />
Fonte | Source: Jones Lang LaSalle Hotels<br />
Outros | Other 0.01 0.01 0.01 0.00 0.01<br />
Total 0.94 0.57 0.36 0.30 0.38
14 <strong>Hotelaria</strong> <strong>em</strong> <strong>Números</strong> – <strong>Brasil</strong> <strong>2012</strong> | <strong>Lodg<strong>in</strong>g</strong> <strong>Industry</strong> <strong>in</strong> Numbers – Brazil <strong>2012</strong><br />
Análise dos<br />
resultados 2011 – hotéis<br />
Análise dos resultados 2011 | Operat<strong>in</strong>g profit analysis 2011<br />
Departamento | Department<br />
Diária média acima de |<br />
Average rate above R$330<br />
Operat<strong>in</strong>g profit<br />
analysis 2011 – hotels<br />
Hotéis | Hotels Média hotéis |<br />
Hotels average<br />
Diária média entre | Diária média abaixo de |<br />
Average rate between<br />
R$190 - R$330<br />
Average rate below R$190<br />
Diária média (R$) | Average rate (R$) R$ 492 R$ 238 R$ 138 R$ 198<br />
Ocupação | Occupancy rate 64.9% 67.8% 73.4% 70.5%<br />
RevPAR (R$) R$ 319 R$ 161 R$ 101 R$ 139<br />
Receitas operacionais | Revenues R$ % R$ % R$ % R$ %<br />
Total receitas de apartamentos |<br />
Total rooms revenues<br />
109,698 68.5% 56,911 70.6% 34,988 76.2% 46,209 72.8%<br />
Alimentos | Food 27,247 17.0% 13,258 16.5% 6,900 15.0% 10,089 15.9%<br />
Bebidas | Beverage 6,292 3.9% 2,881 3.6% 1,485 3.2% 2,202 3.5%<br />
Outras receitas A&B |<br />
Other F&B revenues<br />
9,947 6.2% 4,059 5.0% 1,079 2.3% 2,541 4.0%<br />
Total de A&B | Total F&B 43,486 27.1% 20,198 25.1% 9,465 20.6% 14,833 23.4%<br />
Telecomunicações | Telecommunications 1,514 0.9% 294 0.4% 265 0.6% 337 0.5%<br />
Outros Deptos Operacionais |<br />
M<strong>in</strong>or Operat<strong>in</strong>g Departments<br />
Aluguéis e outras receitas (liq) |<br />
Rents and other <strong>in</strong>come (net)<br />
3,946 2.5% 1,728 2.1% 794 1.7% 1,271 2.0%<br />
1,549 1.0% 1,460 1.8% 420 0.9% 833 1.3%<br />
Receitas brutas | Gross revenue 160,194 100.0% 80,591 100.0% 45,932 100.0% 63,483 100.0%<br />
(-) Impostos e taxas | (-) Taxes 14,012 8.7% 6,553 8.1% 3,855 8.4% 5,283 8.3%<br />
Receitas líquidas | Net revenue 146,182 91.3% 74,038 91.9% 42,077 91.6% 58,200 91.7%<br />
Custos e despesas departamentais |<br />
Departmental expenses<br />
R$ % R$ % R$ % R$ %<br />
Apartamentos I Rooms 23,385 21.3% 11,921 20.9% 6,817 19.5% 9,389 20.3%<br />
Alimentos e bebidas | Food and beverage 25,343 58.3% 12,062 59.7% 6,115 64.6% 9,108 61.4%<br />
Telecomunicações | Telecommunications 497 32.8% 262 89.0% 293 110.4% 292 86.7%<br />
Outros Deptos Operacionais |<br />
M<strong>in</strong>or Operat<strong>in</strong>g Departments<br />
Total de custos e despesas |<br />
Total expenses<br />
Resultado departamental bruto |<br />
Total dept profit<br />
Despesas operacionais não distribuidas |<br />
Undistributed operat<strong>in</strong>g expenses<br />
2,022 1.3% 1,609 2.0% 730 1.6% 1,096 1.7%<br />
51,247 32.0% 25,854 32.1% 13,954 30.4% 19,885 31.3%<br />
94,935 59.3% 48,184 59.8% 28,122 61.2% 38,315 60.4%<br />
R$ % R$ % R$ % R$ %<br />
Adm<strong>in</strong>istração | Adm<strong>in</strong>istrative & general 15,018 9.4% 8,520 10.6% 4,644 10.1% 6,488 10.2%<br />
Market<strong>in</strong>g e vendas | Sales & market<strong>in</strong>g 8,145 5.1% 3,563 4.4% 1,386 3.0% 2,468 3.9%<br />
Energia I Utilities 7,707 4.8% 4,602 5.7% 2,801 6.1% 3,662 5.8%<br />
Manutenção | Property ma<strong>in</strong>tenance 5,546 3.5% 3,331 4.1% 1,781 3.9% 2,500 3.9%<br />
Resultado Operacional Bruto |<br />
Gross Operat<strong>in</strong>g Profit<br />
Fonte | Source: Jones Lang LaSalle Hotels<br />
Total 36,415 22.7% 20,016 24.8% 10,613 23.1% 15,119 23.8%<br />
58,520 36.5% 28,168 35.0% 17,510 38.1% 23,196 36.5%
Análise dos departamentos<br />
operacionais 2011 – hotéis<br />
<strong>Hotelaria</strong> <strong>em</strong> <strong>Números</strong> – <strong>Brasil</strong> <strong>2012</strong> | <strong>Lodg<strong>in</strong>g</strong> <strong>Industry</strong> <strong>in</strong> Numbers – Brazil <strong>2012</strong> 15<br />
Analysis of operat<strong>in</strong>g<br />
departments 2011 – hotels<br />
Análise dos departamentos operacionais 2011 - hotéis | Analysis of operat<strong>in</strong>g departments 2011 - hotels<br />
R$ por apartamento disponível |<br />
R$ per available room<br />
Diária média acima de |<br />
Average rate above R$330<br />
Hotéis | Hotels Média hotéis |<br />
Hotels average<br />
Diária média entre |<br />
Average rate between<br />
R$190 - R$330<br />
Diária média abaixo de |<br />
Average rate below R$190<br />
Apartamentos | Rooms R$ % R$ % R$ % R$ %<br />
Receitas | Revenues 109,698 100.0% 56,911 100.0% 34,988 100.0% 46,209 100.0%<br />
Salários e encargos | Payroll and<br />
related expenses<br />
11,220 10.2% 5,939 10.4% 3,729 10.7% 4,858 10.5%<br />
Outras despesas | Other expenses 12,165 11.1% 5,982 10.5% 3,087 8.8% 4,530 9.8%<br />
Resultado | Departmental profit 86,313 78.7% 44,990 79.1% 28,171 80.5% 36,821 79.7%<br />
Alimentos e Bebidas | Food & Beverage R$ % R$ % R$ % R$ %<br />
Receitas | Revenues 43,486 100.0% 20,198 100.0% 9,465 100.0% 14,833 100.0%<br />
Custo das vendas | Cost of sales 8,209 18.9% 4,803 23.8% 3,085 32.6% 3,928 26.5%<br />
Salários e encargos |<br />
Payroll and related expenses<br />
10,911 25.1% 5,558 27.5% 2,321 24.5% 3,858 26.0%<br />
Outras despesas | Other expenses 6,224 14.3% 1,702 8.4% 710 7.5% 1,322 8.9%<br />
Resultado | Departmental profit 18,143 41.7% 8,136 40.3% 3,350 35.4% 5,725 38.6%<br />
Telecomunicações |<br />
Telecommunications<br />
R$ % R$ % R$ % R$ %<br />
Receitas | Revenues 1,514 100.0% 294 100.0% 265 100.0% 337 100.0%<br />
Salários e encargos |<br />
Payroll and related expenses<br />
121 8.0% 30 10.3% 72 27.1% 60 17.8%<br />
Outras despesas | Other expenses 377 24.9% 232 78.9% 221 83.2% 232 69.0%<br />
Resultado | Departmental profit 1,017 67.2% 32 10.8% (27) -10.3% 44 13.2%<br />
Outros Departamentos Operacionais |<br />
M<strong>in</strong>or Operat<strong>in</strong>g Departments<br />
R$ % R$ % R$ % R$ %<br />
Receitas | Revenues 3,946 100.0% 1,728 100.0% 794 100.0% 1,271 100.0%<br />
Salários e encargos |<br />
Payroll and related Expenses<br />
429 10.9% 714 41.3% 182 23.0% 378 29.7%<br />
Outras despesas | Other expenses 1,593 82.9% 894 43.7% 548 85.1% 719 0.0%<br />
Resultado | Departmental profit 1,924 48.8% 120 6.9% 64 8.0% 174 13.7%<br />
Fonte | Source: Jones Lang LaSalle Hotels
16 <strong>Hotelaria</strong> <strong>em</strong> <strong>Números</strong> – <strong>Brasil</strong> <strong>2012</strong> | <strong>Lodg<strong>in</strong>g</strong> <strong>Industry</strong> <strong>in</strong> Numbers – Brazil <strong>2012</strong><br />
Análise dos<br />
resultados 2011 – flats<br />
Flats - receitas e despesas no pool 2011 | Condo hotels - rental pool revenues and expenses 2011<br />
R$ por apartamento disponível |<br />
R$ per available room<br />
Departamento | Department<br />
Diária média acima de |<br />
Average rate above R$330<br />
Operat<strong>in</strong>g profit<br />
analysis 2011 – condo hotels<br />
Hotéis | Hotels Média flats |<br />
Condo hotels average<br />
Diária média entre |<br />
Average rate between<br />
R$190 - R$330<br />
Diária média abaixo de |<br />
Average rate below R$190<br />
Diária média (R$) | Average rate (R$) R$ 360 R$ 244 R$ 158 R$ 232<br />
Ocupação | Occupancy rate 66.8% 67.8% 68.8% 68.0%<br />
Receitas (R$) | Revenues (R$)<br />
RevPAR (R$) R$ 241 R$ 165 R$ 109 R$ 158<br />
Apartamentos | Rooms 95,285 60,378 40,119 56,942<br />
Café da manhã | Breakfast 6,117 3,935 3,593 3,991<br />
Aluguel de salões |<br />
Meet<strong>in</strong>g rooms revenue<br />
718 1,500 831 1,248<br />
Telecomunicações | Telecommunications 109 205 292 223<br />
Diversas | Other 1,896 3,211 2,333 2,859<br />
Receita bruta | Gross revenue 104,124 69,228 47,169 65,263<br />
(-) Deduções de vendas | (-) Taxes 12,076 7,015 4,538 6,652<br />
Receita líquida | Net revenue 92,048 62,214 42,632 58,611<br />
Despesas (R$) | Expenses (R$)<br />
Taxa de condomínio |<br />
Condo ma<strong>in</strong>tenance fees<br />
Repasse de salários e encargos |<br />
Payroll & related expenses transfer<br />
Repasse de café da manhã |<br />
Breakfast transfer<br />
Contrato com terceiros |<br />
Third party contracts<br />
Comissões de vendas |<br />
Sales commissions<br />
Despesas de comercialização |<br />
Sales expenses<br />
16,591 12,159 10,062 11,862<br />
3,722 2,648 2,525 2,689<br />
5,828 3,655 3,052 3,634<br />
3,324 2,074 2,151 2,186<br />
5,145 2,921 1,985 2,806<br />
2,749 2,088 1,599 1,992<br />
Energia | Utilities 1,750 1,322 1,144 1,300<br />
IPTU | Property taxes 1,265 1,010 384 845<br />
Outras despesas | Other expenses 8,763 6,549 3,738 5,883<br />
Melhorias | Renovations 3,009 961 808 1,063<br />
Taxa de adm<strong>in</strong>istração |<br />
Manag<strong>em</strong>ent fees<br />
5,732 4,159 2,187 3,694<br />
Total das despesas | Total expenses 57,876 39,546 29,635 37,955<br />
(-) Capital de giro | (-) Work<strong>in</strong>g capital 1,372 1,763 1,075 1,533<br />
Resultado | Return to owners (R$) 32,800 20,905 11,922 19,123<br />
Fonte | Source: Jones Lang LaSalle Hotels
Análise dos<br />
resultados 2011 – resorts<br />
<strong>Hotelaria</strong> <strong>em</strong> <strong>Números</strong> – <strong>Brasil</strong> <strong>2012</strong> | <strong>Lodg<strong>in</strong>g</strong> <strong>Industry</strong> <strong>in</strong> Numbers – Brazil <strong>2012</strong> 17<br />
Operat<strong>in</strong>g profit<br />
analysis 2011 – resorts<br />
Apresentamos a seguir os resultados obtidos para resorts <strong>em</strong> 2011: Below are operat<strong>in</strong>g figures for resorts <strong>in</strong> 2011:<br />
Performance <strong>em</strong> 2011 | Performance <strong>in</strong> 2011<br />
Fonte | Source: Jones Lang LaSalle Hotels<br />
Número de funcionários por apartamento disponível 2011 |<br />
Number of <strong>em</strong>ployees per available room 2011<br />
Departamento | Department Resorts<br />
Apartamentos | Rooms<br />
Alimentos e Bebidas | Food & Beverage<br />
Telefone | Telephone<br />
Outros Deptos Operacionais | M<strong>in</strong>or Operat<strong>in</strong>g Departments<br />
Adm<strong>in</strong>istração | Adm<strong>in</strong>istrative & General<br />
0.32<br />
0.48<br />
0.01<br />
0.12<br />
0.11<br />
Market<strong>in</strong>g e Vendas | Sales and Market<strong>in</strong>g 0.05<br />
Manutenção | Property Ma<strong>in</strong>tenance 0.11<br />
Outros | Other<br />
0.03<br />
Total 1.22<br />
Os resorts apresentam maior número de funcionários por apartamento, pois contam com um número<br />
significativo de <strong>in</strong>stalações e serviços.<br />
The resorts have the greatest number of <strong>em</strong>ployees per room because they have a wide range of facilities<br />
and services.<br />
Fonte | Source: Jones Lang LaSalle Hotels<br />
Análise dos resultados 2011 | Operat<strong>in</strong>g profit analysis 2011<br />
R$ por apartamento disponível | R$ per available room Resorts<br />
Receita total por apto ocupado (R$) | Total revenue per occupied room (R$) R$ 683<br />
Ocupação | Occupancy rate 50.0%<br />
Receitas operacionais | Revenues R$ %<br />
Total receitas de apartamentos e Alimentos e Bebidas | Total rooms revenues and F&B 131,708 96.1%<br />
Fonte | Source: Jones Lang LaSalle Hotels<br />
Receita total por apto ocupado (R$) |<br />
Total revenue per occupied room (R$)<br />
Ocupação annual | Occupancy rate<br />
Resorts<br />
R$ 683<br />
50.0%<br />
Segmentação da d<strong>em</strong>anda 2011 | Market mix 2011<br />
Fonte | Source: Jones Lang LaSalle Hotels<br />
Segmento | Segment Resorts<br />
Comercial corporate | Corporate rates<br />
Individual | Transient bus<strong>in</strong>ess/leisure<br />
Turistas operadoras | Tour operators<br />
Grupos de eventos | Groups<br />
Tripulação | Crew<br />
Outros | Other<br />
Orig<strong>em</strong> dos Hóspedes 2011 | Orig<strong>in</strong> of Guests 2011<br />
Fonte | Source: Jones Lang LaSalle Hotels<br />
<strong>Brasil</strong>eiros | Brazilians<br />
Estrangeiros | Foreigners<br />
Total Outros Deptos.Operacionais | M<strong>in</strong>or Operat<strong>in</strong>g Departments 5,280 3.9%<br />
Receita bruta | Gross revenue 136,988 100.0%<br />
(-) Impostos e taxas | (-) Taxes 9,759 7.1%<br />
Receita líquida | Net revenue 127,229 92.9%<br />
Despesas (R$) | Expenses (R$) R$ %<br />
Salários e Encargos I Payroll and Related Expenses 45,367 33.1%<br />
Outras Despesas Operacionais | Other Operat<strong>in</strong>g Expenses 38,931 28.4%<br />
Despesas Adm<strong>in</strong>istrativas | Adm<strong>in</strong>istrative Expenses 8,389 6.1%<br />
Vendas e Market<strong>in</strong>g | Sales and Market<strong>in</strong>g 5,041 3.7%<br />
Manutenção | Ma<strong>in</strong>tenance 4,686 3.4%<br />
Energia | Utilities 7,092 5.2%<br />
Total de custos e despesas | Total expenses 109,506 79.9%<br />
Resultado Operacional Bruto | Gross Operat<strong>in</strong>g Profit 17,723 12.9%<br />
5.4%<br />
19.6%<br />
33.2%<br />
35.6%<br />
0.8%<br />
5.4%<br />
Total 100.0%<br />
92.9%<br />
7.1%<br />
Total 100.0%
18 <strong>Hotelaria</strong> <strong>em</strong> <strong>Números</strong> – <strong>Brasil</strong> <strong>2012</strong> | <strong>Lodg<strong>in</strong>g</strong> <strong>Industry</strong> <strong>in</strong> Numbers – Brazil <strong>2012</strong><br />
Glossário de termos Glossary<br />
A seguir apresentamos as def<strong>in</strong>ições dos termos utilizados na<br />
publicação. Esses termos foram descritos de acordo com a décima<br />
edição do Sist<strong>em</strong>a Uniforme de Contabilidade para Hotéis, publicado<br />
pela América Hotel & Motel Association.<br />
Taxa de ocupação<br />
A taxa de ocupação refere-se à média anual. A taxa é obtida<br />
divid<strong>in</strong>do-se o número total de apartamentos ocupados, exclu<strong>in</strong>do<br />
cortesias e uso da casa, pelo número de apartamentos disponíveis<br />
no ano.<br />
Diária média<br />
A diária média refere-se à média anual. A diária média é obtida<br />
divid<strong>in</strong>do-se a receita de apartamentos, já deduzido o café da<br />
manhã, pelo total de apartamentos ocupados no ano (exclu<strong>in</strong>do<br />
cortesias e uso da casa).<br />
RevPAR<br />
O RevPAR é um índice que comb<strong>in</strong>a a taxa de ocupação e a diária<br />
média, representando a receita de apartamentos por apartamento<br />
disponível. O RevPAR é obtido divid<strong>in</strong>do-se a receita de apartamentos<br />
pelo total de apartamentos disponíveis no ano. Pode-se obter o<br />
RevPAR também multiplicando-se diretamente a taxa de ocupação<br />
anual pela diária média.<br />
Receitas<br />
• Receitas de apartamentos: receita da venda de apartamentos,<br />
deduzidas as taxas de serviço, café da manhã e descontos.<br />
• Receitas de alimentos: <strong>in</strong>clu<strong>em</strong> as receitas com a venda de<br />
alimentos no restaurante, “room service”, banquete e serviços<br />
similares, além do café da manhã e bebidas como café, leite e<br />
chá.<br />
• Receitas de bebidas: receitas com a venda de bebidas<br />
alcoólicas e não alcoólicas no restaurante, bar, banquetes, room<br />
service e outros.<br />
• Outras receitas de alimentos e bebidas: <strong>in</strong>clu<strong>em</strong> aluguéis de<br />
salões e equipamentos para eventos.<br />
• Receitas de telefone: receita de telefone, fax e serviço de<br />
<strong>in</strong>ternet.<br />
• Outros departamentos operacionais: <strong>in</strong>clu<strong>em</strong> as receitas de<br />
serviços como lavanderia, bus<strong>in</strong>ess center, health club, e outros<br />
departamentos explorados.<br />
• Aluguéis e outras receitas: aluguéis de lojas e vitr<strong>in</strong>es,<br />
receitas cambiais, concessões, comissões de aluguel de carros,<br />
estacionamento, etc.<br />
The follow<strong>in</strong>g paragraphs def<strong>in</strong>e some of the terms used <strong>in</strong> this<br />
publication. These terms are <strong>in</strong> accordance with the tenth edition of<br />
the Uniform Syst<strong>em</strong> of Accounts for Hotels published by the American<br />
Hotel & Motel Association.<br />
Room occupancy<br />
Room occupancy refers to average annual room occupancy. Annual<br />
occupancy is obta<strong>in</strong>ed by divid<strong>in</strong>g total number of occupied rooms,<br />
net of complimentary and “house-use” nights, by the total number of<br />
available rooms <strong>in</strong> the year.<br />
Average rates<br />
Average rate refers to the annual average rate. The average rate is<br />
obta<strong>in</strong>ed by divid<strong>in</strong>g rooms revenue, net from breakfast, by the total<br />
number of occupied rooms <strong>in</strong> the year (net from complimentary and<br />
“house-use” nights).<br />
RevPAR<br />
RevPAR is an <strong>in</strong>dex that considers occupancy and average rate and<br />
represents the rooms revenue per available room. RevPAR equals<br />
rooms revenue divided by the total number of available rooms <strong>in</strong><br />
the year. RevPAR can also be calculated by multiply<strong>in</strong>g the average<br />
annual room occupancy by net average room rate.<br />
Revenues<br />
• Room sales: revenue from rooms rented, net of service fees,<br />
breakfast and discounts.<br />
• Food sales: <strong>in</strong>cludes the revenue derived from the sale of food<br />
<strong>in</strong> restaurants, room service, banquet and similar services, <strong>in</strong><br />
addition to breakfast, coffee, milk and tea.<br />
• Beverage sales: revenue from the sale of alcoholic and nonalcoholic<br />
beverages <strong>in</strong> restaurants, bars, banquets, room service<br />
and others.<br />
• Other food and beverage revenues: <strong>in</strong>cludes the rental of<br />
meet<strong>in</strong>g rooms and equipment.<br />
• Telecommunication revenues: revenues derived from guest use<br />
of telephone, fax and Internet service.<br />
• M<strong>in</strong>or department sales: <strong>in</strong>cludes revenues from services<br />
such as laundry, bus<strong>in</strong>ess center, health club and other operated<br />
departments.<br />
• Rentals and other <strong>in</strong>comes: rentals of stores and showcases,<br />
profits on foreign exchange, concession <strong>in</strong>comes, commissions<br />
from car rentals, park<strong>in</strong>g etc.
Custos e despesas departamentais<br />
• Apartamentos: <strong>in</strong>clu<strong>em</strong> salários e encargos da recepção,<br />
governança, reservas e portaria. Outras despesas <strong>in</strong>clu<strong>em</strong><br />
material de limpeza, lavanderia, enxoval, amenidades para<br />
hóspedes, uniformes, despesas com reservas, comissão aos<br />
agentes de viagens, tv a cabo, etc.<br />
• Alimentos e bebidas: <strong>in</strong>clu<strong>em</strong> os custos diretos de alimentos e<br />
bebidas, os salários e encargos da coz<strong>in</strong>ha, restaurantes, bares,<br />
room service e banquetes. Outras despesas <strong>in</strong>clu<strong>em</strong> louças,<br />
talheres e baixelas, cristais, enxoval de mesa, pratarias, materiais<br />
de coz<strong>in</strong>ha e restaurante, uniformes, música ambiente, menus,<br />
lavanderia etc.<br />
• Telefone: <strong>in</strong>clu<strong>em</strong> salários e encargos da telefonia, o custo das<br />
chamadas telefônicas, de fax e outras despesas relacionadas.<br />
• Outros departamentos operacionais: constitu<strong>em</strong> as despesas<br />
com salários, encargos e outras despesas relacionados com<br />
outros departamentos operados.<br />
Despesas operacionais não distribuídas<br />
• Adm<strong>in</strong>istração: representam os salários e encargos do<br />
departamento de adm<strong>in</strong>istração <strong>in</strong>clu<strong>in</strong>do a gerência,<br />
contabilidade, recursos humanos e controladoria, podendo <strong>in</strong>cluir<br />
também segurança, lazer, <strong>in</strong>formática, entre outros. Outras<br />
despesas <strong>in</strong>clu<strong>em</strong> comissões com cartão de crédito, despesas<br />
legais, seguros, viagens, material de escritório, <strong>in</strong>formática, etc.<br />
• Market<strong>in</strong>g: <strong>in</strong>clu<strong>em</strong> salários e encargos do pessoal de market<strong>in</strong>g<br />
e vendas, além das despesas com propaganda, viagens, material<br />
promocional, etc. No caso de hotéis adm<strong>in</strong>istrados por cadeias<br />
hoteleiras essas despesas pod<strong>em</strong> <strong>in</strong>cluir também taxas de<br />
market<strong>in</strong>g da cadeia.<br />
• Energia: <strong>in</strong>clui as despesas com eletricidade, água, gás e outros<br />
combustíveis.<br />
• Manutenção: <strong>in</strong>clu<strong>em</strong> salários e encargos do departamento de<br />
manutenção, e despesas com manutenção de equipamentos,<br />
<strong>in</strong>stalações, móveis, paisagismo, pisc<strong>in</strong>a, etc.<br />
Resultado operacional bruto<br />
Receita total menos os custos e despesas departamentais e as<br />
despesas operacionais não distribuídas, também conhecido como<br />
GOP.<br />
<strong>Hotelaria</strong> <strong>em</strong> <strong>Números</strong> – <strong>Brasil</strong> <strong>2012</strong> | <strong>Lodg<strong>in</strong>g</strong> <strong>Industry</strong> <strong>in</strong> Numbers – Brazil <strong>2012</strong> 19<br />
Departmental costs and expenses<br />
• Rooms: <strong>in</strong>cludes payroll and related expenses for the front desk,<br />
housekeep<strong>in</strong>g, reservations and bell staff. Other expenses <strong>in</strong>clude<br />
clean<strong>in</strong>g supplies, laundry, l<strong>in</strong>en supplies, guest amenities,<br />
uniforms, reservation expenses, travel agent commission, cable<br />
TV, among other costs and expenses.<br />
• Food and beverage: <strong>in</strong>cludes direct costs of food and beverage,<br />
payroll and related expenses of kitchen personnel, restaurants,<br />
bars, room service and banquets. Other expenses <strong>in</strong>clude ch<strong>in</strong>a,<br />
silverware, crystal ware, l<strong>in</strong>en, kitchen and restaurant supplies,<br />
uniforms, menus, laundry etc.<br />
• Telecommunications: <strong>in</strong>cludes payroll and related expenses of<br />
telephone operators, cost of calls and faxes, <strong>in</strong> addition to other<br />
related expenses.<br />
• M<strong>in</strong>or departments: <strong>in</strong>cludes expenses with payroll and related<br />
expenses, <strong>in</strong> addition to other expenses related to other operated<br />
departments.<br />
Undistributed operational expenses<br />
• Adm<strong>in</strong>istrative and general: these expenses <strong>in</strong>clude payroll and<br />
related expenses for adm<strong>in</strong>istrative <strong>em</strong>ployees such as managers,<br />
accountants and human resources personnel. Expenses related<br />
to security, leisure, <strong>in</strong>formation technology and other expenses<br />
might also be <strong>in</strong>cluded <strong>in</strong> this field. Other expenses <strong>in</strong>clude credit<br />
card commissions, legal fees, <strong>in</strong>surance, office supplies etc.<br />
• Market<strong>in</strong>g: <strong>in</strong>cludes payroll and related expenses for sales<br />
and market<strong>in</strong>g personnel, <strong>in</strong> addition to expenses related to<br />
advertis<strong>in</strong>g, travell<strong>in</strong>g, promotional supplies, etc. For hotels<br />
managed by hotel cha<strong>in</strong>s, market<strong>in</strong>g expenses might also <strong>in</strong>clude<br />
cha<strong>in</strong> related market<strong>in</strong>g expenses.<br />
• Utility: costs related to electricity, water, gas and other types of<br />
fuel.<br />
• Ma<strong>in</strong>tenance: <strong>in</strong>cludes payroll and related expenses for<br />
ma<strong>in</strong>tenance personnel, <strong>in</strong> addition to the cost of ma<strong>in</strong>ta<strong>in</strong><strong>in</strong>g the<br />
build<strong>in</strong>g, its furniture, landscape, equipment, pool etc.<br />
Gross Operat<strong>in</strong>g Product (GOP)<br />
Total revenues m<strong>in</strong>us departmental and undistributed costs and<br />
expenses.
San Francisco<br />
Los Angeles<br />
Mexico City<br />
Denver Chicago<br />
.New York<br />
Atlanta<br />
Dallas<br />
.Wash<strong>in</strong>gton, D.C<br />
Miami<br />
São Paulo<br />
Buenos Aires<br />
®<br />
Glasgow<br />
Birm<strong>in</strong>gham<br />
London<br />
Paris<br />
Barcelona<br />
Madrid<br />
Leeds<br />
Manchester<br />
Frankfurt<br />
Munich<br />
Milan<br />
Rome<br />
Moscow<br />
Istanbul<br />
New Delhi<br />
Dubai<br />
Mumbai<br />
Bangkok<br />
S<strong>in</strong>gapore<br />
Jakarta<br />
Beij<strong>in</strong>g<br />
Shanghai<br />
Perth<br />
Melbourne<br />
Escritórios dedicados Jones Lang LaSalle Hotels | Jones Lang LaSalle Hotels’ Dedicated Offices<br />
Atlanta<br />
tel: +1 404 995 2100<br />
fax: +1 404 995 2109<br />
Auckland<br />
tel: +64 9 366 1666<br />
fax: +64 9 358 5088<br />
Bangkok<br />
tel: +66 2624 6400<br />
fax: +66 2679 6519<br />
Barcelona<br />
tel: +34 93 318 5353<br />
fax: +34 93 301 2999<br />
Beij<strong>in</strong>g<br />
tel: +86 10 5922 1300<br />
fax: +86 10 5922 1346<br />
Birm<strong>in</strong>gham<br />
tel: +44 121 643 6440<br />
fax: +44 121 634 6510<br />
Brisbane<br />
tel: +61 7 3231 1400<br />
fax: +61 7 3231 1411<br />
Buenos Aires<br />
tel: +54 11 4893 2600<br />
fax: +54 11 4893 2080<br />
Chicago<br />
tel: +1 312 782 5800<br />
fax: +1 312 782 4339<br />
Dallas<br />
tel: +1 214 438 6100<br />
fax: +1 214 438 6101<br />
Denver<br />
tel: +1 303 260 6500<br />
fax: +1 303 260 6501<br />
Dubai<br />
tel: + 971 4 436 2401<br />
fax: +971 4 365 3260<br />
Frankfurt<br />
tel: +49 69 2003 0<br />
fax: +49 69 2003 1040<br />
Glasgow<br />
tel: +44 141 248 6040<br />
fax: +44 141 221 9032<br />
Istanbul<br />
tel: +90 212 350 0800<br />
fax: +90 212 350 0806<br />
Jakarta<br />
tel: +62 21 515 5665<br />
fax: +62 21 515 5666<br />
Leeds<br />
tel: +44 113 244 6440<br />
fax: +44 113 245 4664<br />
London<br />
tel: +44 20 7493 6040<br />
fax: +44 20 7399 5694<br />
Los Angeles<br />
tel: +1 213 239 6000<br />
fax: +1 213 239 6100<br />
Madrid<br />
tel: +34 91 789 1100<br />
fax: +34 91 789 1200<br />
Manchester<br />
tel: +44 161 828 6440<br />
fax: +44 161 828 6490<br />
Melbourne<br />
tel: +61 3 9672 6666<br />
fax: +61 3 9600 1715<br />
Mexico City<br />
tel: +52 55 5980 8054<br />
fax: +52 55 5202 4377<br />
Miami<br />
tel: +1 305 529 6345<br />
fax: +1 305 529 6398<br />
COPYRIGHT © JONES LANG LASALLE HOTELS <strong>2012</strong><br />
Todos os direitos reservados. As <strong>in</strong>formações desta publicação pod<strong>em</strong> ser reproduzidas, desde que citada<br />
a fonte e mediante consentimento por escrito da Jones Lang LaSalle Hotels. Este relatório é baseado <strong>em</strong><br />
fontes que consideramos confiáveis. Porém, apesar do esforço <strong>em</strong> garantir sua precisão, não pod<strong>em</strong>os<br />
oferecer garantias quanto à ausência de erros. Gostaríamos de ser <strong>in</strong>formados sobre eventuais erros para<br />
corrigi-los.<br />
Milan<br />
tel: +39 2 8586 8672<br />
fax +39 2 8586 8670<br />
Moscow<br />
tel: +7 495 737 8000<br />
fax: +7 495 737 8011<br />
Munich<br />
tel: +49 89 2900 8882<br />
fax: +49 89 2900 8888<br />
New Delhi<br />
tel: +91 124 460 5000<br />
fax: +91 124 460 5001<br />
New York<br />
tel: +1 212 812 5700<br />
fax: + 1 212 421 5640<br />
Paris<br />
tel: +33 1 4055 1718<br />
fax: +33 1 4055 1868<br />
Perth<br />
tel: +61 8 9322 5111<br />
fax: +61 8 9481 0107<br />
Rome<br />
tel: +39 6 4200 6771<br />
fax: +39 6 4200 6720<br />
Tokyo<br />
São Paulo<br />
tel: +55 11 3071 0747<br />
fax: +55 11 3071 4766<br />
San Francisco<br />
tel: +1 415 395 4900<br />
fax: +1 415 955 1150<br />
Shanghai<br />
tel: +86 21 6393 3333<br />
fax: +86 21 6133 5612<br />
S<strong>in</strong>gapore<br />
tel: +65 6536 0606<br />
fax: +65 6533 2107<br />
Sydney<br />
tel: +61 2 9220 8777<br />
fax: +61 2 9220 8765<br />
Tokyo<br />
tel: +81 3 5501 9240<br />
fax: +81 3 5501 9211<br />
Wash<strong>in</strong>gton, D.C.<br />
tel: +1 202 719 5000<br />
fax: +1 202 719 5001<br />
Brisbane<br />
Auckland<br />
Sydney<br />
COPYRIGHT © JONES LANG LASALLE HOTELS <strong>2012</strong><br />
All rights reserved. No part of this publication may be reproduced or transmitted <strong>in</strong> any form or by any<br />
means without prior written consent of Jones Lang LaSalle Hotels. It is based on material that we believe<br />
to be reliable. While every effort has been made to ensure its accuracy, we cannot offer any warranty that it<br />
conta<strong>in</strong>s no factual errors. We would like to be told of any such errors <strong>in</strong> order to correct th<strong>em</strong>.