<strong>Sinopse</strong> <strong>do</strong> <strong>Censo</strong> Demográfico <strong>2010</strong> Tabela 2.1.3 - População residente, total, urbana total e urbana na sede municipal, em números absolutos e relativos, com indicação da área total e densidade demográfica, segun<strong>do</strong> os municípios - Amazonas - <strong>2010</strong> Municípios Total Total População residente Absoluta Relativa (%) Urbana Na sede municipal Total Total Urbana Na sede municipal Área total (km²) (conclusão) Densidade demográfica (hab/km²) Juruá 10 802 5 686 5 686 100,0 52,6 52,6 19 400,7 0,56 Jutaí 17 992 10 552 10 552 100,0 58,6 58,6 69 551,9 0,26 Lábrea 37 701 24 207 24 207 100,0 64,2 64,2 68 234,0 0,55 Manacapuru 85 141 60 174 60 174 100,0 70,7 70,7 7 330,1 11,62 Manaquiri 22 801 7 062 7 062 100,0 31,0 31,0 3 975,8 5,73 Manaus 1 802 014 1 792 881 1 792 881 100,0 99,5 99,5 11 401,1 158,06 Manicoré 47 017 20 349 20 349 100,0 43,3 43,3 48 282,7 0,97 Maraã 17 528 8 753 8 753 100,0 49,9 49,9 16 910,4 1,04 Maués 52 236 25 832 25 353 100,0 49,5 48,5 39 989,9 1,31 Nhamundá 18 278 7 010 7 010 100,0 38,4 38,4 14 105,6 1,30 Nova Olinda <strong>do</strong> Norte 30 696 13 626 13 626 100,0 44,4 44,4 5 608,6 5,47 Novo Airão 14 723 9 499 9 499 100,0 64,5 64,5 37 771,3 0,39 Novo Aripuanã 21 451 14 074 14 074 100,0 65,6 65,6 41 188,5 0,52 Parintins 102 033 69 890 67 655 100,0 68,5 66,3 5 952,4 17,14 Pauini 18 166 9 264 9 264 100,0 51,0 51,0 41 610,3 0,44 Presidente Figueire<strong>do</strong> 27 175 13 001 11 097 100,0 47,8 40,8 25 422,3 1,07 Rio Preto da Eva 25 719 12 205 12 205 100,0 47,5 47,5 5 813,2 4,42 Santa Isabel <strong>do</strong> Rio Negro 18 146 6 856 6 856 100,0 37,8 37,8 62 846,4 0,29 Santo Antônio <strong>do</strong> Içá 24 481 12 947 12 947 100,0 52,9 52,9 12 307,2 1,99 São Gabriel da Cachoeira 37 896 19 054 18 205 100,0 50,3 48,0 109 183,5 0,35 São Paulo de Olivença 31 422 14 263 13 013 100,0 45,4 41,4 19 745,9 1,59 São Sebastião <strong>do</strong> Uatumã 10 705 5 904 5 904 100,0 55,2 55,2 10 741,1 1,00 Silves 8 444 4 029 4 029 100,0 47,7 47,7 3 748,8 2,25 Tabatinga 52 272 36 355 36 355 100,0 69,5 69,5 3 224,9 16,21 Tapauá 19 077 10 618 10 618 100,0 55,7 55,7 89 325,3 0,21 Tefé 61 453 50 069 50 069 100,0 81,5 81,5 23 704,5 2,59 Tonantins 17 079 8 899 8 899 100,0 52,1 52,1 6 432,7 2,66 Uarini 11 891 6 795 6 795 100,0 57,1 57,1 10 246,2 1,16 Urucará 17 094 9 886 9 886 100,0 57,8 57,8 27 903,4 0,61 Urucurituba 17 837 10 448 9 523 100,0 58,6 53,4 2 906,7 6,14 Fonte: <strong>IBGE</strong>, <strong>Censo</strong> Demográfico <strong>2010</strong>.
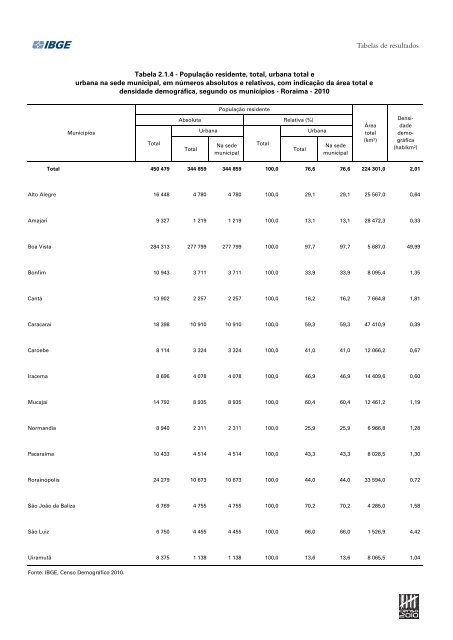
Tabelas de resulta<strong>do</strong>s Tabela 2.1.4 - População residente, total, urbana total e urbana na sede municipal, em números absolutos e relativos, com indicação da área total e densidade demográfica, segun<strong>do</strong> os municípios - Roraima - <strong>2010</strong> População residente Municípios Total Absoluta Relativa (%) Total Urbana Na sede municipal Total Total Urbana Na sede municipal Área total (km²) Densidade demográfica (hab/km²) Total 450 479 344 859 344 859 100,0 76,6 76,6 224 301,0 2,01 Alto Alegre 16 448 4 780 4 780 100,0 29,1 29,1 25 567,0 0,64 Amajari 9 327 1 219 1 219 100,0 13,1 13,1 28 472,3 0,33 Boa Vista 284 313 277 799 277 799 100,0 97,7 97,7 5 687,0 49,99 Bonfim 10 943 3 711 3 711 100,0 33,9 33,9 8 095,4 1,35 Cantá 13 902 2 257 2 257 100,0 16,2 16,2 7 664,8 1,81 Caracaraí 18 398 10 910 10 910 100,0 59,3 59,3 47 410,9 0,39 Caroebe 8 114 3 324 3 324 100,0 41,0 41,0 12 066,2 0,67 Iracema 8 696 4 078 4 078 100,0 46,9 46,9 14 409,6 0,60 Mucajaí 14 792 8 935 8 935 100,0 60,4 60,4 12 461,2 1,19 Normandia 8 940 2 311 2 311 100,0 25,9 25,9 6 966,8 1,28 Pacaraima 10 433 4 514 4 514 100,0 43,3 43,3 8 028,5 1,30 Rorainópolis 24 279 10 673 10 673 100,0 44,0 44,0 33 594,0 0,72 São João da Baliza 6 769 4 755 4 755 100,0 70,2 70,2 4 285,0 1,58 São Luiz 6 750 4 455 4 455 100,0 66,0 66,0 1 526,9 4,42 Uiramutã 8 375 1 138 1 138 100,0 13,6 13,6 8 065,5 1,04 Fonte: <strong>IBGE</strong>, <strong>Censo</strong> Demográfico <strong>2010</strong>.