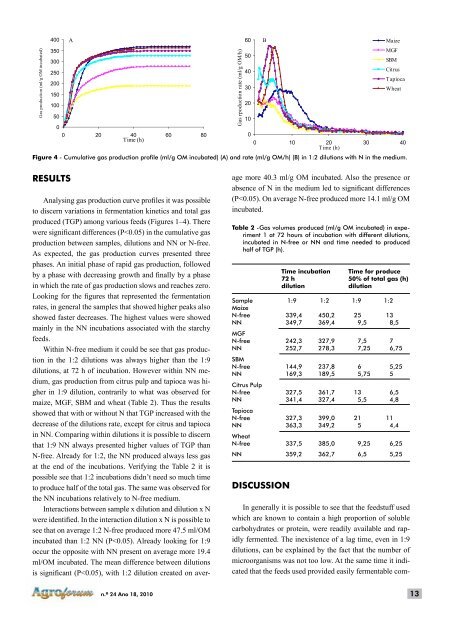
Gas production (ml/g OM incubated) 400 350 300 250 200 150 100 50 0 A 0 20 40 60 80 Time (h) Gas rpoduction rate (ml/g OM/h) 60 50 40 30 20 10 0 B Maize MGF SBM Citrus Tapioca Wheat 0 10 20 30 40 Time (h) Figure 4 - Cumulative gas production profile (ml/g OM incubated) (A) and rate (ml/g OM/h) (B) in 1:2 dilutions with N in the medium. RESULTS Analysing gas production curve profiles it was possible to discern variations in fermentation kinetics and total gas produced (TGP) among various feeds (Figures 1–4). There were significant differences (P
ponents. Groot et al. (1996) found a rapid rate of subtract digestion following incubation in the case of fermentation of soluble feedstuff components, which do not require colonization, un<strong>de</strong>r high microbial <strong>de</strong>nsities. Also the diet of the donor animals can influence the gas production profile (Cone et al., 1996). The three phases showed by gas production curves are in agreement with Groot et al. (1996) who reported, that the first phase of the curve represents the gas production caused by fermentation of the soluble fraction, in the second place the gas production caused by fermentation of the non-soluble fraction and the last part like the gas production caused by microbial turnover. Nitrogen associated with the inoculum may be insufficient to support <strong>de</strong>gradation (Mould et al., 2005). Starchy feed ingredients showed a large response to N addition, while SBM or MGF, richer in cru<strong>de</strong> protein <strong>de</strong>monstrated a response much more limited. Dryhurst and Wood (1998) reported that supplementation response to be <strong>de</strong>pen<strong>de</strong>nt on both N content of the feed and its <strong>de</strong>gradability. This is in accordance with the results, tapioca a highly <strong>de</strong>gradable substrate with a low N content, showed the greatest response to supplementation. Already for maize the inherent <strong>de</strong>gradability of this material, limited the response. The constant level of fermentation rates showed in N- free incubations may represent the level of microbial activity that can be supported by N in the RF inoculum plus the sample. In contrast, N supplemented gas production rate profiles showed consi<strong>de</strong>rably highest peaks and then a quick <strong>de</strong>cline. Groot et al. (1996) reported that a rapid <strong>de</strong>cline of the rate can occur after <strong>de</strong>pletion of the substrate component, which is most likely in the case where samples have a large amount of soluble components. For insoluble components, associated with the cell-wall fraction of substrates, the rate is more likely to <strong>de</strong>crease slowly when either chemical or structural barriers are encountered. Despite the N-free relatively to NN incubations presented rates much more limited, her constancy, sometimes, resulting at the end of the 72 hours of incubation on more gas produced. A fast or slow fermentation can be a tool for diet formulations. This higher fermentation can be regar<strong>de</strong>d as more microbial activity and so more microbial biomass being formed. The more gas achievable in 1:2 N-free relatively to 1:9 N-free can be explained by an increase on N in the medium, in addition to some increase in the OM. Greater number of microorganisms presence in 1:2 could also have influenced the results. This assumption was related by Jessop and Herrero (1998) cit. by Nagadi et al. (2000) who reported that if microbial activity is low, this would become a limiting factor and a significant proportion of <strong>de</strong>gra<strong>de</strong>d carbohydrate would be incorporated into new microbial matter rather than being fermented to products that gave rise to gas production. Krishnamoorthy et al. (1991) report a direct relation between the volume of gas produced and the microbial biomass. At first sight was expected for a greater gas production in NN, though contrary to expectations this didn’t occur. Melaku et al. (2003) suggested that this phenomenon could be due to the rapid rate of gas production leading to substrate exhaustion and limitation on the extent of gas production. Velocity of microbial growth affects the relationship between microbial growth and end products (Naga and Harmeyer, 1975). It is well established that relationship between short chain fatty acids production and microbial biomass is not a constant (Leng, 1993), the explanation for which resi<strong>de</strong>s in the variation of biomass production per unit ATP generated (Blümmel et al., 1997a). Other possibility to justify the results was found. Several authors have shown that less gas is produced from feeds high in propionate precursors relative to that in feeds high in acetate and butyrate precursors (Getachew et al., 1998; Williams, 2000). Substrates with proportionally higher gas volumes had comparatively low biomass yields (Blümmel et al., 1997a). Gas production may be used to predict in vitro microbial biomass yield if the amount of substrate truly <strong>de</strong>gra<strong>de</strong>d is known (Blümmel et al., 1997b). Despite no attempt was ma<strong>de</strong> to <strong>de</strong>termine the composition of the gas produced, there are reports that rapidly fermentable carbohydrates yield relatively higher propionate as compared to acetate, and the reverse takes place when slowly fermentable carbohydrates are incubated (Getachew et al., 1998). Such changes in volatile fatty acids pattern could arise from either a shift of biochemical pathways within the microbes present or a shift in types of microbes present (Russell et al., 1979). CONCLUSIONS It was clearly <strong>de</strong>monstrated that the gas production technique is a useful tool for predicting the fermentative capacity of the samples used. Likewise, the apparatus utilized is sensibly to the different amounts of N used in the medium. This may allow it’s utilization as an instrument to formulate rations according to the productive performance of the target animals. The results also show that the N increase in the solutions with the aim to suppress the N <strong>de</strong>ficits seems to origin different pathways in fermentation. To <strong>de</strong>termine the minimal request of N more dilutions should be investigated. As 14 n.º <strong>24</strong> Ano 18, 2010