CNC_Boletim Estatístico de 2010 - 1º Trimestre (alta ... - CNC Angola
CNC_Boletim Estatístico de 2010 - 1º Trimestre (alta ... - CNC Angola
CNC_Boletim Estatístico de 2010 - 1º Trimestre (alta ... - CNC Angola

You also want an ePaper? Increase the reach of your titles
YUMPU automatically turns print PDFs into web optimized ePapers that Google loves.
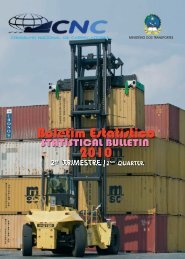
CONSELHO NACIONAL DE CARREGADORESMINISTÉRIO DOS TRANSPORTES<strong>Boletim</strong> <strong>Estatístico</strong>STATISTICAL BULLETIN<strong>2010</strong><strong>1º</strong> TRIMESTRE|1 STST QUARTER
CONSELHO NACIONAL DE CARREGADORESCENTRO DE DOCUMENTAÇÃO E INFORMAÇÃOLargo 4 <strong>de</strong> Fevereiro Palácio <strong>de</strong> Vidro 5º AndarC.P. 2223 - LUANDATEL: 222 31 13 39 - 222 31 00 97 - 222 31 18 97FAX: 222 31 00 97E-MAIL: cnc@cnc-angola.gv.aoWeb: www.cnc-angola.gv.ao<strong>Boletim</strong> <strong>Estatístico</strong><strong>2010</strong><strong>1º</strong> TRIMESTREDISTRIBUIÇÃOCentro <strong>de</strong> Documentação e InformaçãoLargo 4 <strong>de</strong> Fevereiro Palácio <strong>de</strong> Vidro 5º AndarLUANDA
ÍNDICECONTENTS5 Nota <strong>de</strong> abertura6 Produtos mais importados12 Portos <strong>de</strong> <strong>de</strong>stino16 Importação por Continente18 Principais mercados22 Maiores importadores28 Agentes Marítimos31 Analise comparativa - <strong>1º</strong> e 4º trimestre46 Conselho <strong>de</strong> Carregadores <strong>de</strong> África5 Opening note6 Most imported products12 Destination Ports16 Imports by Continent18 Most significant markets22 Major importers28 Shippers Company/Agency31 Benchmarking - 1 st and4 th Quarter46 Shippers Council of Africa
Nota <strong>de</strong> aberturaOpening noteEstimados leitores, ilustres membros da comunida<strong>de</strong>marítima e portuária, agentes económicos, fazendo jus àmáxima <strong>de</strong> que o prometido é <strong>de</strong>vido, retornamos aovosso convívio, com o reflexo <strong>de</strong> tudo aquilo que, emmatéria <strong>de</strong> mercadorias, entrou em <strong>Angola</strong>, no <strong>de</strong>cursodo primeiro trimestre <strong>de</strong> <strong>2010</strong>. ( Registados a partir dopaís <strong>de</strong> origem).Todos os dias, no âmbito das suas competências, aquie além fronteiras, o <strong>CNC</strong> emite certificados <strong>de</strong> embarquepara bens que a<strong>de</strong>ntram no nosso país, quer paraa satisfazer necessida<strong>de</strong>s <strong>de</strong> fórum privado, quer setratem <strong>de</strong> produtos <strong>de</strong>stinados à satisfação regular <strong>de</strong>necessida<strong>de</strong>s colectivas. E, com esta publicação, é nossapretensão acompanhar, o mais estreitamente possível,este movimento frenético, que torna <strong>Angola</strong> um “gigante”ávido em consumir tudo, para respon<strong>de</strong>r arobustez da sua economia, que a nível africano e mundialvem se afirmando.O <strong>CNC</strong> registou durante o primeiro trimestre uma redunção<strong>de</strong> cerca <strong>de</strong> 2% comparado com o quartotrimestre <strong>de</strong> 2009. Em termos globais o País Importou viaMarítima cerca <strong>de</strong> 2.401.108,66 toneladas <strong>de</strong> cargas comparadocom 2.437.071,10 do quarto trimestre e2.542.367,53 o que representa uma redução <strong>de</strong> cerca <strong>de</strong>20% comparado ao período homologo. Os dados referentesaos portos <strong>de</strong> Luanda e do Lobito po<strong>de</strong>m estareivados <strong>de</strong> alguma discrepância e não correspon<strong>de</strong>rem acem por cento <strong>de</strong> tudo aquilo que entrou. Tal <strong>de</strong>sequilíbrioencontra razão no facto <strong>de</strong> que, durante o quartotrimestre <strong>de</strong> 2009 e o primeiro <strong>de</strong>ste ano, alguns navios,inicialmente <strong>de</strong>stinados a atracar no Porto <strong>de</strong> Luanda,foram transferidos para o Porto do Lobito, por <strong>de</strong>cisão daComissão Ad Hoc para o Descongestionamento do Porto<strong>de</strong> Luanda, criada por <strong>de</strong>spacho <strong>de</strong> Sua Excelência o senhorministro dos Transportes.Com o <strong>Boletim</strong> <strong>Estatístico</strong> seguimos à risca este ditado.Senão vejamos, olhando para os dados, um gestor, quetiver que <strong>de</strong>cidir, saberá, antecipadamente, quem são osnossos principais fornecedores internacionalmente falando;os agentes económicos saberão quem são osprincipais importadores para <strong>Angola</strong> e para que principaisprodutos pen<strong>de</strong> a inclinação do consumidor angolano;e os especialistas em estatísticas terão dadosmais acertados sobre a nossa <strong>de</strong>pendência económicaface ao exterior e a título comparativo po<strong>de</strong>rão observarem que época, <strong>de</strong> cada ano, o fluxo <strong>de</strong> entrada <strong>de</strong> mercadoriasé maior e a respectiva variação.Este é o nosso contributo. Desejamos, mais uma vez,boa leitura.Muito obrigadoDear rea<strong>de</strong>rs, distinguished members of the maritimecommunity and port authorities, economic agents,as a promise is a promise, we are back again to bring toyou the issues related to goods which entered the countryduring the first quarter of <strong>2010</strong>.( Registered from theloading country).Every day, in the framework of its competence within thecountry and abroad, <strong>CNC</strong> issues loading certificates forgoods that enter our country either to meet private needsor they be products inten<strong>de</strong>d for the regular collectiveneeds. And, with this publication, it is our intention tomonitor, as closely as possible, this frantic movement,which makes <strong>Angola</strong> a "Giant" eager to consume everything,to respond to its strong economy which has beena reference either in Africa and all over the world.<strong>CNC</strong> registered a reduction of 2% during the first quartercomparing to the fourth quarter of 2009. In general terms,the country imported by sea about 2,437 thousand tonsof cargo, comparing to 2,401 thousand of the fourth quarterand 2, 985 thousand during the first quarter of 2009,which represents a reduction of 20 % comparing to thesame period.The data obtained from Port of Luanda and Lobito maybe contaminated by any discrepancies and do not correspondto one hundred percent of the goods that entered.This imbalance is due to the fact that fourth quarterof <strong>2010</strong> and the first quarter of this year, some ships, originallyexpected to berth at Porto <strong>de</strong> Luanda, were transferredto Port of Lobito, by <strong>de</strong>cision of the Ad HocCommittee to unblock port of Luanda, un<strong>de</strong>r the instructionof His Excellency the Minister of Transport.With the Statistical Bulletin we strictly follow this saying.Let us see, looking at the data, a manager who has to <strong>de</strong>ci<strong>de</strong>will know in advance who are our main suppliers internationallyspeaking, the economic agents will knowwho are the main importers to <strong>Angola</strong> and the majorproducts which are consumed by the <strong>Angola</strong>ns, and expertsin statistics will have most accurate data about oureconomic <strong>de</strong>pen<strong>de</strong>nce on the outsi<strong>de</strong> and on comparisonbasis, they may observe in which time, of each year,the inflow of goods is greater and its variation.This is our contribution. We hope, once again, you enjoyyour reading.Thank you very muchFrancisco Agostinho M. IbemboGeneral DirectorFrancisco Agostinho M. ItemboDirector Geral do <strong>CNC</strong>
PRODUTOS MAIS IMPORTADOS<strong>1º</strong> TRIMESTRE / <strong>2010</strong>MOST IMPORTED PRODUCTSIN <strong>2010</strong>/1 st QUARTER
o I trimestre <strong>de</strong> <strong>2010</strong>, que o <strong>Boletim</strong> <strong>Estatístico</strong> trazneste espaço, é li<strong>de</strong>rada pelos cimentos, seguido dascervejas, malte, sal e carnes e miu<strong>de</strong>zas. Estes são oscinco primeiros produtos <strong>de</strong> uma lista <strong>de</strong> seleccionados<strong>de</strong> 871 produtos que entraram no país.A or<strong>de</strong>m obe<strong>de</strong>ce à posição, em função da quantida<strong>de</strong>,a categoria e a classe em que aparecem naPauta Aduaneira.The list of 100 products more imported during thefirst quarter of <strong>2010</strong> that Statistical Bulletin brings inthis space which was led by cement, followed by beer,malt, salt and meat and offal. These are the top fiveproducts in a short list of 871 products that enteredthe country. The or<strong>de</strong>r follows the heading, <strong>de</strong>pendingon the quantity, category and class in which they appearon the Customs TariffPRODUTOS MAIS IMPORTADOSTotal <strong>de</strong> toneladas 2.401.108,66Total <strong>de</strong> produtos 871POSIÇÃO CLASSE CATEG. PRODUTO TONELADAS %1 25 23 Cimentos hidráulicos (incluídos os cimentos não pulverizados, <strong>de</strong>nominados , clinkers), mesmo corados 787.471,40 32,802 22 03 Cervejas <strong>de</strong> malte 96.530,87 4,023 11 07 Malte, mesmo torrado 66.216,12 2,764 25 01Sal (incluído o sal <strong>de</strong> mesa e o sal <strong>de</strong>snaturado) e cloreto <strong>de</strong> sódio puro, mesmo em solução aquosa, águado mar 48.476,59 2,025 02 07 Carnes e miu<strong>de</strong>zas comestíveis, frescas, refrigeradas ou congeladas, das aves da posição 0105 43.994,37 1,836 10 04 Aveia 37.697,32 1,577 17 01 Açúcares <strong>de</strong> cana ou <strong>de</strong> beterraba e sacarose quimicamente pura, no estado sólido 35.783,23 1,498 11 01 Farinha <strong>de</strong> trigo ou <strong>de</strong> misturas <strong>de</strong> trigo com centeio 32.660,38 1,369 10 06 Arroz 30.556,98 1,27Granito, pórfiro, basalto, arenito e outras pedras <strong>de</strong> cantaria ou <strong>de</strong> construção, mesmo <strong>de</strong>sbastados ou10 25 16 simplesmente cortados à serra ou por outro meio, em blocos ou placas <strong>de</strong> forma quadrada ou rectangular 27.297,00 1,1411 73 04 Tubos e perfis ocos, sem costura, <strong>de</strong> ferro ou aço 24.200,25 1,0112 15 11 Óleo <strong>de</strong> palma e respectivas fracções, mesmo refinados, mas não quimicamente modificados 24.194,70 1,0113 26 21 Outras escórias e cinzas, incluídas as cinzas <strong>de</strong> algas 23.271,30 0,9714 76 10Construções e suas partes (por exemplo: pontes e elementos <strong>de</strong> pontes, torres, pórticos ou pilonos, pilares,colunas, armações, estruturas para telhados, portas e janelas, e seus caixilhos, alizares e soleiras,balaustradas) <strong>de</strong> alumínio, exceptoas construções pré-fabricadas da posição 9406, chapas, barras, perfis,tubos e se melhantes, <strong>de</strong> alumínio, próprios para construções 22.864,06 0,9515 69 08Ladrilhos e placas (lajes) para pavimentação ou revestimento, vidrados ou esm<strong>alta</strong>dos, <strong>de</strong> cerâmica,cubos, pastilhas e artigos semelhantes, para mosaicos, vidrados ou esm<strong>alta</strong>dos, <strong>de</strong> cerâmica, mesmo comsuporte 20.969,44 0,8716 19 0217 39 2018 73 0819 22 02Massas alimentícias, mesmo cozidas ou recheadas (<strong>de</strong> carne ou <strong>de</strong> outras substâncias) ou preparadas <strong>de</strong>outro modo, tais como esparguete, macarrão, aletria, lasanha, nhoque, raviole e canelone, (cuscuz)mesmo preparado 20.214,48 0,84Outras chapas, folhas, películas, tiras e lâminas, <strong>de</strong> plástico não alveolar, não reforçados nem estratificados,nem associados a outras matérias, sem suporte 17.933,69 0,75Construções e suas partes (por exemplo: pontes e elementos <strong>de</strong> pontes, comportas, torres, pórticos, ou pilonos,pilares, colunas, armações, estruturas para telhados, portas e janelas, e seus caixilhos, alizares esoleiras, portas <strong>de</strong> correr, balaustradas) <strong>de</strong> ferro fundido, ferro ou aço, excepto as construções pré-fabricadasda posição 9406, chapas, barras, tubos e semelhantes, <strong>de</strong> ferro fundido, ferro ou aço, próprios paraconstruções 16.642,30 0,69Águas, incluídas as águas minerais e as águas gaseificadas, adicionadas <strong>de</strong> açúcar adicionadas <strong>de</strong> açúcarou <strong>de</strong> outros edulcorantes ou aromatizadas e outras bebidas não alcoólicas excepto sumos <strong>de</strong> frutos ou <strong>de</strong>produtos hortícolas, da posição 2009 15.943,20 0,6620 15 07 Óleo <strong>de</strong> soja e respectivas fracções, mesmo refinados, mas não quimicamente modificados 15.754,23 0,6621 87 04 Veículos automóveis para transporte <strong>de</strong> mercadorias 15.613,74 0,6522 20 09Sumos <strong>de</strong> frutas (incluídos os mostos <strong>de</strong> uvas) ou <strong>de</strong> produtos hortícolas, não fermentados, sem adição <strong>de</strong>álcool, com ou sem adição <strong>de</strong> açúcar ou <strong>de</strong> outros edulcorantes 15.207,04 0,6323 29 30 Tiocompostos orgânicos 15.149,07 0,6324 87 03Automóveis <strong>de</strong> passageiros e outros veículos automóveis principalmente concebidos para o transporte <strong>de</strong>pessoas (excepto os da posição 8702), incluídos os veículos <strong>de</strong> uso misto (station wagons) e os automóveis<strong>de</strong> corrida 15.059,49 0,6325 22 04Vinhos <strong>de</strong> uvas frescas, incluídos os vinhos enriquecidos com alcóol mostos <strong>de</strong> uvas, excluídos os daposição 2009 14.050,61 0,5926 73 05Outros tubos (por exemplo : soldados ou rebitados) <strong>de</strong> secção circulares, <strong>de</strong> diâmetro exterior superior a406,4 mm, <strong>de</strong> ferro ou aço 13.755,12 0,5727 94 03 Outros móveis e suas partes 13.519,44 0,5628 11 03 Grumos, sêmolas e pellets, <strong>de</strong> cereais 13.160,01 0,55PRODUTOS MAIS IMPORTADOS - <strong>1º</strong> TRIMESTRE/ <strong>2010</strong>MOST IMPORTED PRODUCTS IN <strong>2010</strong>/1 st QUARTER
PRODUTOS MAIS IMPORTADOSPOSIÇÃO CLASSE CATEG. PRODUTO TONELADAS %57 72 1058 69 05Produtos laminados planos, <strong>de</strong> ferro ou aço não ligado, <strong>de</strong> largura igual ou superior a 600 mm,folheados ou chapeados, ou revestidos 6.627,15 0,28Telhas, elementos <strong>de</strong> chaminés, condutores <strong>de</strong> fumo, ornamentos arquitectónicos, <strong>de</strong> cerâmica, e outrosprodutos cerâmicos para construção 6.546,05 0,2759 02 02 Carnes <strong>de</strong> animais da espécie bovina, congeladas 6.406,50 0,2760 94 06 Construções pré - fabricadas 6.384,88 0,2761 68 10 Obras <strong>de</strong> cimento, <strong>de</strong> betão (concreto) ou <strong>de</strong> pedra artificial, mesmo armadas 6.155,14 0,2662 69 07Ladrilhos e placas (lajes) para pavimentação ou revestimento, não vidrados nem esm<strong>alta</strong>dos, <strong>de</strong>cerâmica, cubos, pastilhas e artigos semelhantes, para mosaicos, não vidrados nem esm<strong>alta</strong>dos, <strong>de</strong>cerâmica, mesmo com suporte 5.993,14 0,2563 01 01 Animais vivos das espécies cavalar, asinina e muar 5.968,86 0,2564 07 13 Legumes <strong>de</strong> vagem, secos, em grão, mesmo pelados ou partidos 5.612,75 0,2365 89 0166 19 05Transatlânticos, barcos <strong>de</strong> cruzeiro, ferry-boats, cargueiros, chatas e embarcações semelhantes, para otransporte <strong>de</strong> pessoas ou <strong>de</strong> mercadorias: 5.608,45 0,23Produtos <strong>de</strong> padaria, pastelaria ou da indústria <strong>de</strong> bolachas e biscoitos, mesmo adicionados <strong>de</strong> cacau,hóstias, cápsulas vazias para medicamentos, obreias, pastas secas <strong>de</strong> farinha, amido ou <strong>de</strong> fécula, emfolhas, e produtos semelhantes 5.599,85 0,2367 68 09 Obras <strong>de</strong> gesso ou <strong>de</strong> composições à base <strong>de</strong> gesso 5.360,20 0,2268 72 16 Perfis <strong>de</strong> ferro ou aço não ligado 5.295,60 0,2269 20 02 Tomates preparados ou conservados, excepto em vinagre ou em ácido acético 5.282,78 0,2270 39 26 Outras obras <strong>de</strong> plástico e obras <strong>de</strong> outras matérias das posições 3901 a 3914 5.158,23 0,2171 02 0672 25 2673 96 01Miu<strong>de</strong>zas comestíveis <strong>de</strong> animais das espécies bovina, suína, ovina, caprina, cavalar, asinina e muar,frescas, refrigeradas ou congeladas 5.065,31 0,21Esteatite natural, mesmo <strong>de</strong>sbastada ou simplesmente cortada à serra ou por outro meio, em blocosou placas <strong>de</strong> forma quadrada ou rectangular, talco 5.059,24 0,21Marfim, osso, carapaça <strong>de</strong> tartaruga, chifre, pontas, coral, madre-pérola e outras matérias animaispara entalhar, trabalhos e suas obras (incluídas as obras obtidas por moldagem) 5.039,67 0,2174 44 12 Ma<strong>de</strong>ira contraplacada ou compensada, ma<strong>de</strong>ira folheada, e ma<strong>de</strong>iras estratificadas semelhantes 5.030,42 0,2175 22 0876 84 1877 73 10Álcool etílico não <strong>de</strong>snaturado, com um teor alcoólico em volume inferior a 80 % vol, aguar<strong>de</strong>ntes,licores e outras bebidas espirituosas 4.993,06 0,21Refrigeradores, congeladores (freezers) e outros materiais, máquinas e aparelhos para a produção<strong>de</strong> frio, com equipamento eléctrico ou outro, bombas <strong>de</strong> calor excluídas as máquinas e aparelhos <strong>de</strong>ar condicionado da posição 8415 4.991,65 0,21Reservatórios, barris, tambores, latas, caixas e recipientes semelhantes para quaisquer matérias (exceptogases comprimidos ou liquefeitos) <strong>de</strong> ferro fundido, ferro ou aço, <strong>de</strong> capacida<strong>de</strong> não superior a300 litros, sem dispositivos mecânicos ou térmicos, mesmo com revestimento interior ou calorífugo 4.970,20 0,2178 64 02 Outro calçado com sola exterior e parte superior <strong>de</strong> borracha ou plástico 4.940,50 0,2179 83 1180 38 2481 68 0282 87 1183 84 74Fios, varetas, tubos, chapas, eléctrodos e artefactos semelhantes, <strong>de</strong> metais comuns ou <strong>de</strong> carbonetosmetálicos, revestidos interior ou exteriormente <strong>de</strong> <strong>de</strong>capantes ou <strong>de</strong> fun<strong>de</strong>ntes, para soldadura(soldagem) ou <strong>de</strong>pósito <strong>de</strong> metal ou <strong>de</strong> carbonetos metálicos, fios e varetas, <strong>de</strong> pós <strong>de</strong> metais comunsaglomerados, para metalização por projecção 4.825,66 0,20Aglutinantes preparados para mol<strong>de</strong>s ou para núcleos <strong>de</strong> fundição, produtos químicos e preparaçõesdas indústrias químicas ou das indústrias conexas (incluídos os constituídos por misturas <strong>de</strong> produtosnaturais), não especificados nem compreendidos em outras posições: produtos residuais das indústriasquímicas ou das industrias conexas, não especificados nem compreendidos em outras posições 4.775,71 0,20Pedras <strong>de</strong> cantaria ou <strong>de</strong> construção (excepto <strong>de</strong> ardósia) trabalhadas e obras <strong>de</strong>s tas pedras, exceptoas da posição 6801, cubos, pastilhas e artigos semelhantes, para mosaicos, <strong>de</strong> pedra natural (incluídaa ardósia) mesmo com suporte, grânulos, fragmentos e pós, <strong>de</strong> pedra natural (incluída a ardósia)corados artificialmente 4.732,10 0,20Motocicletas (incluídos os ciclomotores) e outros ciclos equipados com motor auxiliar, mesmo comcarro lateral, carros laterais 4.694,95 0,20Máquinas e aparelhos, para seleccionar, peneirar, separar, lavar, esmagar, moer, misturar ou amassarterras, pedras, minérios ou outras substâncias minerais sólidas (incluídos os pós e pastas),máquinas para aglomerar ou moldar combustíveis minerais sólidos, pastas cerâmicas, cimentogesso ou outras matérias minerais em pó ou em pasta, máquinas para fazer mol<strong>de</strong>s <strong>de</strong> areia,para fundição 4.615,19 0,19PRODUTOS MAIS IMPORTADOS - <strong>1º</strong> TRIMESTRE/ <strong>2010</strong>MOST IMPORTED PRODUCTS IN <strong>2010</strong>/1 st QUARTER
PRODUTOS MAIS IMPORTADOSPOSIÇÃO CLASSE CATEG. PRODUTO TONELADAS %84 38 23Ácidos gordos (graos) monocarboxílicos industriais, óleos ácidos <strong>de</strong> refinação, álcoois gordos (graxos)industriais 4.411,34 0,1885 73 11 Recipientes para gases comprimidos ou liquefeitos, <strong>de</strong> ferro fundido, ferro ou aço 4.217,26 0,1886 72 08Produtos laminados planos, <strong>de</strong> ferro ou aço não ligado, <strong>de</strong> largura igual ou superior a 600 mm, laminadosa quente, não folheados ou chapeados, nem revestidos 4.158,22 0,1787 12 08 Farinhas <strong>de</strong> sementes ou <strong>de</strong> frutos oleaginosos, excepto farinha <strong>de</strong> mostarda 4.044,52 0,1788 72 2889 39 23Barras e perfis, <strong>de</strong> outras ligas <strong>de</strong> aço, barras ocas para perfuração, <strong>de</strong> ligas <strong>de</strong>aço ou <strong>de</strong> aço nãoligado 4.038,48 0,17Artigos <strong>de</strong> transporte ou <strong>de</strong> embalagem, <strong>de</strong> plásticos, rolhas, tampas, cápsulas e outros dispositivos<strong>de</strong>stinados a fechar recipientes, <strong>de</strong> plástico 4.037,71 0,1790 87 16 Reboques e semi-reboques para quaisquer veículos, outros veículos não autopropulsores, suas partes 4.004,08 0,1791 28 01 Flúor, cloro, bromo e iodo 3.965,39 0,1792 72 09Produtos laminados planos, <strong>de</strong> ferro ou aço não ligado, <strong>de</strong> largura igual ou superior a 600 mm, laminadosa frio, não folheados ou chapeados, nem revestidos 3.892,69 0,16PRODUTOS MAIS IMPORTADOS - <strong>1º</strong> TRIMESTRE / <strong>2010</strong>MOST IMPORTED PRODUCTS IN 2009/1 st QUARTER93 69 04 Tijolos para construção, tijoleiras, tapa-vigas e produtos semelhantes, <strong>de</strong> cerâmica 3.755,02 0,1694 38 0895 32 1496 44 1897 22 01Insecticidas, ro<strong>de</strong>nticidas, fungicidas, herbicidas, inibidores <strong>de</strong> germinação e reguladores <strong>de</strong> crescimentopara plantas, <strong>de</strong>sinfectantes e produtos semelhantes apresentados em formas ou embalagenspara venda a retalho ou como preparações ou ainda sob a forma <strong>de</strong> artigos, tais como fitas,mechas e velas sulfuradas e papel mata-moscas 3.649,12 0,15Mástique <strong>de</strong> vidraceiro, cimentos <strong>de</strong> resina e outros mástiques, indutos utilizados em pintura, indutosnão refractários do tipo dos utilizados em alvernaria 3.614,61 0,15Obras <strong>de</strong> carpintaria para construções, incluídos os painéis celulares, os painéis para soalhos e asfasquias para telhados (shingles e shakes), <strong>de</strong> ma<strong>de</strong>ira 3.570,63 0,15Águas, incluídas as águas minerais, naturais ou artificiais, e as águas gaseificadas, não adicionadas<strong>de</strong> açúcar ou <strong>de</strong> outros edulcorantes nem aromatizadas, gelo e neve 3.466,40 0,1498 87 02 Veículos automóveis para o transporte <strong>de</strong> <strong>de</strong>z pessoas ou mais, incluíndo o condutor 3.465,55 0,1499 94 01 Assentos (excepto os da posição 9402) mesmo transformáveis em camas, e suas partes 3.404,94 0,14100 85 06 Pilhas e baterias <strong>de</strong> pilhas, eléctricas 3.330,45 0,14
Entre os principais portos <strong>de</strong> <strong>de</strong>stino <strong>de</strong> mercadoriasimportadas, o Porto <strong>de</strong> Luanda foi o que mais se<strong>de</strong>stacou em quase todas as modalida<strong>de</strong>s durante oI trimestre <strong>de</strong> <strong>2010</strong>, seguido do Porto do Lobito e doNamibe. O Porto <strong>de</strong> Luanda registou a entrada <strong>de</strong>499.815,16 toneladas, nos contentores <strong>de</strong> 20 pés, e222.052,85 toneladas nos contentores <strong>de</strong> 40 pés.Among the main ports of <strong>de</strong>stination of importedgoods, Port of Luanda was that stood out in almost allmodalities during the first quarter of <strong>2010</strong>, followed bythe Port of Lobito and Namibe. Port of Luanda has theentry of 499,815.16 tons in the 20-foot containers, and222,052.85 tonnes in containers of 40 feet.PORTOS DE DESTINO DAS MERCADORIAS POR TONELADASPORTO CONTENTOR10 CONTENTOR20 CONTENTOR40 CONVENCIONAL FRIGO10 FRIGO20 FRIGO40 GRANEL VEÍCULO TOTALLUANDA 29,46 499.815,16 222.052,85 422.353,43 - 1.156,43 81.530,90 471.386,57 28.546,36 1.726.871,16LOBITO - 56.080,26 29.826,09 71.231,63 - 174,29 4.146,48 187.412,26 4.469,95 353.340,96SOYO - 8.401,18 4.191,43 74.725,91 - 1.005,70 372,62 32.858,29 296,97 121.852,11NAMIBE - 31.275,75 12.777,59 35.787,91 - 93,37 1.260,01 9.929,56 1.682,28 92.806,47CABINDA - 26.500,04 4.135,37 693,32 - 204,39 2.048,83 9.249,23 335,69 43.166,87MALONGO 9,34 10.070,11 882,36 11.593,84 45,57 1.043,36 - 1,50 - 23.646,07PORTO AMBOIM,AN-GOLA - 134,40 134,40 - - - - 10.638,22 - 10.907,02SONILS - 170,05 555,12 9.665,45 - - - - - 10.390,61ANY PORT OF ANGOLA - 12,98 91,25 7.732,34 - - - - 47,84 7.884,41AMBIOM - 126,46 40,76 4.125,17 - - - - - 4.292,38POINT NOIRE - 2.282,86 492,57 32,02 - 30,02 280,62 - 102,06 3.220,15DANDE - - - 2.694,67 - - - - - 2.694,67ONDJIVA - 33,77 - - - - - - - 33,77WALVIS BAY TRANSITTO HUAMBO,ANGOLA - - - 2,00 - - - - - 2,00TOTA 38,80 634.903,02 275.179,79 640.637,68 45,57 3.707,57 89.639,46 721.475,63 35.481,16 2.401.108,66PORTOS DE DESTINO DAS MERCADORIAS - <strong>1º</strong> TRIMESTRE / <strong>2010</strong>PORTS OF DESTINATION OF GOODS IN <strong>2010</strong> /1 st QUARTER
O Porto <strong>de</strong> Luanda li<strong>de</strong>ra a lista <strong>de</strong> unida<strong>de</strong>s importadasdurante o I trimestre <strong>de</strong> <strong>2010</strong> com umtotal <strong>de</strong> 24.883 contentores <strong>de</strong> 20 pés e 13.927 contentores<strong>de</strong> 40 pés. O Porto do Lobito vem a seguir,à frente do Porto do Namibe e do Porto <strong>de</strong> Cabinda,do Malongo e do Soyo.Port of Luanda leads the list of units imported duringthe I quarter of <strong>2010</strong> with a total of 24 883 containers of20 feet and 13 927 containers of 40 feet. Port of Lobitocoming ahead of the Port of Port of Namibe andCabinda, Soyo and the Malongo.PORTOS DE DESTINO DAS MERCADORIAS POR UNIDADESPORTO CONTENTOR10 CONTENTOR20 CONTENTOR40 FRIGO10 FRIGO20 FRIGO40 VEICULO TOTALLUANDA 11,00 24.883,00 13.927,00 - 95,00 2.994,00 14.157,00 56.067,00LOBITO - 2.665,00 1.720,00 - 7,00 147,00 924,00 5.463,00NAMIBE - 1.575,00 645,00 - 7,00 47,00 329,00 2.603,00CABINDA - 1.279,00 242,00 - 14,00 78,00 42,00 1.655,00MALONGO 2,00 829,00 62,00 5,00 105,00 - - 1.003,00PORTOS DE DESTINO DAS MERCADORIAS - <strong>1º</strong> TRIMESTRE/ <strong>2010</strong>PORTS OF DESTINATION OF GOODS IN <strong>2010</strong>/1 st QUARTERSOYO - 488,00 265,00 - 86,00 21,00 17,00 877,00POINT NOIRE - 118,00 35,00 - 2,00 10,00 19,00 184,00SONILS - 15,00 35,00 - - - - 50,00PORTO AMBOIM,AN-GOLA - 25,00 17,00 - - - - 42,00ANY PORT OF ANGOLA - 3,00 - - - - 27,00 30,00ONDJIVA - 2,00 - - - - - 2,00TOTAL 13,00 31.882,00 16.951,00 5,00 316,00 3.297,00 15.515,00 67.979,00POSIÇÃO MODO DE TRANSPORTE TONELADAS %1 GRANEL 721.475,63 30,12 CONVENCIONAL 640.637,68 26,73 CONTENTOR20 634.903,02 26,44 CONTENTOR40 275.179,79 11,55 FRIGO40 89.639,45 3,736 VEICULO 35.481,16 1,487 FRIGO20 3.707,57 0,158 FRIGO10 45,57 09 CONTENTOR10 38,80 0TOTAL 2.401.108,66 100
Na lista <strong>de</strong> veículos que entraram em <strong>Angola</strong> atravésdos principais portos do país, durante o I trimestre <strong>de</strong><strong>2010</strong>, <strong>de</strong>staque para o Porto <strong>de</strong> Luanda que recebeu14.772 veículos, seguido do Porto do Lobito com 998e do Porto do Namibe com 347 veículos. No totalentraram no país 16.276 veículos, dos quais 160chegaram em contentores <strong>de</strong> 20 pés e 601 em contentores<strong>de</strong> 40 pésList of vehicles that entered <strong>Angola</strong> through themain ports of the country during the first quarter of<strong>2010</strong>, especially the Port of Luanda had received14 772 vehicles, followed by the Port of Lobito with998 and the Port of Namibe with 347 vehicles. Atotal of 16 276 vehicles entered the country, ofwhich 160 came in 20-foot containers and 601 containersof 40 feet.VEÍCULOS TRANSPORTADOS (EM RORO+CONVECIONAL+EM CONTENTOR20+CONTENTOR40)PORTOS EM RORO+CONVENCIONAL EM CONTENTOR DE 20 EM CONTENTOR DE 40 TOTALCABINDA 42 4 9 55POINT NOIRE 19 1 16 36NAMIBE 329 5 13 347LUANDA 14.157 129 486 14.772LOBITO 924 18 56 998SOYO 17 2 19 38SONILS 0 1 2 3ANY PORT OF ANGOLA 27 0 0 27TOTAL 15.515 160 601 16.276PORTOS DE DESTINO DAS MERCADORIAS - <strong>1º</strong> TRIMESTRE / <strong>2010</strong>PORTS OF DESTINATION OF GOODS IN <strong>2010</strong>/1 st QUARTER
A Ásia assumiu-se, no I trimestre <strong>de</strong>ste ano, como oprincipal fornecedor <strong>de</strong> produtos para o país, <strong>de</strong>stronandoa Europa. A Ásia exportou para <strong>Angola</strong> 1.032.249,55toneladas <strong>de</strong> produtos diversos, o que representa 42,6 porcento do total da mercadoria que entrou no país. A Europaficou em terceiro, com 25,1 por cento, abaixo da América,que registou 28.2 por cento. A África fica muito abaixo,com 4,07 por cento, e a Austrália com 0,03 por cento..Asia was assumed, in the first quarter of thisyear as the leading supplier of products for thecountry, <strong>de</strong>throning Europe. Asia exported to <strong>Angola</strong>1,032,249.55 tons of various products, representing42.6 percent of total merchandise thatentered the country. Europe was the third with 25.1percent, down from America, which registered28.2 percent. Africa is much lower, with 4.07 percent,and Australia with 0.03 percentIMPORTAÇÃO POR CONTINENTESPOSIÇÃO DESIGNACAO TONELADAS %1 ASIA 1.023.294,56 42,62 AMÉRICA 677.694,52 28,23 EUROPA 601.671,34 25,14 ÁFRICA 97.722,80 4,075 AUSTRÁLIA 725,44 0,03TOTAL 2.401.108,66 100IMPORTAÇÃO POR CONTINENTES - <strong>1º</strong> TRIMESTRE / <strong>2010</strong>IMPORTATIONS BY CONTINENTS IN <strong>2010</strong>/1 st QUARTER
A lista dos mercados mais significativos, durante oI trimestre <strong>de</strong> <strong>2010</strong>, é li<strong>de</strong>rada pela China com 40 por centodo total das importações, seguido <strong>de</strong> Portugal com 13,2,da França com 5,76, e do Brasil com 5,15 por cento. Vêm<strong>de</strong>pois a Bélgica e a África do Sul (o país africano que maisexportou para <strong>Angola</strong>).The list of the most significant markets duringthe first quarter of <strong>2010</strong> is led by China with40 percent of total imports, followed by Portugalwith 13.2, France with 5.76, and Brazil with5.15 percent. Then come Belgium and SouthAfrica (the African country that most exportedto <strong>Angola</strong>).MERCADOS (PAÍSES) MAIS SIGNIFICATIVOSPOSIÇÃO ID PAÍS TONELADAS %1 44 China 959.297,22 402 171 Portugal 316.732,50 13,23 72 França 138.274,57 5,764 28 Brasil 123.721,74 5,155 24 Bélgica 97.286,93 4,056 2 Africa do Sul (South Africa) 66.192,17 2,767 66 Estados Unidos da América 63.205,78 2,638 213 Turquia 54.756,04 2,289 264 Vietname 54.428,12 2,2710 61 Emirados Arabes Unidos 48.820,10 2,0311 204 Taiwan 48.283,89 2,0112 106 Índia 45.504,75 1,913 40 Canada 41.895,13 1,7414 107 Indonésia 34.832,87 1,4515 13 Argentina 32.749,61 1,3616 203 Tailândia 32.560,79 1,3617 63 Espanha 31.246,94 1,318 132 Malasia 28.928,70 1,219 51 Costa do Marfim 25.306,49 1,0520 174 Reino Unido 18.370,01 0,7721 4 Alemanha (Germany) 16.186,96 0,6722 153 Holanda 15.143,47 0,6323 113 Italia 14.575,08 0,6124 194 Singapura 11.570,34 0,4825 109 Irão 9.790,52 0,4126 50 Coreia do Sul 8.329,88 0,3527 123 Líbano 5.769,13 0,2428 70 Filipinas 5.647,12 0,2429 169 Polónia 5.207,51 0,2230 60 Egipto 4.309,36 0,1831 116 Japão 4.256,11 0,1832 112 Israel 3.784,39 0,1633 217 Uruguai 3.097,99 0,1334 165 Paquistão 2.823,11 0,1235 150 Namíbia 2.722,41 0,1136 137 Marrocos 2.530,81 0,1137 173 Quénia 2.262,39 0,0938 201 Suécia 2.018,12 0,0839 195 Síria 1.995,29 0,0840 48 Congo 1.747,72 0,0741 160 Nova Zelândia 1.621,46 0,0742 142 México 1.540,22 0,0643 158 Noruega 1.395,99 0,0644 166 Paraguai 1.321,25 0,0645 43 Chile 1.020,33 0,0446 71 Finlândia 783,65 0,0347 12 Arabia Saudita 759,86 0,0348 16 Austrália 725,44 0,03PRINCIPAIS MERCADOS - <strong>1º</strong> TRIMESTRE / <strong>2010</strong>MAIN MARKETS IN <strong>2010</strong> /1 st QUARTER
MERCADOS (PAÍSES) MAIS SIGNIFICATIVOSPOSIÇÃO ID PAÍS TONELADAS %49 211 Tunísia 571,76 0,0250 197 Siri Lanka 553,9 0,0251 156 Nigéria 525,33 0,0252 46 Colômbia 522,9 0,0253 67 Estónia 461,58 0,0254 21 Bangla<strong>de</strong>sh 430,68 0,0255 136 M<strong>alta</strong> 381,86 0,0256 34 Bulgária 290 0,0157 139 Maurício 289,95 0,0158 55 Dinamarca 230,78 0,0159 87 Guine Equatorial 217,97 0,0160 172 Qatar 217,72 0,0161 182 Rússia 146,14 0,0162 127 Lituânia 143,32 0,0163 65 Eslovénia 122,64 0,0164 75 Gana 112,03 065 117 Jordânia 101,22 066 79 Grécia 83,16 067 200 Suazilândia 69,91 068 53 Croacia 54,8 069 7 <strong>Angola</strong> 45,33 0PRINCIPAIS MERCADOS - <strong>1º</strong> TRIMESTRE / <strong>2010</strong>MAIN MARKETS - <strong>2010</strong>/1 st QUARTER70 163 Panama 34,54 071 54 Cuba 31,82 072 191 Senegal 26,5 073 167 Peru 26,1 074 205 Tanzânia 25 075 207 Togo 22,21 076 125 Líbia 12 077 1 Afeganistão (Afeganistão) 9,69 078 39 Camarões 7 079 215 Ucrânia 5,31 080 73 Gabão 2,71 081 140 Mauritânia 1,56 082 131 Madagascar 1,01 0TOTAL 2.401.108,69 100
MAIORES IMPORTADORES - <strong>1º</strong> TRIMESTRE / <strong>2010</strong>MAJOR IMPORTERS IN <strong>2010</strong>/1 st QUARTER
A lista dos 100 maiores importadores durante o Itrimestre <strong>de</strong> <strong>2010</strong> é li<strong>de</strong>rada pela Chinangol Lda com 15,8por cento do total, seguido da Socodiba com 6,47 porcento e da <strong>Angola</strong> LNG com 4,47 por cento. Na lista, oprincipal <strong>de</strong>staque vai para a Nova Cimangola que foi omaior importador durante todo o ano passado, mas queagora surge em oitavo lugar. A Secil – Companhia <strong>de</strong> Cimentosocupou o quinto lugar, seguido pela AngoAlissare da Muteba Distribuição..The list of 100 largest importers during the firstquarter of <strong>2010</strong> is led by Chinangol Ltd with 15.8 percentof the total, followed by Socodiba with 6.47 percentand the <strong>Angola</strong> LNG with 4.47 percent. In thelist, the main emphasis is on New Cimangola thatwas The biggest importer over the last year, but nowcomes in eighth place. Secil - Companhia Cementranked fifth, followed by AngoAlissar Muteba andDistribution.TOTAL 2.401.108,66MAIORES IMPORTADORESPOSIÇÃO ID DESIGNAÇÃO DO IMPORTADOR TONELADAS % NO GERAL1 7996 CHINANGOL LDA 379.781,97 15,82 36813 SOCODIBA-SOCIEDADE GERAL DE COMÉRCIO E DISTRIBUIÇÃO DE ANGOLA S.A 155.397,56 6,473 31756 ANGOLA LNG LIMITED 98.377,95 4,14 16328 HUA-FENG CONSTRUÇÃO E ENGENHARIA,LDA 79.038,25 3,295 3764 SECIL-COMPANHIA DE CIMENTOS 74.409,64 3,16 31046 ANGOALISSAR COMÉRCIO E INDÚSTRIA LDA 70.012,69 2,927 38591 MUTEBA DISTRIBUIÇÃO S.A. 66.924,45 2,798 661 NOVA CIMANGOLA S.A.R.L 47.777,16 1,999 5878 A DISTRIBUIDORA. LDA 44.487,03 1,8510 31389 F.C.K.S. - FABRICA DE CIMENTO DO KWANZA SUL LDA 36.610,32 1,5211 31760 AFRICONS SOC. COMÉRCIO GERAL IMPO.EXPORT CONSTRUÇÃO CÍVIL LDA 32.904,63 1,3712 23239 GRN - GABINETE DE RECONSTRUÇÃO NACIONAL 31.429,59 1,3113 37846 WAN PENG, LDA 30.601,91 1,2714 5352 SONANGOL - SOC. NACIONAL DE COMBUSTÍVEIS DE ANGOLA 30.389,98 1,2715 7876 GOLDEN NEST ANGOLA 24.941,66 1,0416 145 HALLIBURTON OVERSEAS LTD. 22.738,91 0,9517 31637 ANGOSAL IMPORTAÇÃO E EXPORTAÇÃO LIMITADA 21.990,78 0,9218 34484 ANGO FRIO COMÉRCIO GERAL LDA 20.362,97 0,8519 36007 ANGO-EAGLE INVESTMENT LDA 19.363,94 0,8120 34311 JAGRAC & DESC. PARTICIPAÇÕES LDA 19.132,38 0,821 5102 GOLFRATE HOLDING ANGOLA LIMITAD 17.238,67 0,7222 19940 DIMASSABA COMERCIAL AND INDUSTRIAL 16.445,47 0,6823 31504 REFRIANGO-INDÚSTRIA E COMÉRCIO GERAL LIMITADA 16.393,69 0,6824 19951 MI OVERSEAS LTD 14.609,91 0,6125 9468 MAZZARATI - COMÉRCIO E INDÚSTRIA LDA 14.430,42 0,626 19921 ENTREPOSTO ADUANEIRO DE ANGOLA 14.061,12 0,5927 26889 BP EXPLORATION ANGOLA LTD 14.026,43 0,5828 9436 ACAIL ANGOLA - IND. E COM. DE FERRO S.A. 13.037,50 0,5429 31799 CABINDA GULF 13.005,97 0,5430 950 IMPORTANGOLA 12.884,93 0,5431 9881 ANGO RAYAN GROUP INTERNACIONAL COM. GERAL LDA 12.328,07 0,5132 7334 ATLAS GRUPO LDA 12.201,15 0,5133 21133 GCT ANGOLA GESTÃO COMÉRCIO TOTAL SA 11.702,35 0,4934 3984 EMPRESA NACIONAL DE ELECTRÍCIDADE EMPRESA PÚBLICA (ENE-E.P.) 11.216,64 0,47MAIORES IMPORTADORES - <strong>1º</strong> TRIMESTRE / <strong>2010</strong>MAJOR IMPORTERS IN <strong>2010</strong>/1 st QUARTER
MAIORES IMPORTADORESPOSIÇÃO ID DESIGNAÇÃO DO IMPORTADOR TONELADAS % NO GERAL35 17474 COMPANHIA UNIÃO DE CERVEJAS DE ANGOLA SA - CUCA 10.382,61 0,4336 24736 CHINA ROAD & BRIDGE CORPORATION 10.344,90 0,4337 38188 HK CEG-CONSTRUCTION ENGINEERING GROUP LIMITADA 10.017,36 0,4238 33658 RAYAN INVESTMENTS LIMITED 9.950,39 0,4139 8976 BAI - BANCO AFRICANO DE INVESTIMENTOS SARL 8.845,37 0,3740 5777 BCA - BANCO COMERCIAL ANGOLANO 8.536,28 0,3641 9369 TOTAL EXPLORATION AND PRODUCTION ANGOLA 8.372,05 0,3542 38046 NOURCO COMÉRCIO GERAL IMPORT E EXPORT LIMITADA 7.980,71 0,3343 19343 REX TRADING COMPANY LIMITADA 7.904,84 0,3344 6354 ANGLOFLEX LDA 7.816,62 0,3345 4523 FLORANGO COMÉRCIO GERAL LDA 7.633,92 0,3246 30857 COBEJE 7.286,77 0,347 6419 MANSA IMPORTAÇÃO & EXPORTAÇÃO 7.096,33 0,348 4821 GRUPO AROSFRAN SARL 6.942,97 0,2949 41 COCA COLA BOTTLING LUANDA 6.511,75 0,2750 4545 CABIRE - ALIMENTOS. LDA 6.310,29 0,26MAIORES IMPORTADORES - <strong>1º</strong> TRIMESTRE / <strong>2010</strong>MAJOR IMPORTERS - <strong>2010</strong>/ 1st QUARTER51 961 ESSO EXPLORATION 6.018,89 0,2552 32349 NANTONG HOLDING CORPORATION LIMITADA 5.927,00 0,2553 37040 EVERY WHERE GENERAL TRADE CO.,LLC 5.408,57 0,2354 123 ADEGA COOPERATIVA DE AZUEIRA CRL-SUCURSAL 5.403,40 0,2355 36313 SOALIMENTAR, SA 5.260,57 0,2256 6681 ZINZI COMÉRCIO GERAL 5.234,84 0,2257 643 LUFU - COMÉRCIO GERAL LTDA 5.223,54 0,2258 553 FERPINTA ANGOLA COMÉRCIO E INDÚSTRIA LDA 5.162,86 0,2259 183 CHINA JIANGSU INTERNATIONAL 5.141,48 0,2160 4760 FRATELLI INDÚSTRIA E COMÉRCIO LDA 5.086,74 0,2161 7895 PAQUITA COMÉRCIO GERAL LDA 5.036,56 0,2162 31734 FUKUR & FILHOS COMÉRCIO GERAL IMPORT E EXPORT LIMITADA 4.884,50 0,263 6489 ROSILVIA COMERCIAL LTDA 4.834,45 0,264 8139 ROGÉRIO LEAL & FILHOS SA 4.527,38 0,1965 873 INTERTRADING COMÉRCIO GERAL LDA 4.415,96 0,1866 5872 GRUPO MAXI COMÉRCIO GERAL IMP E EXP LTD 4.301,80 0,1867 7885 MINHA CASA - COMÉRCIO GERAL IMP/EXP 4.243,44 0,1868 5070 NESTLE ANGOLA LTD 4.164,53 0,17
MAIORES IMPORTADORESPOSIÇÃO ID DESIGNAÇÃO DO IMPORTADOR TONELADAS % NO GERAL69 9172 RED SEA GENERAL TRADING ANGOLA 4.067,94 0,1770 8856 OSTEL COMÉRCIO GERAL IMPORT & EXPORT LDA 4.057,16 0,1771 28483 AFROCHIN INTERNACIONAL LDA 4.056,46 0,1772 29081 ANGO ERI COMÉRCIO GERAL IMPORT & EXPORT 3.979,16 0,1773 13160 ICC ANGOLA LDA 3.962,52 0,1774 5925 AMT (ANGOLA) TRADING LDA 3.946,82 0,1675 9173 ORGANIZAÇÕES TCHINHUNGO COMÉRCIO GERAL IMPORT & EXPORT - DE SIMÃO JOÃO GOGE 3.937,43 0,1676 3935 INTER INALCA 3.769,87 0,1677 25331 LOGISPARK-CENTRO DE APOIO LOGISTICO LDA 3.749,66 0,1678 9987 ERIANGO COMÉRCIO GERAL LDA 3.721,22 0,1579 7898 SOVINHOS-ENGARRAFADORA..VINICOLA 3.595,55 0,1580 3938 SICIE - SOC IND COM IMP EXP LDA. 3.556,11 0,1581 34505 MALEAL, LDA, - IMPORTAÇÃO E EXPORTAÇÃO 3.500,00 0,1582 30528 ORGANIZAÇÕES COSAL COMÉRCIO E SERVIÇOS DE ANGOLA LDA 3.469,52 0,1483 28869 NOCAL - NOVA EMPRESA DE CERVEJAS DE ANGOLA 3.451,27 0,1484 30801 ODEBRECHT ANGOLA PROJECTOS E SERVIÇOS LTD 3.416,56 0,1485 30919 MOKBEL COLD STORAGE INDUSTRY LDA 3.404,89 0,1486 9504 BANCO SOL SARL 3.371,28 0,1487 6733 SANTA ISABEL IMPORTAÇÃO E EXPORTAÇÃO LDA 3.322,90 0,1488 8769 REPRESENTAÇÕES LUÍS & ÂNGELO LDA 3.260,62 0,1489 206 EKA-EMPRESA ANGOLANA DE CERVEJAS SARL 3.255,50 0,1490 9456 SIRIUS MATERIAL AGRICOLA LDA 3.235,94 0,1391 14239 EMPRESA DE CERVEJAS NGOLA 3.192,01 0,1392 11187 ANGOLA STEEL CORPORATION 3.087,39 0,1393 13256 CASA MILITAR DA PRESIDÊNCIA DA REPÚBLICA DE ANGOLA 3.068,47 0,1394 6675 INDUVE - INDÚSTRIAS ANGOLANAS DE OLEOS VEGETAIS.SA 3.064,97 0,1395 2767 DAHLAK TRADING.ANGOLA-COMÉRCIO DE MATERIALS DE CONSTRUÇÃO, LDA 3.032,59 0,1396 3259 ORGANIZAÇÕES DESENVOLVIMENTO & LIMITADA 3.017,88 0,1397 16601 CIMIANTO DE ANGOLA SARL 2.980,76 0,1298 29431 SINOHYDRO CORPORATION LDA 2.949,82 0,1299 29976 NAKFA COMÉRCIO E INDÚSTRIA LDA 2.942,81 0,12100 9561 AFRIBELG ANGOLA LIMITADA 2.918,38 0,12MAIORES IMPORTADORES - <strong>1º</strong> TRIMESTRE DE <strong>2010</strong>MAJOR IMPORTERS IN <strong>2010</strong>/ 1st QUARTER
A lista dos principais agentes <strong>de</strong> navegação doI trimestre <strong>de</strong> <strong>2010</strong>, por toneladas <strong>de</strong> carga transportada,é li<strong>de</strong>rada Sun Shipping ltd com 16,8 por cento do total,seguido da Nile Dutch África Line com 8,48 por cento e daDelmas com 8,3 por cento. O total <strong>de</strong> carga transportadapara o país foi <strong>de</strong> 2.401.108,66 toneladas.Shipping Agents A list of major shippingagents in the I quarter of <strong>2010</strong>, per ton of cargo,is led Sun Shipping Ltd with 16.8 percent of thetotal, followed by the Nile Dutch Africa Line with8.48 percent and 8.3 percent in Delmas. The totalpayload for the country was 2,401,108.66 tons.TOTAL 2.317.350,65AGENTES MARITIMOSPOSIÇÃO ID DESIGNAÇÃO DO AGENTE MARÍTIMOS TONELADAS % NO GERAL1 1102 SUN SHIPPING LTD 404.427,06 16.843,342 1142 NILE DUTCH AFRICA LINE 203.501,75 8.475,323 101 DELMAS 201.403,04 8.387,924 1184 CHARTER_PARTIES 176.756,76 7.361,475 MAERSK 139.668,36 5.816,836 1206 SAFMARINE CONTAINER LINES N.V. 101.696,85 4.235,417 1207 GRIMALDI GROUP 80.112,80 3.336,498 1246 WAN BONG CHARTERING COMPANY LTD. 79.122,05 3.295,239 1266 WESTERN BULK 47.170,00 1.964,5110 1267 UAL EUROPE 46.106,89 1.920,2311 1287 SAGA SHIPHOLDING (NORWAY) AS 44.324,75 1.846,0112 1327 PIL 42.648,71 1.776,2113 1347 MSC MEDITERRANEAN SHIPPING COMPANY 40.398,02 1.682,4714 1387 FLEET MARINE INC., MONROVIA, LIBERIA 37.240,24 1.550,9615 1407 LIN LINES 35.146,63 1.463,7716 161 JIT INTERNATIONAL CORPORATION LIMITED 35.125,41 1.462,8817 1729 H.D INTERNATIONAL SHIPPING LIMITED 30.601,91 1.274,4918 1789 CMA CGM S.A. 28.284,05 1.177,9519 181 NIKKA FINANCE INC-MARSHALL ISLANDS 28.014,53 1.166,7320 1849 SAT SHIPPING INVESTMENT SA 27.495,30 1.145,11OUTROS 571.368,55 23,821083 TOTAL 2.401.108,66 100PRINCIPAIS AGENTES MARITIMOS - <strong>1º</strong> TRIMESTRE / <strong>2010</strong>SHIPPERS COMPANY/AGENCY
ANALISE COMPARATIVA <strong>2010</strong> - PRODUTOSMOST IMPORTED PRODUCTS IN <strong>2010</strong>A ANALISE COMPARATIVATONELADASPOSIÇÃO CLASSE CATEGORIA PRODUTO I TRIM <strong>2010</strong> 4 TRIME 2009 DIFERENÇA VARIAÇÂO*60 94 06 Construções pré - fabricadas 6.384,88 6.081,88 303,00 4,9861 68 10 Obras <strong>de</strong> cimento, <strong>de</strong> betão (concreto) ou <strong>de</strong> pedra artificial, mesmo armadas 6.155,14 - 6.155,14 NA62 69 07Ladrilhos e placas (lajes) para pavimentação ou revestimento, não vidrados nem esm<strong>alta</strong>dos, <strong>de</strong> cerâmica, cubos, pastilhas e artigos semelhantes,para mosaicos, não vidrados nem esm<strong>alta</strong>dos, <strong>de</strong> cerâmica, mesmo com suporte 5.993,14 17.298,87 -11.305,73 -65,3663 01 01 Animais vivos das espécies cavalar, asinina e muar 5.968,86 - 5.968,86 NA64 07 13 Legumes <strong>de</strong> vagem, secos, em grão, mesmo pelados ou partidos 5.612,75 3.700,59 1.912,16 51,6765 89 01 Transatlânticos, barcos <strong>de</strong> cruzeiro, ferry-boats, cargueiros, chatas e embarcações semelhantes, para o transporte <strong>de</strong> pessoas ou <strong>de</strong> mercadorias: 5.608,45 - 5.608,45 NA66 19 05Produtos <strong>de</strong> padaria, pastelaria ou da indústria <strong>de</strong> bolachas e biscoitos, mesmo adicionados <strong>de</strong> cacau, hóstias, cápsulas vazias para medicamentos,obreias, pastas secas <strong>de</strong> farinha, amido ou <strong>de</strong> fécula, em folhas, e produtos semelhantes 5.599,85 11.200,02 -5.600,17 -50,0067 68 09 Obras <strong>de</strong> gesso ou <strong>de</strong> composições à base <strong>de</strong> gesso 5.360,20 5.238,01 122,19 2,3368 72 16 Perfis <strong>de</strong> ferro ou aço não ligado 5.295,60 3.685,76 1.609,84 43,6869 20 02 Tomates preparados ou conservados, excepto em vinagre ou em ácido acético 5.282,78 6.109,86 -827,08 -13,5470 39 26 Outras obras <strong>de</strong> plástico e obras <strong>de</strong> outras matérias das posições 3901 a 3914 5.158,23 5.158,42 -0,19 0,0071 02 06 Miu<strong>de</strong>zas comestíveis <strong>de</strong> animais das espécies bovina, suína, ovina, caprina, cavalar, asinina e muar, frescas, refrigeradas ou congeladas 5.065,31 4.797,22 268,09 5,5972 25 26 Esteatite natural, mesmo <strong>de</strong>sbastada ou simplesmente cortada à serra ou por outro meio, em blocos ou placas <strong>de</strong> forma quadrada ou rectangular, talco 5.059,24 - 5.059,24 NA73 96 01Marfim, osso, carapaça <strong>de</strong> tartaruga, chifre, pontas, coral, madre-pérola e outras matérias animais para entalhar, trabalhos e suas obras (incluídasas obras obtidas por moldagem) 5.039,67 51.074,50 -46.034,83 -90,1374 44 12 Ma<strong>de</strong>ira contraplacada ou compensada, ma<strong>de</strong>ira folheada, e ma<strong>de</strong>iras estratificadas semelhantes 5.030,42 5.563,24 -532,82 -9,5875 22 08 Álcool etílico não <strong>de</strong>snaturado, com um teor alcoólico em volume inferior a 80 % vol, aguar<strong>de</strong>ntes, licores e outras bebidas espirituosas 4.993,06 10.722,14 -5.729,08 -53,4376 84 18Refrigeradores, congeladores (freezers) e outros materiais, máquinas e aparelhos para a produção <strong>de</strong> frio, com equipamento eléctrico ououtro, bombas <strong>de</strong> calor excluídas as máquinas e aparelhos <strong>de</strong> ar condicionado da posição 8415 4.991,65 4.893,16 98,49 2,0177 73 10Reservatórios, barris, tambores, latas, caixas e recipientes semelhantes para quaisquer matérias (excepto gases comprimidos ou liquefeitos) <strong>de</strong> ferro fundido, ferro ouaço, <strong>de</strong> capacida<strong>de</strong> não superior a 300 litros, sem dispositivos mecânicos ou térmicos, mesmo com revestimento interior ou calorífugo 4.970,20 8.852,48 -3.882,28 -43,8678 64 02 Outro calçado com sola exterior e parte superior <strong>de</strong> borracha ou plástico 4.940,50 4.560,25 380,25 8,3479 83 1180 38 2481 68 02Fios, varetas, tubos, chapas, eléctrodos e artefactos semelhantes, <strong>de</strong> metais comuns ou <strong>de</strong> carbonetos metálicos, revestidos interior ou exteriormente<strong>de</strong> <strong>de</strong>capantes ou <strong>de</strong> fun<strong>de</strong>ntes, para soldadura (soldagem) ou <strong>de</strong>pósito <strong>de</strong> metal ou <strong>de</strong> carbonetos metálicos, fios e varetas, <strong>de</strong> pós<strong>de</strong> metais comuns aglomerados, para metalização por projecção 4.825,66 - 4.825,66 NAAglutinantes preparados para mol<strong>de</strong>s ou para núcleos <strong>de</strong> fundição, produtos químicos e preparações das indústrias químicas ou das indústriasconexas (incluídos os constituídos por misturas <strong>de</strong> produtos naturais), não especificados nem compreendidos em outras posições: produtosresiduais das indústrias químicas ou das industrias conexas, não especificados nem compreendidos em outras posições 4.775,71 3.344,85 1.430,86 42,78Pedras <strong>de</strong> cantaria ou <strong>de</strong> construção (excepto <strong>de</strong> ardósia) trabalhadas e obras <strong>de</strong>s tas pedras, excepto as da posição 6801, cubos, pastilhas e artigossemelhantes, para mosaicos, <strong>de</strong> pedra natural (incluída a ardósia) mesmo com suporte, grânulos, fragmentos e pós, <strong>de</strong> pedra natural (incluídaa ardósia) corados artificialmente 4.732,10 3.900,52 831,58 21,32
A ANALISE COMPARATIVATONELADASPOSIÇÃO CLASSE CATEGORIA PRODUTO I TRIM <strong>2010</strong> 4 TRIME 2009 DIFERENÇA VARIAÇÂO*82 87 11 Motocicletas (incluídos os ciclomotores) e outros ciclos equipados com motor auxiliar, mesmo com carro lateral, carros laterais 4.694,95 3.995,64 699,31 17,5083 84 74Máquinas e aparelhos, para seleccionar, peneirar, separar, lavar, esmagar, moer, misturar ou amassar terras, pedras, minérios ou outras substânciasminerais sólidas (incluídos os pós e pastas), máquinas para aglomerar ou moldar combustíveis minerais sólidos, pastas cerâmicas,cimento gesso ou outras matérias minerais em pó ou em pasta, máquinas para fazer mol<strong>de</strong>s <strong>de</strong> areia, para fundição 4.615,19 4.703,99 -88,80 -1,8984 38 23 Ácidos gordos (graos) monocarboxílicos industriais, óleos ácidos <strong>de</strong> refinação, álcoois gordos (graxos) industriais 4.411,34 - 4.411,34 NA85 73 11 Recipientes para gases comprimidos ou liquefeitos, <strong>de</strong> ferro fundido, ferro ou aço 4.217,26 4.547,38 -330,12 -7,2686 72 08Produtos laminados planos, <strong>de</strong> ferro ou aço não ligado, <strong>de</strong> largura igual ou superior a 600 mm, laminados a quente, não folheados ouchapeados, nem revestidos 4.158,22 5.817,19 -1.658,97 -28,5287 12 08 Farinhas <strong>de</strong> sementes ou <strong>de</strong> frutos oleaginosos, excepto farinha <strong>de</strong> mostarda 4.044,52 - 4.044,52 NA88 72 28 Barras e perfis, <strong>de</strong> outras ligas <strong>de</strong> aço, barras ocas para perfuração, <strong>de</strong> ligas <strong>de</strong>aço ou <strong>de</strong> aço não ligado 4.038,48 10.131,08 -6.092,60 -60,1489 39 23 Artigos <strong>de</strong> transporte ou <strong>de</strong> embalagem, <strong>de</strong> plásticos, rolhas, tampas, cápsulas e outros dispositivos <strong>de</strong>stinados a fechar recipientes, <strong>de</strong> plástico 4.037,71 5.358,45 -1.320,74 -24,6590 87 16 Reboques e semi-reboques para quaisquer veículos, outros veículos não autopropulsores, suas partes 4.004,08 5.203,28 -1.199,20 -23,0591 28 01 Flúor, cloro, bromo e iodo 3.965,39 4.814,54 -849,15 -17,6492 72 09Produtos laminados planos, <strong>de</strong> ferro ou aço não ligado, <strong>de</strong> largura igual ou superior a 600 mm, laminados a frio, não folheados ou chapeados,nem revestidos 3.892,69 - 3.892,69 NA93 69 04 Tijolos para construção, tijoleiras, tapa-vigas e produtos semelhantes, <strong>de</strong> cerâmica 3.755,02 - 3.755,02 NA94 38 0895 32 1496 44 18Insecticidas, ro<strong>de</strong>nticidas, fungicidas, herbicidas, inibidores <strong>de</strong> germinação e reguladores <strong>de</strong> crescimento para plantas, <strong>de</strong>sinfectantes e produtossemelhantes apresentados em formas ou embalagens para venda a retalho ou como preparações ou ainda sob a forma <strong>de</strong> artigos, taiscomo fitas, mechas e velas sulfuradas e papel mata-moscas 3.649,12 - 3.649,12 NAMástique <strong>de</strong> vidraceiro, cimentos <strong>de</strong> resina e outros mástiques, indutos utilizados em pintura, indutos não refractários do tipo dos utilizadosem alvernaria 3.614,61 3.614,61 NAObras <strong>de</strong> carpintaria para construções, incluídos os painéis celulares, os painéis para soalhos e as fasquias para telhados (shingles e shakes),<strong>de</strong> ma<strong>de</strong>ira 3.570,63 3.471,36 99,27 2,8697 22 01Águas, incluídas as águas minerais, naturais ou artificiais, e as águas gaseificadas, não adicionadas <strong>de</strong> açúcar ou <strong>de</strong> outros edulcorantesnem aromatizadas, gelo e neve 3.466,40 10.741,06 -7.274,66 -67,7398 87 02 Veículos automóveis para o transporte <strong>de</strong> <strong>de</strong>z pessoas ou mais, incluíndo o condutor 3.465,55 3.465,55 NA99 94 01 Assentos (excepto os da posição 9402) mesmo transformáveis em camas, e suas partes 3.404,94 4.599,53 -1.194,59 -25,97100 85 06 Pilhas e baterias <strong>de</strong> pilhas, eléctricas 3.330,45 3.330,45 NA* Os valores da variação foram arrendodados as centésimasANALISE COMPARATIVA <strong>2010</strong> - PRODUTOSMOST IMPORTED PRODUCTS IN <strong>2010</strong>
O Porto <strong>de</strong> Luanda registou, durante o I trimestre<strong>de</strong>ste ano, uma redução <strong>de</strong> 5,14 por cento na entrada<strong>de</strong> contentores <strong>de</strong> 20 pés, totalizando 24.883 contentores,contra 26.232 do IV trimestre do ano passado.Já nos contentores <strong>de</strong> 40 pés, registou-se umaquebra <strong>de</strong> 21,5 por cento. A produção foi <strong>de</strong> 13.927contentores, contra 17.752 contentores do últimotrimestre do ano passado. O segundo maior ponto<strong>de</strong> entrada <strong>de</strong> mercadorias, o Porto do Lobito, onúmero <strong>de</strong> contentores <strong>de</strong> 20 pés caiu 28,5 porcento. Nos contentores <strong>de</strong> 40 pés a queda tambémfoi acentuada, 22,5 por cento.Port of Luanda recor<strong>de</strong>d during the first quarter ofthis year, down 5.14 percent at the entrance of 20-footcontainers, totalling 24 883 containers, compared with26 232 of the IV quarter of last year. Already in the 40-foot containers, there was a <strong>de</strong>cline of 21.5 percent.The production was 13,927 containers, 17,752 containersagainst the final quarter of last year. The secondmajor point of entry of goods, the Port of Lobito, thenumber of 20-foot containers fell 28.5 percent. In the40-foot containers was also accentuated the fall, 22.5percent.ANALISE COMPARATIVA - <strong>2010</strong> - PORTOS DE DESTINOPORTS OF DESTINATION OF GOODS PER UNITS IN <strong>2010</strong>NÚMERO DE UNIDADESCONTENTOR10PORTO I Trim <strong>2010</strong> 4 Trime 2009 DIFERENÇA VARIAÇÃOCABINDA 0 2 -2 -100,00LUANDA 11 6 5 83,33SOYO 0 2 -2 -100,00MALONGO 2 0 2 NATOTAL 38,7987 121,26 -82,4613 -44,036854NÚMERO DE UNIDADESCONTENTOR20PORTO I Trim <strong>2010</strong> 4 Trime 2009 DIFERENÇA VARIAÇÃOCABINDA 1.279 1535 -256 -16,68POINT NOIRE 118 137 -19 -13,87NAMIBE 1.575 1543 32 2,07LUANDA 24.883 26232 -1.349 -5,14LOBITO 2.665 3728 -1.063 -28,51SOYO 488 489 -1 -0,20MALONGO 829 763 66 8,65SONILS 15 32 -17 -53,13ONDJIVA 2 0 2 NAANGOLA 3 0 3 NAPORTO AMBOIM 25 48 -23 -47,92TOTAL 634.951,29 718142,59 -83.191,30 -155,43NÚMERO DE UNIDADESCONTENTOR40PORTO I TRIM <strong>2010</strong> 4 Trime 2009 DIFERENÇA VARIAÇÃOCABINDA 242 455 -213 -46,81POINT NOIRE 35 24 11 45,83NAMIBE 645 989 -344 -34,78LUANDA 13.927 17752 -3825 -21,55LOBITO 1.720 2220 -500 -22,52SOYO 265 312 -47 -15,06MALONGO 62 97 -35 -36,08SONILS 35 15 20 133,33ANY PORT OF ANGOLA 3 0 3 NAPORTO AMBOIM 17 41 -24 -58,54TOTAL 275.162,30 334662,51 -59.500,21 -102,34A ANALISE COMPARATIVANÚMERO DE UNIDADESFRIGO10PORTO I Trim <strong>2010</strong> 4 Trime 2009 DIFERENÇA VARIAÇÃOLUANDA 0 1 -1 -100LOBITO 0 4 -4 -100MALONGO 5 0 5 NAPORTO AMBOIM 0 1 -1 -100TOTAL 45,5694 28,50 17,07 NANÚMERO DE UNIDADESFRIGO20PORTO I Trim <strong>2010</strong> 4 Trime 2009 DIFERENÇA VARIAÇÃOCABINDA 14 22 -8 -36,36POINT NOIRE 2 1 1 100,00NAMIBE 7 9 -2 -22,22LUANDA 95 162 -67 -41,36LOBITO 7 15 -8 -53,33SOYO 86 85 1 1,18MALONGO 105 54 51 94,44TOTAL 3.707,57 4629,65 -922,08 1,11NÚMERO DE UNIDADESFRIGO40PORTO I Trim <strong>2010</strong> 4 Trime 2009 DIFERENÇA VARIAÇÃOCABINDA 78 125 -47 -37,60POINT NOIRE 10 5 5 100,00NAMIBE 47 43 4 9,30LUANDA 2.994 2602 392 15,07LOBITO 147 128 19 14,84SOYO 21 10 11 110,00TOTAL 89.639,45 78365,64 11.273,81 151,10
O Porto <strong>de</strong> Luanda registou, no I trimestre <strong>de</strong>steano, um aumento <strong>de</strong> 1,74 por cento na entrada <strong>de</strong>viaturas, comparativamente ao IV trimestre do anopassado. Foi registada a entrada <strong>de</strong> 14.153 viaturas,contra 13.915 do trimestre anterior. O Porto do Lobitoregistou uma queda <strong>de</strong> 78,5 por cento, fixado em 924viaturas entradas, contra 4.309 viaturas do trimestreanterior. O Porto do Namibe recebeu menos 13,65 porcento <strong>de</strong> viaturas e o Porto <strong>de</strong> Cabinda registou umaqueda <strong>de</strong> 23,64 por cento. No total, o I trimestre <strong>de</strong>steano recebeu 16.276 veículos, contra 19.657 registadosno trimestre anterior, o que representa uma redução<strong>de</strong> 3.381 veículosPort of Luanda registered in the first quarter of thisyear, an increase of 1.74 percent at the entrance of vehicles,compared to the IV quarter of last year . Wasregistered the entry of 14,153 vehicles, against 13,915the previous quarter. Port of Lobito fell by 78.5 percent,set in 924 car entries, compared to 4309 cars in theprevious quarter. The Port of Namibe received 13.65percent fewer cars and Port of Cabinda fell by 23.64percent. In total, the first quarter of this year received16,276 vehicles, against 19,657 registered in the previousquarter, representing a <strong>de</strong>crease of 3381 vehicles.NÚMERO DE UNIDADESVEÍCULOSPORTO I Trim <strong>2010</strong> 4 Trime 2009 DIFERENÇA VARIAÇÃOCABINDA 42 55 -13 -23,64POINT NOIRE 19 9 10 111,11NAMIBE 329 381 -52 -13,65LUANDA 14.157 13915 242 1,74LOBITO 924 4309 -3385 -78,56SOYO 17 50 -33 -66,00MALONGO 0 1 -1 -100,00ANGOLA 27 0 27 NATOTAL 35.481,16 45174,85 -9.693,69 585,14VEÍCULOS TRANSPORTADOS EM CONTENTORESCONTENTOR20PORTO I Trim <strong>2010</strong> 4 Trime 2009 DIFERENÇA VARIAÇÃOCABINDA 4 11 -7 -63,64POINT NOIRE 1 1 0 0,00NAMIBE 5 3 2 66,67LUANDA 129 212 -83 -39,15LOBITO 18 40 -22 -55,00SOYO 2 6 -4 -66,67MALONGO 0 1 -1 -100,00SONILS 1 0 1 NATOTAL 160 274 -114 -157,79VEÍCULOS TRANSPORTADOS EM CONTENTORESCONTENTOR40PORTO I Trim <strong>2010</strong> 4 Trime 2009 DIFERENÇA VARIAÇÃOCABINDA 9 26 -17 -65,38POINT NOIRE 16 11 5 45,45NAMIBE 13 22 -9 -40,91LUANDA 486 501 -15 -2,99LOBITO 56 78 -22 -28,21SOYO 19 23 -4 -17,39MALONGO 0 2 -2 -100,00SONILS 2 0 2 NATOTAL 601 663 -62 -209,43ANALISE COMPARATIVA - / <strong>2010</strong> - PORTOS DE DESTINOPORTS OF DESTINATION OF GOODS PER UNITS IN <strong>2010</strong>
A China e Portugal se mantiveram, no I trimestre<strong>de</strong>ste ano, na li<strong>de</strong>rança dos maiores exportadorespara <strong>Angola</strong>, enquanto a Espanha passou da terceirapara a 17ª posição.A China beneficiu <strong>de</strong> um aumento<strong>de</strong> 45,7 por cento nas suas exportações para <strong>Angola</strong>.Já Portugal, apesar <strong>de</strong> ter registado uma queda <strong>de</strong> 5,por cento nas suas exportações para <strong>Angola</strong>, manteveo segundo lugar. O terceiro é agora a Françaque também viu as exportações caírem (8,8%)mas conseguiu ultrapassar o Brasil, que teve umaqueda maior (25%). No total a China foi responsávelpor 40 por cento das mercadorias que entraramem <strong>Angola</strong>, enquanto Portugal ficou com um saldo<strong>de</strong> 13,2 por cento.China and Portugal remained in the first quarter ofthis year, the lea<strong>de</strong>rship of the largest exporters to <strong>Angola</strong>,while Spain dropped from third to 17th position.China has benefited from a rise of 45.7 percent on itsexports to <strong>Angola</strong>. Already Portugal, <strong>de</strong>spite havingregistered a fall of 5 per cent in its exports to <strong>Angola</strong>,remained in second place. The third is now France thatalso saw exports fall (8.8%) but failed to overcomeBrazil, which had a greater <strong>de</strong>crease (25%). In total,China was responsible for 40 percent of goods entering<strong>Angola</strong>, while Portugal was left with a balance of13.2 percent.ANALISE COMPARATIVA / <strong>2010</strong>- MERCADOSMAJOR IMPORTERS IN <strong>2010</strong>MERCADOS (PAÍSES) MAIS SIGNIFICATIVOSTONELADASPOSIÇÃO ID PAÍS I TRIM <strong>2010</strong> 4 TRIME 2009 DIFERENÇA VARIAÇÃO1 44 China 959.297,22 658.416,75 300.880,47 45,702 171 Portugal 316.732,50 333.763,66 -17.031,16 -5,103 72 França 138.274,57 151.620,32 -13.345,75 -8,804 28 Brasil 123.721,74 165.379,99 -41.658,25 -25,195 24 Bélgica 97.286,93 107.612,66 -10.325,73 -9,606 2 África do Sul (South Africa) 66.192,17 83.779,68 -17.587,51 -20,997 66 Estados Unidos da América 63.205,78 40.531,30 22.674,48 55,948 213 Turquia 54.756,04 41.028,89 13.727,15 33,469 264 Vietname 54.428,12 59.270,66 -4.842,54 -8,1710 61 Emirados Arabes Unidos 48.820,10 50.512,45 -1.692,35 -3,3511 204 Taiwan 48.283,89 1.742,53 46.541,36 2670,9112 106 Índia 45.504,75 45.324,91 179,84 0,4013 40 Canadá 41.895,13 88.525,78 -46.630,65 -52,6714 107 Indonésia 34.832,87 22.161,39 12.671,48 57,1815 13 Argentina 32.749,61 46.430,00 -13.680,39 -29,4616 203 Tailândia 32.560,79 28.486,88 4.073,91 14,3017 63 Espanha 31.246,94 290.721,63 -259.474,69 -89,2518 132 Malásia 28.928,70 19.845,85 9.082,85 45,7719 51 Costa do Marfim 25.306,49 16.330,46 8.976,03 54,9620 174 Reino Unido 18.370,01 5.252,59 13.117,42 249,7321 4 Alemanha (Germany) 16.186,96 18.322,91 -2.135,95 -11,6622 153 Holanda 15.143,47 11.006,05 4.137,42 37,5923 113 Itália 14.575,08 18.743,28 -4.168,20 -22,2424 194 Singapura 11.570,34 12.570,20 -999,86 -7,9525 109 Irão 9.790,52 4.481,63 5.308,89 118,4626 50 Coreia do Sul 8.329,88 18.870,45 -10.540,57 -55,8627 123 Líbano 5.769,13 4.831,99 937,14 19,3928 70 Filipinas 5.647,12 12,91 5.634,21 43642,2229 169 Polónia 5.207,51 636,18 4.571,33 718,5630 60 Egipto 4.309,36 6.965,36 -2.656,00 -38,1331 116 Japão 4.256,11 2.221,09 2.035,02 91,6232 112 Israel 3.784,39 138,81 3.645,58 2626,3133 217 Uruguai 3.097,99 2.127,93 970,06 45,5934 165 Paquistão 2.823,11 3.564,71 -741,60 -20,8035 150 Namíbia 2.722,41 3.290,33 -567,92 -17,2636 137 Marrocos 2.530,81 1.103,35 1.427,46 129,3837 173 Quénia 2.262,39 533,81 1.728,58 323,8238 201 Suécia 2.018,12 3.285,44 -1.267,32 -38,5739 195 Síria 1.995,29 1.809,40 185,89 10,2740 48 Congo 1.747,72 40.558,03 -38.810,31 -95,6941 160 Nova Zelândia 1.621,46 1.244,11 377,35 30,3342 142 México 1.540,22 1.365,00 175,22 12,8443 158 Noruega 1.395,99 1.924,72 -528,73 -27,4744 166 Paraguai 1.321,25 614,61 706,64 114,97
MERCADOS (PAÍSES) MAIS SIGNIFICATIVOSTONELADASPOSIÇÃO ID PAÍS I TRIM <strong>2010</strong> 4 TRIME 2009 DIFERENÇA VARIAÇÃO45 43 Chile 1.020,33 1.366,20 - 345,87 -25,3246 71 Finlândia 783,65 1.370,87 - 587,22 -42,8447 12 Arabia Saudita 759,86 715,16 44,70 6,2548 16 Austrália 725,44 377,35 348,09 92,2549 211 Tunísia 571,76 711,40 - 139,64 -19,6350 197 Sri Lanka 553,9 384,41 169,49 44,0951 156 Nigéria 525,33 4.319,94 - 3.794,61 -87,8452 46 Colômbia 522,9 424,70 98,20 23,1253 67 Estónia 461,58 115,33 346,25 300,2354 21 Bangla<strong>de</strong>sh 430,68 18,34 412,34 2248,3155 136 M<strong>alta</strong> 381,86 - 381,86 NA56 34 Bulgária 290 343,16 - 53,16 -15,4957 139 Maurício 289,95 987,97 - 698,02 -70,6558 55 Dinamarca 230,78 122,15 108,63 88,9359 87 Guine Equatorial 217,97 159,58 58,39 36,5960 172 Qatar 217,72 340,61 - 122,89 -36,0861 182 Rússia 146,14 76,80 69,34 90,2962 127 Lituânia 143,32 174,63 - 31,31 -17,9363 65 Eslovénia 122,64 129,85 - 7,21 -5,5564 75 Gana 112,03 459,38 - 347,35 -75,6165 117 Jordânia 101,22 5,00 96,22 1924,4066 79 Grécia 83,16 66,79 16,37 24,5167 200 Suazilândia 69,91 34,21 35,70 104,3668 53 Croacia 54,8 44,19 10,61 24,0169 7 <strong>Angola</strong> 45,33 - 45,33 NA70 163 Panama 34,54 0,01 34,53 345300,0071 54 Cuba 31,82 159,42 - 127,60 -80,0472 191 Senegal 26,5 20,00 6,50 32,5073 167 Peru 26,1 115,68 - 89,58 -77,4474 205 Tanzânia 25 109,60 - 84,60 -77,1975 207 Togo 22,21 5,94 16,27 273,9176 125 Líbia 12 - 12,00 NA77 1 Afeganistão (Afeganistão) 9,69 206,09 -196,40 -95,3078 39 Camarões 7 15,90 - 8,90 -55,9779 215 Ucrânia 5,31 1.955,53 -1.950,22 -99,7380 73 Gabão 2,71 512,65 - 509,94 -99,4781 140 Mauritânia 1,56 1.484,83 -1.483,27 -99,8982 131 Madagascar 1,01 - 1,01 NAANALISE COMPARATIVA / <strong>2010</strong> - MERCADOSMAJOR IMPORTERS IN <strong>2010</strong>
A Chinangol foi o maior importador para <strong>Angola</strong>no I trimestre <strong>de</strong>ste ano, com 379.781,97 toneladas<strong>de</strong> mercadorias, um aumento <strong>de</strong> 93,7 por cento comparativamenteao último trimestre do ano passado.Já a Socodiba, que ocupa o segundo lugar da listados importadores, aumentou quatro vezes a importação<strong>de</strong> produtos. Destaque para a queda <strong>de</strong> 81 porcento na importação da Nova Cimangola, que foi oprincipal importador no ano passado e que agora é ooitavo da lista. A <strong>Angola</strong> LNG reduziu em 31,7 porcento as suas importações, mas mantém o terceirolugar que ocupava no último trimestre do ano passado.Entre as empresas mais aumentaram as importaçõesestão a Distribuidora (407 %), Wan Peng Ltd(128,9%), Halliburton Overseas (103%), Sécil- Companhia<strong>de</strong> Cimentos (64%) e a Sonangol (46%).Chinangol was the largest importer for <strong>Angola</strong> in thefirst quarter of this year, with 379,781.97 tons of goods,an increase of 93.7 percent compared to last quarter oflast year. Already Socodiba, which ranks in secondplace on the list of importers has increased four timesthe imports. Highlight for fall 81 percent on imports ofNew Cimangola, which was the largest importer lastyear and is now the eighth on the list. The <strong>Angola</strong> LNG<strong>de</strong>creased by 31.7 percent of its imports, but keeps thethird place he occupied in the last quarter of last year.Among the companies most increased their imports areDistribuidora (407%), Wan Peng Ltd (128.9%), HalliburtonOverseas (103%), Secil Cement Company (64%)and Sonangol (46%).ANALISE COMPARATIVA / <strong>2010</strong> - IMPORTADORESMAJOR IMPORTERS IN <strong>2010</strong>A ANALISE COMPARATIVATONELADASPOSIÇÃO ID DESIGNAÇÃO DO IMPORTADOR I TRIM <strong>2010</strong> 4 TRIME 2009 DIFERENÇA VARIAÇÃO1 7996 CHINANGOL LDA 379.781,97 196.046,36 183.735,61 93,722 36813SOCODIBA-SOCIEDADE GERAL DE COMERICO E DISTRIBUICAODE ANGOLA S.A 155.397,56 39.644,18 115.753,38 291,983 31756 ANGOLA LNG LIMITED 98.377,95 144.074,77 - 45.696,82 -31,724 16328 HUA-FENG CONSTRUCAO E ENGENHARIA,LDA 79.038,25 66.531,03 12.507,22 18,805 3764 SECIL-COMPANHIA DE CIMENTOS 74.409,64 45.250,37 29.159,27 64,446 31046 ANGOALISSAR COMERCIO E INDUSTRIA LDA 70.012,69 47.419,57 22.593,12 47,657 38591 MUTEBA DISTRIBUIÇÃO S.A 66.924,45 - 66.924,45 NA8 661 NOVA CIMANGOLA S.A.R.L 47.777,16 258.254,53 - 210.477,37 -81,509 5878 A DISTRIBUIDORA. LDA 44.487,03 8.775,66 35.711,37 406,9410 31389 F.C.K.S. - FABRICA DE CIMENTO DO KWANZA SUL LDA 36.610,32 29.143,47 7.466,85 25,6211 31760AFRICONS SOC. COMERCIO GERAL IMPO.EXPORT CONSTRUCAOCIVIL LDA 32.904,63 37.178,00 - 4.273,37 -11,4912 23239 GRN - GABINETE DE RECONSTRUCAO NACIONAL 31.429,59 57.175,02 - 25.745,43 -45,0313 37846 WAN PENG,LDA 30.601,91 13.364,70 17.237,21 128,9814 5352 SONANGOL - SOC. NACIONAL DE COMBUSTIVEIS DE ANGOLA 30.389,98 20.823,71 9.566,27 45,9415 7876 GOLDEN NEST ANGOLA 24.941,66 - 24.941,66 NA16 145 HALLIBURTON OVERSEAS LTD. 22.738,91 11.217,32 11.521,59 102,7117 31637 ANGOSAL IMPORTACAO E EXPORTACAO LIMITADA 21.990,78 25.843,72 - 3.852,94 -14,9118 34484 ANGO FRIO COMMERCIO GERAL LDA 20.362,97 12.314,20 8.048,77 65,3619 36007 ANGO-EAGLE INVESTIMENT LDA 19.363,94 - 19.363,94 NA20 34311 JAGRAC & DESC. PARTICIPACOES LDA 19.132,38 16.500,38 2.632,00 15,9521 5102 COLFRATE HOLDINGS (ANGOLA) LIMITADA 17.238,67 20.960,15 - 3.721,48 -17,7622 19940 DIMASSABA COMERCIAL AND INDUSTRIAL 16.445,47 9.809,03 6.636,44 67,6623 31504 REFRIANGO-INDUSTRIA E COMERCIO GERAL LIMITADA 16.393,69 24.281,84 - 7.888,15 -32,4924 19951 MI OVERSEAS LTD 14.609,91 8.658,47 5.951,44 68,7425 9468 MAZZARATI - COMERCIO E INDUSTRIA LDA 14.430,42 5.217,03 9.213,39 176,6026 28191 EAA ENTREPOSTO ADUANEIRO DE ANGOLA 14.061,12 26.652,07 - 12.590,95 -47,2427 26889 BP EXPLORATION ANGOLA LTD 14.026,43 3.449,94 10.576,49 306,5728 9436 ACAIL ANGOLA - IND. E COM. DE FERRO S.A. 13.037,50 10.700,01 2.337,49 21,8529 31799 CABINDA GULF 13.005,97 12.186,70 819,27 6,7230 950 IMPORTANGOLA 12.884,93 13.986,81 - 1.101,88 -7,8831 9881 ANGO RAYAN GROUP INTERNACIONAL COM. GERAL LDA 12.328,07 25.724,78 - 13.396,71 -52,0832 7334 ATLAS GRUPO LDA 12.201,15 19.472,52 - 7.271,37 -37,3433 21133 GCT ANGOLA GESTAO COMERCIO TOTAL SA 11.702,35 22.156,39 - 10.454,04 -47,1834 3984 EMPRESA NACIONAL DE ELECTRICIDADE EMPRESA PUBLICA (ENE-E.P.) 11.216,64 5.949,48 5.267,16 88,5335 17474 COMPANHIA UNIAO DE CERVEJAS DE ANGOLA SA - CUCA 10.382,61 3.573,78 6.808,83 190,5236 24736 CHINA ROAD & BRIDGE CORPORATION 10.344,90 8.534,68 1.810,22 21,2137 38188 HK CEG-CONSTRUCTION ENGINEERING GROUP LIMITADA 10.017,36 - 10.017,36 NA
A ANALISE COMPARATIVATONELADASPOSIÇÃO ID DESIGNAÇÃO DO IMPORTADOR I TRIM <strong>2010</strong> 4 TRIME 2009 DIFERENÇA VARIAÇÃO38 33658 RAYAN INVESTMENTS LIMITED 9.950,39 - 9.950,39 NA39 8976 BAI - BANCO AFRICANO DE INVESTIMENTOS SARL 8.845,37 13.100,78 - 4.255,41 -32,4840 5777 BCA - BANCO COMERCIAL ANGOLANO 8.536,28 - 8.536,28 NA41 9369 TOTAL EXPLORATION AND PRODUCTION ANGOLA 8.372,05 16.293,26 - 7.921,21 -48,6242 38046 NOURCO COMERCIO GERAL IMPORT E EXPORT LIMITADA 7.980,71 4.234,11 3.746,60 88,4943 19343 REX TRADING COMPANY LIMITADA 7.904,84 9.022,29 - 1.117,45 -12,3944 6354 ANGLOFLEX LDA 7.816,62 7.463,73 352,89 4,7345 4523 FLORANGO COMERCIO GERAL LDA 7.633,92 6.144,88 1.489,04 24,2346 30857 COBEJE 7.286,77 5.504,20 1.782,57 32,3947 6419 MANSA IMPORTACAO & EXPORTACAO 7.096,33 8.177,95 - 1.081,62 -13,2348 4821 GRUPO AROSFRAN SARL 6.942,97 48.966,73 - 42.023,76 -85,8249 41 COCA COLA BOTTLING LUANDA 6.511,75 15.457,39 - 8.945,64 -57,8750 4545 CABIRE - ALIMENTOS. LDA 6.310,29 3.606,83 2.703,46 74,9551 961 ESSO EXPLORATION 6.018,89 3.580,79 2.438,10 68,0952 32349 NATONG HOLDING CORPORATION LIMITADA 5.927,00 - 5.927,00 NA53 37040 EVERY WHERE GENERAL TRADE CO.,LLC 5.408,57 3.223,40 2.185,17 67,7954 123 ADEGA COOPERATIVA DE AZUEIRA CRL-SUCURSAL 5.403,40 4.384,97 1.018,43 23,2355 36313 SOALIMENTAR,SA 5.260,57 6.849,40 - 1.588,83 -23,2056 6681 ZINZI COMERCIO GERAL 5.234,84 3.883,57 1.351,27 34,7957 643 LUFU - COMERCIO GERAL LTDA 5.223,54 5.175,71 47,83 0,9258 553 FERPINTA ANGOLA COMRCIO E INDUSTRIA LDA 5.162,86 5.912,97 - 750,11 -12,6959 183 CHINA JIANGSU INTERNATIONAL 5.141,48 25.330,39 - 20.188,91 -79,7060 7895 PAQUITA COMERCIO GERAL LDA 5.036,56 4.114,23 922,33 22,4261 31734 FUKUR & FILHOS COMERCIO GERAL IMPORT E EXPORT LIMITADA 4.884,50 4.313,09 571,41 13,2562 6489 ROSILVIA COMERCIAL LTDA 4.834,45 3.730,83 1.103,62 29,5863 873 INTERTRADING COMERCIO GERAL LDA 4.415,96 3.826,70 589,26 15,4064 5872 GRUPO MAXI COMERCIO GERAL IMP E EXP LTD 4.301,80 9.454,44 - 5.152,64 -54,5065 5070 MINHA CASA - COMERCIO GERAL 4.243,44 3.139,20 1.104,24 35,1866 5070 NESTLE ANGOLA LTD 4.164,53 5.263,44 - 1.098,91 -20,8867 8856 RED SEA OSTEL COMERCIO GERAL IMPORT & EXPORT LDA 4.057,16 3.391,54 665,62 19,6368 28483 AFROCHIN INTERNACIONAL LDA 4.056,46 - 4.056,46 NA69 29081 ANGO ERI COMERCIA GERAL IMPORT & EXPORT 3.979,16 5.064,15 - 1.084,99 -21,4270 13160 ICC ANGOLA LDA 3.962,52 4.516,43 - 553,91 -12,2671 5925 AMT (ANGOLA) TRADING LDA 3.946,82 3.740,47 206,35 5,5272 9173 ORGANIZAÇÕES TCIMUNHUNGO COMERCIO GERAL IMPORT E EXPORT 3.937,43 - 3.937,43 NA73 21344 INALCA ANGOLA LTA 3.769,87 3.572,28 197,59 5,5374 25331 LOGISPARK-CENTRO DE APOIO LOGISTICO LDA 3.749,66 - 3.749,66 NA75 9987 ERIANGO COMERCIO GERAL LDA 3.721,22 4.699,28 - 978,06 -20,8176 7898 SOVINHOS LDA 3.595,55 7.104,43 - 3.508,88 -49,3977 3938 SICIE - SOC IND COM IMP EXP LDA. 3.556,11 5.481,16 - 1.925,05 -35,1278 34505 MALEAL, LDA, - IMPORTACAO E EXPORTACAO 3.500,00 4.016,48 - 516,48 -12,8679 30528 ORGANIZAGUES COSAL COMERCIO E SERVIGOS DE ANGOLA LDA 3.469,52 3.079,12 390,40 12,6880 28869 NOCAL - NOVA EMPRESA DE CERVEJAS DE ANGOLA 3.451,27 5.078,02 - 1.626,75 -32,0481 30801 ODEBRECHT ANGOLA PROJECTOS E SERVICOS LTD 3.416,56 9.799,94 - 6.383,38 -65,1482 30919 MOKBEL COLD STORAGE INDUSTRY 3.404,89 - 3.404,89 NA83 9504 BANCO SOL SARL 3.371,28 - 3.371,28 NA84 6733 SANTA ISABEL IMPORTAÇÃO E EXPORTAÇÃO LDA 3.322,90 - 3.322,90 NA85 8769 REPRESENTAGUES LUIS & ANGELO 3.260,62 - 3.260,62 NA86 206 EKA - EMPRESA ANGOLA DE CERVEJA SARL 3.255,50 - 3.255,50 NA87 9456 SIRIUS MATERIAL AGRICOLA LDA 3.235,94 - 3.235,94 NA88 14239 EMPRESA DE CERVEJAS NGOLA 3.192,01 3.449,94 - 257,93 -7,4889 11187 ANGOLA STEEL CORPORATION 3.087,39 25.536,28 - 22.448,89 -87,9190 13256 CASA MILITAR DA PRESIDENCIA DA REPUBLICA DE ANGOLA 3.068,47 27.403,94 - 24.335,47 -88,8091 6675 INDUVE - INDUSTRIAS ANGOLANAS DE OLEOS VEGETAIS.SA 3.064,97 15.995,79 - 12.930,82 -80,8492 2767 DAHLAK TRADING ANGOLA 3.032,59 4.385,69 - 1.353,10 -30,8593 3259 ORGANIZAÇÕES DESENVOLVIMENTO & LIMITADA 3.017,88 - 3.017,88 NA94 16601 CIMIANTO DE ANGOLA SARL 2.980,76 - 2.980,76 NA95 29431 SINOHYDRO CORPORATION LDA 2.949,82 4.886,41 - 1.936,59 -39,6396 9561 AFRI BELG IND. CORP LIMITED 2.918,38 6.905,07 - 3.986,69 -57,7497 5142 BPC - BANCO POUPANGA E CREDITO 2.390,40 - 2.390,40 NAANALISE COMPARATIVA <strong>2010</strong> - IMPORTADORESMAJOR IMPORTERS IN <strong>2010</strong>
A ANALISE COMPARATIVATONELADASPOSIÇÃO ID DESIGNAÇÃO DO IMPORTADOR I TRIM <strong>2010</strong> 4 TRIME 2009 DIFERENÇA VARIAÇÃO98 224 FPAL - FOOD PRODUCTS ANGOLA LDA 2.352,17 - 2.352,17 NA99 20595 NOSSO SUPER GESTCO DE SUPERMERCADOS S.A 2.321,94 8.784,74 - 6.462,80 -73,57100 10706 SOCIEDADE DE CONSTRUCOES SOARES DA COSTA SA 2.311,29 3.701,67 - 1.390,38 -37,56ANALISE COMPARATIVA / <strong>2010</strong>- IMPORTADORESMOST SIGNIFICANT MARKETS (COUNTRY) IN <strong>2010</strong>
A companhia Sun Shipping Ltd foi a que mais se<strong>de</strong>stacou nos primeiros três meses <strong>de</strong>ste ano comum aumento <strong>de</strong> 72,71 na carga transportada para opaís, o que lhe valeu o primeiro lugar na lista dosprincipais armadores. No total, a companhia transportou404.427,06 toneladas <strong>de</strong> Janeiro a Março<strong>de</strong>ste ano, contra 234.163,90 toneladas registadas noúltimo trimestre do ano passado, o que representaum aumento <strong>de</strong> 170.263,16 toneladas. A Nile DutchÁfrica Line, que foi durante o ano passado o principalarmador <strong>de</strong> cargas para <strong>Angola</strong>, teve uma queda <strong>de</strong>22,56 por cento na carga transportada e quedou-sena segunda posição com quase meta<strong>de</strong> da produçãoda Sun Shipping Ltd. A Delma e a Charter Parties tambémaumentaram a carga transportada e posicionaram-senas posições imediatas. A Maersktambém teve uma queda na sua produção (-2,43%)mas manteve a quinta posição.Un Shipping Company Ltd was the one that stoodout in the first three months of this year with an increaseof 72.71 in the cargo into the country, earning him firstplace in the list of major carriers. In total, the airline404,427.06 tons from January to March this year, comparedto 234,163.90 tons recor<strong>de</strong>d in the last quarter oflast year, representing an increase of 170,263.16 tons.The Nile Dutch Africa Line, which was during the lastyear the principal owner of cargo for <strong>Angola</strong>, fell by22.56 percent in cargo and stood in second place withalmost half the output of the Sun Shipping Ltd. Delmaand Charter Parties also increased the load carried andpositioned themselves in the positions immediately.Maersk also had a drop in its production (-2.43%) butremained in fifth place.A ANALISE COMPARATIVATONELADASPOSIÇÃO ID DESIGNAÇÃO DO AGENTE MARÍTIMOS I TRIM <strong>2010</strong> 4 TRIME 2009 DIFERENÇA VARIAÇÃO1 1102 SUN SHIPPING LTD 404.427,06 234.163,90 170.263,16 72,712 1142 NILE DUTCH AFRICA LINE 203.501,75 262.798,81 -59.297,06 -22,563 101 DELMAS 201.403,04 181.909,59 19.493,45 10,724 1184 CHARTER_PARTIES 176.756,76 147.760,38 28.996,38 19,625 41 MAERSK 139.668,36 143.153,42 -3.485,06 -2,436 1206 SAFMARINE CONTAINER LINES N.V. 101.696,85 92.547,39 9.149,46 9,897 1207 GRIMALDI GROUP 80.112,80 107.404,45 -27.291,65 -25,418 1246 WAN BONG CHARTERING COMPANY LTD. 79.122,05 0,00 79.122,05 NA9 1266 WESTERN BULK 47.170,00 50.760,03 -3.590,03 -7,0710 1267 UAL EUROPE 46.106,89 31.498,48 14.608,41 46,3811 1287 SAGA SHIPHOLDING (NORWAY) AS 44.324,75 0,00 44.324,75 NA12 1327 PIL 42.648,71 43.867,27 -1.218,56 -2,7813 1347 MSC MEDITERRANEAN SHIPPING COMPANY 40.398,02 79.641,97 -39.243,95 -49,2814 1387 FLEET MARINE INC., MONROVIA, LIBERIA 37.240,24 0,00 37.240,24 NA15 1407 LIN LINES 35.146,63 37.249,82 -2.103,19 -5,6516 161 JIT INTERNATIONAL CORPORATION LIMITED 35.125,41 0,00 35.125,41 NA17 1729 H.D INTERNATIONAL SHIPPING LIMITED 30.601,91 0,00 30.601,91 NA18 1789 CMA CGM S.A. 28.284,05 0,00 28.284,05 NA19 181 NIKKA FINANCE INC-MARSHALL ISLANDS 28.014,53 0,00 28.014,53 NA20 1849 SAT SHIPPING INVESTMENT SA 27.495,30 0,00 27.495,30 NAANALISE COMPARATIVA / <strong>2010</strong> - AGENTE MARÍTIMOSSHIPPERS COMPANY/AGENCY