january - april - Inma
january - april - Inma
january - april - Inma

You also want an ePaper? Increase the reach of your titles
YUMPU automatically turns print PDFs into web optimized ePapers that Google loves.
Vol. 36, No.1 / 2012 INMATEH - <br />
than the average (nitrate concentration, nutrient density, etc.).<br />
Worth mentioning is the fact that omission of areas<br />
with different properties can have as a cause external<br />
factors like animal fencing being built on farmland or the<br />
use of the soil in other purposes then the agricultural<br />
ones. The soil specific parameters can be modified at a<br />
local level [3] by these external parameters but not<br />
always these variations/ modifications can be detected.<br />
The geometric surface in which these parametric<br />
varations take place is sometimes simply too small to be<br />
detectable.However, reasonably precise maps can be<br />
achieved at lower sampling densities. One of the main<br />
concerns for the farmers and the commercial entities<br />
which are involved in the precision horticulture processes<br />
is the choice for sampling density. The size of the grid by<br />
which the sampling is made depends on the field type<br />
and on the nutrient for which the concentration and<br />
distribution is evaluated – organic material, nitrate<br />
concentration, phosphorus, zinc, etc. Knowing the spatial<br />
distribution of parameters in a given field, helps<br />
determining the grid size and shape, which represents<br />
the actual reason for soil sampling [4].<br />
This paper has as a given objective displaying four<br />
methods for point by point soil sampling: a) the ideal<br />
method by which the sampling procedure takes place b)<br />
the Nebraska method, c) and d) are methods proposed<br />
by the authors of this paper. These methods meant to<br />
give the scientifical or commercial entities which use<br />
them the possibility of obtaining representative soil<br />
samples relative to the spatial distribution or to give them<br />
the opportunity to measure variables that do not have a<br />
continous time variation.<br />
MATERIAL AND METHOD<br />
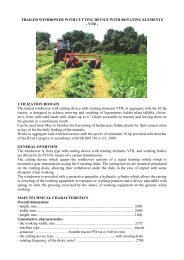
The experimental data that has been used and<br />
prepared in this paper has been obtained as a result of<br />
an experiment that took place in a prune orchard<br />
located in Marquardt, Bornim/Berlin, Germany. The<br />
experiment had as an objective the use of the basic<br />
princliples for soil sampling, but instead of collecting soil<br />
samples it was used the measurement of certain<br />
parameters (relative soil resistivity) with the help of a<br />
set of specific equipment and materials. Generally, it<br />
was desired the on-the-spot measurement of important<br />
variables (sesitivity for example) with the help of a<br />
portable device, easy to use, easy to handle by a<br />
single operator and with a high data acquisition<br />
speed. The sampling density of soil samples or in this<br />
case the density of the points in which the discrete<br />
measurements were completed depends on the crop<br />
type and on the agricultural application. In this case,<br />
the field grid was thus chosen that the trees are to be<br />
found at the intersection of the lines that make up the<br />
grid.<br />
The matrix in which the trees are placed within the<br />
experimental land lot is in the shape of 6 lines arranged by 30<br />
columns and the distances between the trees are known. For<br />
this experiment no GPS coordinates have been used, but<br />
because of the fact that the distances between trees are<br />
constant and foreknown, it was possible that a local 2D<br />
coordinate system be extrapolated for the orchard. The total<br />
number of the trees and implicitly the number of the<br />
measurement points is 180. The trees are individually<br />
numbered so that the relational identification of different<br />
processes between the trees is facilitated. The experiment<br />
states the measurement of the electrical soil resistivity at the<br />
root of each tree that is to be found within the orchard and on<br />
the basis of the collected data, certain areas with similar<br />
values for the monitored values are identified. For this<br />
purposes, the measurements were made with the “4 point<br />
28<br />
densitate de nutrienţi, etc.).<br />
Demn de menţionat este faptul că omisiunea unor<br />
zone diferite din punct de vedere al proprietăţilor poate<br />
avea ca şi cauze factori externi, precum ţarcurile pentru<br />
animale construite pe terenul agricol sau folosirea solului<br />
în alte scopuri decât cele specific agricole. Parametrii<br />
specifici solului pot fi modificaţi la nivel local [3] de aceşti<br />
factori externi însă nu intotdeauna modificările sunt<br />
detectabile. Suprafaţa geometrică în care au loc<br />
respectivele modificări de parametri este uneori prea<br />
mică din punct de vedere fizic pentru a fi detectabilă.<br />
Totuşi, hărţi relativ precise pot fi realizate la densităţi de<br />
eşantionare scăzute. O preocupare principală a<br />
fermierilor şi a societăţilor comerciale implicate în<br />
horticultura de precizie este alegerea densităţii de<br />
eşantionare. Dimensiunea caroiajului după care se face<br />
eşantionarea depinde de teren şi depinde de nutrientul a<br />
cărui concentraţie şi distribuţie este evaluată – materie<br />
organică, nitraţi, fosfor, zinc, etc. Cunoaşterea<br />
variabilităţii spaţiale a terenului ajută la determinarea<br />
optimă a caroiajului, ceea ce reprezintă chiar motivul<br />
eşantionării solului [4].<br />
Lucrarea de faţă îşi propune să prezinte patru metode<br />
de eşanationare punct cu punct a solurilor agricole: a)<br />
metoda ideală prin care se realizează procedura de<br />
eşantionare b) metoda Nebraska, iar c) şi d) sunt metode<br />
originale, propuse de către autorii acestei lucrări.<br />
Metodele sunt menite să ofere posibilitatea de a obţine<br />
probe de sol reprezentative din punct de vedere a<br />
distribuţiei spaţiale sau de a efectua măsurători<br />
punctuale pentru parametri ce nu prezintă o variaţie<br />
continuă în timp.<br />
MATERIAL ŞI METODĂ<br />
Datele experimentale folosite şi prelucrate în lucrarea<br />
de faţă au fost obţinute în urma unui experiment desfăşurat<br />
într-o livada de pruni ce se află în Marquardt, Bornim/Berlin,<br />
Germania. Experimentul a avut ca scop aplicarea principiilor<br />
de bază pentru eşantionarea solurilor, însă în loc de<br />
prelevare de probe de sol s-a folosit măsurarea anumitor<br />
parametri (rezistivitatea aparentă a solului) cu ajutorul<br />
unor echipamente specifice. S-a preferat varianta de<br />
măsurare pe loc a variabilelor relevante (rezistivitatea) cu<br />
ajutorul unui dispozitiv portabil, uşor manevrabil de un singur<br />
operator, în principal datorită vitezei mari de obţinere a<br />
datelor. Densitatea prelevării probelor de sol sau, în cazul de<br />
faţă, densitatea punctelor în care s-au efectuat măsurătorile<br />
discrete în câmp depinde în mod decisiv de tipul de cultură<br />
şi de aplicaţia agricolă. În această aplicaţie, caroiajul a fost<br />
ales în aşa fel încât pomii se găsesc la intersecţia liniilor<br />
perpendiculare ale caroiajului. Matricea după care pomii<br />
se prezintă în lotul experimental este de forma a 6 linii<br />
dispuse pe câte 30 de coloane, iar distanţele dintre pomi<br />
sunt cunoscute.<br />
Matricea în care copacii sunt plasate în teren<br />
experimental este în formă de 6 linii aranjate cu 30 de<br />
coloane şi distanţele dintre copacii sunt cunoscute. În<br />
cadrul experimentului nu s-au folosit coordonate GPS,<br />
însă datorită faptului că distanţele între pomi sunt<br />
constante şi cunoscute, a fost posibil să se extrapoleze<br />
un sistem local de coordonate 2D pentru livadă.<br />
Numărul total al pomilor şi implicit numărul punctelor de<br />
măsurare este 180. Pomii sunt numerotaţi individual<br />
astfel încât să se faciliteze identificarea relaţională a<br />
diferitelor procese între pomi. Experimentul prevede<br />
măsurarea rezistivităţii electrice a solului la rădăcina<br />
fiecărui pom din cadrul livezii iar pe baza datelor<br />
colectate se identifică anumite zone cu valori<br />
asemănătoare ale variabilelor monitorizate. În acest<br />
scop, măsurătoarile au fost efectuate cu aparatul “4