
Create successful ePaper yourself
Turn your PDF publications into a flip-book with our unique Google optimized e-Paper software.
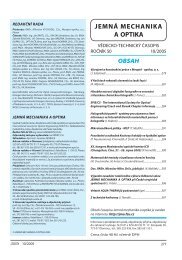
Fig. 4 Calculated and smoothed average scattering spectra S h ( λ),<br />
S g ( λ)and<br />
S r ( λ)which<br />
relate to the spectra of Fig. 3<br />
Beside the possibility of direct determination of the contents<br />
κ h , κ g and κ r by a X-ray measuring manner, also the K-M Eqs. (11)<br />
and (12) are exploitable for such a purpose. The exploitation consists<br />
in assessment of A M (λ) and S M (λ) by spectrophotometrical<br />
measurements of several soil-white standard mixtures. This gives,<br />
both for Eqs. (11) and (12), two unknowns, i.e. c h and c g , because<br />
also Eq. (10) is valid. Therefore, data for only one wavelength are<br />
sufficient to solve the system. However, the useful data can be also<br />
obtained only by Eq. (11), or by Eq. (12), for two or more different<br />
wavelengths. When more than two wavelengths are used, the number<br />
m of equations exceeds the number of unknowns (m>2). In this case<br />
the minimization least – squares approach can be used to obtain the<br />
best values for c h and c g . In [4] it is referred that for 98 soils and 31<br />
��<br />
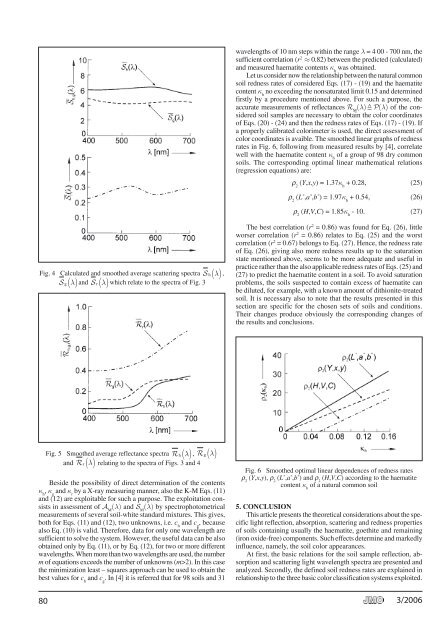
Fig. 5 Smoothed average reflectance spectra Rh ( λ),<br />
Rg λ<br />
and Rr λ<br />
( ) relating to the spectra of Figs. 3 and 4<br />
( )<br />
wavelengths of 10 nm steps within the range λ = 4 00 - 700 nm, the<br />
sufficient correlation (r 2 ≈ 0.82) between the predicted (calculated)<br />
and measured haematite contents κ h was obtained.<br />
Let us consider now the relationship between the natural common<br />
soil redness rates of considered Eqs. (17) - (19) and the haematite<br />
content κ h no exceeding the nonsaturated limit 0.15 and determined<br />
firstly by a procedure mentioned above. For such a purpose, the<br />
accurate measurements of reflectances R M (λ) � P(λ) of the considered<br />
soil samples are necessary to obtain the color coordinates<br />
of Eqs. (20) - (24) and then the redness rates of Eqs. (17) - (19). If<br />
a properly calibrated colorimeter is used, the direct assessment of<br />
color coordinates is avaible. The smoothed linear graphs of redness<br />
rates in Fig. 6, following from measured results by [4], correlate<br />
well with the haematite content κ h of a group of 98 dry common<br />
soils. The corresponding optimal linear mathematical relations<br />
(regression equations) are:<br />
r 2 (Y,x,y) = 1.37κ h + 0.28, (25)<br />
r 2 (L * ,a * ,b * ) = 1.97κ h + 0.54, (26)<br />
r 2 (H,V,C) = 1.85κ h - 10. (27)<br />
The best correlation (r 2 = 0.86) was found for Eq. (26), little<br />
worser correlation (r 2 = 0.86) relates to Eq. (25) and the worst<br />
correlation (r 2 = 0.67) belongs to Eq. (27). Hence, the redness rate<br />
of Eq. (26), giving also more redness results up to the saturation<br />
state mentioned above, seems to be more adequate and useful in<br />
practice rather than the also applicable redness rates of Eqs. (25) and<br />
(27) to predict the haematite content in a soil. To avoid saturation<br />
problems, the soils suspected to contain excess of haematite can<br />
be diluted, for example, with a known amount of dithionite-treated<br />
soil. It is necessary also to note that the results presented in this<br />
section are specific for the chosen sets of soils and conditions.<br />
Their changes produce obviously the corresponding changes of<br />
the results and conclusions.<br />
Fig. 6 Smoothed optimal linear dependences of redness rates<br />
r 2 (Y,x,y), r 2 (L * ,a * ,b * ) and r 2 (H,V,C) according to the haematite<br />
content κ h of a natural common soil<br />
5. CONCLUSION<br />
This article presents the theoretical considerations about the specific<br />
light reflection, absorption, scattering and redness properties<br />
of soils containing usually the haematite, goethite and remaining<br />
(iron oxide-free) components. Such effects determine and markedly<br />
influence, namely, the soil color appearances.<br />
At first, the basic relations for the soil sample reflection, absorption<br />
and scattering light wavelength spectra are presented and<br />
analyzed. Secondly, the defined soil redness rates are explained in<br />
relationship to the three basic color classification systems exploited.<br />
������