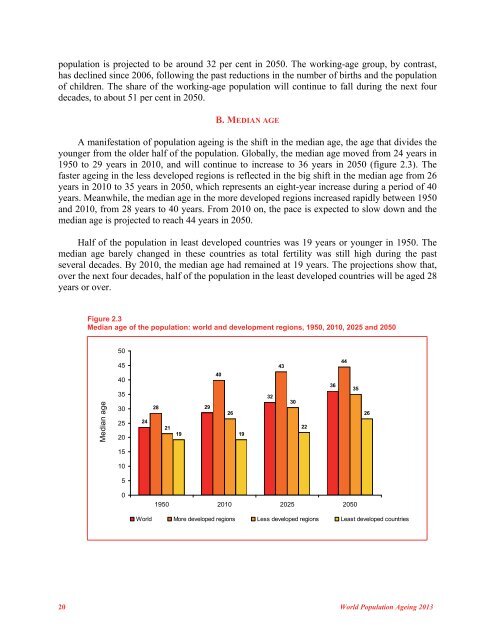
population is projected to be around 32 per cent in 2050. The working-age group, by contrast,has declined since 2006, following the past reductions in the number of births and the populationof children. The share of the working-age population will continue to fall during the next fourdecades, to about 51 per cent in 2050.B. MEDIAN AGEA manifestation of population ageing is the shift in the median age, the age that divides theyounger from the older half of the population. Globally, the median age moved from 24 years in1950 to 29 years in 2010, and will continue to increase to 36 years in 2050 (figure 2.3). Thefaster ageing in the less developed regions is reflected in the big shift in the median age from 26years in 2010 to 35 years in 2050, which represents an eight-year increase during a period of 40years. Meanwhile, the median age in the more developed regions increased rapidly between 1950and 2010, from 28 years to 40 years. From 2010 on, the pace is expected to slow down and themedian age is projected to reach 44 years in 2050.Half of the population in least developed countries was 19 years or younger in 1950. Themedian age barely changed in these countries as total fertility was still high during the pastseveral decades. By 2010, the median age had remained at 19 years. The projections show that,over the next four decades, half of the population in the least developed countries will be aged 28years or over.Figure 2.3Median age of the population: world and development regions, 1950, 2010, 2025 and 205050Median age45403530252024282140292619 1932433022364435261510501950 2010 2025 2050World More developed regions Less developed regions Least developed countries20 World Population Ageing 2013
Japan, Germany and Italy are the countries with the highest median ages in the world. InJapan, more than half of the population was older than 45 years in 2010, and its median age isprojected to rise to 53 years in 2050. Japan is thus experiencing rapid ageing, at a faster speedthan any other developed country. But Europe is ageing fast as well; by 2050, Bosnia andHerzegovina, Germany, Malta, Portugal, Serbia and Spain are projected to attain median ages of50 years or more.Among developing countries or areas, Hong Kong Special Administrative Region (SAR) ofChina and Martinique had relatively old age structures, with a median age of 40 years or more in2010. In the next four decades, virtually all developing countries are projected to age further. By2050, Cuba, Hong Kong SAR of China, Martinique, Oman, Qatar, Republic of Korea, Singaporeand Thailand are expected to attain median ages of 50 years or higher.C. DEPENDENCY RATIOThe demographic dependency ratio is a simple indicator of the relationship between thepopulation in mostly dependent ages and the population in the main working ages. It is definedas the ratio of the number of children under age 15 plus older persons aged 65 years or over, tothe number of persons aged 15 to 64 years. The ratio is generally used as an indicator of theburden of demographic dependency in a population; that is, how many “dependents” need to besupported by each person of working age. Support for dependents can be provided in variousways (see chapter 4), including familial and public transfers. This simple dependency ratioimplicitly assumes that all persons younger than 15 years and older than 65 years areunproductive and that all persons aged 15 to 64 years are productive, which is not always thecase. For example, in the less developed regions, there are significant numbers of workers amongchildren under the age of 15 and persons aged 65. In middle and high-income countries, manyyoung adults are not fully productive until in their late twenties. The dependency ratio istherefore a good initial approximation to assess the degree of economic-demographicdependency in a society, but it should be interpreted with caution. 10The dependency ratio is at its minimum in the worldThe dependency ratio peaked at 76 dependents per 100 working-age persons at the worldlevel and at 84 per 100 in the less developed regions. These high levels were reached in 1965, asa result of high fertility rates in the 1950s and 1960s. As total fertility declined, the worlddependency ratio also started to fall gradually, to about 52 per 100 in 2013. In the moredeveloped regions, the highest value for the dependency ratio (58 per 100) was reached in 1960,a few years earlier than in the less developed regions.After falling for about four decades, the world dependency ratio is approaching a minimumin the present decade, and will begin to rise soon (figure 2.4). Globally, the minimum of 52dependents was reached in 2010 and it is projected to stay nearly at that level for about 15 years.The dependency ratio is expected to rise to 58 per 100 in 2050 and to increase further by the endof the century. The turning point is particularly sharp in the more developed regions, where the10 In section E of this chapter, a brief analysis of economic dependency and support ratios is presented, based on newly availableinformation from National Transfer Accounts (see http://ntaccounts.org/web/nta/show/).United Nations Department of Economic and Social Affairs ǀ Population Division 21