India
1594.full
1594.full

Create successful ePaper yourself
Turn your PDF publications into a flip-book with our unique Google optimized e-Paper software.
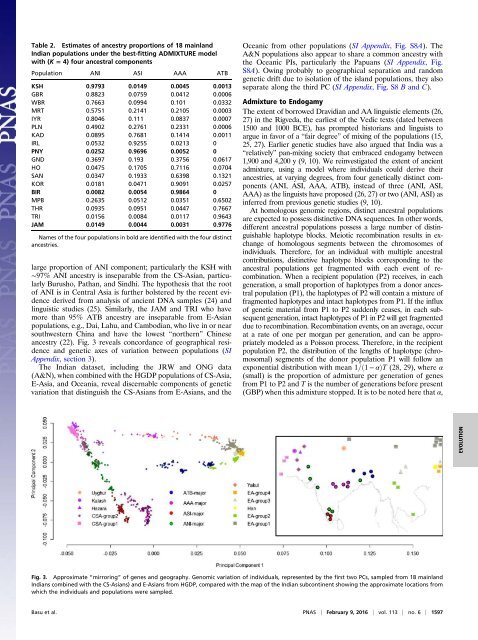
Table 2. Estimates of ancestry proportions of 18 mainland<br />
<strong>India</strong>n populations under the best-fitting ADMIXTURE model<br />
with (K = 4) four ancestral components<br />
Population ANI ASI AAA ATB<br />
KSH 0.9793 0.0149 0.0045 0.0013<br />
GBR 0.8823 0.0759 0.0412 0.0006<br />
WBR 0.7663 0.0994 0.101 0.0332<br />
MRT 0.5751 0.2141 0.2105 0.0003<br />
IYR 0.8046 0.111 0.0837 0.0007<br />
PLN 0.4902 0.2761 0.2331 0.0006<br />
KAD 0.0895 0.7681 0.1414 0.0011<br />
IRL 0.0532 0.9255 0.0213 0<br />
PNY 0.0252 0.9696 0.0052 0<br />
GND 0.3697 0.193 0.3756 0.0617<br />
HO 0.0475 0.1705 0.7116 0.0704<br />
SAN 0.0347 0.1933 0.6398 0.1321<br />
KOR 0.0181 0.0471 0.9091 0.0257<br />
BIR 0.0082 0.0054 0.9864 0<br />
MPB 0.2635 0.0512 0.0351 0.6502<br />
THR 0.0935 0.0951 0.0447 0.7667<br />
TRI 0.0156 0.0084 0.0117 0.9643<br />
JAM 0.0149 0.0044 0.0031 0.9776<br />
Names of the four populations in bold are identified with the four distinct<br />
ancestries.<br />
large proportion of ANI component; particularly the KSH with<br />
∼97% ANI ancestry is inseparable from the CS-Asian, particularly<br />
Burusho, Pathan, and Sindhi. The hypothesis that the root<br />
of ANI is in Central Asia is further bolstered by the recent evidence<br />
derived from analysis of ancient DNA samples (24) and<br />
linguistic studies (25). Similarly, the JAM and TRI who have<br />
more than 95% ATB ancestry are inseparable from E-Asian<br />
populations, e.g., Dai, Lahu, and Cambodian, who live in or near<br />
southwestern China and have the lowest “northern” Chinese<br />
ancestry (22). Fig. 3 reveals concordance of geographical residence<br />
and genetic axes of variation between populations (SI<br />
Appendix, section 3).<br />
The <strong>India</strong>n dataset, including the JRW and ONG data<br />
(A&N), when combined with the HGDP populations of CS-Asia,<br />
E-Asia, and Oceania, reveal discernable components of genetic<br />
variation that distinguish the CS-Asians from E-Asians, and the<br />
Oceanic from other populations (SI Appendix, Fig. S8A). The<br />
A&N populations also appear to share a common ancestry with<br />
the Oceanic PIs, particularly the Papuans (SI Appendix, Fig.<br />
S8A). Owing probably to geographical separation and random<br />
genetic drift due to isolation of the island populations, they also<br />
separate along the third PC (SI Appendix, Fig. S8 B and C).<br />
Admixture to Endogamy<br />
The extent of borrowed Dravidian and AA linguistic elements (26,<br />
27) in the Rigveda, the earliest of the Vedic texts (dated between<br />
1500 and 1000 BCE), has prompted historians and linguists to<br />
argue in favor of a “fair degree” of mixing of the populations (15,<br />
25, 27). Earlier genetic studies have also argued that <strong>India</strong> was a<br />
“relatively” pan-mixing society that embraced endogamy between<br />
1,900 and 4,200 y (9, 10). We reinvestigated the extent of ancient<br />
admixture, using a model where individuals could derive their<br />
ancestries, at varying degrees, from four genetically distinct components<br />
(ANI, ASI, AAA, ATB), instead of three (ANI, ASI,<br />
AAA) as the linguists have proposed (26, 27) or two (ANI, ASI) as<br />
inferred from previous genetic studies (9, 10).<br />
At homologous genomic regions, distinct ancestral populations<br />
are expected to possess distinctive DNA sequences. In other words,<br />
different ancestral populations possess a large number of distinguishable<br />
haplotype blocks. Meiotic recombination results in exchange<br />
of homologous segments between the chromosomes of<br />
individuals. Therefore, for an individual with multiple ancestral<br />
contributions, distinctive haplotype blocks corresponding to the<br />
ancestral populations get fragmented with each event of recombination.<br />
When a recipient population (P2) receives, in each<br />
generation, a small proportion of haplotypes from a donor ancestral<br />
population (P1), the haplotypes of P2 will contain a mixture of<br />
fragmented haplotypes and intact haplotypes from P1. If the influx<br />
of genetic material from P1 to P2 suddenly ceases, in each subsequent<br />
generation, intact haplotypes of P1 in P2 will get fragmented<br />
due to recombination. Recombination events, on an average, occur<br />
at a rate of one per morgan per generation, and can be appropriately<br />
modeled as a Poisson process. Therefore, in the recipient<br />
population P2, the distribution of the lengths of haplotype (chromosomal)<br />
segments of the donor population P1 will follow an<br />
exponential distribution with mean 1=ð1 − αÞT (28, 29), where α<br />
(small) is the proportion of admixture per generation of genes<br />
from P1 to P2 and T is the number of generations before present<br />
(GBP) when this admixture stopped. It is to be noted here that α,<br />
EVOLUTION<br />
Fig. 3. Approximate “mirroring” of genes and geography. Genomic variation of individuals, represented by the first two PCs, sampled from 18 mainland<br />
<strong>India</strong>ns combined with the CS-Asians) and E-Asians from HGDP, compared with the map of the <strong>India</strong>n subcontinent showing the approximate locations from<br />
which the individuals and populations were sampled.<br />
Basuetal. PNAS | February 9, 2016 | vol. 113 | no. 6 | 1597