News Release
eta20170209
eta20170209

Create successful ePaper yourself
Turn your PDF publications into a flip-book with our unique Google optimized e-Paper software.
<strong>News</strong> <strong>Release</strong><br />
Connect with DOL at<br />
http://blog.dol.gov<br />
TRANSMISSION OF MATERIALS IN THIS RELEASE IS EMBARGOED UNTIL<br />
8:30 A.M. (Eastern) Thursday, February 9, 2017<br />
UNEMPLOYMENT INSURANCE WEEKLY CLAIMS<br />
SEASONALLY ADJUSTED DATA<br />
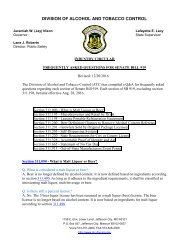
In the week ending February 4, the advance figure for seasonally adjusted initial claims was 234,000, a decrease of 12,000 from<br />
the previous week's unrevised level of 246,000. The 4-week moving average was 244,250, a decrease of 3,750 from the previous<br />
week's unrevised average of 248,000. This is the lowest level for this average since November 3, 1973 when it was 244,000.<br />
The advance seasonally adjusted insured unemployment rate was 1.5 percent for the week ending January 28, unchanged from<br />
the previous week's unrevised rate. The advance number for seasonally adjusted insured unemployment during the week ending<br />
January 28 was 2,078,000, an increase of 15,000 from the previous week's revised level. The previous week's level was revised<br />
down by 1,000 from 2,064,000 to 2,063,000. The 4-week moving average was 2,075,750, a decrease of 3,750 from the previous<br />
week's revised average. The previous week's average was revised down by 250 from 2,079,750 to 2,079,500.
UNADJUSTED DATA<br />
The advance number of actual initial claims under state programs, unadjusted, totaled 259,545 in the week ending February 4, a<br />
decrease of 19,099 (or -6.9 percent) from the previous week. The seasonal factors had expected a decrease of 5,892 (or -2.1<br />
percent) from the previous week. There were 290,796 initial claims in the comparable week in 2016.<br />
The advance unadjusted insured unemployment rate was 1.8 percent during the week ending January 28, unchanged from the prior<br />
week. The advance unadjusted number for persons claiming UI benefits in state programs totaled 2,481,320, a decrease of 13,265<br />
(or -0.5 percent) from the preceding week. The seasonal factors had expected a decrease of 30,950 (or -1.2 percent) from the<br />
previous week. A year earlier the rate was 2.0 percent and the volume was 2,680,598.<br />
The total number of people claiming benefits in all programs for the week ending January 21 was 2,538,312, an increase of 32,996<br />
from the previous week. There were 2,739,533 persons claiming benefits in all programs in the comparable week in 2016.<br />
No state was triggered "on" the Extended Benefits program during the week ending January 21.<br />
Initial claims for UI benefits filed by former Federal civilian employees totaled 1,556 in the week ending January 28, an increase of<br />
549 from the prior week. There were 932 initial claims filed by newly discharged veterans, an increase of 156 from the preceding<br />
week.<br />
There were 14,785 former Federal civilian employees claiming UI benefits for the week ending January 21, an increase of 1,559<br />
from the previous week. Newly discharged veterans claiming benefits totaled 12,303, an increase of 40 from the prior week.<br />
The highest insured unemployment rates in the week ending January 21 were in Alaska (4.8), Connecticut (3.1), Montana (3.1),<br />
New Jersey (3.1), Rhode Island (2.8), Illinois (2.7), Massachusetts (2.7), Pennsylvania (2.7), Puerto Rico (2.7), and California (2.6).
The largest increases in initial claims for the week ending January 28 were in Ohio (+3,659), Indiana (+755), Florida (+741),<br />
Oregon (+700), and Wisconsin (+616), while the largest decreases were in California (-8,089), Washington (-564), Pennsylvania (-<br />
350), Puerto Rico (-325), and Virginia (-304).
UNEMPLOYMENT INSURANCE DATA FOR REGULAR STATE PROGRAMS<br />
WEEK ENDING February 4 January 28 Change January 21<br />
Prior<br />
Year 1<br />
Initial Claims (SA) 234,000 246,000 -12,000 260,000 259,000<br />
Initial Claims (NSA) 259,545 278,644 -19,099 281,787 290,796<br />
4-Wk Moving Average (SA) 244,250 248,000 -3,750 245,750 277,750<br />
WEEK ENDING January 28 January 21 Change January 14<br />
Prior<br />
Year 1<br />
Insured Unemployment (SA) 2,078,000 2,063,000 +15,000 2,103,000 2,234,000<br />
Insured Unemployment (NSA) 2,481,320 2,494,585 -13,265 2,464,349 2,680,598<br />
4-Wk Moving Average (SA) 2,075,750 2,079,500 -3,750 2,092,750 2,237,250<br />
Insured Unemployment Rate (SA) 2 1.5% 1.5% 0.0 1.5% 1.6%<br />
Insured Unemployment Rate (NSA) 2 1.8% 1.8% 0.0 1.8% 2.0%<br />
INITIAL CLAIMS FILED IN FEDERAL PROGRAMS (UNADJUSTED)<br />
WEEK ENDING January 28 January 21 Change Prior Year 1<br />
Federal Employees (UCFE) 1,556 1,007 +549 1,022<br />
Newly Discharged Veterans (UCX) 932 776 +156 1,180<br />
PERSONS CLAIMING UI BENEFITS IN ALL PROGRAMS (UNADJUSTED)<br />
WEEK ENDING January 21 January 14 Change Prior Year 1<br />
Regular State 2,490,827 2,460,515 +30,312 2,683,949<br />
Federal Employees 14,785 13,226 +1,559 15,233<br />
Newly Discharged Veterans 12,303 12,263 +40 16,304<br />
Extended Benefits 3 0 0 0 0<br />
State Additional Benefits 4 7,706 6,834 +872 7,285<br />
STC / Workshare 5 12,691 12,478 +213 16,762<br />
TOTAL 2,538,312 2,505,316 +32,996 2,739,533<br />
FOOTNOTES<br />
SA - Seasonally Adjusted Data, NSA - Not Seasonally Adjusted Data<br />
1. Prior year is comparable to most recent data.<br />
2. Most recent week used covered employment of 138,930,224 as denominator.<br />
3. Information on the EB program can be found here: EB Program information<br />
4. Some states maintain additional benefit programs for those claimants who exhaust regular, extended and emergency benefits. Information<br />
on states that participate, and the extent of benefits paid, can be found starting on page 4-5 of this link: Extensions and Special Programs<br />
PDF<br />
5. Information on STC/Worksharing can be found starting on page 4-9 of the following link: Extensions and Special Programs PDF
Advance State Claims - Not Seasonally Adjusted<br />
Initial Claims Filed During Week Ended February 4 Insured Unemployment For Week Ended January 28<br />
STATE Advance Prior Wk Change Advance Prior Wk Change<br />
Alabama 2,542 2,936 -394 19,279 20,747 -1,468<br />
Alaska 1,457 1,433 24 13,904 15,027 -1,123<br />
Arizona 4,134 4,205 -71 22,771 25,994 -3,223<br />
Arkansas 1,588 1,947 -359 15,751 17,369 -1,618<br />
California 46,004 53,825 -7,821 414,992 429,836 -14,844<br />
Colorado 2,598 2,589 9 32,269 29,247 3,022<br />
Connecticut 3,880 5,373 -1,493 51,612 50,983 629<br />
Delaware 773 759 14 7,778 7,301 477<br />
District of Columbia 703 414 289 8,467 8,948 -481<br />
Florida 7,537 8,133 -596 37,328 44,812 -7,484<br />
Georgia 7,020 7,189 -169 32,592 35,020 -2,428<br />
Hawaii 1,291 1,320 -29 8,631 7,866 765<br />
Idaho 1,734 1,912 -178 14,269 14,945 -676<br />
Illinois 11,022 11,865 -843 161,623 154,445 7,178<br />
Indiana 3,632 4,700 -1,068 34,486 32,780 1,706<br />
Iowa 3,119 2,694 425 37,072 35,427 1,645<br />
Kansas 2,406 2,510 -104 15,528 16,922 -1,394<br />
Kentucky 2,812 2,800 12 26,255 25,582 673<br />
Louisiana 2,323 2,518 -195 21,778 22,099 -321<br />
Maine 908 1,032 -124 10,416 10,424 -8<br />
Maryland 4,022 4,398 -376 40,704 44,021 -3,317<br />
Massachusetts 6,956 6,938 18 89,862 90,834 -972<br />
Michigan 9,448 10,956 -1,508 92,965 89,592 3,373<br />
Minnesota 4,393 3,982 411 71,431 66,716 4,715<br />
Mississippi 1,106 1,443 -337 10,277 12,361 -2,084<br />
Missouri 4,041 5,041 -1,000 34,433 36,442 -2,009<br />
Montana 978 977 1 14,026 13,760 266<br />
Nebraska 887 1,032 -145 8,789 9,295 -506<br />
Nevada 3,021 3,104 -83 24,092 25,070 -978<br />
New Hampshire 678 710 -32 5,437 5,827 -390<br />
New Jersey 11,018 10,326 692 123,170 120,069 3,101<br />
New Mexico 959 1,115 -156 12,576 12,865 -289<br />
New York 18,764 17,703 1,061 187,026 185,144 1,882<br />
North Carolina 4,111 3,953 158 26,903 27,759 -856<br />
North Dakota 892 770 122 11,543 8,894 2,649<br />
Ohio 8,938 11,867 -2,929 87,910 84,322 3,588<br />
Oklahoma 1,572 1,740 -168 17,757 18,484 -727<br />
Oregon 4,605 7,307 -2,702 35,019 37,287 -2,268<br />
Pennsylvania 18,663 19,304 -641 162,906 151,161 11,745<br />
Puerto Rico 1,940 2,105 -165 20,944 23,629 -2,685<br />
Rhode Island 1,158 1,430 -272 13,034 13,034<br />
South Carolina 2,546 2,579 -33 16,509 17,414 -905<br />
South Dakota 310 327 -17 3,878 3,828 50<br />
Tennessee 2,968 3,123 -155 22,194 22,828 -634<br />
Texas 15,325 15,118 207 157,228 165,892 -8,664<br />
Utah 1,432 1,464 -32 15,004 14,883 121<br />
Vermont 553 575 -22 6,658 6,173 485<br />
Virgin Islands 21 32 -11 440 620 -180<br />
Virginia 3,820 4,089 -269 31,113 29,846 1,267<br />
Washington 7,321 4,767 2,554 69,383 68,581 802<br />
West Virginia 1,290 1,565 -275 17,619 16,865 754<br />
Wisconsin 7,739 8,102 -363 57,199 58,644 -1,445<br />
Wyoming 587 548 39 6,490 6,671 -181<br />
US Total 259,545 278,644 -19,099 2,481,320 2,494,585 -13,265<br />
Note: Advance Claims are not directly comparable to claims reported in prior weeks. Advance claims are reported by the state<br />
liable for paying the unemployment compensation, whereas previous weeks reported reflect claimants by state of residence. In<br />
addition, claims reported as "workshare equivalent" in the previous week are added to the advance claims as a proxy for the current<br />
week's "workshare equivalent" activity.
Seasonally Adjusted US Weekly UI Claims (in thousands)<br />
Change<br />
from<br />
Prior<br />
Week<br />
Change<br />
from<br />
Prior<br />
Week<br />
Week Ending<br />
Initial<br />
Claims<br />
4-Week<br />
Average<br />
Insured<br />
Unemployment<br />
4-Week<br />
Average<br />
IUR<br />
January 30, 2016 286 11 283.00 2,234 -14 2,237.25 1.6<br />
February 6, 2016 259 -27 277.75 2,249 15 2,245.25 1.7<br />
February 13, 2016 260 1 270.00 2,233 -16 2,241.00 1.6<br />
February 20, 2016 264 4 267.25 2,231 -2 2,236.75 1.6<br />
February 27, 2016 262 -2 261.25 2,198 -33 2,227.75 1.6<br />
March 5, 2016 253 -9 259.75 2,212 14 2,218.50 1.6<br />
March 12, 2016 259 6 259.50 2,180 -32 2,205.25 1.6<br />
March 19, 2016 265 6 259.75 2,172 -8 2,190.50 1.6<br />
March 26, 2016 276 11 263.25 2,189 17 2,188.25 1.6<br />
April 2, 2016 266 -10 266.50 2,176 -13 2,179.25 1.6<br />
April 9, 2016 253 -13 265.00 2,135 -41 2,168.00 1.6<br />
April 16, 2016 248 -5 260.75 2,129 -6 2,157.25 1.6<br />
April 23, 2016 257 9 256.00 2,124 -5 2,141.00 1.6<br />
April 30, 2016 274 17 258.00 2,165 41 2,138.25 1.6<br />
May 7, 2016 294 20 268.25 2,153 -12 2,142.75 1.6<br />
May 14, 2016 278 -16 275.75 2,160 7 2,150.50 1.6<br />
May 21, 2016 268 -10 278.50 2,172 12 2,162.50 1.6<br />
May 28, 2016 268 0 277.00 2,112 -60 2,149.25 1.5<br />
June 4, 2016 264 -4 269.50 2,162 50 2,151.50 1.6<br />
June 11, 2016 277 13 269.25 2,139 -23 2,146.25 1.6<br />
June 18, 2016 258 -19 266.75 2,167 28 2,145.00 1.6<br />
June 25, 2016 270 12 267.25 2,117 -50 2,146.25 1.5<br />
July 2, 2016 254 -16 264.75 2,153 36 2,144.00 1.6<br />
July 9, 2016 254 0 259.00 2,132 -21 2,142.25 1.5<br />
July 16, 2016 252 -2 257.50 2,144 12 2,136.50 1.6<br />
July 23, 2016 266 14 256.50 2,141 -3 2,142.50 1.6<br />
July 30, 2016 267 1 259.75 2,160 19 2,144.25 1.6<br />
August 6, 2016 266 -1 262.75 2,175 15 2,155.00 1.6<br />
August 13, 2016 262 -4 265.25 2,145 -30 2,155.25 1.6<br />
August 20, 2016 261 -1 264.00 2,157 12 2,159.25 1.6<br />
August 27, 2016 263 2 263.00 2,142 -15 2,154.75 1.6<br />
September 3, 2016 259 -4 261.25 2,149 7 2,148.25 1.6<br />
September 10, 2016 260 1 260.75 2,108 -41 2,139.00 1.5<br />
September 17, 2016 251 -9 258.25 2,064 -44 2,115.75 1.5<br />
September 24, 2016 254 3 256.00 2,062 -2 2,095.75 1.5<br />
October 1, 2016 246 -8 252.75 2,050 -12 2,071.00 1.5<br />
October 8, 2016 247 1 249.50 2,054 4 2,057.50 1.5<br />
October 15, 2016 261 14 252.00 2,040 -14 2,051.50 1.5<br />
October 22, 2016 259 -2 253.25 2,030 -10 2,043.50 1.5<br />
October 29, 2016 266 7 258.25 2,043 13 2,041.75 1.5<br />
November 5, 2016 254 -12 260.00 1,983 -60 2,024.00 1.4<br />
November 12, 2016 233 -21 253.00 2,043 60 2,024.75 1.5<br />
November 19, 2016 251 18 251.00 2,084 41 2,038.25 1.5<br />
November 26, 2016 268 17 251.50 2,007 -77 2,029.25 1.5<br />
December 3, 2016 258 -10 252.50 2,021 14 2,038.75 1.5<br />
December 10, 2016 254 -4 257.75 2,039 18 2,037.75 1.5<br />
December 17, 2016 275 21 263.75 2,105 66 2,043.00 1.5<br />
December 24, 2016 267 -8 263.50 2,116 11 2,070.25 1.5<br />
December 31, 2016 237 -30 258.25 2,093 -23 2,088.25 1.5<br />
January 7, 2017 249 12 257.00 2,059 -34 2,093.25 1.5<br />
January 14, 2017 237 -12 247.50 2,103 44 2,092.75 1.5<br />
January 21, 2017 260 23 245.75 2,063 -40 2,079.50 1.5<br />
January 28, 2017 246 -14 248.00 2,078 15 2,075.75 1.5<br />
February 4, 2017 234 -12 244.25
Initial Claims Filed During Week Ended January<br />
28<br />
INITIAL CLAIMS<br />
CHANGE FROM<br />
LAST YEAR<br />
STATE WEEK AGO UCFE 1 UCX 1<br />
(%)<br />
2<br />
Insured Unemployment For Week Ended January 21<br />
INSURED UNEMPLOYMENT<br />
CHANGE FROM<br />
LAST YEAR UCFE<br />
ALL PROGRAMS EXCLUDING RAILROAD<br />
WEEK AGO<br />
1<br />
UCX 1<br />
RETIREMENT<br />
STATE<br />
STATE<br />
Alabama 2936 -24 -456 5 14 20747 1.1 -730 -3512 89 133 20969<br />
Alaska 1433 21 -45 11 2 15027 4.8 421 -239 271 38 15336<br />
Arizona 4205 261 -143 19 10 25994 1.0 82 -1914 262 113 26369<br />
Arkansas 1947 -107 -1048 6 6 17369 1.5 -72 -5770 73 95 17537<br />
California 53825 -8089 3262 220 154 429836 2.6 47122 2952 3636 2478 435950<br />
Colorado 2589 -274 -480 27 41 29247 1.2 -2580 -3911 410 494 30151<br />
Connecticut 5373 62 394 19 7 50983 3.1 1845 612 80 118 51181<br />
Delaware 759 -22 -296 4 4 7301 1.7 128 -2229 16 18 7335<br />
District of 414 96 97 429 0 8948 1.6 75 378 368 5 9321<br />
Columbia<br />
Florida 8133 741 64 18 65 44812 0.6 -181 -7489 203 245 45260<br />
Georgia 7189 233 -1668 35 58 35020 0.9 -316 -4714 198 375 35593<br />
Hawaii 1320 155 203 4 15 7866 1.3 -361 1619 83 109 8058<br />
Idaho 1912 -105 94 23 3 14945 2.3 -99 223 396 40 15381<br />
Illinois 11865 307 -6128 13 15 154445 2.7 -7032 -12323 442 362 155249<br />
Indiana 4700 755 -126 14 12 32780 1.1 719 -3728 83 65 32928<br />
Iowa 2694 -121 -427 7 4 35427 2.3 139 -1283 55 56 35538<br />
Kansas 2510 -133 1 8 10 16922 1.3 -28 -3330 61 65 17048<br />
Kentucky 2800 -225 -910 1 4 25582 1.4 -1205 -3647 237 241 26060<br />
Louisiana 2518 60 -565 1 0 22099 1.2 -555 -1188 39 48 22186<br />
Maine 1032 -111 -128 2 1 10424 1.8 320 -2186 43 25 10492<br />
Maryland 4398 175 -2877 92 9 44021 1.8 437 -3173 331 201 44553<br />
Massachusetts 6938 -122 -146 17 17 90834 2.7 1499 -4621 182 223 91239<br />
Michigan 10956 354 1711 25 22 89592 2.2 -3373 -6999 278 222 90092<br />
Minnesota 3982 -166 -285 4 4 66716 2.4 -361 -3776 162 102 66980<br />
Mississippi 1443 113 -143 19 5 12361 1.1 -263 -1864 106 48 12515<br />
Missouri 5041 94 -1090 24 1 36442 1.4 162 -8703 262 82 36786<br />
Montana 977 -172 -297 39 0 13760 3.1 -800 -888 677 40 14477<br />
Nebraska 1032 -21 34 4 0 9295 1.0 123 219 27 11 9333<br />
Nevada 3104 272 36 10 8 25070 2.0 242 -2506 246 109 25425<br />
New Hampshire 710 -42 -191 2 0 5827 0.9 105 -1041 6 6 5839<br />
New Jersey 10326 -303 -1739 17 19 120069 3.1 2602 -5749 273 366 120708<br />
New Mexico 1115 -55 -156 14 6 12865 1.7 -5 -1777 326 65 13256<br />
New York 17703 290 -2291 45 48 185144 2.1 -298 -14343 338 565 186047<br />
North Carolina 3953 -50 -632 12 18 27759 0.7 -564 -5362 140 268 28167<br />
North Dakota 770 -23 -137 0 2 8894 2.1 -162 -1027 20 4 8918<br />
Ohio 11867 3659 848 5 22 84322 1.6 -333 -10486 125 318 84765<br />
Oklahoma 1740 -63 -538 7 12 18484 1.2 -177 -3956 85 142 18711<br />
Oregon 7307 700 1542 77 22 37287 2.1 -681 173 784 151 38222<br />
Pennsylvania 19304 -350 -5647 99 52 151161 2.7 -10303 -21756 687 479 152327<br />
Puerto Rico 2105 -325 155 0 6 23629 2.7 774 -3246 34 136 23799<br />
Rhode Island 1430 40 8 4 1 13034 2.8 624 207 24 45 13103<br />
South Carolina 2579 -128 -571 9 20 17414 0.9 126 -2109 59 133 17606<br />
South Dakota 327 40 27 4 0 3828 0.9 16 128 51 3 3882<br />
Tennessee 3123 -242 -4878 8 4 22828 0.8 142 -7377 410 54 23292<br />
Texas 15118 54 -2517 80 165 165892 1.4 4217 -13418 581 2128 168601<br />
Utah 1464 -16 -95 31 4 14883 1.1 81 -643 398 25 15306<br />
Vermont 575 -36 -60 2 0 6173 2.1 -212 -566 15 5 6193<br />
Virgin Islands 32 10 -3 2 0 620 1.7 138 -8 6 6 632<br />
Virginia 4089 -304 -439 22 30 29846 0.8 -744 -3527 312 451 30609<br />
Washington 4767 -564 -2802 0 0 68581 2.2 -82 2907 412 682 69675<br />
West Virginia 1565 -97 -755 1 4 16865 2.5 -833 -7665 56 52 16973<br />
Wisconsin 8102 616 -823 9 4 58644 2.1 859 -8156 127 56 58827<br />
Wyoming 548 39 -240 6 2 6671 2.5 -412 -1486 200 2 6873<br />
Totals 278644 -3143 -33296 1556 932 2494585 1.8 30236 -194273 14785 12303 2521673<br />
Figures Appearing In columns showing Over-The-Week Changes reflect all revisions in data for prior week submitted by State agencies.<br />
1. The Unemployment Compensation program for Federal Employees (UCFE) and the Unemployment Compensation for Ex-servicemembers (UCX) exclude claims filed jointly under<br />
other programs to avoid duplication.<br />
2. Rate is not seasonally adjusted. The source of US total covered employment is BLS.
UNADJUSTED INITIAL CLAIMS FOR WEEK ENDED JANUARY 28, 2017<br />
STATES WITH AN INCREASE OF MORE THAN 1,000<br />
State Change State Supplied Comment<br />
OH +3,659 Layoffs in the manufacturing industry.<br />
STATES WITH A DECREASE OF MORE THAN 1,000<br />
State Change State Supplied Comment<br />
CA -8,089 Fewer layoffs in the service and agriculture, forestry, fishing and hunting industries.
TECHNICAL NOTES<br />
This news release presents the weekly unemployment insurance (UI) claims reported by each state's unemployment insurance<br />
program offices. These claims may be used for monitoring workload volume, assessing state program operations and for assessing<br />
labor market conditions. States initially report claims directly taken by the state liable for the benefit payments, regardless of where<br />
the claimant who filed the claim resided. These are the basis for the advance initial claims and continued claims reported each<br />
week. These data come from ETA 538, Advance Weekly Initial and Continued Claims Report. The following week initial claims<br />
and continued claims are revised based on a second reporting by states that reflect the claimants by state of residence. These data<br />
come from the ETA 539, Weekly Claims and Extended Benefits Trigger Data Report.<br />
A. Initial Claims<br />
An initial claim is a claim filed by an unemployed individual after a separation from an employer. The claimant requests a<br />
determination of basic eligibility for the UI program. When an initial claim is filed with a state, certain programmatic activities take<br />
place and these result in activity counts including the count of initial claims. The count of U.S. initial claims for unemployment<br />
insurance is a leading economic indicator because it is an indication of emerging labor market conditions in the country. However,<br />
these are weekly administrative data which are difficult to seasonally adjust, making the series subject to some volatility.<br />
B. Continued Weeks Claimed<br />
A person who has already filed an initial claim and who has experienced a week of unemployment then files a continued claim to<br />
claim benefits for that week of unemployment. Continued claims are also referred to as insured unemployment. The count of U.S.<br />
continued weeks claimed is also a good indicator of labor market conditions. Continued claims reflect the current number of<br />
insured unemployed workers filing for UI benefits in the nation. While continued claims are not a leading indicator (they roughly<br />
coincide with economic cycles at their peaks and lag at cycle troughs), they provide confirming evidence of the direction of the<br />
U.S. economy.<br />
C. Seasonal Adjustments and Annual Revisions<br />
Over the course of a year, the weekly changes in the levels of initial claims and continued claims undergo regularly occurring<br />
fluctuations. These fluctuations may result from seasonal changes in weather, major holidays, the opening and closing of schools,<br />
or other similar events. Because these seasonal events follow a more or less regular pattern each year, their influence on the level of<br />
a series can be tempered by adjusting for regular seasonal variation. These adjustments make trend and cycle developments easier<br />
to spot. At the beginning of each calendar year, the Bureau of Labor Statistics provides the Employment and Training<br />
Administration (ETA) with a set of seasonal factors to apply to the unadjusted data during that year. Concurrent with the<br />
implementation and release of the new seasonal factors, ETA incorporates revisions to the UI claims historical series caused by<br />
updates to the unadjusted data.<br />
Weekly Claims Archives<br />
Weekly Claims Data<br />
U.S. Department of Labor news materials are accessible at http://www.dol.gov. The Departments Reasonable Accommodation Resource<br />
Center converts Departmental information and documents into alternative formats, which include Braille and large print. For alternative<br />
format requests, please contact the Department at (202) 693-7828 (voice) or (800) 877-8339 (federal relay).<br />
U.S. Department of Labor<br />
Employment and Training Administration<br />
Washington, D.C. 20210<br />
<strong>Release</strong> Number: USDL 17-207-NAT<br />
Program Contacts:<br />
Brenda Loya (202) 693-3760<br />
Tony Sznoluch (202) 693-3176<br />
Media Contact: (202) 693-4676