

AEN-2016-Market-Report

You also want an ePaper? Increase the reach of your titles
YUMPU automatically turns print PDFs into web optimized ePapers that Google loves.
ADVANCED<br />
ENERGY<br />
ECONOMY<br />
the business voice of advanced energy<br />
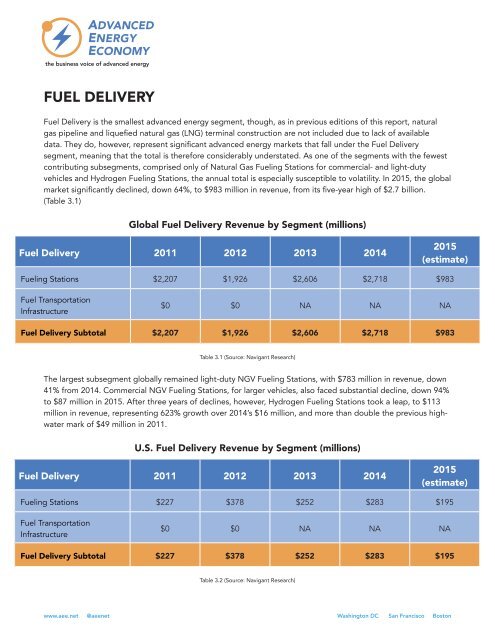
FUEL DELIVERY<br />
Fuel Delivery is the smallest advanced energy segment, though, as in previous editions of this report, natural<br />
gas pipeline and liquefied natural gas (LNG) terminal construction are not included due to lack of available<br />
data. They do, however, represent significant advanced energy markets that fall under the Fuel Delivery<br />
segment, meaning that the total is therefore considerably understated. As one of the segments with the fewest<br />
contributing subsegments, comprised only of Natural Gas Fueling Stations for commercial- and light-duty<br />
vehicles and Hydrogen Fueling Stations, the annual total is especially susceptible to volatility. In 2015, the global<br />
market significantly declined, down 64%, to $983 million in revenue, from its five-year high of $2.7 billion.<br />
(Table 3.1)<br />
Global Fuel Delivery Revenue by Segment (millions)<br />
Fuel Delivery 2011 2012 2013 2014<br />
2015<br />
(estimate)<br />
Fueling Stations $2,207 $1,926 $2,606 $2,718 $983<br />
Fuel Transportation<br />
Infrastructure<br />
$0 $0 NA NA NA<br />
Fuel Delivery Subtotal $2,207 $1,926 $2,606 $2,718 $983<br />
Table 3.1 (Source: Navigant Research)<br />
The largest subsegment globally remained light-duty NGV Fueling Stations, with $783 million in revenue, down<br />
41% from 2014. Commercial NGV Fueling Stations, for larger vehicles, also faced substantial decline, down 94%<br />
to $87 million in 2015. After three years of declines, however, Hydrogen Fueling Stations took a leap, to $113<br />
million in revenue, representing 623% growth over 2014’s $16 million, and more than double the previous highwater<br />
mark of $49 million in 2011.<br />
U.S. Fuel Delivery Revenue by Segment (millions)<br />
Fuel Delivery 2011 2012 2013 2014<br />
2015<br />
(estimate)<br />
Fueling Stations $227 $378 $252 $283 $195<br />
Fuel Transportation<br />
Infrastructure<br />
$0 $0 NA NA NA<br />
Fuel Delivery Subtotal $227 $378 $252 $283 $195<br />
Table 3.2 (Source: Navigant Research)<br />
www.aee.net @aeenet Washington DC San Francisco Boston