

19730006364 1973006364
19730006364 1973006364
19730006364 1973006364

You also want an ePaper? Increase the reach of your titles
YUMPU automatically turns print PDFs into web optimized ePapers that Google loves.
LrSt_<br />
BIOASTRONAUTICSDATA BOOK<br />
SecondEdition<br />
James F. Parker, Jr.<br />
Vita R. West<br />
Managing Editors<br />
BioTechnology, Inc.<br />
NASASP-3006<br />
Scien:i_c and Technical ln[ormation Office 1973<br />
NATIONAL AERONAUTICS AND SPACE ADMINISTRATION<br />
Washington, D.C.
For sale by the Superintendent of Documents<br />
U.S. Government Printing Office, Washington, D.C. 20402<br />
Price $7.50--Stock Number 3300-00474<br />
Libr,_r) of Congress Cat,¢/og Card Number 72-600293
PREFACE<br />
The rapid technological progress of the 1960s is characterized by the<br />
advanced systems produced during this period. The Apollo spacecraft, the<br />
metroliner, jet aircraft capable of carrying several hundred passengers,<br />
commercial nuclear power plants, and high-speed data processing facilities<br />
stand out as examples. These systems are highly visible and have had a<br />
marked effect on the American public. They represent what we accept as<br />
milestones of "progress."<br />
Advances made in the life sciences during the 1960s are not as visible<br />
and only now are being accepted by the public as comparable in<br />
importance to progress in the physical and engineering sciences. It now is<br />
becoming very clear that a body of life sciences information is needed not<br />
only to determine the best way in which to utilize man in complex<br />
systems, but also to assess the impact of system operation on man. In this<br />
latter sense, we refer to impact on all mankind and not just to effects on<br />
humans working within a system.<br />
As the problems of living in a technological age become more obvious,<br />
work must be accelerated towards solutions for human-oriented issues.<br />
Fortunately, there is a substantial body of life sciences data upon which<br />
one may draw. Although not generally recognized, basic research in the life<br />
sciences has kept pace with that in the physical sciences during recent<br />
years. In 1970, Federal expenditures in this field approached 700 million<br />
dollars, a fourfold increase over those of 1960. Data collected by the<br />
National Science Foundation indicate that, in 1969, basic research in the life<br />
sciences, social sciences, and psychology received 52 percent of tile total<br />
Federal basic research funds, as opposed to 47 percent for the physical<br />
sciences, engineering sciences and mathematics.<br />
This revision of the Bioastronautics Data Book was prepared in order to<br />
bring together the essentials of the large body of human research<br />
information generated in recent years and to present it in a form suitable<br />
for engineers and others concerned with tile development and evaluation of<br />
modern "systems. This effort represents an updating and expansion of an<br />
earlier document prepared for the National Aeronautics and Space<br />
Administration in 1964by Webb Associates. The revision was prepared<br />
under the guidance of Working Group 5 of the Committee on Hearing,<br />
iii
Bioacoustics and Biomechanics<br />
Members of this group include:<br />
of the National<br />
A. Pharo Gagge, Ph.D, Chairman<br />
Walton L. Jones, M.D.<br />
Milton A. Whitcomb, Ph.D<br />
Gilbert C. Tolhurst, Ph.D<br />
Donald P. Woodward, Ph.D<br />
Randall M. Chambers, Ph.D<br />
Henning E. van Giarke, Ph.D<br />
Edward J. Baldes, Ph.O<br />
Academy of Sciences.<br />
The revised Bioastronautics Data Book was prepared by BioTechnology, Inc.<br />
under contract to the Office of Naval Research with support from the<br />
National Aeronautics and Space Administration. It deals with a substantial<br />
array of content areas within the broad domain of life sciences and presents<br />
primarily that information deemed of value for system design and<br />
evaluation. We in NASA trust that it will prove as useful as the earlier Data<br />
Book and that it will contribute to solutions for some of the pressing<br />
problems in human ecology now faced by man.<br />
Charles A. Berry, M.D.<br />
NASA Director for Life Sciences<br />
National Aeronautics and Space Administration<br />
Walton L. Jones, M.D.<br />
Deputy NASA Director for Life Sciences<br />
National Aeronautics and Space Administration<br />
iv
Chapter<br />
-- /<br />
1. j Barometric Pressure<br />
TABLEOFCONTENTS<br />
Survival Under Near-Vacuum Conditions<br />
Human Tolerance for Low Barometric Pressures<br />
Human Tolerance for Gaseous Environments Composed of Air<br />
[luman Tolerance for High Barometric Pressures<br />
Changes in Barometric Pressure<br />
2. / Atmosphere<br />
Gencral Considerations<br />
Oxygen<br />
Carbon Dioxide<br />
The Inert Gases<br />
Other Gaseous Compounds<br />
3. / Temperature<br />
Physiological Parameters<br />
Ene%w Balance Equation<br />
Heat Transfer Equations<br />
Thermal Comfort<br />
Heat Stress<br />
Cold Stress<br />
Clothing<br />
Appendix<br />
4.<br />
/<br />
/Su,,'taincd Linear Acceleration<br />
Subj¢ ctive Effects of Sustained Acceleration<br />
Physiological Effects of Sustained Acceleration<br />
Tolerance to Sustained Acceleration<br />
Performance Under Sustained Acceleration<br />
5. /Rotary Acceleration<br />
SubjcctNe Reactions and Tolerance<br />
Performance During Rotary Acceleration<br />
Physiological Effects of Rotary Ace,titration<br />
Pathological Effects of Rotary Acceleration<br />
Page<br />
1<br />
2<br />
6<br />
7<br />
8<br />
12<br />
35<br />
35<br />
37<br />
47<br />
52<br />
59<br />
65<br />
66<br />
71<br />
72<br />
86<br />
91<br />
115<br />
127<br />
142<br />
• 149<br />
150<br />
• 153<br />
• 171<br />
179<br />
191<br />
191<br />
• 202<br />
• 205<br />
• 217
Chapter<br />
6. j' Impact<br />
TermsandDefinitions<br />
Acceleration<br />
The"G" SystemofUnits<br />
Interpreting theData<br />
HumanTolerance Limits<br />
Physiological andBiochemical Response toImpact<br />
Biomechanical Factorsof Impact<br />
7. ]' Vibration<br />
Impact Other Than Along Primary Axis ("Off Axis")<br />
The Vibration Environment<br />
Performance Effects<br />
Physiological Effects<br />
Biodynamic Effects<br />
Subjective Tolerance Levels . .<br />
Interaction of Vibration with Other Environmental Parameters<br />
Weightlessness<br />
Effects of Weightlessness on Physiological Systems<br />
The Effects of Zero Gravity Upon Performance<br />
Counteracting the Physiological Effects of Weightlessness<br />
Appendix<br />
• J Ionizing Radiation<br />
Radiation Terms and Measures<br />
Classes and Sources of Ionizing Radiation<br />
Whole Body Radiation Effects<br />
Radiation Effects on Specific Body Systems<br />
Late Effects of Radiation<br />
Page<br />
• 221<br />
• 222<br />
225<br />
225<br />
227<br />
227<br />
239<br />
242<br />
278<br />
• 297<br />
• 298<br />
• 304<br />
.317<br />
• 323<br />
• 332<br />
342<br />
• 349<br />
• 351<br />
• 400<br />
• 405<br />
• 412<br />
• 417<br />
• 420<br />
• 424<br />
• 433<br />
• 438<br />
.448<br />
10. Toxicology . 455<br />
Oxygen Toxicity and The Effects of Variations<br />
In Oxygen Partial Pressure on Toxicity . . 456<br />
Effects of Oxygen on the Toxicity of Ozone and Nitrogen Dioxide 458<br />
Toxicity of Fuels and Oxidizers 459<br />
Carbon Monoxide 467<br />
Spacecraft Threshold Limit Values 470<br />
Emergency Exposure Limits (EEL) 471<br />
Spacecraft Contaminants 472<br />
Water Quality Standards for Space Missions 478<br />
vi
Chapter<br />
11.J Respiratory System<br />
General AnatomyofChestandLun_<br />
General FunctionofRespiration<br />
Respiration<br />
BreathingMovements<br />
Controlof Breathing<br />
LungVolumes andCapacities<br />
Mechanical Relations<br />
FactorsRelevant to Respiratory SupportEquipment Design<br />
12.''/The Vestibular System<br />
13. ./Vision<br />
TheEndOrgans<br />
CentralNervousSystemConnections<br />
StaticandDynamicCharacteristics<br />
Vestibular Servation In Man<br />
EarlyGuidefines in the Prevet, tion'of Vestibular Side Effects<br />
on Space Missions Involving The Generation<br />
of Artificial Gravity<br />
Appendix A<br />
Appendix B<br />
Symbols<br />
The Visual Environment<br />
Structure of the Visual System<br />
Visual Performance<br />
Vision Under Stress<br />
Visual Tasks ill Space Operations<br />
14. / Auditory System<br />
Physical Correlates of Hearing<br />
The Auditory System<br />
ilearing Loss<br />
15. / Noise and Blast<br />
Description of the Noise and Blast Environment<br />
Effects of Noise and Blast on llcaring<br />
Effects of Hearing Loss on Performance .<br />
Subjective and Behavioral Responses to Noise Exposure<br />
Pbysiological (Nonauditory) Responses to Noise Exposure<br />
Design Criteria<br />
vii<br />
Page<br />
• 489<br />
• 490<br />
49l<br />
493<br />
494<br />
495<br />
498<br />
503<br />
523<br />
• 533<br />
• 535<br />
• 544<br />
• 547<br />
• 555<br />
• 584<br />
• 591<br />
• 601<br />
• 609<br />
• 611<br />
• 617<br />
• 621<br />
• 637<br />
• 655<br />
• 659<br />
• 667<br />
• 668<br />
• 669<br />
• 679<br />
• 693<br />
• 694<br />
• 705<br />
• 719<br />
• 721<br />
• 730<br />
• 735
Chapter<br />
16.,/ Human Control Capabilities<br />
Controller Characteristics<br />
Controls and Manipulators<br />
Displays<br />
17. / Atmosphere Control<br />
Carbon Dioxide<br />
Oxygen Regeneration<br />
Trace Contaminants Removal<br />
llumidity Control . . .<br />
Storage Systems for Atmospheric Constituents<br />
/<br />
18. j Work, Heat, and Oxygen Cost<br />
Daily Energy Exchange<br />
Work and Heat Dissipation<br />
Oxygen Costs of Speeifie Activities<br />
Work Capacity<br />
Anaerobic Work<br />
Working in Spaee Suits<br />
19. J Combined Environmental Stresses<br />
Combined Stress Interactions • • ,<br />
Approach to the Study of Combined Environmental Stress<br />
Combined Stress Data<br />
Facilities for Study of Combined Stress<br />
20. _ Aerospaee Vehicle Water-Waste Management<br />
Requirements<br />
Colleetion and Transport<br />
Waste Proeessing<br />
viii<br />
Page<br />
• 751<br />
• 751<br />
• 784<br />
• 787<br />
• 807<br />
• 809<br />
• 821<br />
• 836<br />
• 839<br />
• 841<br />
• 847<br />
• 851<br />
• 854<br />
• 858<br />
• 866<br />
• 871<br />
• 873<br />
• 881<br />
• 882<br />
• 888<br />
• 889<br />
• 889<br />
• 915<br />
• 916<br />
• 917<br />
• 922
CHAPTER 1<br />
BAROMETRIC PRESSURE<br />
by<br />
Charles E. Billings, M.D.<br />
The Ohio State University<br />
Physiological studies of pressure effects have been conducted for over a<br />
century. Still, many facets of the problem have been incompletely explored. It is<br />
known that if man is supplied with an appropriate gas mixture, he can survive<br />
considerable periods of exposure to a wide range of barometric pressures<br />
(figure 1-1). Man's ultimate tolerance limits for high and low harometric<br />
pressures are not known, however. Likewise, it is not known whether the gas<br />
mixtures required for such exposures are in themselves toxic.<br />
This chapter describes the effects of alterations in barometric pressure on<br />
human beings. The subject is of considerable importance in both aerospace and<br />
underwater exploration, although the former area is given primary emphasis<br />
here. The effects of barometric pressure as such must be differentiated from the<br />
effects of changes in pressure. In the latter case, our knowledge is more<br />
complete. Abrupt and controlled changes in pressure can be produced in<br />
compression and decompression chambers, shock tubes, wind tunnels, and the<br />
like.<br />
Increases in barometric pressure are experienced most commonly during<br />
descents through the atmosphere and underwater diving. High dynamic<br />
(unbalanced) pressures are encountered during escape from aircraft. Still higher<br />
pressures occur in the vicinity of explosions. Decreases in pres,_ure are<br />
encountered during ascents through water or the atmosphere or during<br />
depressurization of an aircraft or space vehicle. The physical effects of these<br />
changes arc considcred in this chapter. Exposure through'out the tolerable range<br />
of pressurcs is discussed first, followed by descriptions of the effects of<br />
increases, and then decreases, in barometric pressure.<br />
In view of the multiplicity of systems for dcscribing pressure, the following<br />
tables have been included as an aid to the reader wishing to convert p_ssure<br />
Reviewed by the late Wing Commander D. I. Fryer, O.B.E., RAF, MC, Institute of Aviation<br />
Medicine, Farnborough, England.
Bioastronautics Data Book<br />
terms from one notational system to another. Tables 1-1 and 1-2 shown here<br />
contain many, though not all, the units of pressure measurement in common<br />
use. The preferred units for scientific use are those of the new International<br />
System (Systeme Internationale), which recommends Newtons per square meter<br />
but accepts tile bar and millibar for common usage. The inch of mercury and<br />
millibar are widely used in aviation. Millimeters of mercury are in common<br />
biomedical use in the United States and elsewhere. In diving medicine, the<br />
atmosphere is commonly used. Note in table 1-1 that zero feet of water equals<br />
1 atmosphere. The increase of pressure with increasing depth in _a water is<br />
roughly 1 atm for each 33 feet. Since air is compressible, the altitude scale is<br />
logarithmic. The data for altitude arc from tile U.S. Standard Atmosphere<br />
(i9,54).<br />
200<br />
1 O0<br />
50<br />
.__ 40<br />
30<br />
ul<br />
IIC<br />
D<br />
_ 20<br />
u.l<br />
n-<br />
(1: 10<br />
I-<br />
0<br />
4<br />
20 40 60 80<br />
OXYGEN IN INSPIRED GAS- %<br />
300<br />
20O<br />
"I"<br />
150 I- A<br />
o. rr<br />
u,I I_l<br />
100 O t-<br />
50 < m<br />
>v<br />
30 5<br />
2o 0<br />
10<br />
SEA LEVEL<br />
5000<br />
25 000<br />
uJ<br />
0<br />
D<br />
I,-<br />
30 000 <<br />
1-<br />
35 000 Z<br />
...I<br />
40 000 <<br />
><br />
4s ooo 5<br />
100 0 u.l<br />
Figure 1-1. Approximate range of barometric pressure (above and below sea level)<br />
tolerated by humans breathing gas mixtures containing the indicated concentrations of 0 2.<br />
Heavy curve indicates gas mixture which will maintain sea level equiv',dent PO 2 in the lungs<br />
at the indicated barometric pressures. (U.S. House of Representatives Select Committee on<br />
Astronautics and Space Exploration, 1959)<br />
Survival Under Near-Vacuum Conditions<br />
The vapor pre_ure of water at a body temperature of 37°C is 47 mm Hg<br />
(0.9 psia). Since the human body is largely composed of water, exposure to<br />
barometric pressures much below 47ram Hg absolute leads rapidly to
Barometric Pressure 3<br />
vaporization of body fluids, a proce_ known as ebullism. That this phenomenon<br />
does not occur precisely at 47 mm tlg is due to some degree of eounterpressure<br />
exerted by tilt skin and connective tissues and blood vessels.<br />
<<br />
0<br />
<<br />
t0<br />
.9<br />
10<br />
4<br />
'Fable 1-1<br />
Equivalent Pressures, Altitudes and 1)epths<br />
? EE<br />
50(<br />
_ 40,<br />
ixl<br />
5;<br />
• 1(<br />
760 _ 10132<br />
70(3<br />
900<br />
60C 800 4<br />
E<br />
ec<br />
700"<br />
600'<br />
_ 500'<br />
_J<br />
- 400<br />
• 300<br />
- 2oc<br />
- 1 O0<br />
1.0_3 x 105--'IP'' O]<br />
9x 10⁴<br />
8 x 10⁴<br />
E c<br />
5-<br />
10-<br />
F,, _ -6<br />
o_ _ 20<br />
0<br />
_ -<br />
z<br />
3 x 10⁴ 30 -<br />
2 x 10⁴<br />
104<br />
0<br />
40"<br />
50'<br />
60-<br />
100-<br />
1<br />
2<br />
-I<br />
--1<br />
80--<br />
.3 60-<br />
I--<br />
_z<br />
40-<br />
¢<br />
20"<br />
I<br />
O0 )<br />
250<br />
.2oQ.<br />
_5o<br />
.100.<br />
°<br />
-50<br />
¢_<br />
a_<br />
,<<br />
) 0<br />
I<br />
3<br />
2<br />
.0 • I<br />
o<br />
¢I:
4 Bioastronautics Data Book<br />
(<br />
O<br />
¢,)<br />
.1-<br />
v<br />
E<br />
E<br />
E<br />
q_ m<br />
o<br />
c.)<br />
z<br />
E<br />
+.J<br />
<<br />
O<br />
t-<br />
m.<br />
$<br />
I<br />
O (N<br />
x .,t _. ,t o_ --"<br />
N ,r o ,.- o _ _.<br />
i<br />
tn . . q<br />
• (9 t'_<br />
• r,. _ r- _ cN _)<br />
O a 0 g a<br />
m<br />
0 0 • " 0<br />
q<br />
I<br />
X 0 0 in e_<br />
- § ,',§<br />
_ • ,.. ,-: _<br />
tY)<br />
5<br />
U*')<br />
O<br />
x<br />
i ?<br />
x X<br />
¢9<br />
I<br />
• o m<br />
$<br />
tt_<br />
O<br />
× o. •<br />
_ _ .<br />
II II II II II II II U U<br />
i
Barometric Pressure 5<br />
Recent studies of dogs, squirrel monkeys, and baboons decompressed in<br />
2 seconds from 250 to 1 to 2 mm Hg absolute (Bancroft & Dunn, 1965; Cooke<br />
et at., 1967; Cooke et at., 1968) have demonstrated remarkable similarity among<br />
these species in responses to exposure to a near vacuum. Chimpanzees respond in<br />
the same way, though at a slower rate, to this stress. It is reasonable to assume<br />
that similar responses would occur in humans exposed to very low pressures by<br />
puncture of a space vehicle or suit or failure of a pressure seal under<br />
space-equivalent conditions.<br />
Some degree of consciousness will probably be retained for 9 to 11 seconds<br />
(see chapter2 under the heading Hypoxia). In rapid sequence thereafter,<br />
paralysis will be followed by generalized convulsions and paralysis once again.<br />
During this time, water vapor will form rapidly in the soft tissues and somewhat<br />
less rapidly in the venous blood. This evolution of vapor will cause marked<br />
swelling of the body to perhaps as much as twice its normal volume unless it is<br />
restrained by a pressure suit. (It has been demonstrated that a properly fitted<br />
elastic garment can entirely prevent ebullism at pressures as low as 15 mm Hg<br />
absolute lWebb, 1969, 1970].) Heart rate may rise initially but will fall rapidly<br />
thereafter. Arterial blood pressure will also fall over a period of 30 to<br />
60 seconds, while venous pressure rises due to distension of the venous systcm<br />
by gas and vapor. Venous pressure will meet or exceed arterial pressure within<br />
1 minute. There will be virtually no effective circulation of blood. After an<br />
initial rush of gas from the lungs during decompression, g_ and water vapor will<br />
continue to flow outward through the airways. This continual ewporation of<br />
water will cool the mouth and nose to near-freezing temperatures; the remainder<br />
of the body will also become cooled, but more slowly.<br />
Cooke and Bancroft (1966) reported occasional deaths in animals due to<br />
fibrillation of the heart during the first minute of exposure to near-vacuum<br />
conditions. Ordinarily, however, survival was the rule if recompression occurred<br />
within about 90 seconds. The hearts in these studies tolerated even repeated<br />
decompression well (Cooke & Bancroft, 1966), although it is by no means<br />
certain that the human heart will be as tolerant. Once heart action ceased, death<br />
was inevitable, despite attempts at resuscitation. During recompression, as the<br />
absolute pressure exceeded about 50 mm tlg (1 psia), a 3ramatic reduction in<br />
swelling was demonstrated. Breathing usually began spontmwously, the time<br />
being dependent on the duration of exposure at minimum pressure. Heart rate<br />
and blood pressure rose to fairly high levels, then gradually returned toward<br />
normal. Therc was suggestive evidence in the Cooke and Bancroft studies that<br />
denitrogenation prior to exposure, and recompression with 100 percent oxygen,<br />
both improvcd recovery time and decreased mortality. Neurological problems,<br />
including blindness and other defects in vision, were common after exposures<br />
(see problems due to evolved gas), but usually disappeared fairly rapidly.<br />
It is very unlikely that a human suddenly exposed to a vacuum will have<br />
more than 5 to 10seconds to help himself. If immediate help is at hand,<br />
although one's appearance and condition will be grave, it is reasonable to<br />
assume that recompression to a tolerable pressure (200 mm Hg, 3.8psia)<br />
within 60 to 90 seconds could result in survival, and possibly in rather rapid
Bioastronautics Data Book<br />
recovery. There is, of course, no guarantee of a successful outcome; some<br />
animals have died within seconds of decompression and a few others have<br />
had severe, lasting central nervous system damage (Casey, Bancroft, &<br />
Cooke, 1966).<br />
Barometric pressures below those at which adequate blood and tissue<br />
oxygenation can be maintained (about 190 mm Hg, 3.7 psia) must be considered<br />
hostile for more than brief exposures without proper protective equipment (see<br />
chapter 2); those below about 100 mm Hg (1.9 psia) must be considered hostile<br />
for any exposure. Pressures much below 50 mm Hg cause almost immediate<br />
failure of the circulation and total anoxia and must be considered lethal if<br />
sustained for more than 60 to 90 seconds.<br />
Human Tolerance for Low Barometric Pressures<br />
As indicated previously, the partial pressure of water vapor in the lungs is<br />
about 47 mm Hg (0.9 psia). The normal partial pressure of carbon dioxide in the<br />
lungs ranges from 35 to 45 mm Hg (0.7 to 0.9 psia). A partial pressure of oxygen<br />
in the lungs of about 100 mm Hg (1.94 psia) will maintain essentially complete<br />
oxygen saturation of arterial blood. A total barometric pressure of 190 mm Hg<br />
(3.66 psia), then, will support a human being if his environment consists of pure<br />
oxygen. It should he noted, however, that this figure leaves little room for<br />
further reductions such as would occur in the face of space cabin or pressure suit<br />
leaks, temporary failures of gas supply, dilution of the atmosphere by nitrogen<br />
or other inert gases, or carbon dioxide buildup due to inefficient absorption or<br />
scrubbing.<br />
Although this pressure environment will support life for long periods of<br />
time, it has certain inherent disadvantages. Even after virtually complete removal<br />
of inert gases from the body, there is a finite, though minimal, risk of<br />
decompression sickness due to evolved gas. Because oxygen and carbon dioxide<br />
are physiologically active gases, they are absorbed rather rapidly from<br />
gas-containing cavities in the body. This can result in symptoms, especially in the<br />
ears, sinuses, and lungs (Hyde, Pines, & Saito, 1963).<br />
The low density of a pure oxygen environment at 190mm Hg<br />
(0.357 gin/liter, 28 percent of air at sea level) attenuates sound transmission and<br />
also alters, to some extent, the mechanics of the lung-chest system. The<br />
maximum pressure which can be developed by the system is lowered<br />
substantially. This inhibits the effectiveness of coughing and may make it<br />
difficult to rid the lungs of secretions or foreign matter. Breath holding time is<br />
also markedly reduced. On the other hand, the work of breathing at high flow<br />
rates is decreased due to reduction in the proportion of turbulent flow at low gas<br />
density. Thus, it is easier to sustain high ventilation volumes during the<br />
performance of muscular work (Boothby, 1964). Also, respiratory water loss<br />
may be decreased somewhat at low total pressures 0Vortz et al., 1966).<br />
It is not known whether man can tolerate an environment free of "inert"<br />
gases indefmitely. The 14-day Gemini flight and a few altitude chamber tests for
Barometric Pre_ure 7<br />
up to 30 days represent the only available data, and it is noteworthy that these<br />
exposures have been at 258 to 282 mm Hg (5 to 5.5 psia), in the main, rather<br />
than at the minimum tolerable pressures. When much longer exposures arc<br />
contemplated, a number of more subtle factors must be considered. These<br />
include the possible dependence of man himself, or of his normal and essential<br />
saprophytic bacteria, on trace amounts of nitrogen or other "inert" gases. One<br />
study has also indicated that cell wall fragility may be increased at low total<br />
pressures (Bomadini, 1966). Such questions as these can only be answered by<br />
much longer experiments than those which have been conducted to date.<br />
Man has successfully tolerated exposures of 56 days to environments<br />
containing physiological pressures of oxygen, with helium as the diluent, at a<br />
total pressure of 258 mm Hg (5.0 psia). Very careful medical, biochemical,<br />
physiological, and psychological studies disclosed no adverse effects during this<br />
period of exposure other than those which are inevitable under reduced pressure<br />
and which have been mentioned (Welch et al., 1966).<br />
In summary, low barometric pressures, in and of themselves, do not appear<br />
to be harmful to man, insofar as they have been studied critically. There are<br />
disadvantages at pressures so low that pure oxygen must be used as the sole<br />
atmospheric constituent; many of these are minimized or alleviated by the<br />
addition of a small proportion of a diluent gas. Pressures as low as 5 psia appear<br />
to be innocuous for fairly long exposures.<br />
Human Tolerance for Gaseous Environments Composed of Air<br />
Man has been successfully adapting to a wide range of barometric pressures<br />
for many centuries. A skeleton roughly 9000 years old was recently found in<br />
Peru at an elevation of 13 800 feet, equivalent to a pressure of 450 mm Hg<br />
(8.65 psia). Extensive studies have been carried out on acclimatized natives at<br />
elevations of 15000feet in the Andes and on partially acclimatized<br />
mountaineers at 19 000 feet and above in the Himalayas. These environments<br />
are not optimal, and they exert a considerable physiological toll (see chapter 2<br />
under the heading Hypoxia), but they are survivable for substantial periods of<br />
time. There is little evidence that long-term inhabitants at elevations above<br />
10 000 feet differ substantially from their sea level counterparts except for<br />
decreased work tolerance and the presence of certain body adjustments to the<br />
lower partial pressure of oxygen at that altitude.<br />
The usual range of barometric pressure at sea level in the United States is<br />
from about 29 to 31 inches of mercury (14.25 to 15.25 psia). Changes occur<br />
relatively slowly except under very unusual meterological conditions. While<br />
certain psychological and physiological disorders have been attributed to such<br />
changes in pressure, there is no proof of a causal relationship.<br />
There are mines on earth in which maximum depths exceed 10 000 feet<br />
below sea level, equivalent to a barometric pressure of at least 20 psia. There is<br />
no evidence that men working at these depths have been harmed by the pressure.
8 Bioastronautics Data Book<br />
Increasing interest in undersea exploration during recent years has led to a<br />
number of long-term human studies at pressures substantially higher than those<br />
normally encountered by man. While excessive pressures of both nitrogen and<br />
oxygen are toxic to man and animals (see chapter 2), some of the earlier studies<br />
in which air was used as the gaseous medium (Conshelf I, two men, 7 days,<br />
2.05 arm absolute; Conshelf II, six men, 30 days, 1.95 alan absolute; Tektite,<br />
four men, 60 days, 2.27 atm absolute) have shown that man can tolerate at least<br />
2 months of exposure to these environments without apparent harm (Aquadro &<br />
Chouteau, 1967).<br />
Human Tolerance for High Barometric Pressures<br />
Bert, in 1876 (translated by Hitchcoek & Hitchcoek, 1943), described<br />
oxygen toxicity. While this problem is discussed in chapter 2, it should be noted<br />
here that as man has extended his technological capability under the seas, he has<br />
found that if oxygen poisoning and nitrogen narcosis can be avoided, his<br />
tolerance for high barometric pressures is considerable.<br />
If the partial pressure of oxygen in the lungs is maintained at physiological<br />
levels, and if the partial pressure of nitrogen is kept below toxic limits, other<br />
inert gases may be added to man's environment in large amounts. The majority<br />
of work in this area has used helium as the inert pressurizing gas, though some<br />
research has been conducted with other noble gases, notably argon and neon.<br />
Hydrogen has not been popular because of its flammability when mixed with<br />
oxygen, though it also is physiologically inert and has some theoretical<br />
advantages for work at extremely high pressure (see chapter 2).<br />
Leaving aside problems due to changing pressures, the physiological<br />
problems encountered in a high pressure environment are due almost entirely to<br />
the physical characteristics of the gas mixture used to create flaat environment.<br />
At rest, man's instantaneous respiratory flow rate rarely exceeds 1 liter per<br />
second. Under these circumstances, most flow in the airway system is laminar;<br />
turbulent flow occurs only at branchings and in the smallest terminal bronchial<br />
tubes. When physical work is performed, however, ventilation volume and flow<br />
rates increase in proportion to the power output. Under these circumstances,<br />
volumes of 60 to 120 liters per minute and peak flow rates of 5 liters per second<br />
are not uncommon. The proportion of turbulent flow increases substantially and<br />
with it, the metabolic work required to move the air.<br />
Otis, Fenn, and Rahn (1950) derived equations which describe the work of<br />
breathing at various barometric pressures. They showed that the work required<br />
to produce laminar flow is linearly related to the instantaneous velocity of air<br />
movement and is essentially independent of barometric pressure, whereas the<br />
work required for turbulent flow is a function of the second power of velocity<br />
and is directly related to density or pressure. (In calculating the work of<br />
breathing at "altitude, the compressibility of alveolar air must be taken into<br />
account [Jaeger & Otis, 1964]; this factor is relatively unimportant at high<br />
haronletric pressures.) Figures 1-2 and 1-3 illustrate some effects of high
Barometric Pressure 9<br />
pressures on ventilation. Wood, Bryan, and Koch (1969) have recently<br />
demonstrated some of the limiting factors in respiratory mechanics at very high<br />
pressures. The theoretical limit for steady-state breathing at depth is the point at<br />
which the work to move a given quantity of gas requires all the oxygen which<br />
can be extracted by the blood from that increment of gas while it is in the lungs.<br />
>p.<br />
<<br />
t.9<br />
z<br />
p<br />
-r<br />
<<br />
iii<br />
t_<br />
<<br />
Z<br />
Z<br />
o<br />
kU<br />
et"<br />
l--<br />
t.J<br />
tit<br />
G.<br />
BAROMETRIC PRESSURE(psia)<br />
°i<br />
2O 50<br />
-<br />
10<br />
20<br />
'_,,_<br />
100<br />
i<br />
200<br />
I<br />
e-<br />
300<br />
i<br />
AIR<br />
3o<br />
40<br />
5o<br />
60<br />
70<br />
90<br />
1<br />
@- HeO 2 (92%--8%)<br />
ESTIMATED REDUCTION IN MAXIMUM BREATHING CAPACITY<br />
WITH DEEP DIVE (airand8% oxygeninhelium)<br />
i i ! i i I<br />
3 s 7 9 ,'1 ;3 ,5 ,_ ,, 2', 2'3<br />
DEPTH IN ATMOSPHERESABSOLUTE<br />
Figure 1-2. Calculated reductions in maximum ventilatory capacity with increasing deplh<br />
breathing air or He-O 2. (Data of Workman, cited by Wood, 1963)<br />
It is possible, by using combinations of oxygen, nitrogen, and helium, to<br />
maintain a gaseous environment whose partial pressure of oxygen and density<br />
remain at sea level values up to a total pressure of 5.74 atm absolute (84.4 psia),<br />
at which pressure the mixture contains 3.7 percent oxygen and 96.3 percent<br />
helium (figure 1-4). At greater pressures, the density of an appropriate<br />
oxygen-helium mixture increases almost in proportion to the total pressure<br />
(figure 1-5). Using oxygen-helium mixtures, brief habitability studies have been<br />
carried out at pressures as great as 684 psia (equivalent to 1500 feet of water)<br />
and much longer experiments have been conducted to lesser depths (Aquadro &<br />
Chouteau, 1967). These are discussed in more detail in chapter 2, since it<br />
appears that most of the physiological changes observed are due to the gases in<br />
the breathing mixtures, rather than to the pressure per se.<br />
Other problems must be considered when man lives in a gaseous environment<br />
composed mostly of helium. The thermal conductivity of tl|is gas is high; as a<br />
result, higher environmental temperatures are required to maintain man in the<br />
,;_;7 ;;-,_; _) 72 2
10 Bioastronautics Data Book<br />
zone of thermal neutrality (see chapter 3, Temperature). Very recent studies<br />
indicate that during work at depths greater than 600 feet, respiratory heat losses<br />
are considerable and can threaten man's ability to maintain thermal equilibrium<br />
even in the face of increased heat production (Rawlins, 1970). Speech is also a<br />
problem; the low density of helium produces a rise in the fundamental pitch of<br />
the human voice (Cooke, 1964; Cooke & Beard, 1965; Wather-Dunn, 1967).<br />
While this is partially compensated for over a period of time, intelligibility is<br />
appreciably decreased.<br />
Man's ultimate tolerance limits for high barometric pressure are not known.<br />
It is possible that the work of breathing at rest will set a practical limit, although<br />
there may well be other factors yet-undetected, which will limit longer stays<br />
at lesser pressures (see chapter 2). In an effort to extend very considerably<br />
the tolerance limits, Kylstra (1967) has conducted experiments in which<br />
water instead of air is used as the carrier of oxygen and carbon dioxide.<br />
This technique, radical though it seems, may well be feasible at a later<br />
point in time. Extremely high static pressures may curtail or interfere with<br />
biochemical reactions which involve changes in tissue or molecular volume<br />
(Fenn, 1967).<br />
t,<br />
's<br />
450<br />
4OO<br />
35O<br />
30O<br />
250<br />
200<br />
150<br />
100<br />
50<br />
t8<br />
II<br />
|| _ O2-N 2 MIXTURE<br />
II<br />
II _-- O2-HeMIXTURE<br />
II<br />
II<br />
I<br />
\ ',\ ,,<br />
\ ',\ "..<br />
\ ',\ -.<br />
>-..____<br />
N, o He ---<br />
0(_ 20 40 60 80 1(30<br />
120<br />
VENTILATION (Ltrnin)<br />
200<br />
175<br />
150<br />
125 _<br />
100 ""<br />
0<br />
7s g<br />
Figure 1-3. Measured (to 200 ft) and computed data for decreases in ventilation with<br />
increasing depth at constant values of respiratory work: 1.8 kgM/min, "a level which can be<br />
sustained for many hours," and 7.2 kgM/min, "respiratory work which can only be<br />
performed for a few minutes." (Redrawn from the data of Buhlmann, 1963)<br />
5O<br />
25
IO0<br />
8O<br />
_ 60<br />
Barometric Pressure 11<br />
DEPTH (feet of sea water)<br />
) 30 6O 90 120 180<br />
Z .<br />
_ 40<br />
Z<br />
i / X<br />
l l _1<br />
BAROMETRIC PRESSURE (psia)<br />
Figure ]-4,. Mixtures of 02, N 2, and He which will maintain sea level equivalent density<br />
and normal PO 2 in the lungs at various total pressures. Above 5.74 alan absolute, sea level<br />
gas density cannot be maintained without resorting to H2-O 2 mixtures. (Billings, ]964,)<br />
PRESSURE, ATMOSPHERES ABSOLUTE<br />
S tO 15 20 25 3O<br />
61 , I T T I --<br />
5 2O<br />
x"_ o<br />
-- ---- (/_NS¢7¥OF A_Ft_ISf_tlV_ (_'C<br />
coNc_ _r_ar_oN oF o 2 for _7 oF<br />
DEPTH IFEET OG SEAWATER)<br />
I<br />
• 0<br />
Figure 1-5. Density of mixfures of He and 0 2 which will maintain a sea level equivalent<br />
PO 2 in the lungs, as a function of barometric pressure and depth in the sea water. (Billings,<br />
]964)<br />
z<br />
g<br />
z
12 Bioastronautics Data Book<br />
Changes in Barometric Pressure<br />
It has been indicated that human tolerance for barometric pressure extends<br />
from less than four to at least several hundred psia. Changes in barometric<br />
pressure in themselves, however, also exert profound physical and physiological<br />
effects on man. This section deals with increases and decreases in pressure.<br />
Effects of Increases in Barometric Pressure<br />
Increases in barometric pressure are encountered during descents through the<br />
atmosphere (whether in space vehicles, aircraft, or elevators), during repressurization<br />
of a space vehicle following extravehicular activity, and during dives in<br />
water. Local increases in pressure within the body, sometimes of considerable<br />
magnitude, occur with coughing, sneezing, blowing the nose, and with<br />
mechanical straining in the act of defecation. Exposure to high dynamic<br />
pre_ures, as well as high rates of change of pressure, occur when the body is<br />
suddenly subjected to windblast during ejection from aircraft. Still higher<br />
pressures are encountered in the vicinity of an explosion.<br />
Problems Due to Trapped Gas Within the Body. If the human body were<br />
composed entirely of fluids, it would tolerate quite sudden changes in pressure<br />
well. The body has several cavities, however, which normally contain gas. The<br />
most important during increases in pressure are the ears, the paranasal sinuses,<br />
and the lungs. When rates of compression are relatively slow (no more than 1 to<br />
2 psi/second), the primary concern is the ear. Such rates of change can occur<br />
during the dive of a fighter aircraft, during emergency recompression of an<br />
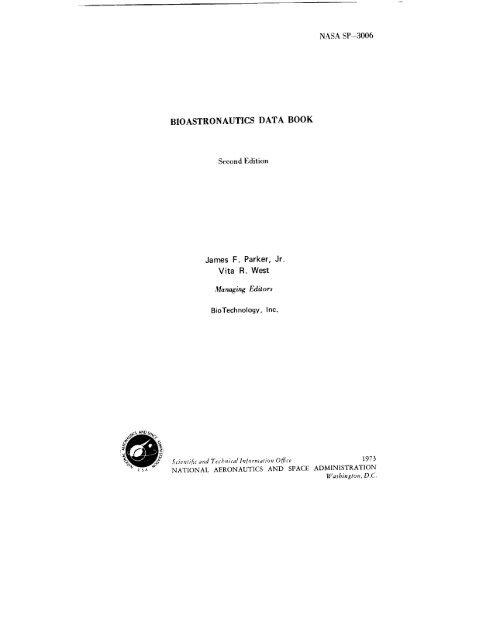
altitude chamber, or during a diver's descent through water.<br />
The Ear. The eardrum is a slightly flexible partition between the external<br />
ear canal and the middle ear, a small air fdled cavity which communicates with<br />
the environment only through the Eustachian tube, which opens into the back<br />
of the nose (figure 1-6). Air leaves the middle ear passively during decompression<br />
or ascent, but the mucous membrane lining the tube tends to prevent air from<br />
reentering the Eustachian tube without voluntary muscular effort during<br />
recompression.<br />
Rapid recompressions from 28 000 feet to sea level, an increase of 10 psia,<br />
were performed by Raeke and Freedman (1961). The rates of change are shown<br />
in figure 1-7. None of the subjects sustained serious ear damage during the tests.<br />
In three of 28 tests, however, it was necessary to initiate reascent of the chamber<br />
to aid the subjects in equalizing pressure across the eardrum.<br />
Table 1-3 summarizes the symptoms which result from a differential pressure<br />
across the eardrum. Once high differentials exist, it is difficult or impossible to<br />
force air into the middle ear voluntarily; avoidance of such differentials requires<br />
frequent attention during rapid descents. Descents of less than 500 feet per<br />
minute in the lower atmosphere (0.25 psia/minute) are usually tolerated by<br />
inexperienced air passengers without difficulty, though modern pressurization<br />
controllers arc usually operated at perhaps half this rate.
EXTERNAL<br />
EAR CANAL<br />
o. 12<br />
B,9_rome_c Prea_ure 13<br />
ACHIAN<br />
BE<br />
Schematic of the middle ew, showing the<br />
rigid structure except it the eardrum, whid/t<br />
is semi-flexible. The Eustldlian tube<br />
openings arm at the junction of the nml<br />
calvity and the upC)er throat.<br />
During ascent, the prer_lre in the external<br />
am" c,_mel and no_ drops, creating a po_.ltive<br />
differential within the middle ear. The<br />
eardrum buses o_rward, then air leaves the<br />
middle ear.<br />
Durin 9 descent, a negative pressure<br />
differential is created within the middle ear.<br />
The drum is pud_ed inward, but air cannot<br />
re_nter the middle ear without voluntary<br />
effort.<br />
F_tre 1-6. Effect of pressure change on middle ear.<br />
]4 1.0 75 ....<br />
,,_ 10000 __<br />
_- 15000<br />
NUMBERS IN PARENTHESES<br />
REFER TO NUMBER OF<br />
_n SUBJECTS COMPLETING 20000 Ouu<br />
0 10 20<br />
RUNS AT RATES SHOWN<br />
I 25000<br />
30 000<br />
i i<br />
30 40 50 60<br />
TIME FROM START OF RECOMPRESSION - see:<br />
Figure 1-7. Rapid compressions from 4.7 to 14.7 psi (28 000 ft to sea level).<br />
(Raeke & Freedman, 1961)
14 Bioastronautics Data Book<br />
Ascent<br />
(mm Hg)<br />
+3-5<br />
0<br />
+10 - 15<br />
+15 - 30<br />
+30 plus<br />
tModifiecl trom Adler, 1964)<br />
Table 1-3<br />
Type of Ear Complaints Encountered During<br />
Change in Barometric Pressure<br />
Complaint<br />
Descent<br />
(mrn Hg)<br />
No sensation; hearing is normal (level flight) 0<br />
Feeling of fullness in ears - 3 - 5<br />
More fullness, lessenedsound intensity -- 10 -- 15<br />
Fullness, discomfort, tinnitus in ears: - 15 - 30<br />
Ears usually "pop" as air leavesmiddle ear<br />
Desire to clear ears; if this is done, symptoms<br />
stop<br />
Increasing pain, tinnitus, and dizziness - 30 - 60<br />
Severe and radiating pain, dizziness, and nausea -- 60 -- 80<br />
Voluntary clearing becomes difficult or<br />
impossible - 100<br />
Eardrum ruptures 200+<br />
NOTE: During ascent pressure in middle ear is higher than ambient pressure; during<br />
descent, middle ear pressure is lower than ambient.<br />
The likelihood of difficulty in "clearing the ears," and thus the likelihood of<br />
barotitis, as ear trouble due to pressure change is called, is much greater in an<br />
individual in whom the nasal mucous membranes are swollen, with resultant<br />
constriction of the Eustachian tube orifice. This occurs with upper respiratory<br />
infections such as the common cold, nasal allergies (hay fever), and the like.<br />
Barotitis is the most common medical problem in the flying population, largely<br />
because the conditions which cause it are so common in temperate climates.<br />
The Sinuses. The paranasal sinuses are small, rigid air filled cavities in dae<br />
skull. They communicate with the nose through small ducts. Unlike the<br />
Eustachian tube, these ducts show no particular predisposition to blockage<br />
during descent. Inflammation or swelling of the mucous membranes of the<br />
sinuses oF nose, however, can cause partial or complete obstruction of these<br />
ducts, and thus a differential pressure between the sinus and the environment<br />
during changes of environmental pressure. Severe or incapacitating pain may<br />
result, a condition known as barosinnsitis.<br />
The Teeth. Occasionally, toothaches are reported during changes in<br />
barometric pressure; this is called barodontalgia. The condition usually<br />
occurs in teeth which have been filled, or in which cavities are present. The<br />
explanation usually given is that a small air bubble is trapped below a
Barometric Pressure 15<br />
restoration or in the decayed tooth substance. There is, however, evidence that<br />
loose fillings may allow saliva to penetrate into the interior of these teeth during<br />
changes of pressure (Restarski, quoted by Adler, 1964).<br />
In summary, symptoms due to trapped gas are relatively common in altitude<br />
chamber flights, where the changes in pressure are fairly large. It should be<br />
noted, however, that the rate of pressure change with changes in altitude is<br />
greatest near sea level. The three problems cited, therefore, commonly occur at<br />
comparatively low altitudes and in diving. Barotitis, in particular, often occurs<br />
below 5000 feet altitude. The incidence of such problems in a large number of<br />
routine altitude indoctrination "flights" is shown in table 14.<br />
Table 1-4<br />
Incidence of Symptoms Due to Trapped Gas<br />
in 51 580 Altitude Indoctrination Flights*<br />
Severity (Grade)<br />
Symptoms Total<br />
I I! Ill IV<br />
Ear pain 6650 2437 514 - 9601<br />
Abdominal pain 2738 1187 322 12 4259<br />
Sinus pain 1516 723 176 -- 2415<br />
Toothache 285 142 118 - 545<br />
TOTAL 11 189 4489 1130 12 16820<br />
Numbers shown are rates per 100 000 man-flights.<br />
(From data ot Berry, 1958)<br />
The Lungs. Unlike the middle ear, sinuses, and teeth, the lung-chest<br />
system is'capable of wide variations in volume. Its minimum, or residual, volume<br />
in an adult male is commonly less than 1.5 liters; its maximum volume during<br />
full inspiration may exceed 8liters. When barometric pressure increases,<br />
therefore, the volume of gas in the lungs is free to contract. If the lungs are in<br />
communication with the environment, air flows into them. During breath-<br />
holding diving, however, the volume of air in the lungs contracts in accordance<br />
with Boyle's law (allowing for the constant pressure of water vapor).<br />
If the pressure ratio (ratio of final to initial pressure) is such as to compress<br />
the air in the lungs to less than the residual volume of the system, a phenomenon<br />
known commonly as "squeeze" occurs. The relative vacuum in the lungs causes<br />
an increase in the blood volume in the chest. The lungs are pulled toward a<br />
position of greater collapse than they can attain within the closed chest; the<br />
result is pain and hemorrhage into the lung tissue and airways. This condition is<br />
of practical importance only in underwater work, where large changes in
16 Bioastronautics Data Book<br />
pressure can occur rapidly. It is the hmiting factor in brcath-holding diving<br />
(Schaefer et al., 1968). Squeeze can also occur in face masks used in diving if air<br />
is not introduced into the mask during descent.<br />
Problems Due to High Dynamic Pressures on the Body. During ejection or<br />
manual escape from aircraft, a pilot is suddenly thrust from a cockpit in which<br />
the air around him is moving at the same velocity he is into an environment in<br />
which he is a projectile. The dynamic pressure Q exerted on the frontal surface<br />
of his body (if he is facing forward) is a function of the air density and his<br />
airspeed.<br />
Pressures of 1000 psf (7 psig) are not uncommon during high speed, low<br />
altitude ejections. Figure 1-8 shows data collected during human exposures to<br />
high dynamic pressure produced on an underwater centrifuge. The figure shows<br />
injuries produced by the more severe exposures. Figure 1-9 shows the separation<br />
forces developed on the arms and legs plotted against overall dynamic pressures<br />
(Fryer, 1962). It should be noted that ejection in the rearward facing position<br />
offers a substantial degree of protection against Q forces, by interposing the seat<br />
between the subject and the source of pressure (see chapter 4, Sustained Linear<br />
Acceleration).<br />
Problems Due to Blast. A pressure wave, moving outward from the source of<br />
an explosion, may act as do high dynamic pressures on people and objects in its<br />
path. Many injuries caused by explosives are due to bodies being thrown about.<br />
If a body is restrained, however, the overpressure will cause different<br />
displacements of the compressible and incompressible portions of the body.<br />
These overpressures, and tile following underpressures, involve very rapid<br />
changes of pressure and thus of local force fields within the body. The chest, and<br />
other air filled cavities, not being entirely elastic, cannot respond instanta-<br />
neously. As a result, substantial shear forces are produced, with tearing of<br />
tissues.<br />
No data are available on fatal shock pressures in man. Figure 1-10 shows<br />
50 percent lethal shock pressures for animals restrained in a shock tube, with an<br />
estimate of the median lethal overpressure for man. Figure 1-11 shows calculated<br />
curves of equal maximum strain in the human lung.<br />
The pulse signature of sonic booms involves an almost instantaneous rise in<br />
pressure, a ranrp decay, and a very rapid return to atulospheric pressure<br />
following the passage of the wave (N wave). Sonic booms, however, rarely<br />
involve peak pressures of more than 10 psf; pressure changes of this magnitude<br />
are annoying, but not physically harmful, to humans. Most booms encountered<br />
Pv2<br />
on the ground have peak pressures no higher than 1 to 2 psf.<br />
2
.0<br />
g<br />
b<br />
1000<br />
800<br />
600<br />
400--<br />
2OO<br />
0<br />
0<br />
Barometric Pressure 1 7<br />
t o tsT,<br />
HEMORRHAGE<br />
4 8 12 16 20 24<br />
TIME - sec<br />
Figure 1-8. Data obtained on two subjects in ejection seat attached to arm of underwater<br />
centrifuge. Subjects wore rubber suits, full face helmets, and mouthpieces for underwater<br />
breathing. They held their breath during accelerations. Maximum forces shown (1030 psf)<br />
were obtained at 32.6 fps equivalent to 515 kts in air. Time course of runs is shown. (Drawn<br />
from data of Fryer, 1962)<br />
7OO<br />
60o I<br />
Ok<br />
o 3oo _ ........<br />
20o .._ v<br />
0 200 400 600 8(30 1000 1200<br />
J.<br />
PEAK 'Q'-Ib$/ft 2<br />
Figure 1-9. Leg and elbow _paration forces, determined by strain gauges attached to arm<br />
andleg restraints during underwater centrifuge rims shown in figure 1 - 8. (Drawn from data<br />
of Fryer, 1962)
!8 Bioastronautics DataBook<br />
o<br />
N<br />
Q.<br />
100<br />
., 50<br />
n¢<br />
_ 4o<br />
o. 311<br />
v<br />
U<br />
0<br />
_ 2o<br />
0.01<br />
I<br />
AVERAGE BODY WEIGHT - kg<br />
0,I 1.0 10<br />
I !<br />
MO_SL NEA__RABBIT<br />
PIG<br />
GOAT<br />
10 l I i I i<br />
0.01 0.1 1.0 10 100<br />
AVERAGE BODY WEIGHT- Ibs<br />
100<br />
!<br />
..i_'"<br />
ESTIMATE<br />
•FOR 70 ks<br />
ANIMAL<br />
Figure l-I0. Overpressures necessary to kill 51F/o of animals of various species exposed in a<br />
shock tube to overpressure lasting 350 to 412 msec, extrapolated to estimate median lethal<br />
overpressure for 70 kg (man-sized) animal. (Sources: Richmond & White, 1962)<br />
i03<br />
a. io _<br />
g<br />
10 I<br />
--A I , i i [ 1,, T , , , , ,,,i I ! , , , ,,lj , , , ,ll,,j , , , ,,,,<br />
-- lit__LETHAL PRESSURE<br />
I00 FOR BLAST IN WATER<br />
J'x.__<br />
CALCULATE X'--LO . AIR o'N<br />
FOR MODEL ---e.\ _ EXTRAPOLATED TO MAN _"<br />
_ (RICHMOND AND WHITE)_<br />
_ / RAMP COMPRESS)ON<br />
_, 'L_ _2Ps,,CORRESPOND,NG , TO__/<br />
~104 PSI STATIC COMPRESSION<br />
a. OF LUNG TO I/8 ORIGINAL<br />
0_ VOLUME i J<br />
f- CORRESPONDS TO BO MM H 0 i<br />
i<br />
/ STATIC OVERPRESSURE IN LUNG To= I / RAMP DECOMPRESSION<br />
I POSSIBLE LUNG RUPTURE fo /<br />
,, -<br />
I ....... ' • • - Jill<br />
I0 "4 IO -3 I0 -2 IO-I I I0<br />
DURATION T, SEC,<br />
Figure 1-11. Calculated curves of equal strain in human lung in response to blast, ramp<br />
compression, and ramp decompression, as a function of overpressure and duration of event.<br />
(Source: yon Gierke, 1964)
Effects of Decreases in Barometric Pressure<br />
Barometric Pressure 19<br />
Decreases in barometric pressure occur when a diver ascends through water,<br />
or when an aircraft or space vehicle ascends through the atmosphere. More<br />
sudden decreases in pressure are encountered during depressurization of an<br />
aircraft, space cabin or pressure suit, whether accidental or intentional.<br />
Effect of Decompression on Trapped Gases.<br />
The Ears, Sinuses, and Teeth. It was mentioned previously that the ear<br />
rarely poses a problem during ascent because the structure of the Eustachian<br />
tube allows air to escape from the middle ear passively. Pain in the sinuses is<br />
more likely to occur if an obstruction to airflow exists. Tooth pain is probably<br />
more common during ascent than descent.<br />
The Stomach and Intestines. The human gut contains a variable amount<br />
of gas, some of it swallowed with food and saliva, the rest arising from the<br />
metabohc activity of gas-forming bacteria in the intestinal tract. The volume of<br />
intestinal gas at sea level usually varies from about 0.05 to 0.10 liters. Ingestion<br />
of gas-forming foods, such as baked beans, can, however, elevate this value by an<br />
order of magnitude (Allen & Chinn, cited by Greenwald, Allen, & Bancroft,<br />
1967). In one series of experiments, Greenwald and coworkers (1967) observed<br />
increases in intestinal gas volume in subjects decompressed to high altitude<br />
(figure 1-12), together with a roughly predictable increase in the incidence of<br />
abdominal symptoms (figure 1-13). In these studies, however, subjects<br />
attempted to retain intestinal gas throughout the exposures.<br />
Normally, an increase in the volume of a gas bubble in the gut causes<br />
stretching of the walls of the tube, which reflexly causes propulsive muscular<br />
contraction of the walls, together with tbe feeling known as "cramps." These<br />
propulsive contractions usually move rite gas to the lower bowel, from which it<br />
is expelled. If the gas is in the stomach, it is expelled by belching. Such gas<br />
bubbles have, however, been known to cause vomiting in divers during ascent.<br />
Adler (1964) reported a lower incidence of symptoms due to intestinal gas<br />
during routine altitude chamber flights.<br />
Bryan (1961) has hypothesized that whereas relatively slow expansions of<br />
intestinal gas leads to muscular contractions, cramps, and, usually, to expulsion<br />
of gas, very rapid expansion during a rapid decompression may simply result in<br />
extreme stretching of a relaxed gut wall, which, by reflex action, can cause<br />
marked slowing of the heart and unconsciousness without warning. It may be<br />
difficult to differentiate fainting due to this from that due to lack of oxygen or<br />
to decompression sickness.<br />
The Lungs. Although tbe air in the lungs and airways is normally in free<br />
communication with the environment, the outward flow of air during a very rapid<br />
decrease in barometric pressure is limited by aerodynamic considerations. The<br />
physical damage that may occur in the lungs is generally considered to be<br />
the critical limiting factor in human tolerance for very rapid
20 Bioastroanutics Data Book<br />
decompressions. Haber and Clamann (1953) have defined pressure transients<br />
during rapid decompression in terms of the two principal parameters. The<br />
time characteristic, tc, has the general form:<br />
V<br />
tC-Ao C<br />
Where V is the volume of the container being compressed, A is the effective<br />
area of the orifice (A is always somewhat smaller than the geometric<br />
orifice, for aerodynamic reasons), and C is the velocity of sound.<br />
3<br />
O<br />
g<br />
><br />
1,0<br />
0.6<br />
Barometric Pressure 21<br />
0.2 - "_.=_"'_ I a [BPTS]<br />
I I I I I Ol I<br />
200 400 600 760<br />
J PRESSURE(mmHg) 1<br />
I I I I<br />
40,000 25,000 {8,000 10,000 0<br />
PRESSURE:ALTITUDE(ft)<br />
1.0<br />
0.6<br />
_u<br />
0<br />
l--<br />
u<br />
Z<br />
0.2 _u<br />
Figure 1-13. Incidence of symptoms of abdominal fullness or pain (circles) during<br />
slow decompressions, versus average increase in intestinal gas volume at indicated<br />
pressures. Curves for initial gas volumes were derived from equation shown, in which<br />
P1 = ambient ground level pressure, P2 = pressure at any point during ascent,<br />
Pla=intraabdominal pressure (gauge), and Pw=water vapor pressure at body<br />
temperature. (Adapted from Greenwald, Allen, & Bancroft, ]967)<br />
The pressure factor P" is a function of the initial pressure Pi and the final<br />
pressure Pf in the container (figure 1-14).<br />
The total decompression time, or duration of the transient td is the<br />
product of the time characteristic of the system te and the pressure<br />
factor P':<br />
td = tc • p'<br />
If the time characteristic of the human lungs and airways is greater than<br />
the time characteristic of the pressure suit or cabin in which a subject is<br />
confined during a decompression, a transient differential pressure buildup<br />
must occur within the lungs. This is illustrated diagrammatically in<br />
figure 1-15.<br />
Figure 1-16 shows experimental data demonstrating the differential<br />
pressures observed during various decompressions. Points have been derived
22 Bioastronautics Data Book<br />
from the data of Luft and Bancroft (1956) and Luft, Bancroft, and Carter<br />
(1953). Though Adams and Polak (1933) have shown that the mammalian<br />
lung may rupture, when distended by a differential pressure above about<br />
80mm Hg, tile subjects for whom data are shown in the figure were<br />
apparently uninjured. Figure 1-17 shows the time characteristic as a function<br />
of container volume V and effective orifice area A. The time characteristic<br />
for one of tile subjects whose data are plotted in figure 1-16 is shown.<br />
Since the volume of the lungs varies with respiration, it is obvious that the<br />
time characteristic of the lungs may vary considerably, depending on the<br />
phase of respiration during which a rapid decompression occurs. The time<br />
characteristic increases to infinity during swallowing or straining, when the<br />
airway is closed by the glottis. Severe lung injury or death can result from<br />
a rapid decompression while the glottis is closed.<br />
h.<br />
t-¢<br />
O<br />
_-=<br />
U<br />
IJ_<br />
133<br />
rv<br />
tit<br />
O_<br />
4 i<br />
,I I | I<br />
.2 .4 .6 .8 t.0<br />
FRACTIONAL PRESSUREDIFFERENTIAL Pi'Pf<br />
Figure 1-14. Pres_re factor P°related to fractional pressure differential.<br />
(Drawn from data of Haber & Clamann, 1953)<br />
Experiments on dogs rapidly decompressed from 180 to less than<br />
2 mm Hg (a fractional pressure differential of 0.99) in 1.0 or 0.2 seconds demon-<br />
strated lung damage in all cases. Changes in the lungs after a 1 second decompression,<br />
however, were reversible in animals who stayed at the low pressure for short<br />
periods of time; they became more severe and lasting as exposure time at 2 mm Hg<br />
increased (figure 1-18). If total exposure time was less than 90 seconds, only mild<br />
residual findings were observed. Faster decompressions produced more severe and<br />
lasting damage (Dunn, 1965). Estimates of the probable danger zone for explosive<br />
decompressions are shown in figure 1-19.
.J<br />
z<br />
v-<br />
E<br />
E<br />
kU<br />
IOO<br />
o<br />
Barometric Pressure 23<br />
CABIN PRESSURE<br />
------ PRESSURE WITHIN LUNGS<br />
n._ DIFFERENTIAL PRESSURE<br />
(Plung - Pcab_n )<br />
0 .2 .4 .6<br />
TIME AFTER DECOMPRESSION - $ec<br />
Figure 1-15. Schematic diagram of origin of pressure differentials in the lungs<br />
during rapid decompression. (Redrawn from Luft, 1954,)<br />
:i 1 o<br />
6O<br />
40m<br />
20<br />
I<br />
DECOMPRESSION<br />
0.1<br />
RANGE,P i - P!<br />
125-|75 mmHg<br />
176-225<br />
226-275<br />
305<br />
405<br />
453<br />
503<br />
O<br />
0.2 0.3 0.4 0.5<br />
°_, _o,o<br />
o<br />
: ° 1<br />
.EACH POINT REPRESENTS ONE_<br />
HUMAN DECOMPRESSION<br />
RANGE OF DECOMPRESSION<br />
TIMES: 0.1 - 0.5 SECONDS<br />
I l I<br />
0,6 0.7 0.8 0.9<br />
Pi " Pf<br />
FRACTIONAL DIFFERENTIAL OF DECOMPRESSION: --<br />
Figure 1-16. Human exposure to rapid decompressions involving significant pressure<br />
differentials in lungs. (Drawn from data of Luft & Bancroft, 1956; and Luft, Bancroft, &<br />
Carter, 1953)
24 Bioastronautics Data Book<br />
o 10o(<br />
W<br />
z<br />
J<br />
100<br />
1.q<br />
++++<br />
Figure 1-17. Time characteristic, tc, as a function of container volume<br />
and effective area of orifice. (After Luft & Bancroft, 1956)<br />
TIME OF AUTOPSY<br />
I-1 oay of Oecompre$$1on<br />
[] 1-5 Days Postdecompression<br />
[] 7--21 Days Postdecompres$ion<br />
3 5 10 30 60 75 90 120 135<br />
EXPOSURE TIME (secsl<br />
f/r<br />
!<br />
I ,<br />
150 165<br />
Figure 1-18. Damage produced in lungs of dogs decompressed from 180 to less than<br />
2 mm Hg in 1 see with 5-see reeompressions after various times at peak altitude. Each<br />
column represents one dog, autopsied at time indicated by shading. Scale of damage:<br />
+: Mild reversible changes<br />
++: Several reversible changes together, or moderate damage<br />
+++: Severe changes, including hemorrhage involving 30% of the lungs<br />
++++: Hemorrhage involving 30% of the lung substance.<br />
(Taken from Dunn, 1965)
l)_aronlulri( ' Pres_|lr¢ _3<br />
t._ ZONE OF PROBABLE'OANGER<br />
t3E" IE ZONE IN WHICH LESIONS<br />
£_ HAVE 0CCURnEO<br />
m<br />
11<br />
10<br />
5<br />
\<br />
SAFE<br />
______ ZONE<br />
I I 1<br />
200 100 50 20 10 5<br />
DIMENSIONAL FACTOR, F 2 = rn"<br />
Fi_,mrc 1-19. Curve deriw_d l'ronl dala of Violet|c, defining zones of safely alld probabh"<br />
danger m cxplosiw_ decompression. (Source: Fryer, 1965; rcprinled by permission of ltlc<br />
Controller of I lcr I{rilannic Majesty's Stationery Office)<br />
Problems I)ue to Evolved Gas Within the Body. During prolonged exposure<br />
to atmospheres that contain physiologically inert gases (nitrogen, hyttrog¢'n,<br />
helium, argon, xenon, anti krypton), the body fluids (water and fat) contain<br />
amounts of these gases in solution proportional to the partial pressure of the gas<br />
in inspired air and the solubility of the gas in water an(t fat at body temperature.<br />
if the body is subsequently exposed to a much lower barometric pressure, inert<br />
gases tend to eome out of solution (the phenomenon of efferw_sccnce). Oxygen,<br />
carhon dioxide, and water vapor diffuse rapidly into cvolw_d bulddcs of inert<br />
gas. Such huld)les, if they fornl in tissues, may produce pain, especially around<br />
the joints. Bubbles within fat cells may cause rupture of the cell walls, allowing<br />
fat to enter the circulation. If l.dd)les form within blo.d w_ssels, they are carried<br />
to the small terminal W_s_rls of the body (especially the hmgs) where they lodge,<br />
cutting off the blood supply of the tissu,'s l._hind them. The symptoms caused<br />
by evolved gas are known collectively as (tecon}pressi,)n sickness.<br />
This (lisordcr is a potential probh'ni in diw_rs who ascend to the surface of<br />
the water after minutes or hours at depth, in caisson workers who are<br />
decompressed at the end of each working day, an(I in aviators or astronauts who<br />
arc exposed to h)w barometric pressures after reaching equilibrimu at higher<br />
pressures.<br />
l)ecomprcssion Sickness. I)ecompression sickness in its various forlns is<br />
much nii)re ,:(;,_no_mi-n dlvi.rs_ind caisson workers than in aviation personnel. In<br />
m 3
26 t+ioa+trorlaulicsl)ala Book<br />
the latter context, it ha_ been reported at altitudes as low as 8000 hn_'t<br />
(10.9 psia) in pih_ts who took off shortly after a peri
1oo<br />
_n _E 80<br />
0<br />
I-<br />
_ 6o<br />
z<br />
z 40<br />
I-<br />
_1<br />
:_ 20<br />
u<br />
T i<br />
/<br />
O",_ , , ,<br />
0 30 6o<br />
Barometric Pressure 27<br />
2 TIMES STANDARD<br />
/ /<br />
-/<br />
/<br />
f<br />
RD EXERCISE<br />
I l I ¢<br />
90 i2o<br />
DURATION OF EXPOSURE TO ALTITUDE - rain<br />
Figure 1-21. Effect of muscular cxercL_e on appearance of symptoms of decompression<br />
sickness at 38 000 ft (3 psia). Number of subjects varied from 53 to 139. Standard exercise<br />
was 10 step-ups onto a 9 in stool in 30 sec, repeated every 5 rain. (Drawn from Henry,<br />
1956)<br />
BODY WE IGHT (Ibs)<br />
Figure 1-22. Proportional incidence of bends as a function of body weight in 44 181<br />
trainees undergoing altitude chamber training during World War !I. (Data of Motley et al.,<br />
summarized by Adler, 1964)
28 Bioastronautics Data Book<br />
inert gases prior to or during ascent. The quantity of inert gas in solution in the<br />
human body at equilibrium is a function of the partial pressure of that gas in the<br />
inspired air and the solubility of the gas in water and in fat. When the inert gas is<br />
removed from the inspired gas mixture, the gas will be cleared from the body<br />
(washed out) at a rate which depends on a number of factors. Among these are<br />
the ventilation volume and the cardiac output, both of which are elevated during<br />
exercise. Inert gas in the lungs is diluted and washed out very quickly. Blood<br />
coming to the lungs is also cleared relatively rapidly. The clearance of gas from<br />
the various tissues of thc body proceeds at a rate proportional to the blood flow<br />
through the tissues, the solubility of the gas in water versus that in oil, and<br />
tissue-blood vessel geometry.<br />
Table 1-5<br />
Incidence of Decompression Sickness in High Pressure<br />
Type<br />
Environments and at High Altitude<br />
Incidence (%)<br />
Caisson Workers* Altitude Workers**<br />
Bends (alone or with<br />
other symptoms) 33.34 2.4<br />
CNS symptoms 2.98 0.03<br />
Chokes 0.60 0.07<br />
*Data of Keays, in Adler (1964) for 557 000 work shifts in 10 000<br />
caisson workers.<br />
**Data of Berry (1958) for 51 580 man-exposures in altitude chamber<br />
training flights. Number of subjects is not specified, but the number<br />
of exposures per man was probably one in nearly all cases.<br />
Nitrogen is very soluble in fat and less soluble in water. In contrast, helium is<br />
only slightly soluble in body fluids. Nitrogen is cleared from the body rather<br />
slowly, helium much more rapidly. Elimination of either gas is facilitated by<br />
exercise. This is illustrated in figure 1-23.<br />
As noted above, inert gas may be eliminated from the body by breathing air<br />
free of that gas. Most studies of decompression sickness have utilized 100 percent<br />
oxygen as the inspired gas during the nitrogen washout period. The effect of such<br />
preoxygenation (actually preexposure denitrogenation) is illustrated in<br />
figure 1-24. In all cases, after a control period at ground level, subjects were taken<br />
to 38 000 feet breathing oxygen, at which altitude they performed five knee bends<br />
every 3 minutes until the appearance of joint pains, presumably caused by<br />
extravascular bubble formation. The protective effect of nitrogen washout is in<br />
part a function of the duration of preoxygenation prior to exposure to altitude, but<br />
protection is not entirely proportional to the extent to which body nitrogen stores<br />
are depleted. Occasional cases of decompression sickness an; seen even after many<br />
hours of preexposure denitrogenation.
.?.<br />
100<br />
80<br />
60<br />
__ ___,_ :_ --7,_" '-<br />
__ _.',¢/_ /<br />
Barometric Pressure 29<br />
v _.11-<br />
_C l , iZ_+l<br />
z<br />
I .,,_"_ i Wo* I _<br />
3Obl_.+_<br />
lii<br />
r //_ /<br />
.,/_ _.<br />
if" i<br />
'/<br />
10 20 30 40 50 60 70<br />
80<br />
TIME OF EXPO,SURE TO ATMOSPHERE FREE OF GAS - rain<br />
Figurt. 1-23. N 2 and lie washout by 0 2 breathing at sea level, with and without exercise.<br />
(|)rawT1 from data of Bchnke, 1945; Balke, 1954; and Roth, 1959; repr/nted by permission<br />
of Williams & Wilkins Co., Baltimore, Maryland)<br />
co<br />
I<br />
100<br />
S0<br />
6o<br />
u t0<br />
..-¢_+, I_ II:_i_ll i_.",'¢' R E O X y 5 E NA T ION : -<br />
/ _!!!'¢:- ,_...... _ooo ,,• ....<br />
•_- " i_ir" : .., "#':" -<br />
_ I ..-._J'i"r ,,'ij j<br />
$l .:,:H:biir / L ;_h'ii' I<br />
_' 1 +_-_-_<br />
/,.,lii_i-qi." l,-:'!_'" |<br />
C<br />
0 10 20 30 40 50 60<br />
DURATION OF EXPOSURE AT 38,000 FEET - mln<br />
Figure 1--24. Effect (if N 2 washout (cffccted by breathing 0 2 for 30 to 12(t rain at _'a<br />
level or 18 000 ft) on appearance of bends during sub_qucnt exposure at 38 000 f! with<br />
exercise. (Drawn from data of Balkc, 1954; and Marbargcr, 1957)
30 Bioastronautics Data Book<br />
The washout rates of nitrogen and helium were illustrated in figure 1-23.<br />
Since both of these gases (as well as neon) have been suggested as atmospheric<br />
constituents for long-term space missions, it is well to mention that there are<br />
appreciable differences between the two as regards the decompression sickness<br />
which can occur when they are used. Figures 1-25 and 1-26 indicate that<br />
following decompression from 7.0 to 3.5 psia, bends symptoms appeared earlier<br />
with helium than with nitrogen, and required greater increases in pressure before<br />
relief of symptoms occurred (Beard et al., 1967). This is similar to the<br />
experience in diving, in which both gases have been used extensively. Even<br />
though the blood and tissue fluids contain less helium than nitrogen after<br />
saturation at any pressure, exposure to a lower pressure where bends can occur is<br />
more likely to lead to symptoms, and the symptoms are likely to be more severe,<br />
with helium. This is presumably because of helium's relative insolubility in body<br />
fluids as compared with nitrogen.<br />
LU<br />
L)<br />
Z<br />
Z<br />
loo<br />
e,- 40<br />
80<br />
TIME OF ONSET<br />
II BOUTS OF E EX RCISE - --_<br />
O, J _4<br />
25 50 75 100<br />
TIME (min)<br />
Figure 1-25. Time of onset of bends during standard work at 3.5 psia following prolonged<br />
exposure to ltc-O 2 at 7 psia (24 cases of bends in 106 flights) or N2-O 2 at 7 psia (21 cases<br />
of bends ill 119 flights). Subjects breathed 100% 0 2 while al 3.5 psia. (Taken from Beard et<br />
•,d.,1967)<br />
Treatment of Decomprcs_ioq SicknessL The treatment of decompression<br />
sickness consists prlnlarily of measures desigued to decrea_ the size of bubbles<br />
as much as possiblc and to hasten their dissolution. The first is accomplished by<br />
recompression or overcompression (a bubble, once formed, will behave<br />
according to Boyle% law as the pressure on it is increased; it will not disappear<br />
upon return to the pressure from which the experiment began), l)issolution of<br />
the bubbles is thought to be enhanced by treatment with 100 percent oxygen, if<br />
the treatment is carried out at 3 atm absolute, or less, or with the highest safe<br />
oxygen tension when higher total pressures are u_.'d (Mciver, 1966).
_nl00<br />
U<br />
so!<br />
_ 6o<br />
b-<br />
Z<br />
_ 4o<br />
W<br />
o.J<br />
><br />
_ 2o<br />
u<br />
[}arouletrJ c Pressure 31<br />
PRESSURE OF RELIEF<br />
HEL IUM_._,<br />
0 I . 1 I I 1 I<br />
3.5 r5 11.5 14.5<br />
PRESSURE [ps,o]<br />
Fiffure !-26. lncrcase in pressure required to relieve bends _mptoms<br />
shown in figure 1-25. (Taken from Beard et al., 1967)<br />
Mclver and coworkers (1%7) have pointed out in this regard that by using<br />
both maximum space cabin pressure and maximum differential suit pressure, it is<br />
possible to provide a limited degree of ow',rcompression in 100 percent oxygen<br />
for treatment of decompression sickness occurring during space flight. Their<br />
studies indicate the shortcomings of this approach, but they also indicate that it<br />
would bc at least partially effective.<br />
References<br />
Adams, B. tt., & Polak, 1. B. Traumatic lung lesions produced in dogs by simulating<br />
sulxnarinc escape. U.S. Naval Medical Bulletin, 1933, 31( ! 8).<br />
Adler, tl. F. Dysharism. I]SAF SAM Review 1-64, School of Aviation Medicine, Brooks Air<br />
Force Ba_, Texas, 196,1.<br />
Anderson, It. R. Historical review ol' the bubbh! thcor_, of the etiology of decompression<br />
sickness as related to high altitude exposure. USAF SAM Review 10-65, School of<br />
Avialion Medicine, Brooks Air Force Ba_:, Texas, 1965.<br />
Aquadro, C. F., & Chouteau, J. Problems of extreme duration in open sea saturation<br />
exposure. In C. J. Lambert_rn (Ed.), l¥oceedit,gs of the third symposium on underwater<br />
physiology. Baltimore: Williams and Wilkins Co., 1967, Pp. 98-108.<br />
Armslrong, If. G. (Ed.)Aerospace ._lediciae. Baltimore: Williams and Wilkins Co.. 1961.<br />
Balke, B. Rate of gaseous nitrogen elimination during rest and _,ork in relation to lhc<br />
occurrence of decompression _ckne_ at high altitude. USAF SAM Project No.<br />
21-1201-0014, Report No. 6, School of Aviation Medicine, Brooks Air Force Ba,_:,<br />
Texas, 1954.<br />
Bancroft, R. W., & l)unn, J. E. Exlx'rimenlal animal decompressions to a near vacuum<br />
environmenl. I!SAF SAM TR-65-48A, School of Aviation Medicine, I_rooks Air Force<br />
Ba,_', Texas, 1965.
32 Bioastronautics DataBook<br />
Beard, S.E.,el al.Comparison of heliumandnitrogen in production ofbendsduring<br />
simulated orbital flights. IISAFSAMTR-67-201, School ofAviationMedicine, Brooks<br />
AirForceBase, Texas, 1967.<br />
Bebnke, A. R. The absorption and elimination of gases of the body in relation to its fat and<br />
water eontent. Medicine, 1945, 24, 359-379.<br />
Berry, C. A. Severe dysbarism in Air Force operations and training. U.S. Armed Forces<br />
Medical Journa_ 1958, 9, 936.<br />
Bert, P. Barometric Pressure. Columbus, Ohio: College Book Co., (translated by ttitchcock,<br />
M. A., & Hitchcock, F. A.), 1943.<br />
Billings, C. A. Pressure. In P. Webb (Ed.), Bioastronautics Data Book. NASA SP-3006,<br />
National Aeronautics and Space Administration, Washington, D.C., 1964.<br />
Bomadini, A. T., & Pryor, W. H., Jr. Effect of hypobaric and hyperbaric pressure on cell<br />
permeability. USAF SAM TR-66-108, School of Aviation Medicine, Brooks Air Force<br />
Base, Texas, 1966.<br />
Boothby, W. (Ed.) Handbook of respiratory physiology. USAF School of Aviation<br />
Medicine, Randolph Air Force Base, Texas, 1954.<br />
Bryan, A. C. Personal communication, 196 I.<br />
Buhlmann, A. A. Respirator), resistance with hyperbaric gas mixtu_s. In C. J. Lambert_:n &<br />
L. J. Grcenbaum, Jr. (Eds.), Proceedings of the _cond symposium on underwater<br />
physiology. Research Council Publication 1181, Wa_ington, D.C.: National Academy<br />
of Sciences-National Re, arch Council, 1963, Pp. 98-107.<br />
Casey, tl. W., Bancroft, R. W., & Cooke, J. P. Residual pathologic changes in the central<br />
nervous system of a dog following rapid decompression to 1 mm tlg. USAF SAM<br />
TR-66-203, School of Aviation Medicine, Brooks Air Force Base, Texas, 1966.<br />
Cooke, J. P. Sound transmission in helium and various gases at low pressure. USAF SAM<br />
TDR-64-43, School of Aviation Medicine, Brooks Air Force Base, Texas, 1964.<br />
Cooke, J. P., & Bancroft, R. W. Some cardiovascular responses in anesthetized dogs during<br />
repeated decompressions to a near vacuum. USAF SAM TR-66-88, School of Aviation<br />
Medicine, Brooks Air Force Base, Texas, 1966.<br />
Cooke, J. P., & Beard, S. E. Verbal communication intelligibility in oxygen-helium and<br />
other breathing mixtures, at low atmospheric pressures. USAF SAM TR-65-269, School<br />
of Aviation Medicine, Brooks Air Force Base, Texas, 1965.<br />
Cooke, J. P., Cain, S. M., & Bancroft, R. W. Itigh venous pressun!s during exposure of dogs<br />
to near vacuum conditions. USAF SAM TR-67-257, School of Aviation Medicine,<br />
Brooks Air Force Base, Texas, 1967.<br />
Cooke, J. P., Fife, W. P., & Bancroft, R. W. Comparative cardiovascular responds of<br />
baboons and dogs to near vacuum pressures. USAF SAM TR-68-t4, School of Aviation<br />
Medicine, Brooks Air Force Base, Texas, 1968.<br />
Dunn, J. E. Experimental animal decompren_ions to less than 2 mm itg absolute: Pathologic<br />
effects. [1SAF SAM TR-65-48 B, School of Aviation Medicine, Brooks Air Force Base,<br />
Texas, 1965.<br />
Edel, P. O., et ",d. Interval at _a-levcl pressure required to prcvcrlt decompression sickness in<br />
lunnans who fly in commercial aircraft after divin_. Aer,,sp_we M_,li,'ine, 1969. 10,<br />
I It)5-1110.<br />
Fc|,|. W. O. Possible role of hydrostatic pressure in divin_, h| C. J. I ambettsen {Fd.),<br />
Proceedings of the third sympositsm ott utnlt_lw_tter physi_lo_y. I_:Alin_,_rc: Willi._ms _,_J,I<br />
Wilkins Co., 1967.<br />
Fryer, D. 1. Failure of ;m'_sur," calni/,_, lit [ _,. |;ill|, _ :"d _ I_ _ book of aviation<br />
physiology. Oxford: Pert;,, _.,rl I't_.-,_, Iq(,5, _'_. !:'7 ?_,,,
Ilaromctrh" Pressure 33<br />
Fryer, D. I. Physiologic cffeets of exposure Io ram prc_ure. Aerospace Medicine, 1962, 33,<br />
34-,1,1.<br />
Fryer, D. 1. Subatmosphcric dccompression sickness in mall. AGARl)ograph No. 125,<br />
Tedmivision Services, Slough, England, 1969.<br />
Grccnwald, A. J., AIIcn, T. II., & I1ancroft, R. '_V. Abdominal gas vohnne at altiludc and at<br />
ground level. IISAF SAM TR-67-102, School of Aviation Medicine, Brooks Air Force<br />
Base, Texas, 1967.<br />
ttahcr, F., & Clamaun, tl. G. A general theory of rapid dccomprcssion. Project No.<br />
21-12111-0008, Repot! No. 3, School of Aviation Medicine, Randolph Air Force Base,<br />
Texas, 1953.<br />
ttenry, F. M. Effects of cxerq_isc and altitude on the growth and dccay of aviator's ben{Is.<br />
Jourt_al of Aviation Medicine, 1956, 27, 250. 259.<br />
llydc, A. S., t'ines, J., & Saito, 1. Aleleetasis following acceleration: A study of causality.<br />
Aerospace Medicine, ] 963, 34, 150-157.<br />
Jaegcr, M. J., & Otis, A. B. EffecL_ of fln: compressibility of alveolar gas on the dynmnics<br />
and work of breathing. USAF SAM TDR-63-71, School of Aviation Medicine. Brooks<br />
Air Force Base, Texas, 1964.<br />
Kylstra, J. A. Advantages and limitations of liquid breathing. In C. J. Lambertsen (Ed.),<br />
Proceedings of the third symposium on underwater physiology. Baltimore: Williams and<br />
Wilkins Co., 1967.<br />
Luft, It. C. Physiological aspects of prcssurc cabins and rapid decompressiou, in W. Bnothby<br />
(Ed.), tlandbook of respiratoo" physiology. Randolph Air Force Base, Texas: School of<br />
Aviation Medicine, 1954.<br />
Luft, U. C., & Bancroft, R. W. Transthoracic prcssnrc in man during rapid decompression.<br />
USAF SAM Report No. 56-61, School of Aviation Medicine, tlrooks Air Force Base,<br />
Tcxas, 1956.<br />
Luft, 1/. C., Bancroft, R. W., & Carler, E. T. Rapid decompression with pressure-demand<br />
oxygen equipment. USAF SAM Project No. 21-1001-0008, Report No. 2, School of<br />
Aviation Mcdicinc, Brooks Air Force Base, Tcxas, 1953.<br />
Marbarger, J. P., et al. Studies in acroembolism. USAF SAM Report No. 57-44, School of<br />
Aviation Medicine, Brooks Air Force Base, Texas, 1957.<br />
Mclvcr, R. G. Treatment of altitude dysbarism with oxygen under high pressure-report of<br />
three cases. USAF SAM TR-66-318, School of Aviation Medicine, Brooks Air Force<br />
Base, Texas, 1966.<br />
Mclver, R. G., et al. Treatment of decompression sickness m simulated space flight. USAF<br />
SAM TR-67-249, School of Aviation Medicine, Brooks Air Force Base, Texas 1967.<br />
Nim_ L. F. t_nvironmentaI factors affecting decompression stemless. In ,J. F. Fulton (Ed.),<br />
Decompression sickness. Philadelphia: W. B. Sounders Cn.. 1951.<br />
Otis, A. B., Fcnn, W. O., & Rahn, ft. Mechanics of breathing in man. Journal of Applied<br />
Physiology, 1950, 2, 592-607.<br />
Raekc, J. W., & Frccdman, T. tluman response to rapid recompression. Presented to<br />
Aerospace Medical Association Meeting, Chicago, 1961.<br />
Rawlins, J. Personal communication, 1970.<br />
Richmond, D. R., Clare, V. R., Goldizen, V. C., Pratt, D. E., Sanches R. T., & White, C. S.<br />
Biological cffecls of overpressure. Aerospace Medicine, 1961, 32, 997-1008.<br />
Richmond, D. R., & White, C. S. A Ientalive estimate of man's tolerance to overpressures<br />
from air blast. Technical progress rcport on Contract DA-49-146-XZ-055, Lovelacc<br />
Foundation, Albuquerque, New Mexico, 1962.
34 I'i_a_tronautic._ Data Book<br />
Roth, E. Some theoretic aspects of the u_ of inert gascs in sealed cabin enviromnenLs.<br />
IISAF SAM Report No. 58-152, School of Aviation Medicine, Brooks Air Force Ba.'_,<br />
Texas, 1959.<br />
Schaefer, K. E., el al. Pulmonary and circulatory adjustments detcmninhlg the limits of<br />
depth in breathhold diving. Science, 1968, 162, 1020-1023.<br />
Ilniled Slates House of Representatives Selcel Committee on Astronautics and Space<br />
Exploration. Space handbook: Astronautics and its applications, ttouse Docmnent No.<br />
86, First Sea, ion, 86th Congress. Washington, I).C.: I!.S. Govcrnnwnt Printing Officc,<br />
1959.<br />
wm Gierke, H. W. Biodynamic n, sponse of the human body. Applied Mechanics Review,<br />
1964, 17, 951-958.<br />
Wather-Duml, W. Limitations of speech at high pressures in a helium environment. In C. J.<br />
Lambertsen (Ed.), Proceedings of the third symposium on underwater physiology.<br />
Baltimore: Willimns and Wilkins Co., Pp. 128-137.<br />
Webb, P. PersonM communications, 1969, 1970.<br />
Welch, B. E., ct al. The study of man during a 56-day exposure to an oxygen-helium<br />
atmosphere at 258 mm ttg total pre_ure: Thirteen reports by various participating<br />
investigators. Aerospace Medicine, 1966, 37, 449-462, 552-688.<br />
Wood, L. 1t., Bryan, A. C., & Koch, G. H. Limitations of ventilation in a hyperbaric<br />
environment. Preprints of Scientific Program, Aerospace Medical Association Meeting,<br />
Washington, D.C., May 1969, Pp. 196-197.<br />
Workman, R. O., cited by Wood, W. B. Ventilatory dynamics under hyperbaric states. In C.<br />
J. Lam_rt_n & 1,. J. Greenbaum, Jr. (Eds.), Proceedings o/the second symposium on<br />
underwater physiology. Publication 1181, Washington, D.C.: National Academy of<br />
Sciences-National Re,arch Council, ! 963, Pp. 108-123.<br />
Worlz, E. C., el al. Reduced barometric pressure and respiratory water loss. USAF SAM<br />
TR-66-4, School of Aviation Medicine, Brooks Air Force Ba_, Texas, 1966.
CHAPTER 2<br />
ATMOSPHERE<br />
by<br />
Charles E. Billings, M.D.<br />
The Ol_io State University<br />
The composition and pre_ure of the gaseous environment in which man Jives<br />
are critical in life processes. Chapter 1 described the effects of barometric<br />
pressure per se. In this companion chapter, consideration is given to the<br />
properties of elements and compounds which make up or may be added to a<br />
gaseous environment suitable for the human. Both abundant and rare gases are<br />
discussed, since virtually all the inorganic gases found in earth's atmospheric<br />
envelope have been used or considered for use in life support systems. Oxygen is<br />
considered first since it is the one atmospheric constituent whose presence is<br />
absolutely necessary for survival. Carbon dioxide is considered next. Although<br />
its presence in the environment is not necessary for human life, it, too, is<br />
involved in human metabolism and is produced in considerable quantities by<br />
man. The remainder of the chapter is devoted to nitrogen, the noble gases, and a<br />
brief consideration of other gaseous compounds.<br />
General Considerations<br />
Nearly all the oxygen and carbon dioxide in the human body are present as<br />
loosely-bound chemical compounds. These gases enter and leave the body<br />
(mostly through the lungs) by diffusion in response to gradients between their<br />
partial pressures in the body fluids and in alveolar gas. In the absence of a<br />
pressure gradient either in the lungs or in the body tissues, no net flow of either<br />
gas can occur. Carbon dioxide is an extremely diffusible gas in tissues made up<br />
largely of water; oxygen is less easily diffused.<br />
Figalre 2-I shows the partial pressures (tensions) of oxygen in the environment,<br />
in the airways during inspiration, in alveolar gas, in the arterial blood as it<br />
leaves the lungs, and in the tissues, where the gas is transferred to its ultimate<br />
utilization sites. Similarly, carbon dioxide tensions are shown in the tissues,<br />
where carbon dioxide is produced by the combustion of foodstuffs, in the<br />
Reviewed by Christian J. Lambertsen, M.D., University of Pennsylvania Medical Center.<br />
35
36 Bioastronautics. Data Book<br />
ve,ous blood which carries it to the lungs, and in the alveolar air a,d arterial<br />
blood.<br />
x<br />
7cr<br />
2<br />
160<br />
120<br />
80<br />
4a<br />
IN AIR AT<br />
_2_Te_eL1 _NMO,ST<br />
INSPIRED<br />
EE IN TISSUES AND IN<br />
'r<br />
AfB<br />
VENOUS BLOOD I ALVEOLAR<br />
iN<br />
,_,LVEOLAR IN<br />
ARTEF_IAL<br />
_: BLOOD<br />
o<br />
AFN "L A _ TE RIAL<br />
Bt. ODD 1 IN<br />
CAPILLARY<br />
'_ IN AIR ATSEA LEVEL<br />
8LO_'_ IN VENOUS<br />
Figure 2-1. Partial pressures of 02 (above) and CO 2 (below) in air at sea level and at various<br />
points within the body. Drop in PO 2 at (I) is due to saturation of incoming air with water<br />
vapor; at (2) to presence of CO2 in alveolar gas; at (3) to limitations in diffusing capacity<br />
of 02; at (4) to extraction of 02 from arterial blood. The value shown for capillary blood is<br />
a mean. Venous blood in man at rest has a PO 2 about half that of arterial blood. AH values<br />
are approximate. CO 2 is 20 times as diffusible as 02. Venous blood is in virtual equilibrium<br />
with tissue; arterial blood is in equilibrium with alveolar air.<br />
Since all gases in the body are saturated with water vapor, the sum of partial<br />
pressures of components of the gas mixture must always be less than the<br />
ambient environmental pressure by roughly 47 mm Hg (the partial pressure of<br />
water vapor at 37°C mean body temperature). To re-expre_ Dalton's law in<br />
the_ terms,<br />
PB - PH 2 = PO 2 + PCO 2 + PN 2 + PA + "'"<br />
where PB is barometric pressure and PA, etc., the partial pressures of the<br />
various gases.<br />
The effect of saturation can be seen in figure 2-1: as air enters the upper airways,<br />
the partial pressures of oxygen and nitrogen drop slightly due to the addition of<br />
water vapor to the gas mixture.<br />
BLOOD<br />
AND<br />
TISSUES
Atmosphere 37<br />
It is important to keep in mind that it is tire partialpressures, rather than the<br />
concentrations, of the_ substances which govern their movement in the body.<br />
As all example, the concentration of carbon dioxide in alveolar air at _a level is<br />
roughly 5.3 percent (40 mm ttg partial pressure at a barometric pressure of<br />
760mm fig). At a pressure altitude of 39 000 b_et (PB 147.5 mm llg), its<br />
concentration at the same partial pressure is 27. I percent.<br />
All gases present in thc atmosphere are also hmnd in solution in the body<br />
fluids. The quantity of any gas in the body at equilibrium with its environment<br />
is a function of the partial pre_ure of that gas in the lungs and its solubility in<br />
water and fat. Roth (1967) provides a detailed discussion of this topic.<br />
The human body utilizes oxygen in the combustion of fats, sugars, and<br />
proteins in the process known as metabolism. The end products of its metabolic<br />
processes arc carbon dioxide, water, and nitrogenous compounds, principally<br />
amm
38 Bioastronautics Data Book<br />
60<br />
55<br />
50<br />
45<br />
4O<br />
35<br />
3_<br />
25<br />
CRiTiCAL P_ 3O _,_ _<br />
_2 SECO__8O000_A_rER<br />
D_COMPRESSIO_S<br />
A_TE_44_0_8 2 SEC F T<br />
0 10 2_ 3o 40 50 60 70 80<br />
s<br />
+ , F + !+<br />
..........<br />
• + ,+ + ,+ T-_--+++-_<br />
.......... .+ +<br />
+I + + ...................... +<br />
,i +..........= ..........i f..........+<br />
;' _ MFAN OF TR:ALS ar 80eO FT i<br />
k<br />
h<br />
L<br />
/<br />
Figure 2 2. Top: time course of alveolar 0 2 tension when subject breathing air at 8000 ft is<br />
rapidly decompressed to 44 000 ft. 0 2 was provided either 2 sec or 8 see after Ihe onset of<br />
decompression. 0 2 desaturation integrals for the two conditions are crosshatched. Bottom:<br />
performance decrements resulting from decompression. (Redrawn from data of Ernsting,<br />
1969)<br />
When no oxygen is available for metabolism, as following decompression to a<br />
vacuum, the term anoxia is used. Anoxia always results in near-immediate<br />
unconsciousness, convulsions, and paralysis. If prolonged for more than 90 to<br />
180 _conds, anoxia is almost invariably fatal. The condition caused by a relative<br />
laek of oxygen in the body is called hypoxia. Depending on its severity, the<br />
effects of hypoxia can range front symptoms as severe as those of anoxia to very<br />
subtle effects, detcctabh; only by searching examination of the highest functions<br />
of the central nervous system. This is illustrated in figure 2-3. As arterial oxygen<br />
tension falls, progressive central nervous system impairment occurs. This is<br />
indicaled on the chart by zones of increasing density. These changes occur in<br />
resting subjects who are not fatigued or otherwise stres:_d. The oxygen<br />
saturation of the arterial blood is shown as a function of oxygen tension (the<br />
oxyhemoglobin dissociation curve). A range of saturations is sbown because<br />
temperature and acidity also influence the saturation values.<br />
The lowest barometric pres.smc at which any sort of purpo_ful activity can<br />
be carried on was discussed in chapter 1. It was defined as a pressure sufficient<br />
to permit a reasonable partial pressure of oxygen in the alveolar air, with regard
Atmosphere 39<br />
to the obligatory water vapor pressure at that site of about 47 mm Hg, and the<br />
inevitability of a certain partial pressure of carbon dioxide, which is discussed<br />
below. The optimal carbon dioxide tension is about 40 mm Hg. At barometric<br />
pressures greater than about 87 mm llg (an altitude equivalent of 50 000 feet),<br />
thcn, at least some oxygen can be made available. Extensive studies of hypoxia<br />
at altitudes between 18 000 feet (PB 380 mm llg) and 50 000 feet have been<br />
related primarily to maintenance of consciousncss in acutely exposed subjects. It<br />
has been found that healthy individuals at rest rarely lose conscioumess below<br />
about 18 000 feet. Above that altitude, as indicated in figure 2-3, thc duration<br />
of expos, re before consciousness is lost is related to altita]de and thus to the<br />
severity of the hypoxia produced.<br />
APPROXIMATE ALTITUDE BREATHING AIR<br />
(THOUSANDS OF FEET)<br />
I-1<br />
22 18 15 12 9 6 3<br />
- / " / : !<br />
,_y . 7srlSG<br />
..]d ,o o-, "'/ l<br />
4O Bioastronauties Data Book<br />
his oxygen mask or becomes disconnected from his oxygen supply, the partial<br />
pressure of oxygen in the lungs drops with each succeeding breath of air, the<br />
decrease being dependent oll the lung volume, the dilution of that volume by<br />
each breath's volume, and the altitude. In contrast, if a subject breathing air at<br />
low altitude is suddenly decompressed, the partial pressure of oxygen in his<br />
lungs drops immediately to a level which is dependent only on the final altitude.<br />
Venous blood is immediately exposed to low oxygen tension in the alveoli; the<br />
effects of hypoxia become evident as soon as inadequately oxygenated blood<br />
reaches the brain. Times of useful consciousness are much "shorter than following<br />
oxygen mask removal at altitude. These times are shown in figure 2-4 for rapid<br />
decompressions to various altitudes of subjects breathing either air or oxygen<br />
prior to decompression.<br />
uJ<br />
c_<br />
I-<br />
C-<br />
..J<br />
<<br />
_J<br />
<<br />
Z<br />
ul.<br />
55 000<br />
50 000<br />
45000 ---<br />
40000<br />
35 000--,<br />
30 000<br />
25 000<br />
20 30 40 50 60 70 80 90 100<br />
TIME OF USEFUL CONSCIOUSNESS (sec)<br />
Figure 2-4. Minimum and average duration of effective consciousness in subjects following<br />
rapid decompression breathing air (lower curve) and 0 2 (upper curve). At altitudes above<br />
20 000 to 23 000 ft, unacclimatized subjects breathing air lose. consciou_ess after a variable<br />
period of time. (Source: Blockley & tlanifan, 1961)<br />
The appropriate protective action following a decompression in an aircraft is<br />
to don an oxygen mask. The ranges of times required to perform this action are<br />
shown in figure 2-5 for airline pilots studied in flight and for naive subjects<br />
studied in an altitude chamber. The rate of dcc(mlpression h)r the airline pilots<br />
was 500 feet per seeond (tlps) to a final allitude of 30 000 fe_q. The pilots had<br />
had traininl._ in d,'comprcssiou emergency procedures within a year prior to the<br />
,,xt,o_-ur,'s (lI,'nnctl, Iq61). In /In' naive subj,'ct zro.p, 60 y-,,n_ mah.s w,'re<br />
_'Xl.)Xc,I I_ lt)-_..r_,nd drromprcs_.sons from t{()IiI) to 3()0()l)tk'cl (Ihffllcr &<br />
,,,_,,rkt'r_ I_)_i}l), aml -It} mah! .!_d female stll,.IC, t. _t'r," ,'.:I.,,.,_l I,_ Slit}0- U_<br />
L!,.i !_Iit't''''i tl,',,*mpn'.._imt.. ((hi.ohn & cowork, _- lU_U) ..,.,,, ,.i m ,_:,iv,.
t3<br />
Z<br />
z<br />
C7<br />
Z<br />
O<br />
<<br />
z<br />
u.i<br />
.J<br />
F--<br />
8<br />
IO0 r<br />
Atm osphere 41<br />
,I" MASK DONNING TIMES:<br />
42 AIRLINE PILOTS<br />
70 42<br />
\F _<br />
60! 40<br />
40 36<br />
2o_ _(_ 432<br />
"°%.._ 4<br />
I0 : _ 3O<br />
0 10 20 30 40 50 60 70<br />
TIME FROM START OF DECOMPRESSION, SECONDS<br />
Figure 2-5. Mask-donning behavior related to time of useful consciousness. Subjects<br />
compri_;d 42 airline pilots (----) and tO0 naive subjects (--). Exponential curve (see<br />
figure 2-4) repre_'nts average times of useful consciousness for subjects breathing air prior<br />
to decompression. (Data of Bennett, 1961; Hoffler & coworkers, 1968; Chisolm &<br />
coworkers, 1969, calculated by Blockley & Hanifan, 1961 )<br />
Any diluent gas which is pre_'nt in a breathing system will influence the<br />
immediate usefulness of that system following a rapid dccompression. This is<br />
silown in figure 2-6, which demonstratcs the effect of oxygen hose volumc on<br />
trachcal (upper airway) oxygcn tension following rapid (1 second and 9 second)<br />
decon|pressions from 8000 to 40 000 feet. In the case illustrated a diluter-<br />
demand regulator deliw'red 38 percent oxygen at 8000 feet and l(}0percent<br />
oxygen at 40 000 feet. Pure oxygeu is delayed in reaching tile subject's lungs<br />
because of the volume of air.oxygen mixture in the h(,_ at the time of<br />
dccompression.<br />
Ew'n the very _were decompres4ons discussed in chapter ! may not produce<br />
irreversible brain damage, th)wew'r, the degree of brain dysfunction acecptabh_<br />
for pih)ts is considcral4y less than for pas_mgcrs. AI._), variations in individual<br />
toh'raucc for hyp()xia make it risky tt_ allow more than an unavoidable minimum<br />
of s*'_,'r,' h_poxia to occur. Ilecenl ..tudie.s r+4aled h) the deveh>i)ment of a<br />
SUl),'r:-_,.ic h'an.-i)orl aircraft Ilavc r,-.ulh'd in the elucidation of criteria for "safe<br />
[.'ri,,J,; of u.c().scious.(,::_" f,,r pa.._'.g,:rs itl such aircraft. It re.st 1."<br />
r,,c(,t,i_i/,'J, ]l,,_,._, v _hat i,, rs_m. with impair,'d hrain circulation, the ,4derly,<br />
'' ': t__ i;:' I : i .<br />
1% ;_,;_ (.)<br />
.<br />
.<br />
. *<br />
Ih r;_' 'h :''_' U' f' _''" S :I :m,! 2-I T._kin,s i.l. a,'c_.nnl<br />
48<br />
46<br />
44<br />
uJ
42 Bioastronaulics Data Book<br />
the behavioral variation shown in figure 2-5, it would appear essential to attempt<br />
to prevent the untoward hypoxic effects of decompression.<br />
7- 100<br />
E<br />
E<br />
z 80<br />
O<br />
z<br />
LU<br />
_- 60<br />
z<br />
LIJ<br />
x 40<br />
o<br />
<<br />
T<br />
O<br />
<<br />
20<br />
- _1.6 liters<br />
0 HOSE<br />
---- 2,2<br />
VOLUME:<br />
liters.<br />
t [<br />
0 10<br />
t 1<br />
1-SEC DECOMPRESSIONS<br />
/ i I<br />
ji<br />
o °<br />
o°<br />
i<br />
/<br />
SYMPTOMS:<br />
i °<br />
s<br />
o °<br />
Moderate confusion-<br />
Marked confusion<br />
l I<br />
20 30<br />
t t '<br />
9-SEC DECOMPRESSIONS<br />
HOSE VOLUME:<br />
_1.6 liters<br />
----2.2 liters<br />
t 1<br />
10<br />
TIME FROM START OF DECOMPRESSION (sec)<br />
SYMPTOMS:<br />
0#<br />
/<br />
Mork e'd confusion<br />
Unconsciousness<br />
I l J<br />
Ii °°<br />
20 30<br />
Figure 2-6. Effect of 0 2 hose volume on tracheal 0 2 tension following rapid decompression<br />
(Drawn from data of Ernstirrg, 1961 a; rcprintcd by permission of Her Britannic<br />
Majesty's Stationery Office)<br />
At very high altitudes, even immediate mask donning will not prevent mental<br />
impairment following decompression of a subject who breathed air before the<br />
event. Ernsting, Mcllardy, and Roxburgh (1960) and Blockley and llanifan<br />
(1961) have estimated the concentrations of oxygen which must be breathed<br />
prior to decompression if such impairment is to be avoided. These are shown in<br />
figure 2-7. In a cabin pressurized to 8000 feet (565 mm Hg), it is estimated that<br />
the critical alveolar oxygen partial pressure is 33 mm ttg. This calculation<br />
assumes that lOOpercent oxygen is immediatcly supplied (under positive<br />
pressure at final altitudes above 45 000 feet). It should be noted in this context<br />
that studies by Barron (1965) of decompressions to 45 000 fcet suggest that no<br />
combination of mmleuvers aside from prcbreathiug oxygen-enriched air will<br />
prevent at least _me transient hypoxic effects at that altitude. This is also<br />
suggested in fi_lre 24.<br />
Examination of the oxygen saturation eurw_s in figalre 2-3 indicates thai nearnormal<br />
blood oxygen lew_Is, and thus essentially normal function, can be main-<br />
rained with alveolar oxygen tensions as low as 50 to 60 mm ttg. It follows from this<br />
that a barometric pressun_ of 140 to 150 mm Ilg will be sufficient to allow proper<br />
alveolar oxygen and carbon dioxide tensions to be maintained if no other gases are<br />
pre_mt in the respiratory tract. These barometric pressures are encountered at<br />
39 000 to 40 000 fi_et. Iluman subjects, however, are, capable of t_r_athing against a<br />
limited degree of continuous positive pressure, although this is not accomplished<br />
without a physiological penalty (Ernsling, 1965, 1966). The elevation of total pres-<br />
sure within the chest causes a diminution in the volume of blood returning to the<br />
heart and thus a decrea,_ in the heart's output.
c6<br />
tz<br />
_00<br />
9O<br />
z<br />
_ 60<br />
g<br />
2<br />
_: 50<br />
40<br />
AIR (209% O2_ FOR 23700 FT<br />
Atmosphere 43<br />
S J I I 1 1 _ t<br />
38 40 42 44 46 48 50<br />
FINAL ALTITUDE (thoLJsands ol It)<br />
Figure 2-7. 02 enrichment of air in pressurized cabin estimated to be required to prevent<br />
critical fall in alveolar 02 tension during rapid decompression to various final altitudes.<br />
( Source: Blockley & Hanifan, 1961 )<br />
Despite the limitations of the technique, it is possible to maintain total lung<br />
pressure, and therefore alveolar oxygen tension, at minimal adequate levels up to<br />
altitudes of roughly 50 0OO fi_et by" provision of continuous positive pressure<br />
oxygen. At this altitude (PB 87 mm |}g), a pressure of 60 mm ltg is required to<br />
maintain a PO_ in the luJtgs of 60 mm fig, It has been found, howcw;r, that a<br />
continuous positive pressure of 30 mm ttg is about the maximum which can be<br />
tolerated by trained subjects for even a "short period of time without the<br />
application of counterpressure on the chest (which increases stagnation of blood<br />
in the "abdomen and the extremities). The u_ of positive pressure at thc_:<br />
altitudes, therefore, is clearly a _,)rt-tcrm cmcrgency measure. It is for this<br />
reason that overall pressure garments become mandato_' at altitudes much<br />
abow" 50 000 feet.<br />
At altitu&_s below abo, t 20 000 feet (PB 350 mm IIg), human sun'iv',d auld<br />
function at some mcaningful level is possible without added oxygen. This is possible<br />
because higher life forms have a considerable ability to adapt them_lves, or<br />
become acclimatized, to hypoxia. Consideration of this topic is beyond the scope<br />
of this chapter. It should be said, however, that people vary" considerably in their<br />
tolerance for chronic, or long-term, hypoxia, as they do for acute exposures. Some<br />
persons will bccomc acutely ill after _w_,ral hours at ahitudes as low as 12 000 fcct<br />
(PB 480 mm llg), whereas others encounter less difficulty at altitudes as high as<br />
18 000 feet (PB 380 mm llg).
44 Bioastronautics DataBook<br />
Virtuallyeveryoncwill developsomesymptomsof acutealtitudesickness<br />
(shortness of breath,headaches, irisomnia, impairedabilityto concentrate or<br />
performcomplextasks,andsometimes nauseaandvomiting)afterexposure to<br />
airataltitudesof 11000to 12000feetforperiods longerthan8to 24hours. In<br />
mostpeople, thesesymptoms declinein frequency andseverityoveraperiodof<br />
2 to 5days(figure2-8).Abilityto performmuscularworkismoderately or<br />
severelyimpaired, and this imt_airment persists for long periods of time<br />
(figure 2-9).<br />
o<br />
5<br />
z_<br />
g<br />
1OO<br />
s0<br />
m 613<br />
- 40<br />
2<br />
_-- 20<br />
__ _.L_ _ 1 1<br />
5 10 15<br />
DAYS OF CONTINUOUS EXPOSURE AT 12,500 FT<br />
Figure 2 8. Proportion of subjects reporting symptoms of acute altitude sickness (headache,<br />
nausea, lightheadedncss, fatigue, shortness of breath, or insomnia) during each of 20 days of<br />
continuous exposure at an elevation of 12 500 ft (3800 m, 475 mm Hg). (After Billings &<br />
coworkers, 1969; reprinted by permission of the Archives of Environmental Health, 1969,<br />
18, 987-995)<br />
llypoxic symptoms arc less pronounced at lower altitudes or for shorter<br />
periods of exposure. They exist, nonetheless, and may be important under<br />
certain circumstances (figure 2-3). Visual thresholds have been shown to increase<br />
at altitudes above 4000 feet, probably because of the very high oxygen<br />
requirements of the light-sensing cells in the eye. Impairment of ability to learn<br />
new complex tasks has been demonstrated at 8000 feet (PB 565 mm Hg)<br />
(Ledwith & Denison, 1964); impairment of recent memory, judgment and<br />
ability to perform complex calculations arc seen at altitudes in the neighborhood<br />
of I0 000 feet (PB 520 mm tlg) (McFarland, 1953).<br />
Man at sea iew.'l is rarely exposed to partial pressures of oxygen greater than<br />
170 mm llg. Oxygen has been used as a therapeutic agent almost since its<br />
2O
Atmosphere 45<br />
discovery, however, and it was thought for a considerable time that gas mixtures<br />
containing several times the usual sea level concentration of 20.9 percent were<br />
entirely without harmful effects. It is now known that this is not the case,<br />
although it is not certain that 160 mm ltg is the optimal partial pressure under<br />
all circumstances.<br />
:D ,,J<br />
Z Z<br />
X w<br />
O a-<br />
× <<br />
100<br />
8O<br />
6O<br />
40<br />
160<br />
ALTITUDE (thousands of ft)<br />
5 10 15 20<br />
_ ACUTELY<br />
SOJOURNERS _O%o<br />
"_,. _ EXPOSED<br />
%% _ A NATIVES OF<br />
L',, "......<br />
+ A<br />
"%%%%% "_ ALTITUDES<br />
I I 1 I I I _ I I<br />
140 120 1 O0 80<br />
INSPIRED OXYGEN TENSION (ram Hg)<br />
Figure 2-9. Impairment of capacity for muscular work by acute and chronic hypoxia. (Data<br />
from various sources, collated by CerreteUi, 1967, whose graph has been adapted for use<br />
here)<br />
Too high a partial pressure of oxygen is not well tolerated by man, though<br />
our species is more tolerant than many species of experimental animals. The<br />
toxicity of oxygen at above-normal partial pressures is a time-dependent<br />
function whose characteristics are shown in figure 2-10. At pressures above<br />
1 arm, central nervous system signs predominate (nausea, dizziness, faintness,<br />
and convulsions). At around 1 arm, respiratory symptoms are common. These<br />
symptoms are seen with longer periods of exposure at pressures as low as<br />
200mmttg, although they are uncommon below about 250mm Hg. At<br />
pressures of oxygen only slightly higher (253 mm Hg or 5 psia) than normal sea<br />
level Po2 changes in red blood cell fragility and cell wall permeability have been<br />
reported (Berry, 1967). Whether oxygen per se is toxic at pressures in the range<br />
of 180 to 250 mm ttg, or whether the absence of a diluent gas is responsible for<br />
toxic manifestations, is not certain.<br />
At higher oxygen tensions (250 to 750 mm IIg), signs of lung irritation are<br />
noticed after 12 to 72 hours of exposure. It is also known that oxygen tensions<br />
in this range can cause blindness in newborn and premature infants (the
46 Bioastronautics DataBook<br />
conditioncalledrctrolental fibroplasia).<br />
Onthe other hand, many thousands of<br />
adult patients have been given oxygen in this pressure range for relatively long<br />
periods of time without apparent harm. While some patients have had diffusion<br />
defects such that elevated alveolar oxygen tensions mcrely maintained normal<br />
blood gas tensions, others have not. Ernsting (1961a) has demonstrated<br />
si_lificant defects in diffusing capacity in man after 3 hours of exposure to<br />
99 percent oxygen at _a level.<br />
6OO0<br />
500¢'<br />
4OOO<br />
=T300O<br />
|<br />
_Ze¢O<br />
o..<br />
Jooe<br />
9o0<br />
E sod<br />
70o<br />
z ,_oo<br />
t.:, 500<br />
4oo<br />
u..I<br />
tO<br />
_1 :,Do<br />
100<br />
I I I I I I<br />
i CONVULSIONS,<br />
-- ! FAtNTING,<br />
t<br />
0<br />
DIZZINESS<br />
,lt<br />
0<br />
III lit lJl [<br />
VARIOUSSYMPTOMS,<br />
MOST COMMONLY<br />
SUBSTERNAL DISTRESS<br />
AND COUGHING<br />
o<br />
................. s-_/5.-i¢'E'_-¢d_........................................<br />
I<br />
I l l T 1 I<br />
1 I l _ I 1 J J I I I I I I 1 t _ _ I I l l<br />
40 80 120 160 200 260 300<br />
TIME TO ONSET OF SYMPTOMS - hours<br />
Figure 2-10. Approximate time of appearance of signs and symptoms of 02 toxicity as a<br />
function of PO 2. (Adapted from Welch & coworkers, 1963; Bean, 1945; Roth, 1964)<br />
During exercise, supplemental oxygen causes a perceptible decrease in<br />
ventilation volume (Nielsen & Ilansen, 1937); this may be considered a<br />
beneficial effect. Many pilots have described alleviation of fatigue when they<br />
placed themselves on supplemental oxygen for a &ort time before landing,<br />
especially at night. This is difficult to quantitate or even to verify, but the effect<br />
may be a real one (Roth, 1964).<br />
Oxygen at partial pressures greater than 760 mm Hg (14.7 psia, 1.0 atm) has<br />
been used sporadically as a therapeutic agent. Only in recent years, however,<br />
have controlled studies been performed to evaluate its effects. The usefulness of<br />
oxygen in the treatment of carbon monoxide poisoning is beyond question; it is<br />
helpful in the treatment of gas gangrene, caused by a bacterium which cannot<br />
survive in the presence of high oxygen tensions. Its usefulness in treating tetanus<br />
(lockjaw), caused by a similar organism, is less certain, ttigh oxygen tensions<br />
potentiate the effects of ionizing radiation; hyperbaric oxygen in combination<br />
with radiation therapy is used in treating certain advanced cancers. Its beneficial
Almosphere 47<br />
effeets in most of tile other conditions in which it has been tried are<br />
questionable (Bocrema, 1964).<br />
Pure oxygen is u_d by Navy divers breathing from closed-circuit oxygen<br />
equipment when they wish to avoid leaving a trail of expired gas bubbles on the<br />
surface. Since oxygen at pres,_ures greater than about 2 atm absolute can cause<br />
convulsions, however, the depths attd times at which divers can u_ such<br />
equipment are very limited. As with hypoxia, individual susceptibility to<br />
hyperoxia varies widely. Performing physical work while breathing oxygen at<br />
high pre,_ures decreases tolerance markedly, The risk of oxygen convulsions<br />
appears to be minimal in resting men exposed in a dry chamber to as much as<br />
3.0 arm oxygen for I hour; oxygen pressures higher than this increase the risk<br />
considerably (Bennett, 1969). The risk is substantially greater under water in<br />
working subjects, especially if the water is cold. Figalre 2-11 shows the limits<br />
currently impo_',d by the U.S. Navy (1971)).<br />
I<br />
m<br />
5O<br />
40<br />
30<br />
_ 2C<br />
./<br />
i--<br />
\NAUS_ A CONVULSION<br />
\<br />
LIMITS<br />
FOR %'<br />
. X<br />
SPECIAL<br />
OPE f_ATIONS<br />
LIMIT 25 FT<br />
\<br />
DEPTH TIME LIMITS<br />
FOR INOIRMAL OPF RATIONS<br />
I l l I<br />
760<br />
50 100 150 200 250<br />
DURATION OF EXPOSURE {rnin)<br />
1,800<br />
_,600<br />
1,400<br />
L200 _<br />
Figure 2-11. Navy published limits for divcrs using 0 2 under water. Symptoms restdting<br />
from excessive exposure are shown. Limits _ssume moderate activity and minimal CO 2<br />
tensions in the diver's breathing apparatus. (Redrawn from U.S. Navy Diving Manual, 1970)<br />
Carbon Dioxide<br />
Carbon dioxide is neither a neces, ary nor a desirable constitucnt of man's gaseous<br />
environment. Though matt is normally exposed to low concentrations of this<br />
gas at _a level (on the order of 0.03 percent), it is quite certain that he can live<br />
indefinitely in an atmosphere entirely free of the gas, for he produces and excretes<br />
more than enough to meet his phydological needs.<br />
1,00O<br />
E<br />
E<br />
g
48 Bioastronatnti('_[,'ata Boot,<br />
Most of the 400 to 800 liters (15 to 30 ft3) of carbon dioxide produced by an<br />
active man each day is excreted ti,rollgil th,, hlugs as gaseous carbon dioxide; tile<br />
remainder appears in tile urine as bicarbollate ion, combined witil i_asic elcnlents,<br />
primarily sodium. Carbon dioxide is very s(,luble in water, with which it combines<br />
to form a weakly dissociated acid. Tile carbonic acid -bicarbonate buffer systeln is<br />
a major factor in the maintenance of the body's acid-base balance.<br />
At and near sea level, nlan's brcattling is controlled primarily hy tt._ ;,ntouut<br />
of carbon dioxide he produces. Rcspiratory centers in the brain arc exquisitely<br />
_nsitive to very small changes in carbon dioxide tension and hydrogen i,m<br />
concentration in tile arterial blood. (iarbtm dioxide added to inspired air is a<br />
powerfl, I respiratory stimulant; in higher doses, it stimulates heart rate as well<br />
(figure 2-12). Increases in arterial blood earhon dioxide tension also cause<br />
marked relaxation of tile blood vessels in the brain; brain blood t]ow increases<br />
considerably. Figure 2-13 indicates the effects of both acute and prolonged<br />
expos,rcs it, carbon dioxide-air luixturcs at 1 arm. in ac.ute exposures, the<br />
houndary between "no effect" and "distracting discomfort" is narrow. In the<br />
area marked Zone 11 in the graph at the left side of lib,nile 2-13, symptoms<br />
!,,chide small thrcshohl bearing losses and a perceptible doubling in depth of<br />
respiration, hi Zone I11, mental depression, headache, dizziness, nausea "air<br />
hunger," and decreased visuJ discrimination are experienced. Zone IV<br />
represe,tts marked deterioration leading to dizziness and stupor, with inability to<br />
take steps for self-preservation. The final statc is unconsciousness. The bar graph<br />
at the right of the figure shows that for prolonged exposures of 40 days,<br />
concentrations of carbon dioxide in air less tllan 0.5 percent (Zone A) cause no<br />
known biochemical or other effect; concentrations between 0.5 and 3.0 percent<br />
(Zone D) cause adaptive biochemical changes which may be considered a mild<br />
physiological strain; and concentrations above 3.0 percent (Zone C) cause<br />
pathoh)gical changes in basic physiological functions.<br />
At partial pressures above about 60 mlll fig, tile gas is a potent narcotic; it depresses<br />
brain function, elevates convulsion tllresholds and causes respirator" depression.<br />
Very high partial pressun, s of this metabolite are fatal, probably because<br />
of the profoundly acidic blood and body fluids which are produced (Marshall,<br />
1961).<br />
Since man produces carbon continually at rat_ which vary from 0.2 to as<br />
high as 5 liters per minute (0.007 to 0.18 cubic feet per minute), this gas must<br />
IM_ remow'd promptly from a closed environment, either by venting and<br />
replacement (as is done in pressurized aircraft) or by chemical or physical<br />
scrubbing (the methods used in spacecraft and certain submarines). Thc changes<br />
in g'as composition in a scaled space containing a man are illustrated in<br />
figure 2-14. In tile top part of this figure, the long straight lille indicates oxygen<br />
depletion and carbon dioxide accumulation when no corrcctiw" measures are<br />
used. At 3.1 hours, when P()9 has decreased to 108 mnl ilgand t'Co,_ has<br />
increased t() 30 mm tlg (4 p(_ccnt), respiratory volume has doubled. (:urvcs<br />
emanating from this point indicate effects of adding pure oxygen, ab_rbing<br />
carbon dioxide, and ventilating with air and clearing carbon dioxide with<br />
absorber handling (12 liters of air/min/man). The dotted curve shows effects of<br />
using the _me carbon dioxide absorber from the outset.
4_<br />
z _ I /<br />
ll_Tt_[iliiit-)W_r77777 ##¢_,s_'N We<br />
Atmosphere 49<br />
8o- __ L ... i,i,.+D._,;,ilik/h'/;'i/iA<br />
F<br />
..... .....<br />
l 2 3 4 5 6 7 8 9<br />
CARBON DIOXIDE IN INSPIRED GAS - %<br />
Figure 2--12. Immediate effects of increa,sed CO2 on pulse rate, respiration tale, and<br />
respiratory minute volume for subjects al rest. }latched areas represent one S.D. on each<br />
side of the mean. To convert percentage of (:02 to partial pressure, multiply percent by<br />
760 mm ;Ig. (Adapted from Schaefer et M., 1952 & Dryden el al., 1956)<br />
12<br />
|'i,_'lllt' '..) !'I ",tll!!ll,,tll. i' _q,Iil,, _ !,i Ira' t -i,ti, i! , \t_o_
51) Binastronaulics Data Book<br />
The bottom part of figure 2-14 presents a series of lines indicating<br />
uncontrolled change for several cabin volumes. (ltere too, RQ = 0.8 and oxygen<br />
consumption rate equals300 cm2/min.) The dots on the lines indicate rite time in<br />
hours to reach a critical oxygen level of 100 mm ttg. Lower values for carbon<br />
dioxide for smaller free volumes, when oxygen is 100mm tlg, result from<br />
relatively greater tissue storage of carbon dioxide. This effect is ies_ned in<br />
longer exposures in larger free volumes.<br />
A number of studies have _lown that psyehomolor performance is impaired by<br />
moderate increases in arterial carbon dioxide tension. This is indicated in<br />
figure 2-15. In tiffs figure, the zones abow' the line marked "normal "alveolar CO2"<br />
indicate increasing hypercapnea, limited by a zone of carbon dioxide narcosis. Below<br />
lifts dashed line, marked as zones of increasing hypocapnea, are lower levels of<br />
alveolar carbon dioxide, which commonly result from excessive respiratory ventila-<br />
tion. Low h,vels of "alveolar t'0 2 (severe hypoxia and hypoxie collapse) combine<br />
with hyper- and hypoeapnea to afflict performance as indicated.
a_<br />
uJ ><br />
7O<br />
60<br />
!<br />
5O<br />
I<br />
40 _:!:( ::"<br />
30<br />
2O<br />
10<br />
HY PEIXlC<br />
COLLAPSE<br />
V /" /<br />
10 20 30 40<br />
Atmosphere 51<br />
NORMAL ALVEOLAR PCO 2 1<br />
50 60 70 80 90 I00<br />
ALVEOLA_ P02 " mm H 9 IB'iPS)<br />
Figure 2-15. Relationship of alveolar 0 2 and CO 2 composition to performance.<br />
(Adapted from Otis & coworkers, 1946, with, additional data from Balke, 1956)<br />
WI,ile a carbon dioxide tension of 22 mm tlg in the inspired air has been<br />
considered to be tire maximum safe (though not inuocuous)level for exposures<br />
lasting up to a month, comparatively few such tests have been conducted. It is<br />
not certain thai such levels will be safi_ for flJe much longer scaled cabin<br />
exposures now being contemplated; thi_ is an area which needs further re,arch.<br />
Recent data suggest that tensions of I I mm Itg (I.5 percent carbon dioxide at<br />
750 mm Ilg barometric pressure) for 42 days induce physiological changes which<br />
may b,' harmful under conditions of prolonged weightlessness (Ellingson, 1970).<br />
It is also po_il)lc for bh)od carbon dioxide tensions to reach dangerously low<br />
values, usually as the resuh of ventilation in cxec._< of need. llyperventilation, as<br />
it is calh'd, results in a dccr,'a_ in alveolar carbon dioxide tension. The increased<br />
pressure gradient between alveolar air and the incoming venous blood leads to<br />
the nmJoval from the blood of more c_,rbon dioxide than is being produced in<br />
the tissues.<br />
Otis (I946), Balkc ([956), and others have shown that moderate, induced<br />
hyperventilation is associated with impaired performance of psychomotor tasks<br />
(figure 2-15). Balke (1957) has also d,'mo,straled moderate to severe hypcr-<br />
ventilation in pilots during transition to complex jet fighter aircraft. Aircraft<br />
accidents arc thought to have resulted from _werc hypcrvcutilation, which not<br />
infrequently accompanies fear or panic.
52 Bioastronautics Data Book<br />
Severe ilypervcntilation results in lighthcadedness, feelings of numbness,<br />
tingling, markedly impaired performance, involuntary tctanic contractions of<br />
the -skeletal muscles and, uhimately, in impaired consciousness. Unfortunately,<br />
the person who begins to llypcrvcntilate as the resuh of fear<br />
tends to become more and more frightened by the._ bizarre symptoms; his<br />
h:ar, in turn, may increase his hypervcntilation. It may also be difficult for<br />
even an experienced person to diffcrcntiate the symptoms of hyperventilation<br />
from those of hypoxia (Wayne, 1958), and it should be noted<br />
that moderate degrees of hypoxia in thcm._:lves provoke a degree of<br />
hypcrventilation.<br />
The Inert Gases<br />
In this section are discussed the various gases generally considered to be<br />
physiologically inert: nitrogen, helium, neon, argon, krypton, and xenon. An<br />
introduction which describes their common attributes is followed by brief<br />
discussions of their individual characteristics. Table 2-1 summarizes certain<br />
important physical and biochemical properties of these elements.<br />
Metabolic Role of Inert Gases<br />
Perhaps the first serious doubts as to whether this group of elements<br />
was truly inert were cast by Cook, who pcrformcd studies on a variety of<br />
species to cvaluate possible effects of helium. These arc: summarized in<br />
reviews by Cook and Leon (1959) and by Cook (1961). While massy of the<br />
rcsuhs reported in carly studies could bc accounted for by the high thermal<br />
conductivity of helium, producing high rates of heat loss in the organisms<br />
under study, others could not. It has be_'n found that both oxidative and<br />
nonoxidative mctabolic reactions an: affccted, though the cxact biochemical<br />
sites of the effects have not been determined.<br />
Schrciner and coworkcrs (1962) i)avc also prcscnted data suggesting that<br />
growth rates of certain molds arc affected prcdietably by the "in,'rt" gases<br />
in which they are cultured. Figulre 2-16 summarizes their findings.<br />
AIIcn (1963) attempted Io grow chicken embD:os in the ahscncc ol<br />
nitrogen, to determine whether nitrogen gas was requir_'d for the developmcnt<br />
of mammals. He found profound retardation of _mbD_onic developmcnt<br />
in fertile eggs incubated in a number of cnvironn._nts deficient in<br />
nitrogen (figure 2-17). Thc_ results have been confirmed in part by others,<br />
tt,ough some workers fi:cl ttwy can hc explained by factors other than an<br />
absence of nitrogen. The question remains an open one at this time. The<br />
few human studies which have bccn performed thus far have shown no<br />
effccts which can be attribnt,_d to a metabolic cffl_ct of these gases, though<br />
the experiments have been of short duration.
O<br />
c<br />
X '-<br />
8<br />
v CO<br />
",2 t- OD<br />
¢_ 0 C3<br />
_ c<br />
g 8<br />
-_ o_.<br />
_ z<br />
e_<br />
_ E 8<br />
Z<br />
¢0<br />
,,, o -_<br />
Atmosphere 53<br />
LO<br />
I O<br />
,3 '-<br />
=. _ x<br />
,t.-<br />
I,O<br />
I<br />
co _ o<br />
0 O_ "r_<br />
_. X<br />
_. o<br />
,,2 _<br />
I 0<br />
,,7. x<br />
I<br />
0 0<br />
ffl<br />
LID<br />
I<br />
_ ,-- o<br />
o _.<br />
oo- oo_ _ _<br />
- _<br />
• . ° ,<br />
0 0 0 O_<br />
_0<br />
o c_<br />
o . 0!.<br />
0 0 0<br />
O<br />
u _°<br />
o ._o<br />
o ..<br />
._ o<br />
,_ .a a<br />
A<br />
O<br />
rr
54 Bioastronautics Data Book<br />
E<br />
<<br />
Ix<br />
-r<br />
0 2<br />
Ix<br />
0<br />
3<br />
Pco 2 _" 3 mm Hg ©_<br />
PH20 32 mm Hg<br />
Po2 = 36 mm Hg<br />
P = 760 mrn Hg<br />
I : 30°C<br />
Neorospora crassa 5297a<br />
Ne<br />
N2<br />
1 _-- I I [<br />
[ 1<br />
0 2 4 o 8 10<br />
SQUARE ROOT OF MOLECULAR WEIGHT OF GAS<br />
Figure 2-16. Relation of growth rates of Neurospora crassa molds to molecular weights<br />
of gases of the helium group in the environment. Significant effects (P
Toxic Effects of Inert Gases<br />
Atmosphere 55<br />
It has been known for many years that divers breathing air at<br />
etmsiderabJe depths were pronc to a disorder commonly called "raptures of<br />
the dcep." The symptoms (elation, euphoria, deficient judgment, impaired<br />
motor coordination, diminished perception of pain and discomfi)rt) are<br />
rather similar to tho_ cau_'d by alcohol. They have l_:en variously<br />
attributed to high oxygen tensions, to carbon dioxide retention caused by<br />
inadequate ventilation of the lungs, and to nitrogen. It _'ems very probable<br />
that nitrogen is in fact the causative agent, though carbon dioxide retention<br />
may occur during work at depth and this gas is a potent narcotic, as noted<br />
earlier (Roth, 1967).<br />
Later studies have indicated that xenon, krypton , argon, and, probably,<br />
helium all have narcotic potential in man and other mammals. Xenon at<br />
partial pressures of 0.Satm (600mm Ilg, 11.75 psia) has been uscd as an<br />
anesthetic agent in human surgery (Cnllen, 1951). Argon has been shown to<br />
be a potent narcotic at a tension of 3.2atm (1950mmllg, 47psia)<br />
(Behnke, 1939). Though the nitrogen in air exerts minor effects on human<br />
performance at barometric pressures as low as 2.5 arm absolute, the usual<br />
threshold is considered to be 4atm, and ,,_rious sTmptoms are not<br />
ordinarily seen at pressures less than 7 arm (200-foot depth in ,_:a water).<br />
Recent studies by Bennett and Elliott (1969) ilave suggested that<br />
although the narcotic potential of helium is much less than that of any<br />
other inert gas, it does Itaw_ some degree of potency at pressures in the<br />
range of 25 arm absolute. It thus appears that all of the inert gases are<br />
capable of exerting narcotic effects, though the mechanisms are not well<br />
understood. These narcotic effects, together with possible metabolic effects,<br />
may well be limiting factors in man's ability to tolerate long exposures at<br />
very high barometric pressures.<br />
Role of the Inert Gases in Decompression Sickness<br />
It was indicated in chapter 1 that the incidence of decompn_,ssion<br />
sickness was materially reduced if inert gases, wbether nitrogen, helium, or<br />
others, were washed out of the body prior to ascent. While this is often<br />
possible prior to ascent in aviation and space operations, the toxicity of<br />
oxygen prevents its u_ prior to ascent from depths greater than about<br />
66 feet of water (3atm ah_Aute). Detailed discu_ion of the role of inert<br />
gases in decompression ,sickness is Iwyoud the scope of this chapter: ,_w_ral<br />
excellent reviews are available (Roth, 1967; Bennett & Eiliott, 1969).<br />
Considcrablc research is in progress to define morc clearly the limits of<br />
decompression tolerance in man aftcr saturation exposures to various<br />
environments. This work will find applications both in space operations in<br />
which multiple-gas environments are tt_d and in the brag-term underwater<br />
habitability studies being carried out by ._vcral nations. The three gases<br />
which have been _riously considered as diluents for oxygcn in such<br />
applications are helium, nitrogen, and neon. With respect to deeompression
56<br />
l_ioa_;Ir,+naulw_: I);tta !;ook<br />
sickne_,_, helium Inas certain thc,_n'lic;d adsavflag,'s ov
Atmosphere 57<br />
At pressures encountered in diving operations, speech in helium-oxygen gas<br />
mixtures may become quite unintelligible. In some circumstances, it has been<br />
found necessary to add small amounts of nitrogen or neon to the breathing<br />
(Wathen-Dunn, 1967). Electronic processing has also been attempted in an<br />
effort to improve communications.<br />
Thermal control is another area in which the inert gas plays a role. Since this<br />
appears to bca problem only when helium is used, it is discussed under that<br />
heading.<br />
Finally, mention should be made of the last member of the family of noble<br />
gases, radon. Since it is intensely radioactive, it has been excluded from<br />
discussion here and from consideration for any role in life support systems.<br />
Nitrogen<br />
The work of Allen (1963) has raised the possibility that nitrogen in its<br />
elemental form may be necessary for manlmalian growth and development. If<br />
this is true (and there are no other data which unequivocally support his<br />
contention), it is certainly true also that only small amounts of gaseous nitrogen<br />
arc necessary for unimpaired functioning of adult human subjects. The<br />
helium-oxygen studies of Adams and coworkers, cited in chapter 1, involved<br />
nitrogen partial pressures as low as practicable, averaging 2 mm ttg for 56 days<br />
of exposure; other studies have been conducted for shorter periods at even lower<br />
nitrogen tensions without symptoms referable to the absence of the gas.<br />
It also seems clear that partial pre_ures of nitrogen of at least 1200 mm Hg<br />
(found in air at 2 atm absolute) are not harmful for prolonged exposure. As<br />
noted previously, substantially higher pressures are required before frank<br />
symptoms of nitrogen intoxication appear, and there is evidence that some<br />
degree of adaptation to nitrogen narcosis is possible. Nonetheless, the partial<br />
pressures of nitrogen encountered at 200 feet depth, 4200 mm Hg, are clearly<br />
toxic to human subjects.<br />
Helium<br />
Studies of molds grown in helium-oxygen at a total pressure of 120 atm<br />
'absolute (1764 psia) have shown that growth and metabolic activity are<br />
impeded. Interestingly, it appears that at this high pressure, helium depresses<br />
growth more than nitrogen, a reversal of the situation encountered at sea level<br />
(figure 2-16). Mice demonstrate narcotic effects of helium at 54 atm (794 psia),<br />
and the work of Bennett (1969) suggests that the threshold for narcotic effects<br />
in man may approximate 34 atm (500psia). Nonethele_, with the possible<br />
exception of hydrogen, helium is the diluent gas best tolerated by man at very<br />
great depths.<br />
The thermal conductivity of helium, six times that of nitrogen, does pose<br />
substantial problems. Figure 2-18 shows this parameter for various proportions<br />
of several inert gases with oxygen. Soviet and U.S. studies, among others,<br />
487 858 0 - 7:t 5
58 Bioastronautics Data Book<br />
have demonstrated that air temperatures must be 4 to 5°F higher for comfort of<br />
resting subjects in helium-oxygen environments; zones of thermal comfort are<br />
somewhat narrower (table 2-2). This may be a particular problem in undersea<br />
work; work temperatures are usually well below comfort levels and the gas<br />
mixture in underwater habitats is almost invariably saturated with water vapor.<br />
Substantial increases in environmental temperatures may be required for<br />
comfort (Raymond, 1967).<br />
E<br />
u<br />
L)<br />
%<br />
x<br />
40<br />
36<br />
1 I t t<br />
32 O2"/<br />
28<br />
24- /<br />
20-<br />
12 • 02Ne<br />
0 20 40 60 80 100<br />
MONATOMIC GAS (%)<br />
Figure 2-18. Thermal conductivity of binary gas mixtures containing 02 at 30°C.<br />
(After Srivastava & Barua, 1960)<br />
Table 2-2<br />
Temperature Indicated to be Comfortable by Subjects<br />
in Space Cabin Simulator Experiments<br />
Barometric Gas Tension Selected<br />
Pressure (mm Hg) Temperature<br />
psia mm Hg 0 2 He N2 oF<br />
3.7 191 191 -- -- 69.3<br />
5.0 258 258 -- -- 70.9<br />
5.0 258 175 74 -- 74.7<br />
7.3 380 150 230 -- 75.4<br />
7.3 380 165 -- 206 72.7<br />
(From date of Welch, cited by Roth, 1968)
Atmosphere 59<br />
The problem of speech intelligibility has been studied intensively. Soviet<br />
workers have found an increase of about 0.7 octave in the fundamental<br />
frequency of tile human voice at 1 atm in 80 percent helium-20 percent oxygen<br />
(Dianov, 1964). Similar findings are reported by U.S. groups (Sergeant,<br />
1963).<br />
Neon<br />
Roth (1967), in his extensive review of inert gases for use in space vehicle<br />
atmospheres, concluded that "neon appears to offer some advantages over<br />
helium and nitrogen as an inert gas diluent..." This conclusion was reached on<br />
theoretical grounds, primarily because of the potential problem of decompression<br />
sickness, though it was pointed out that in all other areas as well, neon<br />
appears to be as good as or slightly better than nitrogen or helium.<br />
There is, unfortunately, a shortage of data on human exposures to<br />
neon-oxygen mixtures. Bennett (1967) and Bennett and Elliott (1969)report<br />
the conduct of many short studies with the gas, some on humans; Weiss and<br />
coworkers (1968) have conducted longer studies on other mammals. On the<br />
basis of very incomplete data, it does not appear that the gas has toxic effects<br />
which would preclude its use in either space operations or in underwater work at<br />
moderate depths, where it can lessen problems in communications and heat loss<br />
without appreciably increasing the risk of inert gas narcosis or decompression<br />
sickness during reascent.<br />
Argon, Krypton, and Xenon<br />
It has been pointed out that argon is appreciably more narcotic than<br />
nitrogen, which severely limits its usefulness in underwater work. In addition,<br />
however, its use is associated with a substantially higher incidence of<br />
decompression sickness than either helium or nitrogen in animals (Behnke,<br />
1939). These two considerations make it unlikely that the element would be<br />
seriously considered for use as the diluent gas in closed life support systems. It<br />
should be mentioned, however, that it has been proposed, and used, in ascents<br />
after very deep dives in an attempt to promote release of other inert gases from<br />
the tissues. Such specialized uses arc beyond the seope of this discussion; a<br />
description of the technique has been published by Keller (1965).<br />
The narcotic potency of krypton and xenon, together with much more<br />
severe potential for decompression sickness, precludes them from consideration<br />
for life support systems. It has been mentioned that xenon has been used as an<br />
anesthetic agent, and in this area it may have certain advantages if the problem<br />
of its cost can be overcome. Radioactive isotopes of both gases are used in<br />
studies of lmtg and circulatory physiology in animals and humans.<br />
Other Gaseous Compounds<br />
Carbon monoxide is generated in small amounts by most organisms. It<br />
results from the incomplete oxidation of foodstuffs. This compound is
60 Bioastronautics Data Book<br />
discussed more fully in chapter 10, Toxicology; it is mentioned here only<br />
because of its physiological occurrence in closed ecological systems containing<br />
man or animals.<br />
Methane and other gaseous products evolved in the course of digestion and<br />
bacterial action in the gut have varying toxicities. However, few studies involving<br />
long-term continuous exposure of man have been conducted.<br />
Finally, sulfur hexafluofide, a physiologically inert gas with a molecular<br />
weight of 146.1, has been used in combination with oxygen in studies of the<br />
effects of high gas density on respiration. The density of a 79 percent sulfur<br />
hexafluoride-21 percent oxygen mixture is 4.2 times that of air at the same<br />
pressure. The toxicity of its breakdown products militates against the use of<br />
sulfur hexafluoride in other than experimental situations, where it can be quite<br />
useful.<br />
References<br />
Allen, S. C. A comparison of the effects of nitrogen lack and hypoxia on the vascular<br />
development of the chick embryo. Aerospace Medicine, 1963, 34,. 897-899.<br />
Balke, B., & Lillehei, J. P. Effect of hyperventilation on performance. Journal of Applied<br />
Physiology, 1956, 9, 371-376.<br />
Balke, B., Wells, J. G., & Clark, R. T. In-flight hyperventilation during jet pilot training.<br />
Journal of Aviation Medicine, 1957, 28, 241.<br />
Barton, C. I., & Cook, T. J. Effects of variable decompressions to 45 000 feet. Aerospace<br />
Medicine, 1965, 36, 425-430.<br />
Bean, J. W. Effects of oxygen at increased pressure. Physiological Review, 1945, 25, 1-147.<br />
Behnke, A. R., & Yarbrough, O. D. Respiratory resistance, oil-water solubility, and mental<br />
effects of argon, compared with helium and nitrogen. American Journal of Physio|ogy,<br />
1939, 126, 409-415.<br />
Bennett, G. Reactions and performance of airline pilots following decompression. Aerospace<br />
Medicine, 1961, 32, 134-136.<br />
Bennett, P. B. Performance impairment in deep diving due to nitrogen, helium, neon, and<br />
oxygen. In C. J. Lambertsen (Ed.), Underwater physiology. Baltimore: Williams and<br />
Wilkins Co., 1967, Pp. 327-340.<br />
Bennett, P, B., & Elliott, D. H. The physiology and medicine of diving and compressed air<br />
work. Baltimore: Williams and Wilkins Co., 1969.<br />
Berry, C. A., & Catterson, A. D. Pre-Gemini medical predictions versus Gemini flight results.<br />
Gemini summary conference proceedings. SP-138, National Aeronautics and Space<br />
Administration, Washington, D. C., 1967.<br />
Billings, C. E., Brashear, R. E., Bason, R., & Mathews, D. K. Medical observations during<br />
20 days at 3800 meters. Archives of Environmental Health, 1969, 18, 987-995.<br />
Blockley, W. V., & Hanifan, D. T. An analysis of the oxygen protection problem at flight<br />
altitudes between 40 000 and 50 000 feet. Webb Associates, Santa Monica, California,<br />
1961.<br />
Boerema, I., et al. (Eds.) Clinical application of hyperbaric oxygen. Amsterdam: Elsevier<br />
Publishing Co., 1954.
Atmosphere 61<br />
Boothby, W.(Ed.)Handbook of respiratory physiology. School of AviationMedicine,<br />
Randolph AirForceBase, Texas, 1954.<br />
Cerretelli, P.Lactacid oxygendebtin acuteandchronichypoxia. In R.Margaria (Ed.),<br />
Exercise at altitude. Amsterdam: Excerpta Medica Foundation, 1967.<br />
Chisolm, D. M., Billings, C. E., & Rason, R. Studies on the behavior of naive subjects during<br />
decompression: An evaluation of passenger oxygen equipment. Preprints of thc 40th<br />
Aerospace Medical Association Meeting, San Francisco, 1969.<br />
Cook, G. A. (Ed.) Argon, helium and the rare gases: The elements of the helium group. (2<br />
Vols. ) New York : Interscience Publishers, 1961.<br />
Cook, S. F., & Leon, H. A. Physiological effects of inert gases. Report No.<br />
AFMDC-TR-59-26, University of California, Berkeley, 1959.<br />
Cooke, J. P. Sound transmission in helium and various gases at low pressures. USAF SAM<br />
TDR-64-43, School of Aviation Medicine, Randolph Air Force Base, Texas, 1964.<br />
Cooke, J. P,, & Beard, S. E. Verbal communication intcUigibility in oxygen-helium and<br />
other breathing mixtures, at low atmospheric pressures. USAF SAM TR-65-269, School<br />
of Aviation Medicine, Randolph Air Force Base, Texas, 1965.<br />
Cuilen, S. C., & Gross, E. G. The anesthetic properties of xenon in animals and human<br />
beings, with additionM observations on krypton. Science, 1951, ! 13, 580-582.<br />
Dianov, A. G. The possibilities of replacing the nitrogen in the air with helium in spacecraft<br />
cabins and the effectiveness of using a helium-oxygen mixture for ventilation ill space<br />
suits. NASA-l"T-F-9042, National Aeronautics and Space Administration, Washington,<br />
D. C., translated from Kosmicheskiye lssledovaniya, 1964, 2, 498-503.<br />
Dryden, C. E., et at. Artificial cabin atmosphere systems for high altitude aircraft.<br />
WADC-TR-55-353, Wright-Patterson Air Force Base, Ohio, 1964.<br />
Ellingson, H. V., et al. Conference on carbon dioxide levels in the atmosphere of Skylab A:<br />
Preliminary report. Data of K. E. Schaefer, NASA Manned Spacecraft Center, ltouston,<br />
Texas, unpublished, 1970.<br />
Ertrsting, J. Effects of breathing high concentrations of oxygen upon the diffusing capacity<br />
of the lungs in man. Report No. FPRC 1163, Flying Personnel Research Committee,<br />
Farnborough, England, 1961. (a)<br />
Ernsting, J. The physiology of pressure breathing. In J. A. Gillies (Ed.), Textbook of<br />
aviation physiology. Oxford: Pergamon Press, 1965.<br />
Ernsting, J. Prevention of hypoxia on rapid decompression to altitudes between 40 000 and<br />
50 O00 feet in transport aircraft. Royal Air Force Institute of Aviation Medicine,<br />
Farnborough, England, unpubhshed, 1969.<br />
Ernsting, J. Some effects of oxygen breathing on man. Proceedings of the Royal Society of<br />
Medicine, 1960, 53, 96-98.<br />
Ernsting, J. Some effects of raised intrapulmonary pressures in man. Technivision, Ltd.,<br />
Maidenhead, England, 1966.<br />
Ernsting, J. Unpublished data. Royal Air Force Institute of Aviation Medicine, Farnborough,<br />
England, 1961. (b)<br />
Ernstittg, J., McHardy, G. J. R., & Roxburgh, tt. L. The choice of gas mixturc for breathing<br />
in high.performance aircraft. IAM Report No. 157, Royal Air Force Institute of<br />
Aviation Medicine, Farnborough, England, 1960.<br />
Green, I. D., & Burgess, B. F. An investigation into the major factor contributing to<br />
postflight chest pain in fighter pilots. Report No. FPRC 1182, Flying Personnel<br />
Research Committee, Farnborough, England, 1962.<br />
Hoffler, G. W., Turner, H. S., Wick, R. L., & Billings, C. E. Behavior of naive subjects during<br />
rapid decompressions from 8000 to 30 000 feet. Preprints of the 39th Aerospace<br />
Medical Association Meeting, Miami, 1968.
62 Bioastronautics Data Book<br />
Keller, H., & Buhlmann, A. A. Deep diving and short decompression by breathing mixed<br />
gases. Journal of Applied Physiolosy , 1965, 20, 1267-1270.<br />
King, B. G. High concenlzation, short-time exposures and toxicity. Journal of Industrial<br />
Hysienic Toxicology, 1949, 31, 365-375.<br />
Ledwith, F., & Denison, D. M. Complex reaction times at a simulated cabin altitude of<br />
8000 feet. IAM Report No. 284, Royal Air Force Institute of Aviation Medicine,<br />
Farnborough, England, 1964.<br />
Maldey, T. A., & Billings, C. E. Absorption of gases from the anterior chamber of the eye:<br />
Aeromedical considerations. Aerospace Medicine, 1968, 39, 425-426.<br />
Marshall, J. R., & Lambertsen, C. J. Interactions of increased oxygen tension and carbon<br />
dioxide tension effects in producing convulsions and death in mice. Journal of Applied<br />
Physiology, 1961, 16, 1-7.<br />
McFadand, R. A. Human factors in air transportation. New York: McGraw-Hill Book Co.,<br />
1953.<br />
Nevison, T. O., Jr. Unpublished data. Lovelace Foundation, Albuquerque, New Mexico,<br />
1962.<br />
Nielsen, M., & Hansen, O. Maximale k_rpediche Arbsit bei Atmung Oxygen-reicher Luft.<br />
Skandinav. Arch. ffi'r Physiol., 1937, 76, 37-59.<br />
Otis, A. B., et al. Performance as related to composition of alveolar air. American Journal of<br />
Physiology, 1946, 146, 207-221.<br />
Rabn, H., & Fenn, W. O. The oxygen-carbon dioxide diagram. WADC-TR-53-255,<br />
Wright-Patterson Air Force Base, Ohio, 1953.<br />
Raymond, L. W. Temperature problems in multiday exposures to high pressures in the sea.<br />
Thermal balance in hyperbaric atmospheres. In C. J. Lambcrtsen (Ed.), Underwater<br />
physiology. Baltimore: Williams and Wilkins Co., 1967, Pp. 138-147.<br />
Roth, E. M. (Ed.) Compendium of human responses to the aerospace environment. (4 Vols.)<br />
NASA CR-1205, National Aeronautics and Space Administration, Washington, D. C.,<br />
1968.<br />
Roth, E. M. Space cabin atmospheres, Part I: Oxygen toxicity. NASA SP-47, National<br />
Aeronautics and Space Administration, Washington, D. C., 1964.<br />
Roth, E. M. Space cabin atmospheres, Part III: Physiological factors of inert gases. NASA<br />
SP-117, National Aeronautics and Space Administration, Washington, D. C., 1967.<br />
Schaefer, K. E. A concept of triple tolerance limits based on chronic carbon dioxide toxicity<br />
studies. Aerospace Medicine, 1961, 32, 197-204.<br />
Schaefer, K. E., et al. Respiration and circulation during and after inhalation of various<br />
concentrations of carbon dioxide. Report No. 189, Volume XI, No. 6, Naval Medical<br />
Research Laboratory, New London, Connecticut, 1952.<br />
Schreiner, H. R., Gregoire, R. C., & Lawrie, J. A. New biological effect of the gases of the<br />
helium group. Science, 1962, 136, 653-654.<br />
Sergeant, R. L. Speech during respiration of a mixture of helium and oxygen. Aerospace<br />
Medicine, 1963, 34, 826-829.<br />
Srivastava, B. N., &Barna, A. K. Thermal conductivity of binary mixtures of diatomic and<br />
monatomic gases. Journal of Chemical Phys/cs, 1960, 32, 427-435.<br />
United States Air Force. Flight Surgeon's Guide. No. AFP 161-18, Department of the Air<br />
Force, Washington, D. C., 1968.<br />
United States Navy. U.S. Navy diving manual. NAVSHIPS 0994-001-9010, Washington, D.<br />
C.: Government Printing Office, 1970.<br />
Wathen-Dunn, W. Limitations of speech at high pressures in a helium environment. In C. J.<br />
Lambertsen (Ed.), Underwaterphysiology. Baltimore: Williams and Wilkins Co., 1967.
Atmosphere 63<br />
Wayne, H. H. Clinical differentiation between hypoxia and hyperventilation. Journal of<br />
Aviation Me&'cine, 1958, 29, 387-315.<br />
Weiss, H. J., et al. Three-week exposure of rodents to a neon enriched atmosphere.<br />
Aerospace Medicine, 1968, 39, 1215-1217.<br />
Welch, B. E., Morgan, T. E., Jr., & Clamann, H. G. Time concentration effects in relation to<br />
oxygen toxicity in man. Federation Proceedings, 1963, 22, 1053-1056.
CHAPTER 3<br />
TEMPERATURE<br />
by<br />
P.J. Berenson, Ph.D.<br />
and<br />
W.G. Robertson, Ph.D.<br />
AiResearch Manufacturing Company<br />
Human life can be maintained in environments ranging from Arctic cold,<br />
where the problem is to minimize heat loss and maximize heat production, to<br />
furnace-like heat, where the problem is to maximize heat loss. The spectrum of<br />
human response to temperature is broad, ranging from complete thermal<br />
comfort to the extremes of pain-limited exposures. The critical variable is<br />
exposure time, which may range from seconds in pain-limited situations to a<br />
lifetime. Thermal tolerance times can be increased by properly chosen clothing.<br />
Within a period ranging from minutes (emergency situations) to days and<br />
weeks, differences between individuals and groups in response to thermal<br />
extremes are enormous, largely because of varying preceding experiences, or<br />
"acclimitization." Synthesis of available experimental data is extremely difficult<br />
in the absence of a reliable quantitative scale u'pon which to identify individual<br />
differences. Consequently, variations are emphasized in this chapter to illustrate<br />
how selection and training can influence response to any particular environmentactivity-clothing<br />
combination. The conservative solution to the use of these data<br />
is the choice of the least resistant and least trained individuals.<br />
The problems of comfort in heat stress are emphasized here, with less<br />
emphasis placed upon those problems associated with cold exposures. The<br />
chapter begins with a discussion of the physiological parameters related to<br />
human thermal interactions and closes with some data concerning thermal<br />
protective clothing. The terms and symbols used throughout this chapter are<br />
defined in the Glossary which precedes the References section at the end of the<br />
chapter.<br />
Reviewed by A. Pharo Gagge, Ph.D., John B. Pierce Foundation. Appendix authored by the<br />
reviewer.<br />
65
66 Bioastronautics DataBook<br />
Physiological Parameters<br />
The primary physiological parameters related to human thermal interactions<br />
are sweat rate, skin surface temperature, and body internal temperature; only<br />
small changes in the latter two can be tolerated without discomfort. Some latent<br />
heat rejection by evaporation occurs due to respiratory water loss, but most<br />
occurs at the skin surface, where water is deposited by the sweat glands and by<br />
diffusion through the skin. The remaining energy, termed sensible heat, is<br />
transferred to file atmosphere by a combination of convection and radiation<br />
heat transfer. All heat rejected at the skin's surface is transported from the deep<br />
body tissues by the flow of the blood.<br />
Thermoregulatory Mechanimls<br />
One of the heat-regulating mechanisms of the body involves control of the<br />
flow of blood to the skin by the constriction and dilation of the peripheral<br />
blood vessels. This vasoregulatory mechanism attempts to control sensible heat<br />
rejection from the body to maintain internal body temperature at a nominal<br />
value of 98.6°F (27°C). This mechanism, which is controlled by a combination<br />
of internal and skin temperatures, is capable of providing a factor-of-ten variation<br />
in sensible energy transfer between the body core and the surface (Robinson,<br />
1963). Thus, under cold conditions, the body attempts to reduce the heat<br />
dissipation rate by reducing the flow of blood to the cold skin by constriction of<br />
the peripheral blood vessels. Under hot conditions, vasodilation, which occurs<br />
with the onset of active sweating, takes place and the blood flow to the hot skin<br />
is increased. Although the vasoregulatory mechanism is an important safeguard,<br />
it has little effect on thermal comfort analysis. Experiments indicate that at the<br />
limits of vasoregulation, the vasomotor system is capable of exerting a stabilizing<br />
effect on rectal and skin temperatures for a finite period (Winslow, Herrington,<br />
& Gagge, 1937). The period of stabilization is reduced as the severity of thermal<br />
stress is increased.<br />
For each individual, there is an internal set-point temperature at which he is<br />
comfortable; the variation in the set point between individuals is approximately<br />
+0.5°F (+0.3°C). At internal temperatures above the set point, vasodilation and<br />
active sweating occur; at internal temperatures below the set point, vasoconstriction<br />
and increased metabolism due to shivering occur. Because shivering and<br />
sweating are a function of both internal and skin temperatures, it is desirable to<br />
maintain the internal temperature below the set point to avoid sweating; at the<br />
same time, it is necessary to avoid excessively low skin temperatures that will<br />
produce shivering and a cold sensation. According to Kerslake (1962), a mean<br />
skin temperature of approximately 91.4°F (33°C) is near optimum; mean skin<br />
temperatures higher than 94°F (34.5°C) cause active sweating, and mean skin<br />
temperatures lower than 86°F (30°C) are associated with metabolic heat<br />
generation by shivering.<br />
The eccrine sweat rate is dependent on the cranial internal temperature only<br />
for skin temperatures above 91.4°F (33°C); it is suppressed by reduced skin<br />
temperature at skin temperatures lower than 91.4°F (33°C) (Benzinger, 1961).
Temperature 67<br />
Because the relationship between the body skin temperature and internal<br />
temperature is determined by the external heat transfer characteristics, for<br />
particular environmental conditions, the eccrine sweat rate can be given as a<br />
function of skin temperature ",done.<br />
Skin Properties<br />
Relevant properties of the skin are listed in table 3-1. Skin temperature is an<br />
important factor in body thcrmal control, although the heat rejection rate over<br />
which it is effective is small relative to that exercised by the sweat mechanism. The<br />
latter can generate water at a maximum rate corresponding approximately to<br />
3000 BTU/hr (880 W or approximately 22gm/min for the average sized man). It<br />
can be determined that the sensible (radiation plus convection) energy rejection<br />
rate from the body will normally vary by approximately 20 BTU/hr (10 W) for<br />
each °F (°C) change in skin temperature. Therefore, in going from a comfortably<br />
cool skin temperature of 90°F to a comfortably warm skin temperature of 93°F,<br />
the heat rejection rate is hacreased by only 60 BTU/hr (17.5 W).<br />
Regional Requirements<br />
As shown in figure 3-1, different areas of the body have varying thermal characteristics<br />
and requirements. To be comfortable, the body must be maintained under<br />
conditions producing no eccrine sweating. A certain amount of moisture, however,<br />
will be removed from the body by insensible water loss, by diffusion through the<br />
skin and by respiration. The data in figure 3-1 show that the insensible water loss<br />
by diffusion varies greatly over the surface of the body and with the individual;<br />
most of the loss is from portions of the body that are generally unclothed.<br />
Insensible water loss is a continuing nonadaptive process and results in loss of<br />
body heat under virtually all environmental conditions. The irreducible insensible<br />
water loss from skin and lungs is 0.06 of 1 percent of body weight per hour. The<br />
lower limit for insensibJe water loss from the skin alone at one atmosphere and<br />
Ta=68°F (20°C) is approximately 10 gm/sq m-hr. At air temperatures above 68°F<br />
(20°C) the rate of insensible water loss increases linearly to a value of about<br />
25 gm/sq m-hr at T a : 79°F (26°C). Below the sweating threshold, about<br />
40 percent of the mositure loss is from the palm, sole of the foot, and head<br />
(about 13 percent of the total body surface.)<br />
At air temperature between 79 ° (26°C) and 93 ° (34°C) on Earth, there is an<br />
increase in water loss as additional regional areas of the body begin to sweat. The<br />
progression of recruitment is generally from the extremities toward the central<br />
regions of the body and headward, and is subject to effects of training. In this<br />
temperature range and at rest, the onset of sweating produces water loss at rates<br />
of 40 to 60 gm/sq m-hr for all regions of the body. At ambient temperatures<br />
higher than 93°F (34°C), the increment in sweat rate increases linearly at the<br />
rate of 12 to 15 gm/sq m-hr-°C in well-trained subjects at rest. With full sweating,<br />
the trunk and lower limbs provide 70 to 80 percent of the total moisture perspired<br />
0tertzman, Randall, Peis et al., 1951, 1952). Tables 3-2, 3-3 and 3-4 summarize<br />
the order of recruitment, mean regional evaporative rates, and regional fractions of<br />
total evaporation, respectively.
68 Bioastronautics Data Book<br />
Table 3-1<br />
Properties of the Skin<br />
Approximate values of the physical di_enslons of whole skin for the "average n_n'<br />
154 Ib_ 5 ft g in.<br />
Weight 8,8 Ib A kg<br />
Surface area 20 sq ft 1.8 sq m<br />
Volun_ 3.7 qt 3.6 liters<br />
Water content 70 to 75 percent<br />
Specific gravity I,i<br />
Thickness 0.02 to 0.2 in. 0.S to S.0<br />
Approximate values for ther_l properties of skin<br />
Heat production 240 kcal/day<br />
Conductance 9 to 30 kcal/sq m-hr-_C<br />
ThermaJ conductivity (kl (I.5 0.3) _ I0 -3 cal/cm sec-_C, at 23 to 25°C ambient<br />
Diffuslvlty !k/oc) 7 x 10 -4 sq cm/sec (surface layer 0.26 rr_n thick)<br />
Therr_l inertia (kpc) 90 tO 400 x 10 -5 c_12/cm 4 sec (°E)2<br />
Heat capacity _ 0.8 cal/gm<br />
Skin temperature and thermal sensation:<br />
Paln threshold for any area of skin<br />
When mean weighted skin ternperature is:<br />
When the hands reach:<br />
68°F (200C)<br />
59°p (IS°C)<br />
50°r (IO°C)<br />
Approximate optical properties of skin:<br />
Emissivity {infrared)<br />
Reflectance (wavelength dependent)<br />
Transmittance (wavelength dependent)<br />
Solar reflectivity of surface<br />
Very white skin<br />
S "white" subjects<br />
6 'colored" subjects<br />
Very black skin<br />
Solar penetratlon--very white skin<br />
Solar penetration--very dark skin<br />
_13°F (45_C)<br />
The typical sensation is:<br />
above 95°F 135°C) Unpleasantly warm<br />
93°F (34°C) comfortably warm<br />
below 88°F (31°c) uncomfortably cold<br />
86 °p (30°C) shivering cold<br />
84°F (29°C) extremely cold<br />
When the feet reach: They feel:<br />
73.5°F I23_C) uncomfortably cold<br />
64.50F (18°C) extremely cold<br />
55.3°F (13°C_ painful and numb<br />
0.99<br />
Haximu_ 0.6 to I.l_<br />
Minima < 0.3 and > 1.2_<br />
Raxlma 1.2_ I, 7, 2.2, 61 I1_<br />
Hinima 0.5, 1,4, I. 9_ 3, 7_ t2_<br />
42 percent<br />
28 to 40 percent, average 34 percent<br />
19 to 24 percentj average 21 percent<br />
I0 percent<br />
45.5 percent passes 0.1 mm depth<br />
39.6 percent passes 0,2 mm depth<br />
32.0 percent passes 0.4 mm depth<br />
19.0 percent passes 1.0 mm depth<br />
10.2 percent passes 2.0 mm depth<br />
75 percent passes 0.1 mm depth<br />
40 percent absorbed in the melanin layer<br />
33 percent passes 0.2 mm depth
Temperature 69<br />
HEAD BACK<br />
_ _RATE _<br />
LOW SWEAT RATE<br />
NECK CHEST<br />
HIGH SWEAT RATE LOW SWEAT RATE<br />
ARM ARMPIT<br />
LOW SWEAR RATE HIGHLY VARIABLE WiTH<br />
ii 2G'HRINSENSIB[E_ INDIVIDUAL INSeNSibLE<br />
SWEAT RAtE RANGES FROM<br />
FOREARM ABDOMEN<br />
LOWSWEAr RATE LOW SWEAT RATE<br />
_1 2 G/HR INSENSIBLE _ IB lo GHA _NSENSIBLE)<br />
GROIN CALVES<br />
VARIABLE SWEA T RATE Lf>W SWEAT RATE AREA<br />
THIGHS FOOT<br />
LOWSWEAT RATE HIGH SWEAT RATE AREA<br />
(2 4 G_HR INSENSIBLE I {4 / G_HR INSENSIBLEI<br />
REGION<br />
HEAD<br />
CHEST<br />
ABDOMEN<br />
BACK<br />
BUTTOCKS<br />
THIGHS<br />
CALVE5<br />
FEET<br />
AR_S<br />
_OREAR_<br />
MANOS<br />
PREFERRED tEmPeRatURe HEAT LOSS<br />
_OF) BIUIHR<br />
_4 _2B<br />
_4 4_3<br />
'_4 ]3O<br />
914 47 1<br />
B75 _ao<br />
s3s 397<br />
83s _3_<br />
B_s 242<br />
A;3A CO"O_;A"CE<br />
. .. BTUtFT2fHRt°F<br />
2 15 _ 61<br />
183 3Br<br />
248 431<br />
_ 3_o<br />
215 23_<br />
i _o_ 4 Io<br />
o_ 345<br />
i o _s _45<br />
Figure 3-1. Regional cooling requirements of the human body in air<br />
at sea level at rest. (After Berenson, 1965, from data of Kerslake, 1964)<br />
Table 3-2<br />
Recruitment of Sweating<br />
Usual (But Not<br />
Area Invariable) Order<br />
Dorsum foot<br />
Lateral calf<br />
Medial calf<br />
Lateral thigh<br />
Medial th igh<br />
Abdomen<br />
Dorsum hand<br />
Chest<br />
UI nat forearm<br />
Radial forearm<br />
Medial arm<br />
Lateral arm<br />
(After Randall and Hertzman, 1953)<br />
of Recruitment<br />
1<br />
2<br />
3<br />
4<br />
5<br />
6<br />
7or8<br />
8or7<br />
9<br />
10<br />
11<br />
12
70 Bioastronautics Data Book<br />
Table 3-3<br />
Increments in Mean Regional Evaporative Rates<br />
With Rise in Environmental Tern )erature<br />
increment in<br />
Evaporative Rate, °C Evaporative Rate<br />
Region Ta29 34 38 29 to 34 34 to 38<br />
Calf<br />
Thigh<br />
Abdomen<br />
Chest<br />
Forearm<br />
Arm<br />
Cheek<br />
Forehead<br />
18,0<br />
14.4<br />
12.0<br />
9.6<br />
12.0<br />
10.8<br />
24.0<br />
24.0<br />
(After Hertzman et al., 1952)<br />
Region<br />
Head<br />
Arm<br />
Forearm<br />
Trunk<br />
Thigh<br />
Calf<br />
Palm<br />
Sole<br />
gm/sq m/hr<br />
86.5<br />
58.7<br />
60.0<br />
37.2<br />
21.6<br />
14.4<br />
36.0<br />
60.0<br />
Table 34<br />
169.0<br />
144.0<br />
156.0<br />
120.0<br />
96.0<br />
65.0<br />
108.0<br />
240.0<br />
13.7<br />
gm/sq m/hr/°C<br />
Regional Fractions of Total Cutaneous Evaporation<br />
24<br />
11.8<br />
4.6<br />
8.2<br />
22,8<br />
13.6<br />
8.5<br />
15.6<br />
14.7<br />
m<br />
26<br />
12.1<br />
Expressed as Percentage of Total<br />
4.4<br />
7.2<br />
23.0<br />
13.1<br />
9.0<br />
15.3<br />
15.1<br />
(After Hertzman et al., 1952)<br />
Air Temperature, °C<br />
28 30 32 34<br />
11.9 i _ 8.0 7.0<br />
4.2 26 2.2<br />
6.0 4.3 3.2 3.1<br />
22.2 22.2 30.0 33.0<br />
17.1 20.2 22.6 23.8<br />
11.9 16.0 20.3 22.8<br />
13.1 9.6 6.8 4.6<br />
13.5 9.9 6.4 3.7<br />
The maximum attainable perspiration rate of the human body is<br />
approximately 30gm/min for an average sized man, which could provide<br />
maximum evaporative cooling rate of 1200 watts. At these rates, however, even<br />
with adequate consumption of water and electrolytes, the sweating<br />
mechanism fatigues in 3 to 4 hours and perspiration rates decrease<br />
significantly. This fatigue is a function of skin wetness. The maximum<br />
effective perspiration rate that can be sustained is extremely variable<br />
depending on the individual and his degree of acclimatization.<br />
8.0<br />
9.6<br />
5.5<br />
1.9<br />
0.7<br />
2.4<br />
7.2<br />
m<br />
36<br />
_.5<br />
3.1<br />
4.4<br />
43.0<br />
25.5<br />
24.1<br />
3.5<br />
2.3<br />
20.4<br />
21.3<br />
24.0<br />
20.7<br />
18.6<br />
13.0<br />
18.0<br />
45.0<br />
37<br />
8.4<br />
3.3<br />
4.3<br />
38,2<br />
22.3<br />
19.8<br />
2.5<br />
1.5
Temperature 71<br />
Energy Balance Equation<br />
Heat is transfered between man and the environment through four avenues:<br />
radiation, convection, conduction, and vaporization. The body also stores energy<br />
in the tissues and body fluids. Thermal interactions between the human body<br />
and the environment can be examined in terms of the energy balance equation.<br />
This equation balances the normal energy gains and losses and can be expressed<br />
as follows (Blockley, McCutchan, & Taylor, 1954):<br />
0sr + 0m -- W = +0s +Or + Qc +0v + Qk + 0e (1)<br />
For a steady-state thermal condition, the rate of heat storage rate is<br />
zero (Qs = 0). The conductive heat transfer mode is usually quite small and<br />
can be neglected in most instances (Ok = 0). Finally, if the body is shielded from<br />
direct solar radiation, the term (Qsr) can be omitted from the expression.<br />
With these simplifications, the energy equation can be expressed as:<br />
E m - W = +Qr +Qc + Qe + Qv<br />
and the system can be analyzed quantitatively after these terms have been<br />
adequately defined.<br />
Metabolism ((_m) is the sum of the basal metabolic rate plus an incremental<br />
increase in heat energy due to gravity and/or stress. Values of metabolism for<br />
various activities are presented in chapter 18, Work, Heat and Oxygen Cost. The<br />
most common activities require a metabolism between 300 and 1000 BTU/hr or<br />
90 and 300 watts.<br />
In the steady-state condition required for long-duration comfort, the<br />
metabolic energy is dissipated by the work accomplished and by heat rejection<br />
to the atmosphere. Because man is relatively inefficient in converting metabolic<br />
energy into useful work (the maximum work output being approximately<br />
20 percent of the metabolism)(Fahnestock et al., 1963), most of the metabolic<br />
energy must be lost to the environment by heat rejection.<br />
Radiation heat transfer (Qr) occurs as a result of the temperature difference<br />
between the human body and the walls of the surroundings. Convection heat<br />
transfer (Qe) occurs as a result of the temperature difference between the body<br />
and the gas atmosphere. Evaporation heat transfer (Qe) results from the<br />
vaporization of moisture at the surface of the skin. Respiratory heat transfer<br />
(Qv) is the heat loss (including vaporization of water) from the lungs because of<br />
respiration.<br />
Determination of the thermal status of the human body in space operations<br />
requires analysis of a large number of variables. The effect of many of these<br />
(2)
72 Bioastronautics Data Book<br />
variables has no simple mathematical solution and must be derived from<br />
experimental data. Even then, the results must he treated with caution when<br />
applied to the small population represented by a flightcrew. Individual metabolic<br />
rates, health variations, tolerances, and motivation can cause wide deviations<br />
from predicted states and performance.<br />
In general, all the variables can be collected under three major classifications:<br />
environment, body state, and clothing, as shown in table 3-5.<br />
Since many of the variables are interdependent, solution of the complete<br />
energy balance equation becomes largely an iterative process modified by heavy<br />
reliance on reasonable assumptions and experimental results. Maintaining a<br />
thermal balance requires the regulation of environmental parameters to maintain<br />
man in a state of thermal equilibrium (or compensable quasi-equilibrium) at all<br />
anticipated levels of activity to ensure adequate performance and preclude<br />
irreversible physiological effects.<br />
Heat Conduction Through Clothing<br />
Heat Transfer Equations<br />
The dry heat transfer from the skin to the outer surface of the clothed body<br />
is a complicated phenomenon involving internal convection and radiation<br />
processes in intervening air spaces, and conduction through the cloth itself. To<br />
simplify calculations, the following relationship between clothing surface<br />
temperature, To, and skin temperature, Ts, considers a simple conduction<br />
process through clothing of thickness, L:<br />
L Q<br />
Tc = Ts k A c (3)<br />
The value L/k is known as the clothing or CIo value. The reference point for<br />
the Clo value is taken as a man in a suit with no gloves, or light gloves, and<br />
leather footgear with light socks. This is known as 1 Clo and corresponds to a<br />
value for L/k of 0.88°F-sq ft-hr/BTU or 0.155°C'm2/W. The Clo value ranges<br />
from four for artic equipment to zero for the unclothed subject, as shown in<br />
table 3-6 (Fanger, Nevins, & McNall, 1968). A value of 0.6 Clo is often used<br />
becuase it is typical of light indoor clothing.<br />
The effective Clo value for a person seated in a padded chair (or lying down)<br />
might be substantially larger than the Clo value for a standing person in the<br />
same clothing ensemble. The 1 Clo value is as high as can be expected in a<br />
shirt-sleeve environment. More typical values would be 0.25 C lo for the underwear<br />
worn by project Gemini astronauts. The heat loss from the skin surface is inversely<br />
proportional to (Ia+Icl) where I a is the insulation of the ambient air and Icl- il is the<br />
intrinsic insulation of the clothing itself. The effect of helium in reducing the C lo<br />
values of different garments has not been studied. Preliminary studies confirm that<br />
Clo values tend to vary inversely with the thermal conductivity of the atmosphere.
CO<br />
'.O<br />
0<br />
t_<br />
v<br />
_Q<br />
o_<br />
e_<br />
J<br />
§<br />
><br />
c<br />
487-858 0 - 73 6<br />
t<br />
T<br />
C<br />
¢u<br />
t_<br />
o<br />
nn<br />
g c<br />
c<br />
_- > 3 _ _ _ '3<br />
Temperature 73<br />
_ m o'1<br />
L<br />
o_<br />
e<br />
........<br />
.....<br />
eo t.<br />
0J .t: .l: _ .... 0<br />
o 0<br />
r-b<br />
2 _ _ _ _ _ ._- o<br />
_ _-' _ _ o _ "Z, "-<br />
t.
74 Bioastronautics Data Book<br />
co<br />
v<br />
.-.E<br />
_._<br />
t<br />
513<br />
c<br />
•- " • eo<br />
• c<br />
u c m<br />
- __- _ _ "6<br />
._. ,a<br />
p.<br />
c<br />
>.
E<br />
=<br />
c_7<br />
=<br />
• n<br />
___o _0<br />
bo<br />
c<br />
o o<br />
_l<br />
.0<br />
E<br />
c<br />
W<br />
£<br />
P<br />
o<br />
Temperat ure 75<br />
u_ N<br />
o • o o o _ V<br />
• °
76 Bioastronautics Data Book<br />
The effective Clo values (i.e., la_lcl ) in a 7 psia 50 percent oxygen: 50 percent<br />
helium environment, therefore, would probably be 0.015: 0.017, or about<br />
0.56 that of sea level air (Roth, 1967). The clothing surface area may be<br />
50 percent greater than that of man (Nelson et al., 1947), although probably<br />
not all of the increased area is available for heat transfer. Table 3-6 presents<br />
typical ratios of the clothing surface area to the skirl area.<br />
Radiation Heat Transfer<br />
The analysis of radiation heat transfer between an astronaut and his<br />
surroundings is complicated by a number of factors. These include:<br />
1. Ability of the crew to move around and change position<br />
2. Arrangement and surface temperatures of the various equipment<br />
enclosures<br />
3. Localized differences in temperature of the cabin walls and size and<br />
location of windows.<br />
The problem can be greatly simphfied by theoretically collecting all<br />
equipment and structures into an equivalent enclosure at a mean radiation<br />
temperature. The following equation applies to a man in an enclosure at a single<br />
effective radiation temperature (McAdams, 1954). The man was assumed to be<br />
radiating heat at a single mean temperature equal to the temperature of the<br />
outer surface of the clothing.<br />
(_r = OFew( T4 - T4)Ar (4)<br />
_Lssuming that source and sink are gray bodies, the following equation,<br />
which includes the effect of geometric configuration, can be used for the<br />
radiation shape factor of a completely enclosed body _lcAdams, 1954):<br />
1<br />
Fcw - (5)<br />
,)<br />
ec Aw \ew<br />
The emissivity of human skin in the infrared range is approximate.ly 0.99.<br />
The emissivity of clothing and skin at body temperature generally is assumed to<br />
be 0.95. The emissivity of surroundings (ew) will depend on the proportion of<br />
high and low emission surfaces subtended by the body. The range of<br />
emissivities will vary from 0.2 (for oxidized aluminum) through 0.9 (for<br />
transparent plastics and oil painted surfaces) to 0.95 for an adjacent crew<br />
member, also in shirtsleeves.
Temperature 77<br />
The effective radiation area of the body, A r, will be less than the total<br />
exposed surface area of skin and clothing because some portions of the<br />
body are partially shielded from the surroundings. The measured ration<br />
between the effective radiation area and the total surface area are given in<br />
figure 3-2 for different positions (Guibert and Taylor, 1952).<br />
<<br />
08 [<br />
CROUCHED SEATED SEMI-ERECT ERECT<br />
POSITION<br />
Figure 3-2. Body radiation area for various body positions.<br />
(From data of Guibert, 1952)<br />
If man is in an enclosure much larger than himself, the ratio Ar/Aw in<br />
equation 5 is small, and Few = ec. Therefore, equation 4becomes<br />
(_r : °ecAr( T4 - T4) (6)<br />
The radiation heat transfer coefficient is defined by the following<br />
equation :<br />
Qr = hrAr(Tc- Tw) (7)
78 Bioaslronautics Data Book<br />
Therefore, from Equation 4<br />
or'ew(T4 -Tw4)<br />
hr - (8)<br />
Tc - T w<br />
Values of the radiation heat transfer coefficient are pre_nted in figure 3-3<br />
for Few : 0.9.<br />
I<br />
a_<br />
t<br />
.t:<br />
1.05<br />
1.00<br />
.95<br />
.9O<br />
.85 -<br />
.80 "11 I I i I I I I I I I I I :<br />
NOTES:<br />
F<br />
1. FCW = 0.9<br />
2. E = .9 --<br />
3. T C = CLOTHING TEMPERATURE<br />
4. T W = ENVIRONMENT TEMPERATURE<br />
,,,,l,,,,J,,,,i,,,,i<br />
55 60 65 70 75 80 85 9o<br />
T w °F<br />
Figure 3-3. Values of the radiation heat transfer c_fficient.<br />
in addition to determining the mean radiant temperature of the<br />
surroundings, it is important to consider local effects. A man located<br />
between warm and cold surfaces at a neutral atmospheric temperature and<br />
apparently comfortable may experience pain and stiffness in the muscles<br />
expo_d to the cold surface 'after a prolonged period of time, especially<br />
after sleep.<br />
Forced Convection Heat Transfer<br />
The rate of heat transfer by convection can be written:<br />
T C =<br />
9oOF<br />
85OF<br />
80OF<br />
75OF<br />
70OF<br />
0c = heA(Tc - Ta) (9)<br />
65OF
Temperature 79<br />
Theconvective heattransfercoefficient, he,isa complicated functionof<br />
fluid flow, thermal properties of the fluid, and the geometry of the body.<br />
Because there has been some variance between the values used by different<br />
groups in relating the hc of man to the atmospheric gas velocity, selecting the<br />
appropriate heat transfer coefficient is a difficult problem. A discussion of the<br />
implications of different coefficients used in the analysis of forced convection<br />
about the human body was published by Kerslake, (1963).<br />
Figure 3-4 represents a summary of several approaches to forced convective<br />
heat transfer coefficients (convective f_m coefficients) for man in an<br />
environment containing air at Yzatm. The first three curves represent the he<br />
values obtained from empirical studies of humans. These are compared with four<br />
theoretical curves: (1) a cylinder in longitudinal flow, (2) a cylinder 10 inches in<br />
diameter in crossflow, (3) a flat plate with flow perpendicular to it, (4) a cylindrical<br />
model of man in crossflow (figure 3-5). The value of he for the cylindrical<br />
model of man corresponds closely with those obtained by Nelson (1947) and are<br />
equivalent to hc for crossflow about cylinders 5 inches in diameter.<br />
VELOCITY OVER MAIN [fl rain}<br />
Figure 3-4. Comparisonof forced convection film coefficients for man at 1/2 arm of air.<br />
(After Parkeret al., 1965)<br />
The following equation, derived from the heat transfer correlation for fluids<br />
flowing perpendicular to cylinders, estimates the forced convection heat transfer<br />
coefficient for all gas mixtures (Berenson, 1965):<br />
he = 0.021k c _ (10)
8O<br />
whel_<br />
P : psia, V = ft/min, and<br />
Bioastronautics Data Book<br />
k c = a factor that depends on the transport properties of the gas mix-<br />
ture. For 02 - N 2 mixtures, k c : 1 ; for other gases,<br />
kmixIMmix /lair _0"5 (Prmix10.33<br />
kc r , xu x/ (11)<br />
For example, a 50-percent oxygen-helium atmosphere at 7 psia, k e = 1.6.<br />
"tO"<br />
24"<br />
-_ 7.5" DIA_<br />
6"DL<br />
5" DIA. _<br />
-|4=.or,, V 3..o,A.<br />
Head<br />
Neck<br />
Ttu,_k<br />
20" 1" DIA.<br />
....<br />
Upper legs<br />
Lower legs .....<br />
Upper arms<br />
Lower arms<br />
Fitlge_s<br />
Total<br />
Area. l¢ 2<br />
P_,l qa)<br />
a 19 5 It 2 used to include some taclor of<br />
Figure 3-5. Cylindrical model of man. (After Parker et al., 1965)<br />
Figure 3-6 shows the effect of gas velocity on the convection heat transfer<br />
coefficient based on the eyfindrical model of man for various helium- oxygen<br />
and nitrogen-oxygen atmospheres. The partial pressure of oxygen at 170 mm Hg<br />
is near the sea level equivalent and is held constant with the diluent gas ranging<br />
from 0 to 400 mm Hg.<br />
The values for neon mixtures will lie between those for helium and<br />
nitrogen. It is clear from comparing the physical properties of the gases that<br />
_dlely<br />
I 95<br />
22<br />
618<br />
419<br />
349<br />
140<br />
1 96<br />
b 67<br />
2006
Temperature 81<br />
for different mixtures of oxygen-nitrogen there is little sensitivity of he to<br />
percent composition of gas.<br />
pile or pN 2 (mmHgl<br />
-- He-0 2 Atmosphere<br />
...... N2-0 2 Atmosphere<br />
40 60 80 100 110 140 160<br />
VELOCITY OVER MAN (ft/min}<br />
170 mm Hgof02<br />
pkle = Partial Pressure (mm Hg) of He<br />
in Atmosphere<br />
pN 2 = Partial Pressure (turn H 9) of N 2<br />
in Atmosphere<br />
Based on Cylindrical Model of Man<br />
Figure 3-6. Heat transfer coefficients of man in 0 2 - He and 0 2 - N 2<br />
at different gas velocities. (After Parker et al., 1965)<br />
All of the correlations for the forced-convection heat transfer coefficient are<br />
consistent with the following general theoretical correlation:<br />
heD_ const, tpVD)0"5 (-_)<br />
The only difference between the equations is the value of the empirical<br />
correlating constant. As shown in figure3-4, there is a variation of<br />
+50 percent between the various correlations.<br />
0.33<br />
(12)
82<br />
Free Convective Heat Transfer<br />
Bioaslronautic_s Data Book<br />
In the presence of a gravitational field such as on the Earth, planetary<br />
surfaces, or rotating space stations, free convection is possible and is the<br />
preferred mode of cooling because no additional fan energy need be<br />
expended. General free-convection heat transfer equations yield the<br />
following simplified equation for free-convection cooling in nitrogen-oxygen<br />
mixtures (Berenson, 1965).<br />
hc = 0.06 [p2g(T c - Ta)-]0"5 (13)<br />
Mixed free and forced convection environments can be handled by<br />
McAdams' rule, which states that both the free and forced convective heat<br />
transfer coefficients are calculated and the higher of the two values used<br />
(McAdams, 1954). The critical forced convection velocity (Vcrit), where the<br />
forced convection heat transfer coefficient is equal to the free convection<br />
coefficient, can be calculated for oxygen-nitrogen mixtures by equating<br />
equations 10 and 13.<br />
0.5<br />
Vcrit : 8.3 [g(T c - Ta) ] ft/min (14)<br />
If the forced convection velocity is less than the critical value, free<br />
convection is the dominant heat transfer process.<br />
Forced Convection Evaporation<br />
The rate of heat transfer by evaporation can be written (Berenson, 1965):<br />
/ Ps - Pa_<br />
Qe : hDhfg AC_- R_ s _H20<br />
The mass transfer coefficient, hD, is a complicated function of fluid flow,<br />
fluid properties, and body geometry. The mass transfer coefficient can be<br />
calculated from the heat transfer coefficient, hc, by using the heat-mass<br />
transfer analogy with the following result (Eckert & Drake, 1959):<br />
(15)<br />
h c Pr2/3<br />
: 06)<br />
hD p% Sc2] 3
Temperature 83<br />
The following equation for the evaporation heat loss results from combining<br />
equations 10, 15, and 16 (Bercnson, 1965).<br />
where V = ft/min<br />
P = psia<br />
ke = a fluid property parameter that depends on the diffusivity of<br />
water vapor in the gas mixture and on the transport properties<br />
of the gas mixture itself. For air, ke = 1. For other gases,<br />
0.5<br />
ke : (kD)0'67( Mmix_ X /'/mix//gair _0"17<br />
The diffusion coefficient for water in helium is 3.5 times that for water in<br />
air. For the case where the water is diffusing into a mixture of helium and<br />
oxygen, diffusivity relative to air, kD , is found from<br />
1<br />
(17)<br />
(18)<br />
kD -- MOL FRACT. He MOL FRACT. 02 (19)<br />
+<br />
3.5<br />
For example, for the 50 percent oxygen atmosphere in helium at 7 pisa,<br />
kD = 1.554. Therefore, for the ke values calculated for the oxygen-helium<br />
atmosphere containing 50 percent oxygen,<br />
0.17<br />
ke = (1.554) 0.67 (___ X 12.10_ 13--3-_-) = 1.219<br />
The exponent of V in equation 17 is 0.5. Some empirical data yielded an<br />
exponent of 0.63 (Clifford et al., 1959). In view of the other assumptions that<br />
must be made regarding clothing and body positions, the uncertainty introduced<br />
by this difference is not serious. In fact, the calculated values of maximum<br />
evaporative loss (C = 1) give predicted results only 10 percent higher than<br />
actually measured (Clifford et al., 1959; Webb, 1967). Since the rate of<br />
evaporation and the diffusion coefficient for water vapor are inversely
84 Bioastronautics Data Book<br />
proportional tO pressure, latent cooling capacity increases with decreasing<br />
(total) pressure (Taylor & Buettner, 1953).<br />
Curves illustrating the general magnitude of the pressure, dew point, and<br />
gas stream velocity effects predicted by equation 17 are presented in<br />
figure 3-7. In the temperature range under consideration for space cabins,<br />
the temperature and the dew point have relatively little effect as compared<br />
to gas stream velocity and ambient pressure.<br />
"E<br />
ro<br />
v<br />
o_<br />
40O0<br />
3OOO<br />
2000<br />
lOOO<br />
DEW POINT<br />
O e = 2.46 Tav/-_ (Ps - Pa ) OF<br />
T s = 96OF<br />
T a : 80oF<br />
A = 19.5 SQ FI<br />
14 7 psid - P<br />
_ I I I I<br />
50 100 150<br />
V (ft/min)<br />
Figu_ 3-7. Maximum evaporation rate atrestin oxygen-nitrogen mixtures.<br />
(Be_nson, 1965)<br />
It is likely that the body does not become fully wetted with sweat until<br />
the sweat rate is about twice the maximum evaporative capacity. Loss of<br />
sweat by dripping probably begins when the sweat rate is about 1/3 of the<br />
maximum evaporative capacity (Kerslake, 1963). The effect of body<br />
position and geometry on the constants of these equations cannot be<br />
overemphasized. The effect of clothing also is an important factor in<br />
determining evaporation rates (Blockley et al., 1954).<br />
Free Convection Evaporation<br />
A free convection evaporation cooling equation also can be developed<br />
using the heat-mass transfer analogy. For example, combining equations 13,
Temperature 85<br />
15, and 16 yields the following equation for the free convection evaporation<br />
rate in oxygen-nitrogen mixtures (Berenson, 1965):<br />
Qe = 1.3A_p CTa (Ps-Pa) { Pg(0"005P(Tc-Ta)+ l'02(Ps-Pa))t 0"2' (20)<br />
Respiratory Heat Loss<br />
Heat loss due to respiration varies directly with metabolic rate and is<br />
influenced by atmospheric composition (including carbon dioxide and water<br />
vapor content) and pressure. Because the respiratory tract is a very efficient<br />
saturator of inspired air, heat gain to the body through respiration will not<br />
occur until atmospheric temperature approximates 185°F (McCutchan &<br />
Taylor, 1951).<br />
Heat loss from the lungs approximates 10 percent of the metabolic rate<br />
(7 to 8kcal/hr) in the neutral zone (Hardy, 1964). Definitive data are<br />
available for determining respiratory heat loss for the atmospheric<br />
compositions and pressures of interest in space flight environments,<br />
especially those of the space suit (Bryan, 1964; Webb, 1955; Wortz et al.,<br />
1966).<br />
After determining the pulmonary ventilation rates corresponding to a<br />
specific activity level and stress factors such as hypoxia, hypercapnia, or<br />
anxiety, the heat loss due to respiration can be caluclated by determining<br />
the sensible heat required to raise the inspired atmosphere to expiration<br />
temperature and adding the heat of vaporization increment for the moisture<br />
lost to the inspired air from the respiratory tract.<br />
One expression for calculating respiratory heat loss is 0Vortz et al.,<br />
1966):<br />
Qv = _rpCp(Te - Ti) + 0.58 (We - Wi)(cal/hr) (21)<br />
where = volume of atmosphere breathed per hour (liters/hr)<br />
p = density of the atmosphere (gm/liter)<br />
Cp = specific heat of atmosphere (kcal/Kg-°C)<br />
T e = temperature-expired atmosphere (°C)<br />
Ti = temperature-inspired atmosphere (°C)<br />
0.58 = heat of vaporization H20 (kcal/gm)
86 Bioastronautics DataBook<br />
We : weight of water in expired atmosphere (gm)<br />
Wi : weight of water in inspired atmosphere (gm)<br />
A more simphfied approach is also available (McCutchan & Taylor,<br />
195t).<br />
Comfort Criteria<br />
Thermal Comfort<br />
Comfort zones have been defined in the literature in terms of skin<br />
temperature, sweat rates, and various indexes that relate environmental<br />
parameters to subjective impressions of comfort or measured values of<br />
selected physiological variables. For the same conditions and individuals, the<br />
established boundaries for thermal comfort, performance, and tolerance as<br />
described by the various design indexes may be completely consistent.<br />
Variations in activity, wearing apparel, individual health and acclimatization,<br />
and thermal exposure immediately prior to making a determination of<br />
comfort, however, will operate to shift the zones and introduce inconsistencies<br />
in results (Gagge, 1966).<br />
A large amount of literature is available concerning human comfort and<br />
physiology under a wide range of conditions in the Earth environment.<br />
Examples of comfort indexes established in the past are the British Comfort<br />
Index (Dunham et al., 1946), ASHRAE (American Society of Heating and<br />
Air Conditioning Engineers) Effective Temperature, and Operative<br />
Temperature (cited in Webb, 1964). Unfortunately, because of important<br />
differences in gravity and pressure found in space environments, most of<br />
these data are not directly applicable to the design of spacecraft thermal<br />
control systems. The following comfort criterion is generally applicable.<br />
Krantz (1964) describes a comfort design criterion developed by<br />
Winslow et al. (1937), based on percentage utilization of the maximum<br />
evaporative cooling capacity. It was found that on the hot side of<br />
comfortable conditions, sweat production was definitely related to the<br />
sensation of discomfort; on the cold side, skin temperature below 90°F<br />
produced a cool feeling. As shown in table 3-7 the sensation of comfort was<br />
related by Win_ow et al. (1937) to the percent of the body covered by<br />
moisture.<br />
The comfort design method described by Krantz (1964) involves analysis<br />
of the environmental conditions to estimate the radiation and convection<br />
heat transfer from the body. The metabolic rate necessary to sustain the<br />
activity level is estimated. The difference between the metabolic rate and<br />
the radiation and convection heat loss, therefore, is the required evaporative<br />
cooling. The environmental design conditions are then evaluated with respect<br />
to the maximum evaporative cooling capacity; if the required evaporative<br />
cooling represents from 10 to 25 percent of the maximum, the environment<br />
is in the comfortable range. If it is outside this range, some of the
Temperature 87<br />
environmental design factors (gas temperature, ventilating gas velocity, or wall<br />
temperature) should be changed to provide a comfortable environment.<br />
Although this concept is simplified and has not been proven for all values of<br />
total sweat output and atmospheric conditions, it is plausible and can be<br />
generally applied.<br />
Table 3-7<br />
Evaporative Capacity Comfort Criterion<br />
Percent of Maximum Skin Temperature<br />
Comfort Level<br />
Evaporative Capacity OF OC<br />
0 to 10<br />
10 to 25<br />
25 to 70<br />
70 to 100<br />
Over 1O0<br />
Cold<br />
Comfortable<br />
Tolerable<br />
Hot<br />
Dangerous<br />
95 35<br />
With resting, unclothed subjects, approximately 10 percent of the maximum<br />
evaporative capacity is provided by in_'nsiblc moisture loss from the body by<br />
respiration and by diffusion through tile skin. This moisture loss is not subject to<br />
thermoregulatory control, and an indicated evaporative cooling requirement less<br />
than this amount represents overeooling of the hody. With normally clothed<br />
subjects the insensible moisture loss is 5 percent of the maximum evaporative<br />
capacity. These losses arc, of course, a function of the metabolic output and<br />
respiratory rate. Recent unpublished data from the NASA Manned Spacecraft<br />
Center, Houston, suggest that the minimum latent heat loss by evaporation,<br />
Qe min, is given by the following equation:<br />
Qe rain = 0.125 E m + 50 (Btu/hr) (22)<br />
This fact alters previous approaches to setting the cold-comfort boundary using<br />
C = 0.1 as a criterion.<br />
In summary, the thermal comfort design objectives arc that body storage be<br />
zero, evaporative heat losses be limited to insensible evaporation of moisture<br />
produced only by respiration and diffusion through the skin without the activity<br />
of sweat glands, and that body and skin temperatures be maintained near normal<br />
values of 37°C (98.6°F) and 33 ° to 34°C (91.5 ° to 93.5°F) for a resting<br />
subject. During exercise, each multiple increase in resting metabolism decrease<br />
the skin temperature for comfort by approximately I°C and the rectal<br />
temperature rises by 0.2°C but the mean body temperature for comfort remains<br />
essentially the same during rest and exercise.
88 Bioastronautics Data Book<br />
Comfort Zones<br />
Because of the dearth of empirical data on comfort zones in uncommon gas<br />
environments, several attempts have been made to predict these values.<br />
Figures 3-8 and 3-9 represent typical results of one approach using equations 6,<br />
10, 13, 17, and 20 to estimate the comfort zone in oxygen-nitrogen mixtures for<br />
various combinations of forced vs free convection, Clo values, etc. (Berenson,<br />
1965). Comfort was established from the ratio of required evaporative cooling to<br />
predicted maximum evaporative capacity, C, using the criterion of table 3-7 with<br />
the exception that equation 22 was used to calculate the lower boundary of the<br />
comfort zone. In addition, the skin temperature was constant at 91.4°F instead<br />
of varying with C in the manner shown in table 3-7.<br />
c<br />
><br />
E<br />
2O(<br />
150<br />
100<br />
5O<br />
AIR<br />
NUDE<br />
E m : 500 Btutht<br />
P 6 ps,a<br />
DEW POINT .50°F<br />
T s : 91 4°F<br />
T w Ta<br />
10<br />
At) 195 sq It<br />
A t 15 5 _1 I1<br />
4_ so<br />
%<br />
I<br />
COL<br />
+so d<br />
6O 70<br />
T a (OF)<br />
C = 025<br />
_._ C = 0.71<br />
HOT<br />
80 90 1 (3O<br />
Figure 3-8. Forced-convection comfort zones during mild exercise.<br />
(Modified from Beren_n, 1965)<br />
Unfortunately, there are few empirical data to substantiate these curves.<br />
Preliminary studies tend to corroborate some of these predictions for different<br />
oxygen-nitrogen environments (Bonura & Nelson, 1967; Secord & Bonura, 1965;<br />
Roth, 1968). In addition, the predictions of this approach agree with the<br />
ASttRAE data (Berenson, 1965).
z:<br />
n<br />
20OO<br />
1500<br />
-- 1000<br />
E<br />
Lu<br />
5OO<br />
0 l<br />
4O<br />
Temperature 89<br />
TOLERABLE<br />
AIR<br />
NUDE<br />
PDEW POINT 6 ps_a_<br />
50°F<br />
T s = 91.4oF<br />
T w = T a<br />
£ = 1.o<br />
Ab = 19 5 ¢_qft<br />
NOT A r = 15.5 sq ft<br />
510 _ --J- 1 I<br />
60 70 80 90 tO0<br />
T a (OF)<br />
iii<br />
Figure 3-9. Lunar free-convection comfort zones as related to exerck_e rate in the nude.<br />
(Modified from Beren_n, 1965)<br />
For cabins with oxygen-helium nuxtures, other hcat flow constants must be<br />
used to determine comfort zones (see equations 10 and 17). Empirical comfort<br />
tcmperatures in different gas mixtures have not been systematically obtained.<br />
Comfort temperatures have been recorded only as the average cabin temperature<br />
set over periods of several weeks by subjects who bad control over tile thermostat<br />
within the cabins (Roth, 1968). These temperature settings for subjects in surgical<br />
clothes, which have about 0.5 Clo in air, are presented in table 3-8. These data in-<br />
clude varied numbers of different subjects being studicd under each gas mixture.<br />
No windspeed measurements were taken during thcsc studies, however, the<br />
velocity was probably negligible.<br />
Other studies found comfort temperatures in lte-O2 at higher levcls (Bonura &<br />
Nelson 1967; Secord & Bonura, 1965). In these studies, the average temperature<br />
settings during a varied work-rest cycle with 0.7 Clo were 78 ° F for nitrogen-<br />
oxygen at 7 pi_ mid 85°F for helium-oxygen at 5 psia.<br />
Table 3-9 presents additional data on Earth comfort zone boundaries for men<br />
at rest in reduced pressure N2-O2 and He-O2 atmosphere (Fangcr et al., 1968). Gas<br />
velocity was varied from 20 to 80 ft/min with little effcct on the comfort zone<br />
boundaries.
90 Bioastronautics Data Book<br />
_r_<br />
_=<br />
r0<br />
"- E<br />
E<br />
Lf_ ,O<br />
eo ,O O<br />
• _ (-q<br />
r_<br />
r--.<br />
r_<br />
of+<br />
O<br />
C__ r,<br />
I<br />
E<br />
E<br />
O<br />
O rO<br />
0 ct<br />
212 cn<br />
!<br />
E<br />
E E<br />
E<br />
o _-<br />
u<br />
o<br />
o<br />
o<br />
c<br />
u<br />
o<br />
O<br />
o<br />
j<br />
__ O_<br />
0<br />
"._<br />
0<br />
":" E<br />
_ 4J<br />
e"<br />
0<br />
0<br />
E<br />
I<br />
!.-<br />
r_<br />
u_<br />
-i- i_.<br />
q_<br />
o.<br />
rU<br />
NI _, oo<br />
0 _ --0 ",0<br />
t_<br />
o_ 0 u3 ,_)<br />
c_ _<br />
0<br />
if3<br />
0 "_ ",0 r_<br />
0 _ _._ _0<br />
E E<br />
> ....<br />
> L. __<br />
0 o_ r0 __<br />
Ck _ 0<br />
¢D D _- -u<br />
1
Temperature 91<br />
Heat Stress<br />
Space operations require an understanding of man's responses to thermal stress<br />
and his capacity to tolerate heat. Extensive data are required in addition to those<br />
presented previously on comfort zones to reach even an index of man's response to<br />
thermal loads. The dependent variables that must be considered include body temperatures,<br />
sweat response, pain and discomfort thresholds, body stress, and<br />
psychomotor performance.<br />
Body Temperatures<br />
The body temperatures used in thermal analyses are body core temperature<br />
(Tr) , skin temperature (Ts), and mean body temperature (Tb).<br />
Body Core Temperature(Tr). Internal body or d_'cp body core temperature is<br />
an important factor in the thermoregulation of the body. Rectal temperature<br />
(Tr) is considered a reasonable measure of deep core temperature and is easily<br />
obtained. Core temperature remains remarkably constant at a mean of 37°C or<br />
98.6°F as long as the body is in thermal equilibrium. Internal body temperature<br />
is to some extent a function of the external environment, but is less so than skin<br />
temperature. Even under conditions where thermal adequacy is provided, there<br />
is a tendency for increased core temperature at higher metabolic rates.<br />
Changes in core temperature can affect the rate of reaction of the various biochemical<br />
reactions that make up the metabolic processes of the body. This effect is<br />
called the QI 0 effect and results from the temperature dependence of the chemical<br />
reaction rates which provide metabolic energy. That is, at temperatures above<br />
approximately 98 ° F, there will be approximately a 7 percent increase in metabolic<br />
rate per °F increase in internal body temperature. Similarly, at temperatures less<br />
than 98°F, there will be a corresponding decrease in metabolic rate due to a decrease<br />
in the chemical reaction rate. The Q10 effect is important in considering the<br />
thermal tolerance limits for human endurance. If the body is unable to adjust suit-<br />
ably to the environment and the internal temperature falls outside the control<br />
range, the QIO effect results in a more severe condition, by decreasing metabolic<br />
heat output under cold conditions, and by increasing metabolic heat output during<br />
hot conditions.<br />
Skin Temperature (Ts). Skin temperature is primarily a function of the thermal<br />
environment of the body and the resulting heat exchange with the ambient.<br />
Decreasing environmental temperatures result in reduced skin temperatures;<br />
decreasing ambient pressure leads to increased skin temperatures. The following<br />
expression (equation 23) is used to derive a mean skin temperature, which can then<br />
be used in computing mean body temperature (equation 24) and energy balance<br />
(equation 1).<br />
T 8 = 0.I2 Tback + 0.12 Tches t + 0.12 Tabdome n<br />
+ 0.14 Tar m + 0.19 Tthig h + 0.13 Tleg<br />
+ 0.05 Thand + 0.07 Thead + 0.06 Tfoot (23)
92 Bioastronautics Data Book<br />
Mean Body Temperature (Tb). Mean body temperature is derived from<br />
the weighted sum of the rectal and mean skin temperatures. The weighting<br />
varies as a function of ambient temperature (Stolwijk & Hardy, 1966). For<br />
ambient temperatures of less than 30°C (Burton, 1946):<br />
Tb = 0.67T r + 0.33T s (24)<br />
For zone of evaporative regulation temperatures (Ta>28°C, 85°F), the<br />
weighting is l:4for Ts:Tror l:9for Ts: Tes(esophageal). Mean body<br />
temperature is used primarily as a determinant of heat storage or vice versa.<br />
Heat Stress and Water Loss from the Body<br />
The response of body core (rectal) temperature to heat stress induced<br />
by ambient conditions and metabolic loads is shown in figures 3-10 and<br />
3-11. Note in figure 3-10 that for each level of work, there appears to be a<br />
characteristic internal or core temperature at equilibrium which is unaffected<br />
by the environment so long as the neutral boundary condition, is not<br />
exceeded. As the figure shows, the characteristic internal (rectal)<br />
temperature for a particular work load varies between groups; both physical<br />
training and training for work in the heat (acclimatization) produce lower<br />
values. Superficial differences between ethnic groups appear to he due to<br />
habit patterns and experience relative to working under hot conditions.<br />
Figure 3-11 clearly illustrates the effect of heat training (acclimatization) on<br />
the equilibrium rectal temperature, and the small, probably insignificant,<br />
effect of training on the location of the neutral boundary. Note that in the<br />
neutral zone, heat-trained men working at 1600BTU/hr maintain body<br />
temperatures as low as or lower than novice workers working at<br />
700 BTU/hr. However, when both groups are in the stress zones for their<br />
respective work levels, the difference between their mean body temperatures<br />
is 1.5°F. For comparison, new men working at 1600BTU/hr have<br />
temperatures 1.5°F higher than similar men working at 700 BTU/hr, when<br />
both are in their neutral zone of environments. The figure plots mean<br />
thermal rectal temperature against effective temperature, which has been<br />
defined by the American Society of Heating, Refrigerating and Air<br />
Conditioning Engineers, Inc. (ASHRAE) as "an arbitrary index which<br />
combines into a single value the effect of temperature, humidity, and air<br />
movement on the sensation of warmth or cold felt by the human body.<br />
The numerical value is that of the temperature of still, saturated air which<br />
would induce an identical sensation."<br />
Man's responses in atmospheres other than air at sea level are under<br />
evaluation (Epperson et al., 1966).
u. 104<br />
o<br />
uJ<br />
rw 103<br />
t--<br />
t_<br />
w __ 102<br />
Z<br />
S F_<br />
_J<br />
_c _ 101<br />
rY<br />
z 100<br />
r¢<br />
an<br />
5 o<br />
uJ<br />
99<br />
98<br />
Seated Rest Work<br />
200 400 600<br />
Temperature 93<br />
METABOLIC RATE - kcal/hr<br />
100 200 300 400<br />
1 t 1 1 1<br />
o Average, 150 unacclimatlzed Bantu at 4 hrs [58].<br />
• Average, 150acclimatized Bantu at 4 hr [58].<br />
- Two subjects, 8-hr test [32].<br />
a_ Three subjects, l-h: test [33].<br />
• Seven to 22 subjects, various ethnic groups [.58].<br />
I I<br />
iiiii!i_iii!_i<br />
800 1000 1 200 1 400<br />
METABOLIC RATE - Btu/hr<br />
Moderate<br />
Work<br />
I<br />
I<br />
1600<br />
5OO<br />
oU<br />
i<br />
39.5 tu<br />
tY<br />
...... .:'L 39.0 U.Iuj<br />
• - ZcY<br />
b--<br />
37.5 _<br />
_J<br />
37.0<br />
Heavy C)<br />
Work U.I<br />
1 800 _ 2 000<br />
Figure 3-10. Variations in rectal temperature at sea level as a function of activity. (After<br />
BIoekley, 1964: adapted from Hanifan et al., 1963, based on data from Lind, 1963;<br />
Strydom & Wyndham, 1963; & Wyndham et al., 1954)<br />
u_ 105<br />
o<br />
w 103<br />
t- 102<br />
.J<br />
OE<br />
I01<br />
z 100<br />
m 99<br />
z<br />
EFFECTIVE TEMPERATURE - OC<br />
25 26 27 28 29 30 31 32 33 34 3`5<br />
i i i iI ! • 1 , i i i<br />
I<br />
NEUTRAL<br />
ZONE _<br />
_'_ -_:;:'1600 Btu/hrl e_ ,_,:"<br />
z o _,,_.R. : _,<br />
......... ,,_._,_'._"_" Zoo#_o/hr--<br />
:_iii_!!i!i!iii!i!!_i'"' : :?::::i _:0<br />
[i _ :;,/:_:ii! :_<br />
I!i :::;:_!iici! i_::;_;C!i_i [! S T R E _ S F U k_<br />
ZONE<br />
76 80 84 88 92<br />
EFFECTIVE TEMPERATURE °F<br />
%<br />
4O _ k-<br />
39 _<br />
Q_<br />
I'-"<br />
U<br />
38 _ z<br />
I--<br />
z<br />
37 .<<br />
Figure 3-11. Rectal temperature and stress zones for work in heat at sea level. Data from<br />
460 individuals, 2 work rates, and 1S different humid environments. Vertical lines separate<br />
"neutral" (environment-independent) and "stressful" lenvironment-driven) zones before<br />
and after training. (After BloeMey, 1964, drawn from data of Wyndham et al., 1954)
94 Bioastronautics Data Book<br />
Sweating and Respiratory Water Loss. In normal man, heat stress can be eval-<br />
uated by the rate of water loss from the body. Analyses of evaporative heat ex-<br />
change under various conditions were presented above. In addition to these data,<br />
which are applicable to space operations, figures 3-12 to 3-14 represent the sweat<br />
production rates to be expected under survival conditions on Earth. Figure 3-12<br />
shows how loss of water through the skin by diffusion is influenced by the vapor<br />
pressure gradient, the skin temperature, and the barometric pressure. A high skin<br />
temperature is shown to be related to ahigh diffusion loss. Warm skin free of sweat<br />
was produced in the experiment illustrated by a high dosage of atropine. The graph<br />
also shows that diffusion is increased as barometric pressure is lowered. Figure 3-13<br />
shows the effects of various environmental conditions on sweat production. Note<br />
in figure 3-13(a) that the relationship of skin temperature to sweat production is<br />
highly variable under various environmental conditions. In figure 3-14 data are<br />
plotted for six experiments on one subject, who was "fully acclimatized," of<br />
"better than average stamina," who marched at 3.5 mph up a 2.5 percent grade, at<br />
IO0°F and 20 mm Hg, with a lO-minute rest every hour.The morewater he drank,<br />
the lower was his rectal temperature. Other experiments with nude subjects resting<br />
at 110 ° F and vapor pressure of 25 mm Hg have shown that they were able to main-<br />
tain equilibrium only if they replaced water continuously. It may be concluded<br />
that failure to replace completely the water lost in sweat, hour by hour, leads to<br />
elevation of body temperature and excessive physiological strain. Thirst or the<br />
desire to drink is unreliable as an indication of the requirement forwater intake to<br />
make up for heavy sweating. Other work has shown that replacement of salt at<br />
regular mealtimes is adequate in contrast to the situation illustrated in figure 3-14<br />
for water.<br />
z:<br />
5<br />
4O<br />
3c<br />
2C<br />
c_ 1E<br />
Z<br />
i<br />
I<br />
SKIN TEMPERATURE (°C)<br />
30 35 40<br />
_,. :'.': SUBJI:CTS "- --<br />
20 30 40 86 95 104 760 506 253 0<br />
VAPOR PRESSURE GRADIENT (ram Pig) SKIN TEMPERATURE I°FI BAROMETRIC PRESSURE (rnm Flgl<br />
Figure 3-12. ln_nsible water loss from the skin as a function of absolute humidity, skin<br />
temperature, and barometric preSSure. (After Blockley, 1964, drawn from data of Brebncr<br />
et al., 1956; Hale et al., 1958; Webb et al., 1957; Zollner et al., 1955)<br />
Figure 3-15 represents the sensitivity of water loss through respiration to a<br />
metabolic rate and ambient pressure and dew point (Wortz, 1966). Rates of<br />
nonthermal sweating are about 80 to 220 gm/hr from covered areas and 20 to<br />
40 gm/hr from the rest of the skin (Webb, 1967). This can be increased by<br />
psychogenic stimuli of many types (Webb, 1967).
(a)<br />
1.8<br />
_= 1.4<br />
Z<br />
0<br />
D 1.0<br />
r'_<br />
O<br />
ew<br />
n<br />
k--<br />
_ 0.6<br />
0.2<br />
Temperature 95<br />
SKiN TEMPERATURE- °C<br />
33 35 37<br />
i o.o I J<br />
o9' I ..I<br />
/ !,_*./f** t ._7 -Io.,<br />
/ ,>_,"" I "X I<br />
• "," I _+'X_'/1/ I<br />
I _:%oYJ/ lo.2<br />
L_ /L __J<br />
90 94 98 102<br />
0 I0 20 30<br />
1000<br />
8OO<br />
o 6oo<br />
SKIN TEMPERATURE - °F<br />
DRY BULB TEMPERATURE - °C<br />
l I I I I /" I<br />
METABOLIC RATES / /<br />
0.8<br />
/- 0.6<br />
400 I- 0.4<br />
200 0.2<br />
O _ L I 0<br />
30 50 70 90<br />
DRY BULB TEMPERATURE - °F<br />
- (b)<br />
Figure 3-13. Water loss by sweating under different environmental conditions. A: sweat<br />
rates during various laboratory procedures; B: sweating and evaporative heat loss varying<br />
with air temperature and activity level. (After Blockley, 1964; adapted from a. MacPherson,<br />
1960; reprinted by permission of the Controller of Her Britannic Majesty's Stationery<br />
Office; Robinson et al., Taylor & Buettner, 1953; and Webb et al., 1957; b. Thompson<br />
Ramo Wooldridge, Inc, 1961)
96 Bioastronautics Data Book<br />
P_<br />
I03<br />
Ioo<br />
0.90<br />
= 080<br />
E<br />
0.70<br />
0<br />
J 060<br />
,_ 050<br />
>-<br />
040<br />
a: 0.30<br />
m 020<br />
0.10<br />
"S<br />
// WATER<br />
/ AD LIB<br />
..,4P .... ,ie WATER TO<br />
....,e-, .... _ R E PLACE SWEAT<br />
EVERY HOUR<br />
LU t.U I.U LU _ UJ<br />
,_ 1 ,_:, I ,_, I ,_, I ,_, I ,_, I _, I<br />
0.5 1 2 3 4 5 6<br />
EXPOSURE DURATION - hr$<br />
Figure 3-14. Sweating rates; water replacement.<br />
(After Bloekley, 1964, adapted from Pitts et al., 1944)<br />
35 ps_ 35 psi<br />
--- 40°F DEWPOINT o'° _;¢ o.°<br />
..... 60°1: DEWPOINT 2 0 psi o'°* 70 ps_<br />
.... 80°F OEWPOINT / ,'_ o oo,, oo, .°o.o.OO.,.o'<br />
U<br />
39.0 ° i<br />
2<br />
.=<br />
38.5<br />
38.0<br />
..J_" _4 _ psi 7 0 pst<br />
.,/ •<br />
L_ ____ _J_<br />
MEAN MINUTE VOLUME (liters/rain) ST.P.<br />
Figure 3-15. Respiratory water loss as a function of minute volume for all work rates<br />
and dry-bulb temperatures. (After Wortz et al., 1966)<br />
Heat Stress Indexes. In the noncompensable zones of thermal control,<br />
performance and tolerance have an inverse exponential relationship with<br />
exposure time. Figure 3-16 reflects the general time-tolerance _lationship for<br />
extremes of ambient air temperature under sea level conditions.<br />
E--
=2<br />
>-<br />
C3<br />
f-<br />
u_<br />
¢z3<br />
,<<br />
140<br />
120<br />
IO0<br />
-20<br />
-40<br />
-60<br />
-80<br />
80<br />
60<br />
40<br />
20<br />
0<br />
-1OI3<br />
_0 M_N<br />
Temperat ttre 97<br />
_ _._ RELATIVE HUMIDITY PER CENT<br />
SAFE<br />
HYPOTHERMIA<br />
I.... J _A .......<br />
+ HI::/ +0 HR + DAY "10 DAYS<br />
Figure 3 16. Approximate human time-toleranee temperature with optimum clothing.<br />
(After Breeze, 1961 )<br />
Figure 3-17 shows tile physiological impairment that may be anticipated due<br />
to extremes of body temperature. The tolerance limits reflect the borders of physi-<br />
ological collapse to be used for rough evaluation of situations.<br />
o F o C<br />
114<br />
I10<br />
106 .<br />
102 '<br />
.44<br />
'42<br />
,40<br />
.38<br />
+ }<br />
36<br />
94<br />
90<br />
34<br />
32<br />
86. 30<br />
82- 28<br />
78-<br />
74-<br />
26<br />
24<br />
Upper Limit<br />
of SurvJv31_<br />
Heat Stroke Regulation<br />
Brain Lesions Seriously<br />
Teml_ratur Impaired e<br />
Feve_ Thet apy<br />
Febrile Disease I Temperature<br />
Hard Exelcise Efficient in<br />
Febrile Disease<br />
Usual and Range I Regulat+°n Health and Work<br />
ol Norma_<br />
Low Limit<br />
of Survival;'<br />
Temperature<br />
Regulation<br />
Impaired<br />
Regulation<br />
Lost<br />
Temperature<br />
Figure 3- +17. l-tumau body temperature extremes defining zones of leTnperatttre regulations.<br />
( After Breeze, 1961 )
98 Bioastronautics Data Book<br />
Under conditions of heat stress, the mode of evaporative heat loss cannot<br />
completely compensate for the difference between total heat load and heat lost<br />
through other modes. This lack may be attributable to failure to achieve a<br />
sufficiently high perspiration rate or by failure to achieve a sufficiently high<br />
evaporation rate. Even though the perspiration rate is adequate to maintain<br />
thermal balance, conditions of high humidity and/or low ventilation may limit<br />
evaporation rates to values below that required for adequate cooling.<br />
Some environmental correlates of comfort and stress were discussed<br />
previously. The more physiologically determined indexes will now be reviewed.<br />
A more detailed critique of the physically and physiologically determined heat<br />
stress indexes is available (MacPherson, 1962).<br />
The BeMing-Hatch Heat Stress Index (HSI). The Belding-Hatch (1955)<br />
heat stress index is defined as the ratio of evaporation rate required for energy<br />
balance to maximum perspiration rate safely attainable for prolonged<br />
periods-both expressed in liters (of sweat) per hours, or:<br />
E<br />
HSI- x 100 (25)<br />
Emax<br />
The criteria on which the heat stress index is based are:<br />
a. Body heat storage will not exceed the limit represented by a mean skin<br />
temperature of 95°F, and<br />
b. Ema x will not exceed 1 liter/hr; equivalent to 2400 Btu/hr (400 kcal/hr).<br />
Figure, 3-18 and table 3-10 can be used as indicated to estimatc the<br />
physiological and general function impairment of an 8-hour exposure at sea level<br />
to several stressful thermodynamic parameters.<br />
The P4SR Index. The sweat rate can be used as a predictor of thermal<br />
stress in another way. The predicted 4 hour sweat rate (P4SR) uses only the rate of<br />
sweating as a criterion of heat stress in environments that are hot enough to cause<br />
sweating (Wyndham, 1952). On the basis of British experimental work, empirical<br />
nomograms have been developed for predicting the probable amount of sweat in<br />
liters that would be secreted over a 4-hour period by fit, acclimatized men under<br />
different environmental conditions (Smith, 1955). A P4SR nomogram is shown in<br />
figure 3-19.<br />
The group of curves marked SI and $2 in the center of the nomogram, running<br />
downwards from right to left, constitute the scale from which the basic 4-hour<br />
sweat rate (B4SR) is read. If the predicted 4-hour sweat rate (P4SR) is required for<br />
men sitting in shorts, the calculation is very easy as the P4SR is the same as the<br />
B4SR. An that is necessary is to join the appropriate point on the dry-bulb scale to<br />
the wet-bulb temperature on the wet-bulb scale corresponding to the air<br />
movement. The P4SR is given by the point where this line intersects the curve on<br />
scales S1 and $2 corresponding with the air movement.
_3500<br />
_3000<br />
P<br />
_ZSOO<br />
0 2000<br />
01500<br />
=+ IO00<br />
500<br />
_ o<br />
Temporal ure 99<br />
............ 2"/'/ /<br />
,_o H_ATLOAD , / /<br />
o: EXAMPLE 20 °<br />
_ 90<br />
8. _000 0 1000 2000 3000<br />
RADtATION + CONVECTION-BTU/HR<br />
Y////-<br />
500<br />
42 , _ , , , , O<br />
C_*RT S<br />
3 ? 90 _ Z<br />
I 3 PSYCH_OP'IET R_C _--<br />
EXAMPLE:<br />
DRY BULB TEMPERATURE m<br />
F<br />
)00<br />
00<br />
)<br />
¢<br />
=c<br />
o_<br />
HEAT STRESS<br />
(INDEX)<br />
200 187) 1*30<br />
_ _o<br />
Z 2400<br />
or E rtt<br />
_'0 WITH THIS<br />
LINE<br />
MAXIMUM EVAPORATIVE CAPAC ITY - [ .,_<br />
500 1000 1500 2000 2500 3000 3500<br />
AIR VELOCITY--<br />
(FT/MtN)<br />
DETERMINE HEAT STRESS INDEX FOR<br />
WORKER DOING LIGHT ARM WORK WHILE<br />
STANDING AT A BENCH<br />
METABOLISM 600 Btu/hr<br />
ENVfRONMENTAL CONDITION:<br />
GLOBE THERMOMETER TEMPERATURE<br />
DRY BULB TEMPERATURE<br />
WET BULB TEMPERATURE<br />
AIR VELOCITY<br />
\<br />
k<br />
"_' 2000<br />
t000<br />
HEAT (DR VAPORIZATION FROM<br />
I00_ WETTE0 SKIN AT 95 F-BTU/hiR<br />
110 deg<br />
SOLUTION: FOLLOW THE BROKEN LINES FROM THE GLOBE THERMOMETER<br />
90°F<br />
75°F<br />
100fpm<br />
AND FROM DRY BULB TEMPERATURE TO THEIR INTERACTION ON<br />
ABOVE DIAGRAM C TO READ A STRESS INDEX OF 90.<br />
x,,,,, .<br />
_500 3OOO 3500<br />
Figure 3-18. Flow charts for determining heat stress index values at sea level conditions.<br />
(After ASHRAE, 1965)
100 Bioastronautics Data Book<br />
o_<br />
o=<br />
O<br />
I<br />
- =<br />
=<br />
O<br />
t_<br />
I<br />
L<br />
_c<br />
'S<br />
E v1<br />
O<br />
U<br />
°-<br />
E<br />
U<br />
L<br />
tO<br />
ZIE<br />
C 0<br />
o_ L<br />
C<br />
0<br />
_ L<br />
o m<br />
• - 0<br />
0 X<br />
o<br />
°_<br />
m<br />
..c<br />
Q_<br />
o<br />
,4.. L<br />
0 ._<br />
0J .g._o<br />
•"_ t_<br />
c _, +a<br />
_ to<br />
"o<br />
o 0<br />
_-_ 0<br />
o _- c o c<br />
0<br />
E .-- (O ° {11 "0<br />
0<br />
-- C_.O 0<br />
g_ _'_--°___<br />
L .._ fll L _ L<br />
,a t_ L<br />
o_ _ .- .,g-<br />
'- _ _ _ _-_ 2 ._.5_ _ _<br />
_ ,_.- _ =-j-_ _ _<br />
g _ -<br />
=E 3: z _,-<br />
oo o o oo<br />
¢q -i<br />
i +<br />
*_ 0 0<br />
_n 0 0-_<br />
.n 0_-o :<br />
"g;_g<br />
o 0<br />
4._ t- 0, g .8<br />
c.- 0 U 0<br />
.- i u') 0 ..E<br />
_.E 0"-- _ q--.-- u_ 0<br />
u L ....<br />
o_f, - _.<br />
g_ ._oo<br />
o00<br />
-,'t _3 ,0<br />
0<br />
.E *--<br />
4_ 3<br />
3: C 3<br />
0 0 _-'<br />
¢_ 0 .--<br />
L U ¢_<br />
m<br />
t..<br />
0 _ o--<br />
,--<br />
_ "--<br />
t-<br />
"_ _2
I<br />
_- 0 U<br />
_. 0 -0 .-- C<br />
*J _ .-- Ln t-<br />
-0 Jx JZ .--<br />
_ _._5.-_<br />
_'-"_o_-'- _- 4- "10 E<br />
-0 ---<br />
c U i_<br />
•- _-_ _ o$_<br />
ooo<br />
70 .-- QJ .....<br />
vl 0 tO 07 C ""m--_<br />
d<br />
L<br />
o<br />
_)<br />
"T''_<br />
t-<br />
O<br />
oo_ _.<br />
N<br />
"8 _J<br />
E<br />
C<br />
-C: 0<br />
I-- .)_<br />
oo<br />
Temperature 101<br />
¢.O<br />
O_
102 Bioastronautics Data Book<br />
&lR VELOCITY, fl/mm<br />
9<br />
Figure 3-19. Nomogram for _he prediction of 4-hour sweat rate (P4SR) at sea level. (Alter<br />
MaePherson, 1960; reprinted by permission of the Con_'oller of Her Brittanie Majesty's<br />
Stationery Offiee)<br />
The P4SR also may be calculated by the following three stages: In the first<br />
stage, the wet-bulb temperature may require modification depending on the<br />
amount of radiation, the metabolic rate, or the character of clothing. In the<br />
second stage, the nomogram is used to obtain the B4SR and in the third stage,<br />
the P4SR is obtained by adding certain constants to the B4SR depending
Temperature 103<br />
on the metabolic rate (see wet-bulb equivalent of metabolic rate in inset)<br />
and clothing. A P4SR of 4.5 liters was provisionally adapted as the upper limit<br />
of tolerance for physically fit mcn. Details regarding tile three-stage modification<br />
are available (MacPhcrson 1960).<br />
The P4SR, although derived under rather different conditions than expected<br />
in space flight, offers some possibilities if suitably extended (Webb, 1964). It<br />
was originally based on several types of experimental data taken on heatacclimatized<br />
young men in Singapore and in enviromnental chambers. It is<br />
unsafe to use it as a means of predicting sweat rate, however, unless all the<br />
conditions are similar to those originally used. When used with care, the P4SR<br />
does allow prediction of thermal effect in a number of different situations<br />
(Blockley, 1965). The hmitations are chiefly those of a narrow range of activity<br />
(up to 250 kcal/sq m-hr or five times the sitting subject rate) limited clothing<br />
combinations, and the fact that all the subjects were heat acclimatized. The<br />
P4SR is not recommended for predicting sweat. It can be used, however, for<br />
comparing environments in terms of thermal stress, to be followed by<br />
experimental evaluation of the environments, with sweat production being taken<br />
as one dependent variable (Gillies, 1965).<br />
Human Performance During Heat Stres_<br />
Tolerance Time in tteat. The maximum tolerance time (0 t) for heat gain<br />
that represents an emergency maximum for thermal stress is inversely<br />
proportional to the heat storage.<br />
where Qs is calculated usiltg equation 1.<br />
0t = 3300/Q s min or 55/Q s hr (26)<br />
The tolerance and general performance limits as a function of timc and body<br />
heat storage are shown in figure 3-20. The heat storage at tolerance is inversely<br />
related to the rate of heat storage (Goldman et al., 1965). Recent evidence<br />
indicates that men actively exercising in space suits can store up to 1000 BTU in<br />
actively working muscle (Wortz, 1967). This storage must be considered during<br />
any analysis of tolerance times in exercising subjects.<br />
Figure 3-21 indicates the conservative nature of earlier tolerancc limits. The<br />
dashed lines in the figure and points 1, 2, 3, and 4 represent more recently established<br />
tolerance time levels. The tolerance limit at high temperature is based on<br />
faintness, dyspnea, nausea, and restlessness as an endpoint. Because these levels are<br />
nearly double the limits established by earlier workers, engineers designing in terms<br />
of earlicr tables probably were more restricted than necessary or enjoyed a wide<br />
margin of safety even in the response of the most sensitive occupants. The ranges<br />
represented by these tables also reflect individual differences between subjects _<br />
well as differences in motivation. The dashed lines probably represent the capabilities<br />
of highly motivated spacecrews in top physical condition.
104 Bioastronautics Data Book<br />
140<br />
0<br />
50 100 150 200 250 (kcal/m2hrl<br />
NOT_ -- I<br />
THE MINIMUM PERFORMANCE LIMIT fS<br />
RECOMMENDED FOR GENERAL DESIGN<br />
PURPOSES THE SHADEO AREAS PERMIT<br />
A ROUGH EST(MATE OF THE PROBABLE<br />
CONSEOUENCE OF EXTENDING EXPOSURE I<br />
DURATION AT A GIVEN STORAGE RATE i<br />
BEYONO THE MINIMUM PERFORMANCE I<br />
LIMIT<br />
i<br />
LEGEND i<br />
?_ 1 SAFE TY, PERFORMANCE UNIMPAt RE D<br />
120 2 SAFETY. PE RFORMANCE UNCE RTAIN<br />
3 TOLERANCE UNCERTAIN, PERFORMANCE i<br />
IMPAIRED<br />
_- SO _ MNMUMTOLERANCELMT<br />
• I<br />
"'.. i<br />
so_ '.. I<br />
',, ®<br />
i : -,,oo, [<br />
20- " ......<br />
n<br />
MINIMUM PERFORMANCE LIMIT<br />
"1) 20 40 60 SO t00<br />
BODY STORAGE INDEX. O S (Btu/ft2hr)<br />
Figure 3-20. Performance and tolerance limits; transient zone.<br />
(After Blockley et al., 1954)<br />
140(- """<br />
. 130 INEW)<br />
8 HR. "o *.<br />
_C 120 "" ",°.,<br />
_. • . "_<br />
I,- " P'_' NF<br />
4HF 2HR<br />
HOT ZONE<br />
70 OMFORT ZONE IOLD)<br />
_BO___ c TOLERANCE<br />
2 HR<br />
12 HR<br />
5o_7 2 HR_LIM/_T_EO TOLERANCE,B HR TIME<br />
I HR TOLERANCE 2 4.4 • 04 HR<br />
40_ IHR / cToOLLERz_NE 3 '.'+0.,HR<br />
30 °_lr_Ha./ _ i I I I I4 I "I :+2+ozsa<br />
10 20 30 40 50<br />
VAPOR PRESSURE Imm Hg)<br />
Figure 3-21. Maximum tolerance enviromnents according to duration of exposure for<br />
sitting, clothed subjecLg under sea level conditions in aircraft design. (After Trumbull, 1956)
Temperature 105<br />
Figure 3-22 uses the reference operative temperature to determine per-<br />
formance and tolerance limits. There are high correlations between the final skin<br />
temperature, rate of rectal temperature rise, and rate of heart rate increase as<br />
linear functions of the Oxford index (Goldman, 1965).<br />
5<br />
4<br />
,,, 3<br />
F-<br />
8O<br />
DEGREES, C<br />
30 35 40 45 50 55 60<br />
MINIMUM TOLERANCE<br />
LIMIT-RESTING<br />
MINIMUM TOLERANOE ".-....<br />
N %% _4<br />
MINIMUM PERFORMANCE<br />
- LIMIT-RESTING<br />
Q_<br />
QQ_Q<br />
Z_ 0 "o...°,°.°.<br />
OR LIGHT ACTIVITY "_<br />
90 100 110 120 130 140<br />
REFERENCE OPERATIVE TEMPERATURE,<br />
TOR DEGREES, F<br />
TOR = Operative temperature at 0.79 in. Hg<br />
vapor pressure<br />
• Heavy pursuitmeter test<br />
• Mixed test battery<br />
• Working men<br />
A Wireless telegraphy test<br />
O Visual vigilance test<br />
[] Resting men<br />
Figure 3-22. Performance and tolerance limits in the quasi-compensable zone<br />
for lightly dressed men. (After Blockley et al., 1954)<br />
487-85_ O - 73 - 8
106 Bioastronauti¢_ Data Book<br />
Performance Under tteat Stress. Performance begins to deteriorate in any<br />
given condition at about 75 percent of the physiological tolerance limit.<br />
Although highly motivated individuals may be capable of exceeding normally<br />
established performance and tolerance limits (Teichner, 1961), excessive<br />
penalties in recovery time may be required if normal limits are exceeded. Even<br />
though no other stresses are anticipatcd or evident, it is suggested that<br />
75 percent of the average tolerance limit level not be exceeded until the<br />
significance of deconditioning that occurs during space flight is better<br />
understood. Figures 3-23 and 3-24 reflect performance decrements as a function<br />
of ambient and effective temperature.<br />
o£<br />
C)<br />
I<br />
z<br />
<<br />
o3<br />
z<br />
<<br />
G:<br />
,<<br />
140<br />
120<br />
loo<br />
8O<br />
40-<br />
60- _ I<br />
20 _ 3RO HOUR<br />
0 1 I I |<br />
75 80 85 90 95 100<br />
EFFECTIVE TEMPERATURE (OF)<br />
Figure 3- 23. Combined performance averages for l I wireless telegraph operators<br />
under conditions of extreme heat. (Rotb, 1968)<br />
Table 3-1 l summarizes the physiological respon_ increases and decreases in<br />
environmental temperature (Spector, 1956). The debilitating effects of heat have<br />
received much attention (Lind, 1963).<br />
Table 3-12 classifies the symptoms to be expected from the debilitating<br />
effects of heat.
-<br />
<<br />
v<br />
w<br />
160<br />
150<br />
140<br />
130<br />
120<br />
6O<br />
Temperature 107<br />
LOW INCENTIVE<br />
(Fast Speed)<br />
HIGH INCENTIVE<br />
(Fast Speedl<br />
(Slow Speed)<br />
HIGH INCENTIVE_<br />
1<br />
85/75 9o_8o 95185 L 100/90 -r"<br />
OF DBP°F WBllO0 FPM<br />
Figure 3-24. Effects of incentives, target speed, and environmental warmth on accuracy<br />
of manual tracking. (After Teichner, 1961; adapted from Pepler, 1959)<br />
Acclimatization to Heat. Acclimatization can alter the response of<br />
humans to heat loads. Figures 3-25 and 3-26 represent the improvement in<br />
function that is possible through heat acclimatization. Figure 3-25(a) shows<br />
results obtained with the standard acclimatization procedure used in South<br />
African gold mines to prepare laborers recruited from remote villages for<br />
work in saturated environments underground. The duration of the daily<br />
work period was 5 hours, azld the work, _oveling rock. For the first<br />
6days, the effective temperature was 84°F; for the next 6 days, the E.T.<br />
was 89.5°F and the amount of rock shoveled was increased. Note in the<br />
graph file fall in rectal temperature. The curves are means for over<br />
100 men, and the bar shows +1 S.D. during each of the 6-day work periods.<br />
In figure 3-25(b) results are shown for a hcat acclimatization technique used<br />
at the U.S. Army Laboratories at Natick. In this experiment, men marched<br />
at 3.5 mph for I00 minutes each day in an environment of 120°F dry-bulb,<br />
80°F wet-bulb, 20Oft/rain air velocity (E.T. 89°F, vapor pressure<br />
15 mm Hg).
108 Bioastronautics Data Book<br />
Qr]<br />
'8<br />
m.<br />
ex_<br />
b.,<br />
e.<br />
2<br />
0<br />
°_<br />
e-.<br />
[.r_]<br />
o_<br />
o o o o o _ ? *_<br />
g,<br />
_ _o o o _- o -<br />
'/ _,_ _• _ [ _, .... t "-<br />
¢o<br />
-- c<br />
_ o<br />
o o _o<br />
"= 2. _ o _ o<br />
_o t_<br />
o° o<br />
o_ _ 2<br />
o<br />
o o 8 - 6 =<br />
o _ %<br />
_ m _ m<br />
% _ c " " _ - oo<br />
-_ _ < _ Oo %<br />
_o _ _ ...........<br />
_ .- o co 3 c ._<br />
•- cz --<br />
• - _ o<br />
,.:S_44g
_r<br />
!<br />
4-1 l.-<br />
"_ ._ _<br />
E<br />
_ e c<br />
C ,2_,<br />
c I<br />
O<br />
°-<br />
c<br />
O<br />
"o<br />
cO<br />
m<br />
U<br />
I-<br />
c<br />
°-<br />
o=<br />
O<br />
-;_ .<br />
E<br />
.5 __£ _-2<br />
0-_=<br />
O _ntc<br />
_<br />
•_ _-<br />
u •<br />
_j ....<br />
_ °<br />
O _<br />
C ,-- "O<br />
"_ 0 Y--<br />
Temperature 109<br />
c 4._<br />
m _ E<br />
c 4- c<br />
r0 a) _<br />
L_ a_ E4-<br />
r" _Z .--<br />
cn<br />
•- E _ _<br />
r_ ><br />
x:_ ,o<br />
_g2<br />
c O<br />
L<br />
m _<br />
°_<br />
_J<br />
X<br />
.o c<br />
c _-<br />
_- 0 • _ _l<br />
"- _'_ _d<br />
_ ._ c 013<br />
0 E 3: • _- u<br />
.c E U ....<br />
0.- _.- _ u_<br />
U<br />
-a- o<br />
L N<br />
n_ _0 0'--<br />
•-- _Y- g 0 Q;<br />
(=r m .-- Q; U .--<br />
"_4- >_ C _ C<br />
_ 4J "1o<br />
_ >..- "_ E<br />
,- L..- L. _ ..o<br />
_'_x:<br />
_2.__.<br />
><br />
>-.-- Q;<br />
0 _ _ r',,<br />
0 _n _<br />
0<br />
k.<br />
c<br />
A f_<br />
t_<br />
O_
110 Bioastronautics Data Book<br />
._?u 100<br />
_ _<br />
1 2 3 4 5 6 7 8 9 10 11 12<br />
DAY NUMBER<br />
103 19.5 180-<br />
(a)<br />
4<br />
v_<br />
u7<br />
o,_<br />
e<br />
LL a.<br />
0 c<br />
LL Mean<br />
o sweat U 1.4 _t<br />
",\d o<br />
LU loss/ c :..<br />
t_ 102 ua ?= 160- -o<br />
< _- o 3<br />
Ok eon
u.<br />
o<br />
V-<br />
LLI<br />
Q.<br />
UJ<br />
I.--<br />
G<br />
rv<br />
c<br />
4<br />
rv<br />
Q.<br />
104<br />
102<br />
I oQ<br />
98<br />
190<br />
150<br />
110<br />
70<br />
0<br />
Temperature ] l I<br />
] M.R'.= 574 kcal/hr I<br />
_'_ _. 39<br />
] 3 4 0 I 2 3 4<br />
DURATION OF WALK - hours<br />
(a)<br />
500 • Hot, humid; uniform, pack (Group 1 - 16 men)<br />
o Hot, dry; nude; high wind (Group 2 - 3 men)<br />
• Cool; nude, _ high wind - before acclimatization<br />
-_ 0 Cool; nude; high wind - after acctimatizati_n<br />
0<br />
,. 400 _ I<br />
112 Bioastronautics Data Book<br />
In figure 3-26(a), the results of a heat acclimatization experiment involving<br />
two subjects are shown. Subjects walked at 3.5 mph on a 5.6 percent grade in a<br />
room at a temperature of 104°F and a vapor pressure of 13 mm Hg (E.T. 84°F).<br />
Subject S.R. was acclimatized by 23exposures between February 20 and<br />
March 20. After March 20 his only exposures were on April 16 and 28. Subject<br />
W.[l. was acclimatized by 11 exposures between March 24 and April 8. After<br />
April 8, his only exposures were on April 22 and 29. On the first exposure, the<br />
experiment was terminated by the collapse of the subjects at 90 min. After<br />
acclimatization, the men were still maintaining equilibrium with ease after<br />
4.5 hr. Acclimatization to heat is shown by the lowering of body temperatures<br />
and heart rates. Figure 3-26(b) is a diagrammatic presentation of mean results<br />
from two studies of the heat acclimatization phenomenon. Subjects ill both<br />
groups were drawn from the same Army population at Fort Knox, Kentucky.<br />
The two studies are related by means of a parameter combining the sweat rate<br />
(expressed as its caloric value if evaporated) and metabolic rate. The slope of the<br />
straight lines in the diagram represents an estimate of the sensitivity of the sweat<br />
response to increases in temperature of the peripheral tissues or blood (expressed<br />
as a function of surface temperature and metabolic heat output). It can bc seen<br />
that when men are unclothed and the air is dry, sweat rate changes but little, but<br />
the skin temperature needed to produce that amount of sweat becomes steadily<br />
lower in successive exposures when the climate is humid, and evaporation is<br />
impeded by clothing: the skin temperatures does not change much on successive<br />
days, but the quantity of sweat produced at that temperature is enormously<br />
incrca.,_'d as acclimatization progresses.<br />
The value of the shorter exposure period technique in preparing men to<br />
work for long periods such as 5 hours or more in the heat is the subject of<br />
considerable controversy. Newer techniques pioneered by Fox (1964) in<br />
England concentrate on raising core temperature to the same fixed level each<br />
day, so that thermal strain, rather than the stress, remains constant throughout<br />
the acclimatization process. Under these conditions, improvement continues for<br />
longer periods and to greater levels than the standard exposure techniques. Heat<br />
acclimatization may not be as important in hot, wet environments where<br />
increased evaporative cooling cannot be produced even if there is an increased<br />
sweat secretion, since no increase in the internal thermal gradient between core<br />
and skirl temperature can be achieved (Goldman, 1965).<br />
Skin Pain and Heat Pulses. Tables 3-1 and 3-13 and figure 3-27 show the<br />
pain thresholds for the skin from conductive, radiant, and convective heating. In<br />
general, the pain threshold is reached when the skin reaches a temperature of<br />
45°C. A skin temperature of 46°C is intolerably painful. For small skin areas the<br />
curve shown in figure 3-27 becomes asymptotic at about 18 BTU sq ft/min. At this<br />
level and below, the blood supply to the skin is carrying off the heat as fast as it<br />
arrives, and heat is stored in tile body. How long this can go on with the total body<br />
exposed is not established. A rise in skin temperature of 0.008°C will evoke a<br />
sensation of warmth in 3 _conds and a decrease in skin temperature of<br />
0.0070°F will produce a cohl sensation. The faee and the neck are the<br />
most sensitive to thermal stimuli and the backs of the hands arc next<br />
(Hardy 1954).
Hand<br />
Temperature<br />
Table 3-13<br />
Pain from Conductive Heating<br />
Mural Surface gv, i,g,:<br />
Tclupcrntul_, T_ h:r,lnC_ Tilnc,<br />
Body Area Clothing Worn _f _c<br />
Kneecap<br />
Fingertip<br />
Hand - pal,=,<br />
Fore,_rm<br />
Upper arm<br />
Buttocks<br />
Mid-thlgh<br />
Kneecap flexed<br />
Calf _uscle<br />
Upper arm<br />
forear=l<br />
Pal_ of ha_d<br />
Back of hand<br />
Palm of hand<br />
B,ire skin<br />
B,_re skin<br />
Bare skin<br />
AF/B-3A leather gloves<br />
AF/B-3A leather gloves<br />
AF/B-3A leathcl gloves<br />
AF/B-3A leather gloves<br />
AF/B-SA leather gloves<br />
SAC alert suit<br />
SAC alert suit<br />
K-2B light AF flight coverall<br />
SAC alert suit<br />
Alert suit plus Brynje net string<br />
underwear<br />
K-2B _uit<br />
K-2B Suit plus Brynje underwear<br />
SAC alert suit<br />
AleFt suit plus Brynje underwear<br />
K-2B suit<br />
K-2B suit plus Brynje underwear<br />
SAC alert suit<br />
Alert suit plus Brynje underwear<br />
K-2B suit<br />
K-2B suit plus Srynje underwear<br />
SAC alert suit<br />
Alert suit plus Brynie underwear<br />
K-2B suit<br />
SAC alert suit<br />
Alert sult plus Brynje underwear<br />
K-2B suit<br />
K-2B suit plu, Brynje underwear<br />
MD-3A wool-nylon antiexposure suit<br />
MD-3A wool-nylon antie×posure suit<br />
MD-3A suit<br />
Aluminized asbestos glove<br />
AIuninized asbestos gloves<br />
Arctic mitten<br />
Arctic mitten plus B-_A glove<br />
Arctic mitten plus B-3A glove<br />
Pigskin 800°F heat glove<br />
Pigskin 800°F heat glove<br />
Pigskin 800°F heat glove<br />
Notes: Light touch pressure (less than 1 psi) applied to heated metal surface.<br />
bow and knee sometimes received second-degree burns without pain.<br />
(After Blockley, 1964)<br />
t20<br />
II7<br />
_20<br />
t BO<br />
60<br />
IBO<br />
17B<br />
185<br />
IBO<br />
175<br />
150<br />
_BO<br />
500<br />
f $0<br />
150<br />
I BO<br />
30O<br />
IBO<br />
150<br />
150<br />
30O<br />
150<br />
150<br />
_50<br />
t75<br />
150<br />
150<br />
300<br />
tBO<br />
150<br />
300<br />
400<br />
250<br />
250<br />
250<br />
300<br />
3O0<br />
400<br />
300<br />
400<br />
50O<br />
I0 t(, Ib<br />
54<br />
B<br />
t2.6<br />
7.3<br />
25.2<br />
9.7<br />
8,0<br />
20.0<br />
8.0<br />
?,S<br />
34 .3<br />
7.2<br />
18,1<br />
61,9<br />
70.3<br />
2_.7<br />
52.5<br />
_90<br />
55.6<br />
i3.1<br />
t5.6<br />
.90<br />
14.4<br />
9.5<br />
7.3<br />
11.4<br />
13.2<br />
66. I<br />
42.0<br />
b0.2<br />
15.9<br />
b3.5<br />
B.2<br />
18.7<br />
57.0<br />
27,6<br />
30.7<br />
21,0<br />
18.5<br />
The e.<br />
113
ll4<br />
220<br />
200<br />
180<br />
•_ 160<br />
' 1N<br />
6C<br />
2C<br />
1.0 2 3 45<br />
$ • 20<br />
z<br />
45<br />
40 t<br />
u<br />
u_<br />
u_ 1C<br />
U<br />
z<br />
_ 5<br />
3<br />
110<br />
Bioastronautics Data Book<br />
10 20. 30 4050 100 200<br />
TIME - seconds.<br />
(a)<br />
AIR TEMPERATURE - '_C<br />
55 60 65<br />
i'<br />
NO<br />
PAIN<br />
ZONE<br />
\,<br />
• NO SENSATION<br />
o NO PAiN WITHIN 6 OR 7 MIN<br />
• PAIN WITHIN 1.5 TO 4 MIN<br />
6 PAIN WITHIN 1 MIN<br />
• -%<br />
PAIN<br />
ZONE<br />
500<br />
7O<br />
'1<br />
120 130 140 150 160 170<br />
AiR TEMPERATURE - °F<br />
(b)<br />
1.0<br />
3.9<br />
0.8<br />
D.7 ._<br />
0.6<br />
0.5 w LJ<br />
z<br />
Figure 3-27. Pain from radiant and eonvective heating. A: strong skin pain produced by<br />
sources ranging from intensity of nuclear weapon flash (approximately 100 BTU/sq ft/min)<br />
to _ow heat pulse associated with reenlxy heating, where the heaUng is partly convective.<br />
(After Bloekley, 1964; adapted from Buettner, 1952; Hardy, 1954; Kaufman et al., 1961;<br />
Stoll & Greene, 1959; Webb, 1963). B: dividing line between painful and nonpainful heating<br />
for air at various temperatures vs the heat transfer coefficient, which depends on air density,<br />
air velocity, and surface areas and shapes. (After Blockley, 1964)<br />
75<br />
!<br />
3.4<br />
C1.2<br />
0.1<br />
.0<br />
n_
Temperature 115<br />
The ability of the body to withstand high heat pulses is shown in figure 3-28.<br />
Figure 3-28(a) and (b) show the pulse responses and average skin temperatures of<br />
subjects exposed to three different severe heat exposure transients which come<br />
close to both the pain limit and the heat storage limit. Each curve represents the<br />
average data from five or six subjects. Clothing consisted of a standard flying coverall<br />
worn over long underwear with an insulation value of 1 Clo. Figure 3-28(c)<br />
shows the increase in tolerance times for subjects exposed to a heat pulse where<br />
wall temperature was increased at 100°F/min, and the subjects wore clothing affording<br />
various degrees of protection. With subjects wearing heavy" aluminized<br />
coveralls, wall temperature increase was stopped at 500°F and that temperature<br />
held until tolerance was reached. Adding ventilation with air at about 85°F allowed<br />
these exposures to last beyond 20 min. Figure 3-28(d) graphs tolerance time<br />
for man in a hot environment. The time scale indicates prepain time for exposure of<br />
the skin to radiant heat, and escape time for the curve marked "body." The latter<br />
refers to a lightly clad man with his face exposed. The temperature scale denotes<br />
room temperature for the body curve and radiation temperatures for curves referable<br />
to the skin. The curve marked warm dry refers to experiments with an initially<br />
dry skin, and a skin temperature initially of about 30°C. A tourniquet was applied<br />
to obtain the data marked without circulation. The cold wet curve utilized skin<br />
exposed wet at an initial skin temperature of about 15°C. The clothed skin curve<br />
was obtained using skin covered with 1 cm insulating cloth with an initial skin<br />
temperature near 30°C.<br />
A computer program is available for evaluation of time-temperature histories<br />
of the skin at different depths following heat pulses (Weaver, 1967).<br />
Cold Stress<br />
Shivering ensues when heat losses to the environment exceed the metabolic<br />
energy being produced by the body and body and skin temperatures reach critical<br />
values. The shivering reaction increases skeletal muscle activity (without doing<br />
measurable work) and results in an increase in metabolic heat production. A twofold<br />
increase in metabolism due to shivering has been observed after exposure to an<br />
ambient temperature of 4 I°F (5°C) for more than one hour. A fivefold increase in<br />
metabolism due to shivering is considered to be the maximum attainable (Bullard,<br />
1963). Although shivering may add enough to metabolic heat production to<br />
prevent further heat loss, it is never sufficient to replace heat already lost. The<br />
shivering response may be triggered by the rate of decrease in temperature and not<br />
the temperature of the bodyper se (Burton, 1946).<br />
Cold Stress Tolerance<br />
The effective loss of about 80 kcal/sq m or 31 BTU/sq ft has been taken as<br />
the maximum heat loss a person can tolerate with severe discomfort (Spector,<br />
1956). The heat available for loss can be taken as 0.75 Em + 80 kcal/sq m, where<br />
E m is the metabolic rate in kcal/sq m-hr. Sleep of unacclimatized Caucasians will<br />
be disturbed at 50 percent of this loss rate. The lowest ambient temperature at<br />
sea level that can be tolerated for prolonged thermal equilibrium is a function of<br />
the exercise rate, insulation, wind speed, and several other variables.
116 Bioastronautics Data Book<br />
E<br />
7O<br />
60<br />
, 50<br />
Z<br />
- 20<br />
11z<br />
U<br />
o<br />
u_ 110--<br />
0 a<br />
ev<br />
I- 106<br />
n,,<br />
u.l<br />
,,, !<br />
lO2 / /<br />
z_ v I/<br />
z<br />
< 98<br />
I-<br />
,,, I1" 7/ . /<br />
- f ;_
kl_<br />
O<br />
i<br />
.<<br />
¢w<br />
LU<br />
a.<br />
LU<br />
I---<br />
_J<br />
.J <<br />
525 ,<br />
r i i<br />
Heavy<br />
flight<br />
500<br />
475<br />
"A ,<br />
Summer I Jr Heavy|aluminized<br />
flight 11<br />
clothing_<br />
. /!<br />
I<br />
o rl': ........... ":i"<br />
f ,<br />
75 -' ' ' L<br />
0<br />
1 ! i t<br />
.w inter<br />
clothing<br />
I jcov°roll<br />
| t<br />
I<br />
I1I<br />
I<br />
I<br />
I<br />
Light l under- /<br />
425 wear [" |<br />
II I<br />
Nude_<br />
400 [I !. 11<br />
.11.1. ,I<br />
6OO<br />
500<br />
4OO<br />
_ 300<br />
U<br />
9..<br />
,,, 200<br />
n,"<br />
m 150<br />
I-<br />
<<br />
,,, 100<br />
O_<br />
:_ 8O<br />
UJ<br />
1-<br />
6O<br />
4O<br />
5<br />
Temperature 117<br />
I<br />
I I °°<br />
i II<br />
10<br />
TIME - minutes<br />
(c)<br />
TIME (sec)<br />
I<br />
Ventilated<br />
heavy aluminized<br />
coverall<br />
15<br />
1 10 102 103 104<br />
',2o° ' '<br />
,v _,e,_e_,,N ,,-<br />
1 2 3 5 IOSEC 1MIN<br />
I I I i I [ I<br />
I I<br />
1 10 102<br />
TIME (sec)<br />
(d)<br />
20<br />
!70<br />
_60<br />
250 P i<br />
uJ<br />
240 n,<br />
3O<br />
10MIN 1 HR2HR 10HR<br />
I i I I i 1<br />
I--<br />
230 < o_<br />
LU<br />
220 a.<br />
uJ<br />
p-<br />
210 j ._J<br />
<<br />
105<br />
103 104 105<br />
Figure 3-28. Tolerable heat pulses. (Part e is adapted by Blockley, 1964, from data of<br />
Kissen & Hall, 1963; Kaufman, 1963; Webb, 1963; Part d is after Buettner, 1952, based on<br />
data of Blockley & Taylor, 1948, and Pfleiderer & Buettner, 1940) - Continued
118 Bioaslronautics Data Book<br />
An empirical expression for the total cooling power of the environment,<br />
disregarding evaporation, is called windchill (Iampietro et al., 1958):<br />
Kc : (V x 100 + 10.45 - V)(33 - Ta) (27)<br />
where K c = windchill, that is, total cooling in kg-cal/sq m/hr<br />
V : wind velocity in m/sec<br />
T a = air temperature in °C<br />
Although K c is not rcprcsentative of human cooling and is probably not very<br />
closely representative of physical cooling either, windchili has come into<br />
common use as a single-valued index of the severity of the temperature-wind<br />
combinations. As such, it provides a descriptive quantity against which human<br />
cooling phenomena can be evaluated. A nomogram, giving rapid approximations<br />
of windchill, is provided as figure 3-29. In outdoor cold weather, the wind<br />
velocity has a profound, sometimes decisive, effect on the hazard to men who<br />
are exposed. The windchill concept provides a means for quantitative<br />
comparison of various combinations of temperature and windspeed. For<br />
example, note in the nomogram -50°F with an air movement of 0.1 mph has the<br />
same windchill value, and therefore is predicted to produce the same sensation<br />
on exposed skin, as -15°F with a wind of only 1 mph or +14°F with a wind of<br />
5 mph. The windchill index does not account for physiological adaptations or<br />
adjustments and should not be used in a rigorous manner. It is based on field<br />
measurements by Paul Siple during World War II of the rate of cooling of a<br />
container of water.<br />
When the rate of body heat production is greater than the windchill, excess<br />
heat is removed by evaporation; under bright, sunny conditions, the nomogram<br />
values should be reduced approximately 200 kg-cal.<br />
For ocean recovery in winter months, the rate of cooling in water is important.<br />
Figure 3-30 is a nomogram for estimating tolerance time to cold water<br />
immersion (Smith et al., 1962). The nomogranl was devised to relate the many<br />
factors involved in estimating tolerance in cold water, where one knows or can<br />
assume: water temperature (Tw); insulation of clothing and tissue (It);<br />
metabolic heat production per unit surface area (M/A); the immersed<br />
surface area (A); body mass (m); and exposure time (t). As shown by the<br />
dotted example line (for a nude man in water at 4°C, a metabolic rate of<br />
400 kcal/sq m-hr, an immersed surface area of 1.75 sq m, a body mass of<br />
75 kg, and an exposure time of one hour) the nomogram predicts: heat loss<br />
to the environment He/A; heat debt per unit surface area (D/A); heat debt<br />
(D); changes in mean body temperature (dO); and mean body temperature<br />
(0).
05 "<br />
I0 _ '"04 4OO<br />
WIND VEL OCIT_ -_<br />
Temperature 119<br />
Figure 3-29. Windehill nomogram.<br />
TEMPERATURE<br />
°F- "C<br />
+ _50<br />
(After Blockley, 1964; adapted from Siple & Passell, 1945)<br />
/<br />
"" 0 5 3OO<br />
II ;4O I O0 ZOO<br />
.711<br />
ISO<br />
I00<br />
ot. I1 1<br />
Tw _ A<br />
.0<br />
_00". _ 30<br />
_00 " _0<br />
X 'f_x_ A _"_<br />
1700<br />
I000<br />
olll
120 Bioastronautics Data Book<br />
Figure 3-31 is a graphic presentation of practical experience in cold<br />
water tolerance with routine flight clothing and antiexposure suits. The<br />
"voluntary tolerance, flight clothing" zone in figure3-31(a) shows the<br />
average results from numerous experimental studies, including a recent one<br />
using a diver's "wet suit" in conjunction with a flight suit and long<br />
underwear. Such experiments are typically terminated when the subject<br />
declines to accept the discomfort any longer, or reaches a skin temperature<br />
below 50°F. The second limit shown, pertaining to men protected by<br />
potentially waterproof garments, reflects the fact that hands and feet cannot<br />
be adequately insulated and remain functional. Nude men in 75°F water<br />
reach, within 12 hours, one or mlother tolerance limit (rectal tempcrature<br />
below 95°F, blood sugar below 6Orng/lOOml, or muscle cramps). The<br />
extent to which real survival time would exceed this limit is difficult to<br />
predict, due to the importance of injury, equipment available, and such<br />
psychological factors as belief in the possibility of rescue. An analysis of<br />
over 25,000 personnel on ships lost at sea during 194044 showed that of<br />
those who reached liferafts, half died by the sixth day if the air<br />
temperature was below 41°F (5°C); survival time increased with increasing<br />
air tcmpcrature. Figurc3-31(b) indicates life expectancy for individuals<br />
immersed in cold water wearing no protective clothing.<br />
Figure 3-32 shows the time to reach critical core and skin temperatures<br />
after exposure to cold water in several types of exposure suits. A criterion<br />
of 76°F is based on the general observation of extreme discomfort when<br />
this point is passed. In most of the experiments summarized here, some<br />
subjects requested termination of the exposure at or near the time when<br />
the group average reached this point. Note for comparison the data point<br />
for nude exposure to water at 48°F. The value of exercising in cold air and<br />
the lack of an advantage in cold water is evident.<br />
Recent developments in isotopic heating devices make practical the use<br />
of exposure garments heated for long periods of time (Sanders, 1966).<br />
In cold air, injury to the extremities is often a limiting factor in human<br />
performance (Bullard, 1963). Figure3-33 indicates the power required to<br />
attain given skin temperatures of tland and loot in electrically heated gloves<br />
and seals with subjects in an air temperature of -40°F in a 10mph wind.<br />
The body core in these experiments was wound in a U.S. Army<br />
Quartermaster 4.3 Clo cold-dry standard clothing ensemble. Performance is<br />
severely hindered if the temperature of the fifth finger falls below 55°F<br />
(Clark, 1961 ).<br />
Figure 3-34 prescnts a typical physiological response of a body immersed<br />
in cold water and rewarmed. The pathophysiology and treatment of<br />
hypothermia and cold injury in space operations were recently reviewed by<br />
Busby (1967).
tt<br />
o<br />
70<br />
tu 60<br />
tv<br />
I--<br />
.<<br />
iX<br />
LU<br />
I---<br />
iX<br />
tu 40<br />
I--<br />
0<br />
_t<br />
3O<br />
--VOLUNTARY<br />
*EAR,NG_L,G.TCLOT",NG SU,TS_iii.'<br />
_i6i;:<br />
Temperature 121<br />
ii: _ ii '"<br />
VOLUNTARY TOLERANCE /<br />
TOLE 'WEARING ANTI-EX POSURE<br />
• 25 .50 .75 1 2 5 10 20 40<br />
TIME -hours<br />
(al<br />
JLqt<br />
LIFE EXPECTANCY WITH NO EXPOSURE SUIT<br />
/<br />
30 40 50 60 70<br />
WATER TEMPERATURE (°F}<br />
(b)<br />
20<br />
t,u<br />
15 iX<br />
I--<br />
.<<br />
iX<br />
10 _<br />
UJ<br />
I--<br />
5 _"<br />
Figure 3-31. Survival in cold water. A: voluntary tolerance to cold water; B: life<br />
expectancy with no exposure suit. (After Blockley, 1964; adapted from Beckman & Revees.<br />
1966; Damato & Radliff, 1964; Hall et al., 1953; McCance et al., 1956; Molnar, 1964; U.S.<br />
Navy, 1948; Barnett, 1962)<br />
487 858 0 - 73 -<br />
0<br />
I--<br />
122 Bioastronautics Data Book<br />
l_<br />
AIR TEMPERATURE<br />
r ,<br />
- °C WATER TEMPERATURE - °C<br />
,<br />
0 :;0<br />
12( " _-- _ -<br />
COLD AIR ! COLDWATER<br />
EXPOSURE5 J EXPOSURES<br />
,_ ___ _ %,..._,._ _ --<br />
AIR TEMP[RATUR[ °F WATER TEMP[RATURE. =F<br />
Water A_r<br />
Temperature, Tcr1_pe rat u r_. T i_e,<br />
S_;t °C 0 C hr _<br />
RJ-A _.9 -18 5<br />
R_-A 0 J _8<br />
CWL]- 12/P I 2 15 _5<br />
CWU-3/P 7 12 r,_<br />
_Es_i_ated ti_e _:;n hours) required for _ubjects' rectal ter_oer_ture<br />
to reach 34°C. Rapid rewarmln 9 of h_pothernl;¢ subject i_ _2°C<br />
_tcr required for resuscitation.<br />
iAfter Milan, 19651<br />
b. Estimated Survival Times in Cold Water with Latest $urvlva] Clothln 9<br />
Figure 3-32. Clothing tests in cold air and water. A: time to reach critical skin<br />
temperature in cold air and water. (After Blockley, 1964; adapted from Barnett, 1962)<br />
B: estimated survival times in cold water with latest survival clothing. (After Milan, 1965)<br />
IOO-<br />
80<br />
60<br />
,o _*_<br />
tOO -FOOT (°FI _• _<br />
60<br />
/ • IN<br />
:_ • 5TH TOE<br />
'IT-<br />
[ I i L<br />
4G i 10 15 20 25 30<br />
WATTS<br />
Figure 3-33. Band and foot temperatures maintained as a function of power used for<br />
auxiliary heated gloves and socks.(After Goldman, 1965)<br />
iI
35_<br />
4£<br />
35 i<br />
3O<br />
25<br />
20<br />
15<br />
10_<br />
i<br />
Temperature 123<br />
WATE R 43°F (6°CI SLOW RISE OF WATER TEMPERATURE<br />
TO 102°F (39°C)<br />
SHAKING CHILLS PAINFUL<br />
ESPEC)ALLY AROUND NECK<br />
GOOSEFLESH<br />
LESS PAIN FACE AN{) EAHS BLUE.<br />
HANDS CYANOTIC BODY PINKISH<br />
BLUE<br />
SHAKING VIOLENTLy FEELS<br />
MUCH COLDER NOW tHAN<br />
BEFORE TOES PAINFUL<br />
TOES NUMB, STILL SHAKING<br />
TOESPAINFULLYNUMB<br />
BREATHING DEEPLY<br />
1<br />
TOESPAINFUL<br />
20 30 40 50<br />
TIME (min)<br />
FEELING WARMER NOW,<br />
STILL SHIVERING<br />
COMFORTABLEFOR<br />
F IRST TIME<br />
VERYCOMFORTABLE,<br />
SHIVERING GONE<br />
[<br />
Figure 3-34. Changes in body and skin temperature of subject immersed in water at 6°C<br />
(43 F) for 52 min; water was then warmed to 39°C. (Note sharp fall of gastric, oral, and<br />
rectal temperatures initially on warming.)(After Behnke & Yaglou, 1951 )<br />
Performance in the Cold<br />
Skilled motor performance shows a progressive loss with continued cold<br />
exposure (Trumbull, 1956). Tactual sensitivity is markedly affected by lowered<br />
skin temperature. A numbness index has been developed based on the ability of<br />
the individual to discriminate the separateness in space of two straight edges on<br />
which the finger is placed (V-test or two-edge limen) (Mackworth, 1946).<br />
Figure 3-35 shows the great difference in the size of gap required to detect the<br />
presence of the gap under varying conditions of air temperature and windspeed.<br />
General performance also is altered by cold in a complex way. Figure 3-36<br />
shows the effects of various combinations of air temperature and velocity (and<br />
thus windchill) on the manual dexterity of soldiers. Except as indicated,<br />
complete Arctic uniforms were wom. During the test trials, the subjects removed<br />
the heavy arctic gauntlet and performed with only the wool trigger-finger insert.<br />
The results are based on a total of 530 soldiers sorted into the various subgroups<br />
of the experiment. It may be seen that performance time increased in direct<br />
proportion to the windchill and that mean skin temperature and digital<br />
temperature were roughly inversely proportional to windchill. The rate of<br />
cooling is an important factor (Clark et al., 1960). There is clearly a relationship
124 Bioastronautics Data Book<br />
between performance and the skin temperatures; however, analyses of these<br />
data and those of figure3-37 indicate that the direct dependence of<br />
performance on finger and skin temperatures may be relatively small and<br />
that other factors of a psychological or physiological nature may he of<br />
equal or possibly greater importance.<br />
uJ 3<br />
--j<br />
4O<br />
DEGREES FAHRENHEIT<br />
60 8O<br />
I I I<br />
O AESTHESIOMETER Itt_o points)<br />
l I I<br />
10 10 20<br />
DEGREES CENTIGRADE<br />
Figure 3-35. Comparison of two-edge and two-point thresholds<br />
as a function of skin temperature in air at sea level. (After Mills, 1957)<br />
Total body cooling is not as significant a factor as finger temperature in<br />
dexterity tests (Gaydos, 1958); cooling of the hand decreases finger<br />
flexibility (LeBlanc, 1956).<br />
The reaction speed of men to simple visual signals also is affected by<br />
the cold (Teichner, 1958). The relative loss is not as g_eat as that of tactual<br />
sensitivity, but it is greater than that of manual dexterity. Figure 3-38<br />
shows a comparison of these three phenomena for appropriately dressed,<br />
but unacclimatized men in terms of the percentage loss relative to optimum<br />
thermal conditions. It is reasonable to expect losses in a cold environment<br />
for all types of performance that depend on any of these functions, as well<br />
as tasks of eye-hand coordination (Teichner, 1954) and intellectual tasks<br />
requiring fast reactions such as the cold test (Horvath, 1947). Nothing has<br />
been reported to indicate that intellectual tasks not requiring fast reaction<br />
times, motor skills, or tactual sensitivity are affected by cold exposure, at<br />
least short of the accumulation of a serious heat debt.
36<br />
35<br />
_G == 34<br />
" 33<br />
C- 32<br />
31<br />
30<br />
_ 28<br />
_ 27<br />
e_<br />
26<br />
94-<br />
25<br />
24<br />
-<br />
PT = 24.36 + .00327 (WC)<br />
Temperature 125<br />
-- • •<br />
-- NUDE%<br />
F,T,,U S<br />
-I I I I I I I I I I I I --_--<br />
800 1200 1600 2000 60 ° F<br />
I00 1200 1600 2000 60 ° F<br />
I I I I 1 I I I I I I I I I t l I - 96<br />
_. 93- - 92 o_<br />
-- 88 v<br />
ov 92- UJ<br />
'" 91- --84 rr<br />
D --80<br />
I-. 90 H MEAN SKIN TEMPERATURE I--<br />
< 89 _- _ _ ,A =.--,A DIGITAL TEMPERATURE 76<br />
nt-<br />
"' _ \\ "_ 72 _<br />
,,,_ 87'- \. "_ FATIGUES_ 68 p.<br />
I-- Z 86- \\\ -_r,.,..Q,_,,A__ " _.. NUDE " _ 64 _:<br />
Z 84- _ _ _ 56 _,<br />
< _ _ 52 z<br />
,,,=_83- _"-_ - 48 ,,,<<br />
82-- _ %= N UDE",,_ 44<br />
81 - WINDCHILL (kcat/m2/hr) m"----"A_ 0-- 40<br />
Figure 3-36. Performance time, skin, and digit temperature as a function of windchill;<br />
arctic clothing worn except where indicated. Hand exposed during performance only;<br />
follows approximately 35 rain of exposure. (After Teichner, 1957; copyright 1957 by<br />
the American Psychological Association and reprinted with their permission)<br />
Acclimatization to Cold<br />
Recent evidence indicates that under cold conditions, increased voluntary<br />
caloric intake and other compensatory processes result from the increased<br />
energy expenditures associated with field activities (Davis, 1963) instead of<br />
from the low temperature as such.
126 Bioastronautics Data Book<br />
60-<br />
5O<br />
W 4o<br />
a<br />
2o<br />
lo<br />
............... MINNESOTA RATE OF MANIPULATION<br />
O'CONNER FINGER DEXTERITY TEST<br />
PURDUE PEGBOARD TEST, RIGHT HAND<br />
I i PURDUE PEGBOARD TEST, LEFT HAND<br />
_ ..... PURDUE PEGBOARD TEST, BOTH HANDS<br />
_ ....... PURDUE PEGBOARD TEST, ASSEMBLY TASK<br />
......................<br />
I I I<br />
35 45 55<br />
AMBIENT TEMPERATURE (°F)<br />
Figure 3-37. Percent decrement in performance as a function of ambient temperature<br />
at sea level. (After Dusek, 1957)<br />
O -J<br />
Ull<br />
<<br />
I-z<br />
U.I<br />
n_<br />
I.U<br />
CI.<br />
I<br />
/<br />
°°F ,/<br />
140_ /<br />
12o /<br />
100- / e j<br />
80--<br />
60- C<br />
40-<br />
1000 2000 3000 4000<br />
WINDCHI LL (kcal/m2/hr)<br />
Figure 3-38. Minimum effects of the cold on selected functions. Each curve is an<br />
estimated percentage loss of the indicated type of performance for appropriately<br />
dressed but unacclimatized men. A: tactual sensitivity of the bare hand; B: simple<br />
visual reaction lime; C: manual skill. (After Teichner,1958; copyright 1957by the<br />
American Psychological Association and reprinted with their permission)
Tempera! ure 127<br />
Whatever the direct cause, the result contributes to a beneficial increase<br />
in heat production, vasomotor and renal control. The major known<br />
physiological changes produced in the cold were shown in table 3-11. This<br />
table indicates that acclimatization takes the form of increased levels of<br />
some functions and the return to normal of others. The value of using cold<br />
acclimatization to increase the performance and survival capabilities of<br />
astronauts during emergencies, in such missions as lunar night operations,<br />
has not been established.<br />
Clothing<br />
The effects of clothing on thermal transfer from the body must be<br />
considered for all conditions of space flight. The basic principles of thermal<br />
physiology involved with the effects of wearing clothing have been discussed in<br />
this chapter. Other factors, however, need to be considered (Blockley, 1954,<br />
1964; Burton, 1955; Newburgh, 1949; and Roth, 1966).<br />
Insulation Values<br />
The addition of clothing to the body surface reduces the quantity of heat<br />
that can be lost by evaporation because of the increased resistance to diffusion<br />
of water vapor. At the same time it reduces the quantity of heat gained or lost<br />
by the body by radiation and convection.<br />
Two properties of clothing must be evaluated to determine the effect of<br />
clothing on thermal balance:the_ are thermal resistance (Rg) and vapor<br />
resistance (1_). Thermal resistance is the resistance of a particular clothing<br />
assembly to flow of heat. It is generally expressed in CIo units (see discussion<br />
after equation 3).<br />
Thc total insulation value of a clothing assembly to the man must include<br />
the insulation of any gas layer trapped between clothing layers. Calculation of<br />
the total insulation value of newly designed garments and fabrics requires the<br />
knowledge of the equivalent thickness of the still-air layer (R°), which is equal to<br />
the sum of the clothing thickness (R'g) as a still-air equivalent and the film<br />
thickness of the still-air layer (Re):<br />
R' : R'g + R e (28)<br />
Values for R'g for standard fabrics are shown in table 3-14. If fabric<br />
thickness is known, the following relationship can be used:<br />
Rg _ equivalent air thickness<br />
L fabric thickness<br />
(29)
128 Bioastronautics Data Book<br />
If thermal resistance in Clo units is known, the _lationship shown in<br />
equation 30 can be used.<br />
R'g vapor resistance (in. of air) 0.5 in. 1.2 cm of air<br />
R---:" thermal resistance (Clo units) CIo of air or Clo (30)<br />
Vapor resistance (R°g) depends on the vapor diffusion of evaporated water,<br />
weave and thickness of the fabric material, thickness of the air layers between<br />
the garments, and nature of the gaseous environment. While the rate of vapor<br />
transfer across near isothermal air layers is directly proportional to thickness,<br />
bellows action and resulting c6nvection suggest use of the same maximum<br />
effective thickness for vapor transfer as for heat transfer, that is R' e = 0.3 in.<br />
(0.75 cm). The values of R'/L in table 3-14 are a conwmient estimate of the<br />
vapor resistance of similar fabrics.<br />
After thermal resistance and vapor resistance of the garment assembly are<br />
determined, the boundary for heat transfer with the environment may be shifted<br />
from the skin of the body to the surface of the clothing. With clothing as the<br />
boundary, Tc is substituted for Ts in all expressions for heat transfer.<br />
Ventilated Suits<br />
Suit convective heat removal is computed from the mass flow of ventilating<br />
air and the difference between inlet air temperature and the desired surface<br />
temperature (Blockley, 1964).<br />
Q = 0.24 (90- Tin)w Btu/hr (31)<br />
The cooling capacity of Apollo prototype ventilated suits as a function of<br />
gas flow at several internal suit pressures is shown in figure 3-39. The partition of<br />
cooling into sensible and latent loads is indicated. The capacity of Apollo<br />
prototype ventilated suits to handle different metabolic loads is shown in<br />
figure 3-40.<br />
Liquid-Cooled Suits<br />
For wprk loads greater than 600 BTU/hr, liquid cooling must be added.<br />
The broken line in figure 3-39 represents projected capacity for liquid<br />
cooling cascade addition to ventilated suits. Total liquid loop suits have<br />
been used to extract heat in a warm environment and heat the body in a<br />
cool environment (Burton, 1966; Lang, 1965).
Cottons<br />
Wools<br />
Nylons<br />
Rayons<br />
Glass<br />
Temperature<br />
Table 3-14<br />
Vapor Resistance of Fabrics (R'g)<br />
Wright Thickness (L) Resistance (R' 1<br />
Fabric (oz/sq yd) (cm) (cm air) R'/L<br />
Cotton net<br />
Cotton twill (3 by I in.)<br />
Cotton twill (5 by I in.]<br />
Cotton twill (2 by I in,)<br />
Cotton poplin<br />
Cotton oxford<br />
Cotton balloon cloth<br />
Cotton 'jungle cloth"<br />
(Bedford cord)<br />
Heavy cotton<br />
Close-weave cotton<br />
(Shirley L-30)<br />
Double-Face wool pile<br />
Wool twill C2 by 2 in.}<br />
Worsted serge<br />
Wool serge<br />
Spun-nylon fabric<br />
Nylon poncho cloth<br />
Five-end nylon sateen<br />
Filament nylon fabric<br />
Plain weave nylon<br />
Viscose rayon 12 by 2 in,<br />
twill (filament)<br />
Acetate rayon satin<br />
(filament]<br />
Glass fabric<br />
Plain weave glass fabric<br />
(After Blockley et al., 1954)<br />
4.4<br />
8,2<br />
8.8<br />
4,4<br />
5.8<br />
6 7<br />
2,2<br />
15.6<br />
13.5<br />
22<br />
I0<br />
9.8<br />
6,1<br />
I0,7<br />
4,9<br />
1,5<br />
2,3<br />
2,0<br />
2.6<br />
3.6<br />
2,7<br />
3.3<br />
6.6<br />
0. I00<br />
0,097<br />
0. I12<br />
0.069<br />
0.039<br />
0,081<br />
0,015<br />
0. I07<br />
0,076<br />
0.051<br />
I.I<br />
0.173<br />
O. 056<br />
O. 130<br />
0,046<br />
0.018<br />
0.016<br />
0.013<br />
0,020<br />
0.025<br />
0.0_8<br />
0.013<br />
0.030<br />
0.12<br />
0.19<br />
0.24<br />
0.15<br />
0.09<br />
0.19<br />
0.0_<br />
O. 30<br />
0.28<br />
0.23<br />
I.I<br />
0.26<br />
0.12<br />
0.31<br />
0,18<br />
0.07<br />
0.05<br />
0.09<br />
0.19<br />
0.13<br />
0. t4<br />
0.12<br />
0.32<br />
1.2<br />
1.9<br />
2.1<br />
2.2<br />
2.3<br />
2.4<br />
2.6<br />
2.9<br />
5.7<br />
&.5<br />
I<br />
1.5<br />
2,1<br />
2.Z,<br />
5.9<br />
3.9<br />
5.0<br />
6.9<br />
9.5<br />
5.2<br />
7.8<br />
9.2<br />
10,5<br />
129
130<br />
16OO<br />
1400<br />
12oo<br />
looo<br />
o 800<br />
z<br />
8<br />
8 _<br />
(.9<br />
S<br />
><br />
2<br />
400<br />
20(]<br />
I-<br />
5<br />
0'3<br />
:E<br />
O<br />
er<br />
IJ.<br />
C3<br />
U,.I<br />
><br />
o<br />
Ill<br />
r_<br />
I- <<br />
UJ<br />
-r<br />
Bioastronautics Data Book<br />
SUiT INLET TEMP : _F /<br />
i /<br />
(,,Jl _:__,. // CAPACITY<br />
I<br />
2 3 4 5 6 7 8 9 tO 11 12 13 14<br />
VENTILATING GAS FLOW RATE (cfml<br />
Figure 3-39. Pressure suit ventilating gas cooling.<br />
(After Burrias et al., 1963)<br />
O RESTING PRESSURIZED AT ALTITUDE<br />
1800 r- A RESTING UNPRESSURIZED AT ALTITUDE<br />
i<br />
oWORK,NG ATALTITUOE<br />
t_ °<br />
1600 _ ..**MAx. WORK ...<br />
..*'* OUTPUT .."*<br />
1400 - °oO°° °°°oOl °<br />
I<br />
ooOe oooOO |<br />
1200- .,*" ..'* INDICATED D<br />
°*** ..*°** HEAT<br />
1000 - ...."".....-" STORAGE/<br />
D° °°° o°°_ r'1<br />
00 °" "_ J"<br />
8 _ o°* oO°°°<br />
"°" "°*° 0 0'_ L []<br />
..:_o.,':'..-" o o T<br />
] _ HEAT REMOVE° BY<br />
400 [ o °.o.° VENTILATION COOLING<br />
Fo%"o /<br />
/ AI I 1 , , t I _t ,<br />
200 400 600 800 1000 1200 1400 1600 1800<br />
METABOLIC RATE (Btu/hr)<br />
70 PSi<br />
50PS_<br />
35PSi<br />
Figure 3-40. Heat removed from an International Latex prototype Apollo suit pressurized<br />
at 3.5 psia above ambient with airflow at 15 ft 3/rain (AiResearch Manufacturing Company,<br />
Garrett Corporation, 1964)
Temperature 131<br />
If the cooling requirement for a given thermal situation is accurately<br />
known, the appropriate line in figure 3-41 gives a family of suitable inlet<br />
temperature and flow combinations to meet the requirement. The inlet<br />
temperature coordinate has a lower limit of 32°F because, for all practical<br />
purposes, pure water can exist only in liquid form above this temperature<br />
and because of the possibility of causing local frostbite. The upper limit of<br />
inlet temperature has been set at l13°F because temperatures above this are<br />
liable to burn the skin. Mass flow coordinates extend up to 150 Ib/hr<br />
because this is about the maximum flow capacity of the present suit. The<br />
suit should be capable of absolute maximum cooling rates of 1930 BTU/hr<br />
and heating rates up to 700 BTU/hr at a flow of 150 Ib/hr. If the cooling<br />
requirement is accurately known, file unit performance indicated in<br />
figure 3-41 should specify inlet temperatures to about 2°C or 3.2°F.<br />
TV<br />
110 -- ; ! i<br />
100 INLET _ i _ " _ ' " "<br />
TEMPERATURE<br />
o F<br />
!<br />
90<br />
so /<br />
70<br />
o7<br />
5O<br />
40<br />
32<br />
10 20 30 40 50 60 70 80 90 100 110 t20<br />
SUIT MASS FLOW (Ib/h¢l<br />
W<br />
7OO<br />
18(I0<br />
192,0<br />
t30 140 150<br />
Figure 3_1. Suit performance for liquid-cooled suit. (After Burton, 1966)<br />
600 Qg<br />
400<br />
-200<br />
Btu/hr<br />
0<br />
The recommended distribution of tubing in a typical water-conditioned<br />
suit for use at rest required to give no local overcooling is shown in<br />
table3-15 (Burton, 1965). Unfortunately, severe exercise may alter this<br />
distribution.<br />
Data on the latency of cooling after exercise loads recently have been<br />
gathered and are most useful for design of thermal regulators for liquid<br />
suits (Webb, 1967). Figure 342 compares the equilibrium rectal temperatures<br />
attainable at different metabolic rates.<br />
Figure 3-43 presents the shivering and sweating thresholds for subjects in<br />
Apollo prototype liquid-cooled suits. Extravehicular suits must be designed<br />
to remove at least 2000 BTU/hr 500 kcal/hr) of heat and remain within<br />
these thresholds (Lalrg, 1965).<br />
200<br />
4OO<br />
6OO<br />
8(3O<br />
1000<br />
1200<br />
1400
132 Bioastronautics Data Book<br />
Table 3-15<br />
Recommended Distribution of Tubing in Water-<br />
Conditioned Suit at Rest<br />
Region Percentage of Tubing<br />
1/2 head 0<br />
Hand 0<br />
Foot 0<br />
Forearm 9.3<br />
Arm 16.9<br />
1/2 back 10.0<br />
1/2 chest 8.8<br />
Calf 18.1<br />
Th igh 25.6<br />
Buttock 4.5<br />
1/2 abdomen 6.8<br />
(After Burton & Collier, 1965)<br />
39.0<br />
'_ 38.5<br />
Lu<br />
_ 38.0<br />
w<br />
- 37.5<br />
g<br />
37.0<br />
METABOLIC RATE IBtu/hr)<br />
400 800 1200 1600 2000 2400<br />
I= VENTILATED SUIT _230)<br />
II VENTILATED SUIT Ilso)<br />
• WATER-COOLED SUIT I 611<br />
!_ AVERAGE OF NUDE MEN (26)<br />
=e WATER-COOLED SUIT<br />
t2t3_ •<br />
WATER-COOLED SUIT<br />
.... ) /CG3._<br />
i I<br />
100 200 300 400 500 600<br />
METABOLIC RATE (kcal/hrl<br />
400 800 1200 t600 2000 2400<br />
METABOLIC RATE (Btu/hr)<br />
Figure 342. Plot of rectal temperatures at equilibrium (energy balance) vs work level,<br />
incorporating data from many sources. (:_naded area is an envelope of data from five<br />
sources.)(Webb, 1964; after Webb & Annis, 1965)<br />
-102<br />
-101<br />
-100<br />
'99<br />
u.<br />
o<br />
2<br />
,¢<br />
uJ<br />
)-<br />
#<br />
=E<br />
==<br />
.J<br />
O<br />
_.u
LtJ<br />
rr"<br />
p-<br />
tr<br />
LU<br />
Ct.<br />
LtJ<br />
Z<br />
V<br />
Z<br />
9O<br />
85 __._O#s _<br />
Temperature 133<br />
75 I I I<br />
100 200 300 400 500<br />
METABOLIC LOAD (Btu/hr)<br />
Figure 3-43. Comfort thresholds of sweating and shivering in prototype<br />
liquid-cooled Apollo suit. (After Lang & Syversen, 1965)<br />
Conductive Heat Transfer<br />
Liquid cooling garments require that physiological constraints to conductive<br />
cooling modes be quantifiably identified. These constraints include sensitivity to<br />
thermal and pressure gradients on the skin surface, tube to skin contact resistance,<br />
skin resistance, temperature ranges (for comfort) of body parts, and the effects of<br />
hair and perspiration on conductive exchange.<br />
Unfortunately, the liquid-cooled space suit is worn under exercise conditions<br />
wherc skin comfort temperatures, thermal conductanccs to deeper subcutaneous<br />
structures, and similar factors arc quite different from the resting conditions<br />
(Webb, 1966). The characteristics of the skin in thermal comfort cannot be used<br />
under the unusual environmental condition of exercise in a liquid-cooled suit.<br />
Specific data are needed on the determinants of skin comfort under such<br />
conditions. Figure 3-43 is a good example of the type of data needed.<br />
To determine heat conduction in the steady state, the following equation may<br />
be used :<br />
k<br />
Qk/A = -_ (T 1 - T2) (32)<br />
In the resting condition, the thermal constant for conducting heat from the interior<br />
of the body to the skin (tissue conductance only) is:<br />
k = 1.5 +0.3 x 10 -3 kcal/cm-sec-°C (at 23 ° to 25°C ambient)
] 34 Bioastronautics Data Book<br />
At full vasoconstriction, when tissue conductance is 9 to 10 kcal/sq m-hr-°C, the<br />
value for conductance corresponds to a tissue layer 1.8 to 2.2 cm thick. At the<br />
limit of vasodilation, thermal conductance is increased to values of 28 to<br />
30 kcal/sq m-hr-°C. Although values above and below these hmits have been<br />
reported in the literature, many of the subjects may have become acclimated by<br />
the tests and, accordingly, their values of conductance would exceed the norm.<br />
A change from full vasoconstriction to full vasodilation lowers thermal resistance<br />
of the body approximately the equivalent of 1 Clo unit.<br />
Equivalent thermal conductance between adjacent radial layers of head,<br />
trunk, and extremities has recently been suggested. Assuming the thermal<br />
conductivity of tissue of 36 kcal-cm/sq m-hr-°C, physiologically effective masses<br />
and heat capacitance of different body compartments atso have been calculated.<br />
The effectiveness of vascular convective heat transport can be measured<br />
quantitatively by deriving values of thermal conductance for the peripheral<br />
tissues of the body (Stolwijk, 1966). Cardiovascular changes, such as shunting<br />
during exercise, considerably complicate such calculations and, unfortunately,<br />
are key factors in operational situations.<br />
In general, it can be concluded that as a physical thermal transfer system,<br />
conductive coohng can he adequate to maintain essential thermal equilibrium. It<br />
is essential, however, that the heat exchanger in contact with the skin operate at<br />
high enough temperatures to preclude vasoconstriction and guarantee adequate<br />
transfer of heat from the deep core to the skin to the heat exchanger. Current<br />
designs are not adequate to maintain man in the comfort zone during exercise at<br />
high metabolic rates.<br />
GLOSSARY<br />
Nomenclature<br />
Symbol Definition BE Units<br />
A area sq ft<br />
A b surface area of body sq ft<br />
A surface area of clothed body sq ft<br />
c<br />
A r radiating area of body sq ft<br />
A area of wall sq ft<br />
w<br />
C wetted area/A b<br />
Cp specific heat at constant pressure Btu/Ib°F<br />
D diameter or significant dimension ft<br />
D v vapor diffusivity sq ft/hr<br />
E r evaporative water loss Ib/sq ft<br />
E m metabolism Btu/hr
Sy mbo I<br />
Few<br />
g<br />
G<br />
h c<br />
hD<br />
h r<br />
hrb<br />
hfg<br />
k<br />
L<br />
H<br />
P<br />
Po<br />
P<br />
Pa<br />
Ps<br />
Qc<br />
Qe<br />
Qg<br />
_am<br />
Qr<br />
Qs<br />
_sr<br />
Qk<br />
_v<br />
q<br />
R<br />
R .= _/h<br />
g g<br />
R'<br />
R _<br />
g<br />
T<br />
T a<br />
T b<br />
TE<br />
Definition<br />
Tcmpcrature<br />
shape-emissivity factor<br />
fraction of earth gravity<br />
mass velocity C_V)<br />
convection heat transfer coefficient<br />
mass transfer coefficient<br />
radiation heat transfer coefficient<br />
radiant conductance (b}ackbody)<br />
heat of vaporization<br />
thermal conductivity<br />
thickness<br />
molecular weight<br />
atmospheric pressure<br />
standard barometric pressure<br />
water vapor pressure<br />
atmospheric water vapor pressure<br />
water vapor pressure at the skin<br />
convection heat transfer<br />
evaporation heat transfer<br />
garment cooling<br />
metabolic heal<br />
radiation heat transfer<br />
storage rate<br />
solar heat transfer to man<br />
conductive heat transfer<br />
respiratory heat transfer<br />
rata} heat transfer<br />
Gas constant<br />
thermal resistance of clothing<br />
vapor resistance in terms of the<br />
equivalent thickness of still air<br />
clothing vapor resistance<br />
temperature<br />
atmospheric temperature<br />
weighted mean body temperature<br />
effective temperature<br />
BE Units<br />
dimensionless<br />
lb/sq ft-hr<br />
Btu/sq ft-hr-°F<br />
ft/hr<br />
Btu/sq ft-hr-°F<br />
Btu/sq ft-hr- °F<br />
Btu/lb<br />
Btu/ft-hr- °F<br />
ft<br />
Btu/hr<br />
psia<br />
psia<br />
psla<br />
psia<br />
psia<br />
Btu/hr<br />
Btu/hr<br />
8tu/hr<br />
Btu/hr<br />
Btu/hr<br />
8tu/hr<br />
Btu/hr<br />
Btu/hr<br />
Btu/hr<br />
ft-lb/lb -°R<br />
s__q.ft-°F<br />
Btu<br />
ft still air<br />
ft still a_r<br />
oR<br />
oR<br />
oR<br />
o F<br />
135
136<br />
Sy rnbo I<br />
T r<br />
T s<br />
T c<br />
T o<br />
T v<br />
T<br />
or<br />
T w<br />
Tf<br />
tl<br />
U<br />
V<br />
w<br />
W<br />
o<br />
£<br />
c<br />
8<br />
e<br />
t<br />
o<br />
Definition<br />
Bioastronautics Data Book<br />
clothing surface temperature<br />
operative temperature<br />
reference operative temperature<br />
recta| temperature<br />
._eighted body skin temperature<br />
garment ventilating temperature<br />
average wall temperature<br />
film temperature<br />
internal energy per unit mass<br />
overall heat transfer coefficient<br />
velocity<br />
respiration rate<br />
mass flow rate<br />
work rate<br />
GREEK SYMBOLS<br />
solar absorptivity of skin or garments<br />
emissivity<br />
emissivity of clothing<br />
emissivity of wall<br />
time of exposure<br />
tolerance time<br />
viscosity<br />
density<br />
Stefan-Boltzman constant<br />
DIMENSIONLESS GROUPS OR NUMBERS<br />
h D<br />
Nu c k<br />
C<br />
Pr --P-k<br />
Nusselt number<br />
Prandt I number<br />
Re ,VD Reynold number<br />
Sc PD Schmidt number<br />
v<br />
BE Units<br />
o F<br />
o R<br />
o F<br />
o R<br />
o F<br />
o F<br />
o R<br />
o R<br />
Btu/Ib<br />
Btu/hr-sq-fL-eF<br />
ft/hr or ft/min<br />
]iters/hr<br />
lb/hr<br />
Btu/hr<br />
dimensionless<br />
dimensionless<br />
dimensionless<br />
min or hr<br />
min or hr<br />
_b/ft-hr<br />
Ib/cu ft<br />
0.1714 X I0 "s
Temperature i 3 7<br />
References<br />
AiResearch Manufacturing Co. Extravehicular suit thermal and atmospheric control,<br />
SS-3056, Los Angeles, 1964.<br />
American Society of Hcating, Refrigerating and Air-Conditioning Engineers, ASHRAEgaide<br />
and data book for 1965-66. New York, 1965.<br />
Barnett, P. Field tests of two anti-exposure a_semblies. AAI,-TI)R-61-56, Arctic<br />
Aeromedical Lab., Fort Wainwright, Alaska, 1962.<br />
Beckman, E. L., & Reeves, E. Physiological implications asto survival from immersion in 75 °<br />
water. Aerospace Medicine, 1966, 37, 1136-1142.<br />
Behnke, A. R., Yaglou, C.P. Physiological responses of men to chilling in ice water and to slow<br />
and fa st rewarming. Journal of Applied Physiology, 1951,3,591-602.<br />
Belding, If. S., & Hatch, T.F. Index for evaluating heat ,stress in terms of resulting physiologic<br />
strains. Heating, Piping and Air Conditioning, 1955,27,129-136.<br />
Benzinger, T. It. The diminution of thermoregulatory sweating during cold-reception at the<br />
skin. Proceedings of the National Academy of Sciences, 1961,47, 1683-1688.<br />
Benzinger, T. H., Kitzinger, C., & Pratt, A.W. The human thermostat. In J. D. Hardy (Ed.),<br />
Temperature, its measurement and control in science and industry. Vol. 3. Biology and<br />
Medicine, New York: Reinhold, 1963.<br />
Berenson, P.J. General analysis of human thermal comfort. Rep. SS-3245, AiResearch Mfg.<br />
Co., Division of Garrett Corporation, Los Angeles, Calif., January 1965.<br />
Berenson, P.J. Prediction of human thermal comfort in oxygen-nitrogen atmospheres. In P.<br />
ttorowitz (Ed.), Physiological and performance determinants in manned space systems.<br />
Vol. 5. American Astronautical Society. Baltimore, 1965.<br />
Berenson, P. J., & Green, F. H. Human thermal comfort in helium-oxygen atmosphere. Rep.<br />
LS-149, AiResearch Mfg. Co., Division of Garrctt Corporation, Los Angeles, Calif., May<br />
1965.<br />
Blockley, W. V. Changes in the boundary between neutral and stressful thermal conditions<br />
caused by respiratory protective equipment. Final report, Webb Associates, Yellow<br />
Springs, Ohio, 1964.<br />
Blockley, W. V. }tuman .sweat response to activity and environment in the compen_ble zone<br />
of thermal stress: A systematic study. NASA-CR-65260, 1965.<br />
Blockley, W. V. Temperature. In P. Webb (Ed.), Bioastronautics data hook. NASA-SP-3006,<br />
1964.<br />
Blockley, W. V., McCutchan, J. W., & Taylor, C. L. Prediction of human tolerance for heat in<br />
aircraft: A design guide. WADC-TR-53-346, May 1954.<br />
Blockley, W. V., & Taylor, C. L. Studies of human tolerance for e;'treme heat. First summary<br />
report, Memo Rep. No. 696-113A, Air Materiel Command, _¢right-Patter_n AFB, Ohio,<br />
1948.<br />
Bonura, M. S., & Nelson, W.G. Engineering criteria for spacecraft cabin atmosphere selection.<br />
NASA-CR-891, September 1967.<br />
Brebner, D. F., Kerslake, D. McK., Waddell, J. L. Diffusion of water vapor through human<br />
sk in.Journal of Physiology , 1956, 132,225-231.<br />
Breeze, R. K. Space vehicle environmental control requirements based on equipment and<br />
_hysiological criteria. ASD-TR-61-161(Pt. 1), Aeronautical Systems Division, Wrightatterson<br />
AFB, Ohio, 1961.<br />
Bryan, A. C. Breathing. In P. Webb (Ed.), Bioastronautics data book. NASA-SP-3006, 1964.<br />
Buettner, K. Effects of extreme heat and cold on human skin. I!1. Penetratingflash.Journal of<br />
Applied Physiology , 1952, 5,207-220.<br />
Buettncr, K. Thermal aspects of travel in the aeropause problems of thermal radiation. In C. S.<br />
White & O. O. Bcnson, Jr. (Eds.), Physics and medicine of the upper atmosphere.<br />
Albuquerque: University of New Mexico Press, 1952.<br />
Bullard, R.W. Sweating: Its rapid response to muscular work.Science, 1963, 141,643-646.<br />
Bullard, R. W. Temperature regulation. In E. E. Selkurt (Ed.), Physiology. Boston: Little,<br />
Brown & Co., 1963.<br />
Burriss, W. L., Wortz, E. C., Belton, J. J., et al. Internal thermal environment management<br />
program. SS-847, Rev. 2, AiResearch Mfg. Co., Los Angeles, September 1963.<br />
Burton, A.C. Clothing and heat exchanges, b_deral Proceedings, 1946, 5,344-351.<br />
487-85B 0 73 - I0
138 Bioaslronautics Data Book<br />
Burton, D. R. Performance of water conditioned suits. Aerospace Medicine, 1966, 37,<br />
500 -504.<br />
Burton, D. R., & Collier, L. Performance of water conditioned suits. RAE-TR-65004, Royal<br />
Aircraft Establishment, Farnborongh, England, 1965.<br />
Busby, D. E. Clinical space medicine. NASA-CR-856,July 1967.<br />
Bu_irk, E. R., & Bass, D.E. Climate and cxerci_. QREC-EP-61, Quartermaster Research and<br />
Engineering Center, Natick, Mass., 1957.<br />
Clark, R. E. The limiting hand ,'skin temperature for unaffected manual performance in the<br />
coM. Journal of Applied Psychology, 1961,45,193-194.<br />
Clark, R. E., Cohen, A. Manual performance as a function of rate of change in hand skin<br />
temperature. Journal of Applied Physiology, 1960,15,496-498.<br />
Clifford, J., Kcrslake, D. McK., & Waddell, J. L. The effect of wind speed oll maximum<br />
evaporative capacity in man.Journal of Physiology, 1959, 147,253-259.<br />
Damato, M. J., Radliff, M. It. Evaluation of divers' wet suit as considered for use by pilots of<br />
helicopters and fixed-wing aircraft. Naval Air Engineering Center, Air Crew Equipment<br />
Lab., Philadelphia, Pa. Paper presented at the 351h Amlual Meeting, Aerospace Medical<br />
As_ciation, Miami Beach, Fla., May 11-14, 1964.<br />
Davis, T. R. A. Acclimatization to coM in man. In J.D. ltardy (Ed.) Temperature: its<br />
measurement and control in science and industry. Vol.3. Biology and Medicine. New York :<br />
Reinhold, 1963.<br />
Dunham, W., Holling, H.E., Ladell, W.S., et al. The effects of air movements in severe heat.<br />
RNP-16/316, Royal Naval Personnel Rcsearch Committee, Medical Re,arch Council,<br />
London, 1946.<br />
l)u_k, E. R. Effect of temperature on manual performance. In F.R. Fisher(Ed.),Protection<br />
and functioning of the hands in coM climates. Washington, D.C.: National Academy of<br />
Sciences, National Research Council, 1957.<br />
Eckert, E. R. G., & Drake, R. M., Jr. Ileal and mass transfer. New York: McGraw-ltill, 1959.<br />
Eichna, L. W., Park, C. R., Nel_n, N., et al. Thermal regulation during acclimatization in a<br />
hot, dry' (desert type) environment. American Journal of Physiology, 1950,163,585-597.<br />
Epper_n, W. I,., Quiglcy, D. G., Robertson, W. G. Observations on man in an oxygen-helium<br />
environment at 380 mm Hg total pre_urc, ill. Ileal exchange. Aerospace Medicine, 1966,<br />
37,457-462.<br />
Fahnestock, M. K., Boys, F. E., Sargent 1I, F., Spring, W. E., & Slier, L. D. Comfort and<br />
hysiological responses to work in an environment of 75OF and 45% relative humidity.<br />
urnal of American Society of Ileating, Refrigerating and Air Conditioning Engineers,<br />
Inc., 1963, 5(3), 25-35.<br />
Fanger, P. O., Nevins, R. G., & McNall, P. E. Predicted and measured heat losses and thermal<br />
comfort conditions for human beings. In Thermal problems in biotechnology. New York:<br />
American Society of Mechanical Engineers, 1968.<br />
Fox, R. It., Goldsmith, R., Hampton, I. F. G., ct al. The nature of the increase in sweating<br />
capacity prtMuced by heat acclimatization.Journal of Physiology, 1964,171,368-376.<br />
Gagge, A.P. Comfort : New concepts and applications. Building Research, 1966, 3.<br />
Gaydos, II. F., Dusek, E. R. Effects of localized hand cooling verstLs total body cooling on<br />
manual performance.Journal of Applied Physiology, 1958,12,377-380.<br />
Gillies, J. A. (Ed.)A textbook of aviation physiology. Edinburgh, Scotland: Pergamon Press,<br />
1965.<br />
Goldman, R. F., Green, E. B., lampietro, P. F. Tolerance of hot, wet environments by resting<br />
men. Journal of Applied Physiology, 1965,20,271-277.<br />
Guibert, A., & Taylor, C. L. The radiation area of the human body. AF-TR-6706, Wright Air<br />
Dcvelopment Center, Wright-Patterson AFB, Ohio, 1951. (Also in Journal of Applied<br />
Physiology, 1952, 5( 1 ), 24-37.)<br />
lime, F. C., Westland, R. A., Taylor, C. L. Barometric and vapor pressure influences on insensible<br />
weight loss. Journal of Applied Physiology, 1958,12( l ), 20-28.<br />
Hall, J. F., Jr., Polte, J. W., Kelley, R. L., el al. C,ooling of clothed subjects immersed in cold<br />
water. WADC-TR-53-323, Wright Air Development Center, Wright-Patterson AFB, Ohio,<br />
April 1953.<br />
Hanifan, D. T., Blocklcy, W. V., MitcheU, M. B., et al. Physiological and psychological effects<br />
of overloading fallout shelters. Dunlap As_ciates, Inc., Santa Monica, Calif., April 1963.
Temperature 139<br />
Hardy, J. D. (Ed.) Thephysiologicai problems in space exploration. Springfield, I11.: Charles C.<br />
Thomas, 1954.<br />
Hertzman, A. B., Randall, W. C., Peis, C. N., et al. The regional rates of evaporation from the<br />
skin. AF-TR-6680, Part 2. Aero-Medical Lab., Wright-Patter_n AFB, Ohio, 1951.<br />
llertzman, A. B., Randall, W. C., Peis, C. N., et al. The regional rates of evaporation from skin<br />
at various environmental temperatures. Journal of Applied Physiology, 1952, 5(4),<br />
153-161.<br />
Horvath, S. M., & Freedman, A. The influence of cold upon the efficiency of man.Journal of<br />
Aviation Medicine, 1947,18,158-164.<br />
Horvath, S. M., Shelley, W. B. Acclimatization to extreme heat and its effect on ability to<br />
work in less severe environments. American Journal of Physiology, 1946,146,336-343.<br />
Iampietro, P. F., Bass, D. E., & Bushkirk, E. R. Heat exchanges of nude men in the cold.<br />
Journal of Applied Physiology, 1958,12, 351-356.<br />
Kaufman, W. C., Swan, A. G., & Davis, H. T. Skin temperature responses to simulated thermonuclear<br />
flash. ASD-TR-61-510, Aeronautical Systems Divi_on, Wright-Patterson AFB,<br />
Ohio, 1961.<br />
Kerslake, D. McK. Errors arising from the me of mean heat exchange coefficients in the calculation<br />
of the heat exchanges of a cylindrical body in a transverse wind. In J. D. Hardy (Ed.),<br />
Temperature. Vol. 3. Biology and Medicine. New York: Reinhold, 1963.<br />
Kerslakc, D. McK. The physiological requirements for environmental comfort in terms of the<br />
microdimate. Presented at the Full Pressure Suit Symposium, 1962.<br />
Kerslake, D. McK. An estimate of the preferred skirl temperature distribution in marl.<br />
FPRC-Memo-213, RAF Flying Personnel Res. Comm., Farnborongh, England, 1964.<br />
Kisscn, A. T., Hall, J. F. Physiologic response to transient heat stress in reflective versus<br />
non-reflective clothing. AMRL-TDR-63-79, Aerospace Medical Research l,abs., Wright-<br />
Patter_n AFB, Ohio, August 1963.<br />
Krantz, P. Calculating human comfort. Journal of American Society of Heating, Refrigerating<br />
and Air Conditioning Engineers, Inc., 1964, 6, 68-77.<br />
Lang, R., & Syversen, R. G. Factors affecting the thermal equilibrium of a EMU subject in the<br />
Apollo. In Proceedings of the Second Space Congress, Cocoa Beach, Fla., April 5-7, 1965.<br />
LeBlanc, J. S. Impairment of manual dexterity in the coM. Journal of Applied Physiology,<br />
1956, 9, 62-64.<br />
Lind, A. R., & Bass, D. E. Optimal exposure time for development of acclimatization to heat.<br />
Federal Proceedings, 1963, 22(3), 704-708.<br />
Mackworth, N. H. Effects of heat on wireless telegraphy operators hearing and recording<br />
Morse messages. British Journal of Industrial Medicine, 1946, 3, 143-158.<br />
MacPherson, R. K. The assessment of the thermal environment. British Journal oflndustriM<br />
Medicine, 1962,19,151-164.<br />
MacPherson, R. K. Physiological responses to hot environments. MRC-SRS-298, Medical<br />
Research Council, Her Majesty's Stationery Office, London, 1960.<br />
McAdams, W. H.Heattransmission. New York: McGraw-Hill, 1954.<br />
McCance, R. A., Ungley, C. C., Crossfill, J. W. L., et al. The hazards to men in ships lost at sea,<br />
1940-1944. MRC-SR-291, Medical Research Council, Her Majesty's Stationery Office,<br />
London, 1956.<br />
McCutchan, J. W., & Taylor_ C. L. Respiratory heat exchange with varying temperature and<br />
humidity of inspired air. Journal of Applied Physiology, 1951,4,121-135.<br />
Milan, F. A. Cold water tests of USAF anti-exposure suits. Arctic Aeromedical Lab.,<br />
TR-64-31, Fort Wainwright, Alaska, 1965.<br />
Mills, A.W. Tactile sensitivity in the cold. In F. R. Fisher(Ed.)Protectionandfunctioningof<br />
the hands in coM climates. Washington, D.C.: NAS-NRC, 1957.<br />
Molnar, G. W. Survival of hypothermia by men immer_d in the ocean. Journal of the<br />
American Medical Association, 1964,131,1046-1050.<br />
Nelson, N., Eichna, L. W., Horvath, Sm. M., et al. Thermal exchanges of man at high<br />
temperatures.Journalof American Physiology, 1947,151,627-652.<br />
Newburgh, L. H. (Ed.) Physiology of heat regulation and the science of clothing. Philadelphia:<br />
W. B. Saunders, 1949.
140 Bioastronautics Data Book<br />
Parker, F. A., Ekberg, D. A., Withey, D. J., et al. Atmosphere selection and control for manned<br />
space stations. General Electric Co., Missile and Space Division, Valley Forge, Pa.,<br />
presented at the International Symposium for Manned Space Stations, Munich, September<br />
1965.<br />
Pepler, R. D. Extreme warmth and sensorimotor coordination. Journal of Applied Physiology,<br />
1959, 14,383-386.<br />
Pitts, G. C., Johnson, R. E., & Consolazio, F. C. Work in heat as affected by intake of water,<br />
salt, and gtuco_. American JournalofPhysiology, 1944, 142(2), 253-259.<br />
Pfleidere, It., & Buettner, K. Bioklimatologie, Lehrbuch d. Baeder und Klimaheilkunde.<br />
Berlin: Julius, Springs, 1940.<br />
Randall, W. C., & Itertzman, A. B. Dermatornal recruitment of sweating. Journal of Applied<br />
Physiology, 1953,5,399-409.<br />
Robinson, S. Circulatory adjustments of men in hot environments. Temperature, its measurementand<br />
control in science and industry. Vol. 3. New York: Reinhold, 1963.<br />
Robinson, S., Turrell, E. S., Beiding, H., ct al. Rapid acclimatization to work in hot climates.<br />
American Journal of Physiology, 1943, 140,168-176.<br />
Roth, E. M. Bioenergetics of space suits for lutrar exploration. NASA-SP-84, 1966.<br />
Roth, E. M. Space-cabin atmospheres, Part IV. Engineering trade-offs of one-versus-two gas<br />
systems. N ASA-AP-118,1967.<br />
Roth, E. M. (Ed.) Compendium of human responses to the aerospace environment.<br />
NASA-CR-1205, National Aeronautics and Space Adnfinistration, Washington, D.C.,<br />
1968.<br />
Sanders Nuclear Corp. Technical proposal for a radioisotope fueled diving suit heating system<br />
(U). Sanders-Prop-86 ttX, Nashua, New Hampshire, 1966.<br />
Secord, T. C., & Bonura, M. S. Life support systems data from sixty-two days of testing in a<br />
manned space laboratory simulator. In AIAA Fourth Manned Space Flight Meeting, St.<br />
Louis, Mo., October 1965, American Institute of Aeronautics and Astronautics, New<br />
York, 1965.<br />
Siple, P. A., Passel, C. F. Measurements of dry atmospheric cooling in subfreezing tcmperat<br />
nres. Proceedings of the American Philosophical Society, 1945,89,177-199.<br />
Smith, F. E. Indices of heat stress. MRC-Memo-29, Medical Research Council, tter Majesty's<br />
Stationery House, London, 1955.<br />
Smith, G. B., Jr., tlames, E. F. Estimation of tolerance times for cold water immcrsion.<br />
Aerospace Medicine, 1962,33(7), 834-840.<br />
Spcctor, W. S. (Ed.)llandbook ofbiologioaldata. WADC-TR-56-273, Wright Air I_velopment<br />
Center, Wright-Patterson AFB, Ohio, 1956.<br />
Stolt, A. M. The role of the skin in heat transfer. American Society of Mechanical Engineers<br />
Paper 59-A-138. Journal of tteat Transfer, American Society of Mechanical Engiaeers,<br />
Trans. Sec. C, 1960, 82,239-241.<br />
Stoll, A. M., Greene, L.C. Relationship between pain and tissue damage due to thermal radiation.Journal<br />
of Applied Physiology, 1959,14(3), 373-382.<br />
Stolwijk, J. A. J., tlardy, J. D. Temperature regulation in man -- A theoretical study. Pflugers<br />
Archives, 1966, 291,129-162.<br />
Strydom, N. B., Wyndham, C. tl. Natural state of heat acclimatization of different ethnic<br />
groups. Federal Proceedings, 1963, 22(3), 801-809.<br />
Taylor, C. L., & Buettncr, K. The evaporative effect on humanpcrspiration. WADC-TR-<br />
53-345, Wright Air Development Center, Wright-Patterson AFB, Ohio, 1953.<br />
Tcichner, W. [I., Kobrick, J. L. Effects of prolonged exposure to low temperature on visual<br />
motor performance, flicker fusion and pain sensitivity. Tech. Rep. EPD 230,<br />
Quartermaster Research and Development Center, Natick, Mass., 1954.<br />
Teichner, W. H. Manual dexterity in the cold. Journal of Applied Physiology, 1957, 11,<br />
333-338.<br />
Teichner, W. II. Reaction time in ttw cold.Journal of Applied Physiology, 1958,42,54-,59.<br />
Tcichncr, W. It. Temperature, humidity, and ventilation (preliminary draft). Gnggenheim<br />
Center for Aviation Health and Safety, llarvard School of Pubhc Health, Boston, Mass.,<br />
1961.<br />
Thompsou Ramo Wooldridgc, Inc. Propellant-atmosphere study. W-ADD-TR-60-622, March<br />
1961. (AD-268768)
Temperat tire 141<br />
Trumbull, R. Environmental modification for human performance. ONR-ACR-I05-11,<br />
Office of Naval Research, Washington, D.C., 1965. Submarine Medical Practice,<br />
NAVMED-P-5054. Bureau of Medicine and Surgery. Government Printing Office,<br />
Washington, D.C., 1956.<br />
United States Navy. Medical Newsletter 31: 12, 1958.<br />
Waligora, J. M., & Michel, E. L. Application of conductive cooling for working men in a<br />
thermally isolated environment, (abstract). Aerospace Medicine, 1966, 37,306.<br />
Weaver, J, A. Calculation of time-temperature histories and prediction of injury to skin exposed<br />
to thermal radiation. NADC-MR-6623, Naval Air Development Center, Warminster,<br />
Pa., June 1967.<br />
Webb, P. Pain limited heat exposures. In J. D. Hardy (Ed.) Temperature, its measurement and<br />
control in science and industry. Vol. 3. Biology and Medicine, New York: Reinhold Publishing<br />
Co., 1963.<br />
Webb, P. (Ed.)Bioastronauticsdata book. NASA-SP-3006, Washington, D.C., 1964.<br />
Webb, P. Human water exchange in space suits and capsules. NASA-CR-804, National Aeronautics<br />
and Space Administration, Washington, D.C., 1967.<br />
Webb, P. Heat loss from the respiratory tract in cold project no. 7-7951. Rept. 3, Arctic<br />
Aeromedical Lab., Ladd AFB, Alaska, April 1955.<br />
Webb, P., & Annis, J.F. Bio-thermal responses to varied work programs in men kept thermally<br />
neutral by water cooled clothing. NASA-CR-739,1966.<br />
Webb, P., Garlington, L. N., & Schwarz, M.J. Insensible weight loss at high skin temperatures.<br />
Journal of Applied Physiology, 1957, 11,4144.<br />
Welch, B. E. Chief, Environmental Systems Branch, USAF School of Aerospace Medicine,<br />
Aerospace Medical Div., Air Force Systems Command, Brooks AFB, Texas, personal communication,<br />
March 1966.<br />
Winslow, C. -E. A., Herrington, L. P., & Gagge, A. P. Physiological reactions of the human<br />
body to varying environmental temperatures.Journal of American Physiology, 1937,120,<br />
1-22.<br />
Winsiow, C. -E. A., Herrington, L. P., & Gaggc, A. P. Reactions between atmospheric conditions,<br />
physiological reactions and sensation of pleasantness. Journal of American<br />
Hygiene, 1937,26,103-115.<br />
Wortz, E. C., Diaz, R. A., Green, F. H., et al. Reduced barometric pressure and respiratory<br />
water loss. SAM-TR-66-4, School of Aerospace Medicine, Brooks AFB, Texas, 1966.<br />
Wortz, E. C., Edwards, D. K., Ill, Diaz, R. A., ct at. Study of heat balance in full pressure suits.<br />
Aerospace Medicine, 1967,38, 181-188.<br />
Wyndham, C. H., Bouwer, W., Devine, M. G., et al. Examination ofl/se of heat exchange equations<br />
for determining changes in body temperature. Journal of Applied Physioiogy, 1952,<br />
5,299-307.<br />
Wyndham, C. H., Strydom, N. B., Morrison, J. F., et al. Responses of unacclimatized men<br />
under stress of heat and work. Journal of Applied Physiology, 1954, 6, 681-686.<br />
Zollner, G., Thauer, R., Kaufmann, W. Der insensible gewichtsverlust als funktion der<br />
umweltbedingungen. Die Abhangigkeit der Hautwasserabgabe yon der Hauttemperatur bei<br />
Verschiedenen Temperaturen und Wasserdampfdrucken tier umgebenden Luft.Arch. Ges.<br />
Physiology, 1955,260,261-273.<br />
Selected and Recent Books<br />
Fang er, P. O. Calculation of thermal comfort: Introduction of a basic comfort equation.<br />
l'ransactions of the American Society of Heating, Refrigerating and Air Conditioning Engineers,<br />
Inc., 1967, Vol. 73, Part !1I.<br />
Fourt, L., & Hollies, N. R. S. The comfort and function of clothing. Technical report<br />
69-74-CE, U.S. Army Natick Laboratories, Natick, Mass.,June 1969.<br />
Gagge, A.P. Man, his environment, his comfort, tleating, Piping and Air Conditioning, 1969,<br />
2O9-224.<br />
Gagge, A. P., Stoiwijk, J. A. J., & Hardy, J. D. Comfort and thermal sensations and associated<br />
physiological responses at various ambient temperatures. Environmental Research, 1967,<br />
l(1), 1-20.<br />
Gagge, A. P., Stolwijk, J. A. J., & Nisbi, Y. The prediction of thermal comfort when thermal<br />
equilibrium is maintained by sweating. American Society of Heating, Refrigerating and Air<br />
Conditioning Engineers, Inc. Paper number 2116, 1969.<br />
Gagge, A. P., Stolwijk, J. A. J., & Nishi, Y. An effective temperature scale based on a simple<br />
model of human physiological regulatory response. Paper presented at American Society<br />
of Heating, Refrigerating and Air Conditioning Engineers, Inc. semiannual meeting,<br />
Philadelphia, January 1971.
142 Bioastronauties Data Book<br />
APPENDIX<br />
A TWO-NODE Model of Human Temperature Regulation in FORTRAN<br />
by A. P. Gagge<br />
The following is an Annoted FORTRAN Program which includes the most<br />
recent concepts of the regulation of body temperature during rest and exercise<br />
and during the transient and steady states. The general principles described arc<br />
presented in NASA Report CR-1855, A Mathematical Model of Physiological<br />
Temperature Regulation in Man by J. A. J. Stolwijk (1971). The present model<br />
(A. P. Gagge, J. A. J. Stoiwijk and Y. Nishi, ASHRAE TRANSACTIONS, Vol.<br />
77, Part I, 1971) is a simplified version, which considers the control of body<br />
temperature to be accomplished primarily by the mean skin temperature and a<br />
central core temperature; the latter may be measured either in the rectum or in<br />
the esophagus. The present model also includes an analysis of the seven<br />
independent environmental factors necessary to make a complete partition of<br />
the heat exchange. Definitions are indicated for the new Effective Temperature<br />
(ET*) of the American Society of Heating, Refrigerating and Air-Conditioning<br />
Engineers, as well as the new Standard Effective Temperature (SET*), by which<br />
it is possible to compare on a commonly experienced temperature scale the<br />
expected physiological heat stress caused by use of clothing, by radiant heat, by<br />
air movement and by barometric pressure. Modifications of the model for water<br />
immersion are also indicated.<br />
The independent variables are:<br />
MR = metabolic rate in W/m 2 (REAL) 2<br />
WK work rate accomplished in W/m<br />
CLO = intrinsic clothing insulation in ol___oo units [0. 155 m 2 • C°/W_<br />
CHR = linear radiation exchange coefficient in W/_m2.UC)<br />
OHC = convective heat transfer coefficient in W/(m2.°C) at sea level<br />
and varies with both air movement (VELA) and activity (VEL) (see Nishi and Gagge, 1971)<br />
BARe = barometric pressure (ram I{g)<br />
TA = ambient air temperature °C<br />
TR = mean radiant temperature °C<br />
PPllO = ambient vapor pressure in mm Hg and may be found<br />
from Net bulb (TWET) or dew point (TDP) measurements<br />
The dependent variables are:<br />
TSK = temperature of skin shell (_ Tsk ) in °C<br />
TCR = central core temperature ( _' rectal or esophageal) in °C<br />
ALPHA = ratio of mass skin shell to mass central core (N.D.)<br />
SKBF = skln blood flow in l/(m2-hr)<br />
EV = total evaporative heat loss in W/m 2<br />
Characteristics of an Average Man<br />
70. = body weight in kg<br />
I. 8 = body surface in sq. meters<br />
0.72 = ratio of body's radiating area to total surface area<br />
5.28 = minimum skin conductance in W/(m2-°C_<br />
6.3 normal skin blood flow in I/(m2"hr)
neutrality;<br />
The assigned coefficients are<br />
1.163= specific heat of blood in W.hr/(l'°C)<br />
0.68 = latent heat of water W.hr/g<br />
0.97 = specific heat of body in W'hr/(kg'°C)<br />
Temperature 143<br />
2.2 = Lewis Relation at sea level in OC/mm Hg<br />
760. = sea level barometric pressure in mm Hg<br />
5.67E-08 = Stefan-Boltzmann Constant in W/(m 2.K °4)<br />
Initial Conditions (TIM = O) are those for physiological thermal<br />
TSK = 34.<br />
TCR = 37. (for rectal) or 36.6 (for esophageal)<br />
CHR = 5.0<br />
CTC = CHR+CHC<br />
SKBF = 6.3<br />
ALPHA= O. 1<br />
EV = 5.0<br />
For sedentary case (I met):<br />
For exercise:<br />
MR = 58.2<br />
RM = MR<br />
WK = 0<br />
CHC = 2.9<br />
wind in m/see)<br />
Initial Definitions<br />
CHC = 5.4 (bicycle ergometer at 50 RPM)<br />
CHC = 6.0 ( .... 60 RPM)<br />
CHC 6.51*VEL**0.391 (treadmill walking for VEL tn m/sec)<br />
CHC = 8.60*VEI,_*0. 531 (free walking at VFL in m/see; still air)<br />
CHC = 8.60*VEL*_O.531 • 1.96*VELA**O.86 (where VELA is a head<br />
Respired Evaporative Heat Loss (ERES} (Fanger, 1970)<br />
ERES = 0.0O23*RM*(44.-PPHG)<br />
Respired Convective Heat Loss (CRES) (Fanger, 1970)<br />
CRES = 0.0Ol2*RM*(34.-TA)<br />
Burton Clothing Efficiency Factor (FCL)<br />
I'CL = l./(1 ,_0.155*c'rc*cLO)<br />
Operative Temperature (TO)<br />
TO = (CIIR*TR_CHC*TA)/CTC<br />
The above definitions are enteJed by READ end l)O statements<br />
The Simulation Proqram for Human Temperature Regulation<br />
starts here:<br />
I00 CONTINUE<br />
Clothing Surface Temperature<br />
TCL = TO+FCL*(TSK-TO)<br />
Factor (FACL) Increases radiation area of body by 15%/clo (Fanger, 1970)<br />
FACL = I.+0.15"CLO<br />
The coefficient CHR varies with TSK or TCL during regulation<br />
CIIR = 4.*5.97E-08*((TCL+TO)/2.4273,)**3.*FACL*0.72<br />
CTC = CHR4CHC<br />
FCL = 1./(1.#0,155*CTC*CLO)<br />
DRY = CTC*FCI,*(TSK-TO)<br />
Heat Flow (HFCR) from body core to skin shell<br />
HFCR = RM-ERES-CRES-WK-(5.28+l.163*SKBF)*(TCR-TSK)<br />
Heat Flow (HFSK) from skin shell to environment at TO<br />
HFSK = (5.28+I. 163*SKBF)*(TCR-TSK)-DRY-(EV-ERES)<br />
Thermal Capacity of body core (TCCR)<br />
TCCR = 0.97*(I.-ALPIIA)*70.<br />
Thermal Capacity of skin shell (TCSK)<br />
TCSK = 0.97*ALPHA*70.<br />
Change in core temperature (DTCR) caused by HFCR<br />
DTCR= (HFCR*I.8)/TCCR
144 Bioastronautics Data Book<br />
Change in skin shell temperature caused by HFSK<br />
DTSK = (HFSK*I.B)/TGSK<br />
Iteration to simulate regulation will be at one minute intervals<br />
or by DTSK and DTCR not greater than ! O. l°C.<br />
DTlM= 1./60.<br />
U = ABS(DTSK)<br />
IF(U-0.1)5, I0, I0<br />
10 DTIM=0. I/(U*60.)<br />
S CONTINUE<br />
U=ABS(DTCR)<br />
IF{U-O. 1) 105, ll0,110<br />
110 DTIM=O. I/(U'60)<br />
105 CONTINUE<br />
TIM is In hours<br />
TIM = TIM4DTIM<br />
TSK = TSK+DTSK*DTIM<br />
TCR = TCR+DTGR*DTIM<br />
Definition of the Control Signals {SKSIG, CRSIG)<br />
from skin shell:- "cold" (COLDS); + "warm" {WARMS)<br />
SKSIG=TSK-34.0<br />
IF{SKSIG) 15,15,20<br />
15 COLDS=-SKSIG<br />
WARMS=0.0<br />
GO TO 25<br />
20 COI, DS=O. 0<br />
WARMS=SKSIG<br />
25 CONTINUE<br />
from body core: - "cold" (COLDC); + "warm" (WARMC)<br />
CRSIG-TCR-37.0<br />
IF(CRSIG) 30,30,35<br />
30 COLDC=-GRSIG<br />
WARMC=0.0<br />
GO TO 40<br />
35 WARMC=CRSIG<br />
GOLDG=0.0<br />
40 CONTINUE<br />
Control of Skin Blood Flow (STRIC-vasoconstriction; DlLAT-vasodilation)<br />
STRIC = 0.5*COLDS<br />
DILAT = i 50. *WARMC<br />
The coefficients 0.5 and 150, , which change during acclimatization, may vary<br />
+_ 50% without significantly changing resulting thermal equilibrium but they do<br />
affect time to equilibrium.<br />
SKBF = (6.3+DILAT)/{I._STRIC)<br />
Sweating is controlled both by the mean body temperature (Snellen, 1966) and the<br />
peripheral skintem_erature (Nadcl, Bullard and Stolwiik. 1971l<br />
REGSW: 25 0. _ (ALP}iA* SKSIG+ (I. -ALPHA) *CRSIG)*EXP(SKSIG/I 0.7)<br />
IF(REGSW) 45, 45, 50<br />
45 REGSW=0<br />
50 CONTINUE<br />
The evaporative heat loss caused by sweating {ERS'VV)<br />
ERSW = 0.68*REGSW<br />
The Nishi Permeation Efficiency Factor (FPCL) for clothing<br />
FPOL = 1./(1.+0.143"C11C*CLO)<br />
The Ema × of the body skin surface<br />
EMAX = 2.2*CHC*(SVP(TSK)-PPHG)*FPOL<br />
SVP Is a FUNCTION relating saturated vapor pressure to temperature T<br />
Skln wetredness due to sweating (PRSW)<br />
PRSW = ERSW/EMAX<br />
Total skin wettedness (PWET)<br />
PWET = 0.06+0.94*PRSW<br />
Skin diffusion (EDIF)<br />
EDIF=PWET* EMAX- ERSW
Total evaporative heat loss (EV)<br />
EV=ERES_ERSW+ t'DIF<br />
IF(PWET) 60,60,65<br />
65 EV=ERES+EMAX<br />
ERSW=EMAX<br />
EDIF=0.0<br />
PRSW= 1.0<br />
Unevaporated sweat (DRIP) in g/(m 2" hr)<br />
DRIP=(ERSW--EMAX)/O, 68<br />
Temperature 145<br />
60 CONTINUE<br />
Change in skin blood flow affects ALPttA causing skin shell to become thicker<br />
or thinner (Ashoff, 1956)<br />
Hyperbole used to fit (AhPtlA,SKBF) at three points (0,05,60)(0. I, 6.3) and (0.4.1.0}<br />
ALP}IA=0.044240. 3509/(SKB1"-0.01386)<br />
Protection from cold by shivering (Stolwijk and ttardy, 1967)<br />
RM=MR+19.4*COLDS*GOLDG<br />
A time of exposure (TIME) of 0.25 hr or greater should be selected<br />
Iteration now begins<br />
IF(TIM-TIME) 100,101, lOl<br />
101 CONTINUE<br />
After exposure (TIME), the following dependent variables have now been<br />
evaluated by iteration: GttR, GTG, rGL, TSK, TGR, RI:GSW, EMAX, ERSW, EDIF,<br />
EV, DRIP, PRSW, PWET, ALPHA, and a new RM, if shivering has occurred.<br />
Rate of body heat storage (STORE) in W/m 2 and rate of change.of mean body<br />
temperature (RTBM) in °C/hr at end of exposure TIME are:<br />
STORE = RM-CRES-WK-EV-DRY<br />
For any environment:<br />
RTBM = STORE*I.8/(70.*0.97)<br />
The resultant dry and humid heat transfer coefficients are<br />
A=CTC*FCL<br />
B=2.2"1.92*CHC*FPCL<br />
The linear "dew" temperature is given by<br />
TDEW-(25.3+E PHG)/1,92<br />
Operative Temperature (TO) is<br />
TO=(CHR*TR+GHC*TA)/CTC<br />
Humid Operative Temperature (TOH) at end of time (TIME) is<br />
C=A+PWET*B<br />
TO H= (A'TO +PWET* B*TD EW)/G<br />
Calculation of new ASHRAE Ffh, ctive Temperature (ET*)<br />
ET_-TOH<br />
80 DEWS={25.3+0,5*SVP(ET))/1.92<br />
TOH5=(A*ET*PWET* B*DEW5)/G<br />
ERROR=TOIt-TOH 5<br />
IF(ERROR) 70,70,75<br />
75 ET=ET+0. I<br />
TO TO B0<br />
70 CONTINUE<br />
For the Sedentary Case only, when RM=58.2 or I met:<br />
The Standard Environment is defined by<br />
GHCS=2.9<br />
GLOS=0.6<br />
CHRS-_CHR<br />
CTCS CltRS+GIIGS<br />
FPLS-I ./(1. _ 0.155*CTCS*CLOS)<br />
FPCLS- 1 ./(1 . 40. 143*CHCS+CLC)S<br />
The standard resulting dry and humid heat transfer coefficients are<br />
AS=CTCS*I'CLS<br />
BS 2,2*l.92*CIICS*FPCLS<br />
Standard Operative Temperature (STO)<br />
STO :(A/AS) * TO _ ( l -A/A SI * TSK
146 Bioaslronautics Data Book<br />
Standord tlumid Operative Temperature (S'I'()It)<br />
CS AS _PWEI'*BS<br />
STOII -{C/CS)*TOII I (l -C/CS}*TSK<br />
Calculation of Standard Effective Temperature {SET)<br />
SET-STOH<br />
90 TDEW5-(25.3 _0.5*SVP(SET)/I . 92<br />
STOH5 {AS*SlIT+ PWET* BS*TDEW5)/C S<br />
ERR_:STOH- STOttS<br />
Ir (ERR)80,80,85<br />
85 SET- SET+O. 1<br />
GO TO 90<br />
80 CONTINUE<br />
Prediction of Warm discomfort DISC (positive)<br />
DISC=4.7*PRSW<br />
Prediction of Temperature sensation (TSENS) + warm, - cold<br />
TSENS:-0. 245*SET+0.033*0.S*SVP(SET)-6.471<br />
See ASIIR,_E Handbook of Fundamentals (1972) for sensory data.<br />
Prediction of Cold DISCOMFORT (neg_tive)<br />
A TABLE function is used to rel:_te DISC to TSK:<br />
1,80128s 90129sj 30130s<br />
DISC -4.6 -4.1 -3.6 -3.1 -2.6 -2.1<br />
DISC -1 .68 -1.25 -0.95 -0.7 -0.5 -0.3<br />
The desired output statements now follow, END of Program.<br />
The above program can be used with reasonable accuracy for exercise<br />
and work. The Standard Conditions may be set at any other desired value.<br />
For environments different from sea level, the Lewis factor [ 2.2] is replaced<br />
by [2.2*760./BARe]and the sea level value for CHC by [CHC*(BARO/760.)**0,55] ,<br />
wherever they occur in the program.<br />
In a water environment CtIR - O, and CIlC vahles in range 70 - 150<br />
W/(m 2.°C) should he used. Under these<br />
conditions, the I,ewis factor [2.23is set to zero as there is no evaporation.<br />
]n Fig, A-l, the model has been u:;ed to calculate loci of constant TSENS,<br />
TSK, DISC, PWET in terms of a uniform TA and ambient vapor pressure in mm Jig.<br />
They are drawn for a sedentary normally ch0thed subject.<br />
In Fig. A-2, the model has been used to calculate lines of constant<br />
physiological strain (SET*) for the same resting subject.<br />
In Fig. A-3, the expected thermal responses of a sedentary subject to<br />
the new ET* or SET are Indicated.<br />
34.0<br />
0.0
Temperature 147<br />
50<br />
Loci of w and Tskby model<br />
LociofTSENS by KSU<br />
/.. "'.<br />
,.. -. _-._<br />
/ " ""._.9.y _ '_°<br />
_ _/,l._ .<br />
Sedentary; 0,6 clo. / "'''- K ',_4_ " -<br />
s,o ,,,,e, D, /. '-..e " ".._.<br />
_'40 Sc-',_ 7/_./"". :_, _;.°"-,(<br />
0<br />
15 20 25 30 35 40 45 50<br />
AMBIENT AIR, °C<br />
Figure A-I. Loci of constant Tsk, w, TSENS and DISC for a Standard Environment<br />
in terms of ambient vapor pressure and air temperature.<br />
6o zo so 9,o ,o2 Iq°F-_5<br />
601;el p 'STANDARD' ,' _' o/_Tdp Tdew<br />
/ EFFECT,VE TE,,,_RATO'_ ,NOE× (SeT'_ ' /
148 Bioastronau!ics Data Book<br />
ET"<br />
° C<br />
40<br />
35<br />
3O<br />
25<br />
20<br />
15<br />
I0<br />
Temperature<br />
Sensation<br />
Very hot<br />
Hot<br />
Warm<br />
Slightly warm<br />
Neutral<br />
Slightly cool<br />
Coot<br />
Cold<br />
Very cold<br />
Discomfort<br />
Limited tolerance<br />
Very uncomfortable<br />
Uncomfortable<br />
Slightly<br />
uncomfortable<br />
Comfortable<br />
Slightly<br />
uncomfortable<br />
Uncomfortable<br />
Regulation of<br />
Body Temp.<br />
Failure of<br />
free skin evap.<br />
Increasing<br />
vasodilation<br />
sweating<br />
No reg.<br />
sweating<br />
I<br />
Vasoconstriction<br />
Behavioral<br />
changes<br />
Shivering<br />
begins<br />
Health<br />
Increasing<br />
danger of<br />
heat stroke<br />
Normal<br />
health<br />
Complaints<br />
from dry mucosa<br />
Impairment<br />
peripheral<br />
circulation<br />
Figure A-3. Human thermal responses to the new Effective Temperature ET or SET. SET<br />
is the uniform ambient temperature at 50% relative humidity of an enclosure with air<br />
movement 0.15 m/see or 30 fpm in which a clothed subject (0.6 cio) would exchange the<br />
_me heat by radiation, convection, and evaporation as in the actual cnvironmen! defined by<br />
TA, TR, PPltG, CHR, CHC, and BARO.<br />
ET °<br />
o F<br />
100<br />
9O<br />
8O<br />
70<br />
6O<br />
50
CHAPTER 4<br />
SUSTAINED LINEAR ACCELERATION<br />
by<br />
T. Morris Fraser, M.Sc., M.D.<br />
University of Waterloo<br />
Waterloo, Ontario, Canada<br />
By definition, acceleration is a rate of change and can occur in any or all of<br />
three related, but differing, maneuvers. Linear acceleration is the rate of change<br />
of velocity of a mass, the direction of movement of which is kept constant.<br />
Acceleration acting on a mass will produce a force exerting a pressure on the<br />
mass and causing it to move if movable or to deform if not.<br />
Angular acceleration is the rate of change of direction of a mass, the velocity<br />
of which is kept constant. In this regard, the acceleration is directly proportional<br />
to the square of the velocity and inversely proportional to the radius of the turn.<br />
By common usage, where the axis of rotation is external to the body, as in an<br />
aircraft turn or a centrifuge, the acceleration is frequently termed "radial"<br />
acceleration, while the term "angular" is retained for situations where the axis of<br />
rotation passes through the body. Where the radius is long, the effects of radial<br />
acceleration on man approximate those of linear acceleration.<br />
In its third form, acceleration occurs as a component of the attraction<br />
between masses. The resulting force is directly proportional to the product of<br />
the masses and inversely proportional to the square of the distance between<br />
them. The proportionality constant is the gravitational constant g which<br />
represents an acceleration of 32.24 feet per second (fps) within the terrestrial<br />
field of reference. This is the accepted unit of measurement of acceleration.<br />
When a mass is acted upon by the acceleration of gravity, the resulting force,<br />
acted vectorially, represents its weight. When the acceleration is other than<br />
gravitational, it interacts with gravity, if present, to produce a resultant which<br />
effectively increases the weight of the mass in the direction of the resultant. It is<br />
this effective increase in weight which, in one form or another, is largely<br />
responsible for the physiological and other changes found in the body exposed<br />
to sustained acceleration.<br />
Reviewed by Randall M. Chambers, Ph.D., NASA Langley Research Center<br />
149
150 Bioastronautics Data Book<br />
In this regard, it must be remembered that the body is essentially a fluid<br />
system and reacts accordingly. Pascal, in the 17th century, showed that in ideal<br />
fluids at rest: (a) fluid pressure is equal in all directions, (b) pressures at points<br />
lying in the same horizontal plane are equal, and (c) pressure increases with<br />
depth under the free surface. This increase is equal to pgh dynes/cm2, where/9 is<br />
the density of the fluid, g the gravitational constant, and h the depth. The_ laws<br />
apply to the vascular system and, after a fashion, to the body as a whole.<br />
The descriptive nomenclature for acceleration used herein is tile system<br />
defined in chapter 6, Impact.<br />
Terminology for duration of acceleration depends on the fact that there is a<br />
difference in body response to accelerations of duration below and above<br />
approximately 0.2 second, related to the latent period for development of<br />
hydrostatic effects. Thus, abrupt acceleration is considered as ranging to<br />
0.2 second, while sustained acceleration is prolonged beyond 0.2 second.<br />
Subjective Effects of Sustained Acceleration<br />
In thc operational situation, it is unusual, if not impossible, for acceleration<br />
stress to occur in a simple form. One is rarely, if ever, exposed to a simple<br />
unvarying +Gz stre_s. Instead, acceleration may vary. in its resultant vector,<br />
magnitude, and type, and may be accompanied by complex oscillations and<br />
vibrations. For purposes of analysis, however, it is simpler to consider the<br />
response to a continuous resultant vector without additional complexities. The<br />
following compilation is derived from the study by Fraser (1966).<br />
1 Gz:<br />
2Gz:<br />
2 I/2 Gz:<br />
3 4Gz:<br />
4 l/2-6Gz:<br />
Positive Acceleration Effects (+Gz)<br />
Equivalent to the erect or seated terrestrial posture.<br />
Increase in weight, increased pressure on buttocks,<br />
drooping of face and soft body tissues.<br />
Difficult to raise oneself.<br />
Impossible to raise oneself, difficult to raise arms and<br />
legs, mows'merit at right angles impossible; progressive<br />
dimming of vision after 3 to 4 seconds, progressing<br />
to tunneling of vision.<br />
Diminution of vision, progressive to blackout after<br />
about 5 seconds; hearing and then con_iousness lost<br />
if exposure continucd; mild to severe convulsions in<br />
about 50 percent of subjects during or following<br />
unconsciousness, frequently with bizarre dreams;<br />
occasion',ally parcsthesias, confused states and, rarely,<br />
gustatory sen_tions; no incontinence; pain not<br />
common, but tension and congestion of lower limbs<br />
with cramps and tingling; inspiration difficult; loss of<br />
orientation for time and space up to 15 seconds<br />
postacceleration.
-1 Gz:<br />
-2 to -3 Gz<br />
-5 Gz :<br />
2 - 3Gx:<br />
3 -6Gx:<br />
6 -9Gx:<br />
9 - 12Gx:<br />
15Gx:<br />
Sustained Linear Acceleration 151<br />
Negative Acceleration Effects (-G z)<br />
Unpleasant but tolerable facial suffusion and con-<br />
gestion.<br />
: Severe facial congestion, throbbing headache; progressive<br />
blurring, graying, or occasionally reddening<br />
of vision after 5 seconds; congestion disappears<br />
slowly, may leave petechial hemorrhages, edematous<br />
eyelids.<br />
Five seconds, limit of tolerance, rarely reached by<br />
most subjects.<br />
Forward A cceleration Effects (+G x)<br />
Increased weight and abdominal pressure; progressive<br />
slight difficulty in focusing and slight spatial disorientation,<br />
each subsiding with experience; 2 Gx<br />
tolerable at least to 24 hours, 4 Gx up to at least<br />
60 minutes.<br />
Progressive tightness in chest (6 Gx, 5 minutes),<br />
chest pain, loss of peripheral vision, difficulty in<br />
breathing and speaking, blurring of vision, effort<br />
required to maintain focus.<br />
Increased chest pain and pressure; breathing difficult,<br />
with shallow respiration from position of nearly futl<br />
inspiration; further reduction in peripheral vision,<br />
increased blurring, occasional tunneling, great concentration<br />
to maintain focus; occasional lacrimation;<br />
body, legs, and arms cannot be lifted at 8 Gx; head<br />
cannot be lifted at 9 Gx.<br />
Breathing difficulty severe; increased chest pain;<br />
marked fatigue; loss of peripheral vision, diminution<br />
of central acuity, lacrimation.<br />
Extreme difficulty in breathing and speaking; severe<br />
vise-like chest pain; loss of tactile sensation; recurrent<br />
complete loss of vision.<br />
Backward Acceleration Effects (-G x)<br />
Similar to those of +Gx acceleration with modifications<br />
produced by reversal of force vector. Chest pressure reversed,<br />
hence breathing easier; pain and discomfort from outward<br />
pressure toward restraint harness manifest at about -8 Gx; with<br />
forward head tilt cerebral hemodynamic effects manifest akin to<br />
-Gz; distortion of vision at -6 to -8 Gx; feeling of insecurity<br />
from pressure against restraint.
152 Bioastronautics Data Book<br />
3 Gy:<br />
5 Gy<br />
(14.5 sec):<br />
Lateral Acceleration Effects (+Gy)<br />
(Little lnformatio n Available)<br />
Discomfort after 10 seconds; pressure on restraint<br />
system, feeling of supporting entire weight on<br />
clavicle; inertial movement of hips and legs, yawing<br />
and rotation of head toward shoulder; petechiae and<br />
bruising; engorgement of dependent elbow with pain.<br />
External hemorrhage, severe postrun headache.<br />
Table 4-1 shows the most common symptoms which occurred during +Gz<br />
and +Gx acceleration on the centrifuge of the U. S. Naval Air Development<br />
Center, Johnsville, Pennsylvania, during the period 1961 through 1965.<br />
Vector<br />
+G z<br />
+G x<br />
Miscellaneous<br />
(York et al., 1968)<br />
Table 4-1<br />
Human Response to +G z and +G x<br />
Accelerations on a Centrifuge<br />
Symptom<br />
Grayout<br />
Blackout<br />
Motion sickness<br />
Chest pain<br />
Motion sickness<br />
Dyspnea<br />
Arrhythmia<br />
Abdominal pain<br />
Headaches<br />
Syncope<br />
Limb myatgia<br />
Paresthesia<br />
Instances<br />
351<br />
167<br />
40<br />
104<br />
97<br />
29<br />
29<br />
2380<br />
2380<br />
2380<br />
2557<br />
2557<br />
2557<br />
2557<br />
Runs<br />
17 cases<br />
15<br />
15<br />
12<br />
7
Sustained Linear Acceleration 153<br />
Physiological Effects of Sustained Acceleration<br />
The fundamental stimulus influencing the physiological effects of sustained<br />
acceleration arises from the effective increase in weight of the body, and particu-<br />
larly its fluid components, along the acceleration vector. This is illustrated in<br />
figure 4-1. The center sketch of the figure, illustrating the vascular effects at<br />
+1 Gz, indicates that with a mean arterial pressure of 120 mm Hg, the mean<br />
pressures at head and foot levels are calculated to be 96 and 170 mm Hg,<br />
respectively. At +5 Gz, while maintaining mean arterial pressure at heart level of<br />
120 mm Hg, the theoretical pressure at the base of the brain will be zero, whilc at<br />
the feet it will be 370 mm Hg. Under these circumstances, the subject would be<br />
unconscious, and an additional venous pressure of 250 mm Hg would be required<br />
to return blood from feet to heart. In fact, unconsciousness does not necessarily<br />
occur at +5 Gz because of physiological compen_tory adjustments.<br />
tOO<br />
200<br />
30O<br />
37O<br />
Figure 4-1. Hydrostatic<br />
at 1 G and during<br />
1G<br />
5G<br />
pressures in vascular system of a man in upright sitting position<br />
headward acceleration at 5 G. (After Wood et al., 1963)<br />
During +Gz acceleration with rates of onset from 1 to 2 G/sec, and of<br />
magnitude sufficient to produce loss of vision, there is an immediate decrease in<br />
blood pressure at head level, an increase in heart rate, a decrease in blood w)lume at<br />
the ear, and a decrease in the amplitude of the arterial pulse at ear level (Lindbcrg &<br />
Wood, 1963). Recovery of blood pressure and ear pulse begins before the acceleration<br />
episode is complete, indicating compen_tory physiological adjustments. The<br />
fall in blood pressure at head level is proportional to the magnitude of the<br />
acceleration. Blood pressure at heart lew:l, howcvcr, is maintained near normal and<br />
in fact may actually increase during cxposurcs to the level of +5 Gz. These<br />
effects are illustrated in figure 4-2. Some of the general cardiovascular responses<br />
are tabulated in tablc 4-2.<br />
487-858 O - 73 - [l
154 Bioastronautics Data Book<br />
HEART RATE<br />
BEATS PER MINUTE<br />
--200:<br />
ARTERCAL PRESSURE<br />
mm Hg (head level)<br />
120 £<br />
s0:<br />
Figure 4-2. Sequence of physiological events during exposure of normal subject to<br />
positive acceleration at +4.5 Gz for 15see. Note initial period of progressive failure:<br />
there are, in order of occurrence, decrease in blood pressure at head level, increase in<br />
heart rate, loss of blood volume in the ear, and failure of peripheral vision. This is<br />
followed by a period of compensation despite continuance of exposure. (After<br />
Lindberg & Wood, 1963; reprinted by permission of Academic Press, Inc. Copyright<br />
1963 by Academic Press, Inc.)<br />
CV Response<br />
Table 4-2<br />
Cardiovascular Responses to +G z Acceleration<br />
Percentage Increase (+) or Decrease (--)<br />
+2 G z +3 G z +4 G z<br />
Cardiac output - 7 -18 -22<br />
Stroke volume --24 -37 --49<br />
Heart rate + 14 +35 +56<br />
Mean aortic pressure + 9 +21 +27<br />
Systemic vascular resistance +17 +41 +59<br />
(Wood et al., 1961)<br />
In the -Gz vector, the direction of the increased hydrostatic pressure is<br />
reversed. With the onset of acceleration, the arterial and venous pressure rise<br />
some 70 to 90 mm Hg as measured in the carotid artery and jugular vein<br />
(Gamble et al., 1949).<br />
!
Sustained Linear Acceleration 155<br />
Gauer and Henry (1964), describing work carried out between 1947 and<br />
1949, silowcd that the venous pressure developed under -G z acceleration, as<br />
measured in the supraorbital vein, depended on the degree of tilt of the<br />
head because of the geometrical relations of the vertical axes of the head<br />
and the eyes. Figurc 4-3 illustrates the resulting effects at -2 Gz during<br />
rotation from the full prone to the full supine position.<br />
3<br />
4o<br />
20<br />
10<br />
0<br />
90 ° 75 ° 60 ° 45 ° 30 ° 15 ° 0 ° 15 ° 30 ° 45 ° 60 ° 75 ° 90 °<br />
DEGREE OF TILT<br />
O without cuffs<br />
• with cuffs<br />
Figure 4-3. Venom pressures during exposure to -.Gz acceleration in different poations<br />
of body tilt. Light line and O=data obtained normally; heavy line =theoretically<br />
calculated pressures; broken lines=pressures obtained when rotating subject with<br />
tourniquets about legs to prevent reflux of blood. Venom pressure was measured in<br />
forehead vein. (After Gauer & Henry, 1964)<br />
Change in heart rate has been inconsistent in different studies. Browne<br />
and Fitzsimmons (1957), in an ECG study of 53 subjects with<br />
366 exposures in the range of +3 to +5 Gz for 15 seconds duration, found<br />
a progressive increase in pulse rate with increase in acceleration level.<br />
Electrocardiographic changes under sustained acceleration are largely<br />
nonspecific and chiefly manifest as alterations in the electrical axis, along with<br />
some S-T segment and T-wave changes. Arrhythmias are not uncommon and<br />
occur under all vectors.<br />
Retinal and Visual Response<br />
Vision is markedly affected by alteration in hydrostatic pressure. The<br />
symptoms, namely, grayout or loss of peripheral vision and blackout or total loss
156 Bioastronautics Data Book<br />
of vision, manifest themselves at levels below those producing unconsciousness,<br />
since intraocular pressure is some 20 mm Hg higher than intracerebral pressure.<br />
Consequently, blood supply to the retina fails before failure of cerebral<br />
circulation (Andina, 1937).<br />
Visual effects occur in all vectors but, because of the vertical position, are<br />
more common in the Gz vectors. Because of the forward position of the eye<br />
with respect to the midline, the force experienced at the eye is not the same as<br />
that applied to the midline.<br />
Duane (1954) obtained illustrations of the retina during +Gz accelerations to<br />
blackout level. A correlation between visual change and change in the fundus<br />
oculi was established, as indicated in table 4-3.<br />
Table 4-3<br />
Correlation Between Changes in Vision and Fundus Oculi Changes<br />
Stage Subjective Response<br />
I Lossof peripheral vision<br />
I I Blackout<br />
III Return of central peripheral vision<br />
(Duane, 1954)<br />
Objective Response<br />
Arteriolar pulsation --i.e., recurrent exsenguination<br />
Arteriolar exsanguination and collapse<br />
Return of arteriolar pulsation and temporaw<br />
venous distension<br />
Newsom and his colleagues (1968) conducted retinal photography and<br />
fluorescence angiography during 10-second plateaus of blackout from +Gz<br />
acceleration in human subjects. Some of the findings are shown in figure 44.<br />
On exposure to -Gz acceleration, local hydrostatic pressure is increased at<br />
the eyeball and gives rise to pain and a feeling of fullness. The occurrence of<br />
"red-out," or reddening of the visual fields has been reported experimentally in<br />
centrifuge work (Ryan et al., 1950), but it is doubtful if it occurs consistently or<br />
operationally. It has been suggested that red-out is a distortion of vision caused<br />
by obstruction from the conjunctiva of the lower lid.<br />
Visual Thresholds. The general range of visual threshold in relation to<br />
unconsciousness is shown in table 4-4. There would appear to be a change in<br />
the absolute threshold of vision under acceleration, that is, the minimum light<br />
intensity at which a stimulus can be perceived. White (1960) showed that for a<br />
given stimulus intensity to be perceived as of equal intensity with a probability<br />
of 50 percent under increased acceleration, the actual intensity had to be<br />
increased according to the ratios shown in table 4-5. Foveal and peripheral<br />
thresholds as a function of acceleration are illustrated in figures 4-5 and 4-6.
BLACKOUT ON THE HUMAN CENTRIFUGE<br />
Sustained LinearAcceleration<br />
PEAK ÷ 3.5 Sic PEAK ÷ 4,5 Sic PEAK PEAK + 11.5 Sic<br />
ARTERIAL<br />
COLLAPSE<br />
"_ ARTERIAL / VISION /<br />
"_ PULSATION / RETURNINGJ<br />
,,E-arm 3.0 + GZ--_/ \<br />
_Sec<br />
0 10 20 30 74<br />
TIME IN SECONDS<br />
Figure 4-4. Serial photographs of fundus of right eye in a human subject during<br />
blackout. Read from left, up, right, and down. (After Leverett, 1968, from work of<br />
Newson et al., 1968)<br />
Criterion<br />
Table 4-4<br />
Range of Visual Thresholds<br />
in Relation to Unconsciousness<br />
Mean Standard<br />
Threshold Deviation Range<br />
(G)<br />
(G) (G)<br />
Lossof peripheral vision 4.1 -10.7 2.2 -- 7.1<br />
Blackout 4.7 -+0.8 2.7 -- 7.8<br />
Unconsciousness 5.4 +0.9 3.0 -- 8.4<br />
(After Cochran et al., 1954)<br />
The effect of acceleration on brightness discrimination is shown in<br />
figure 4-7. The minimal detectable difference in intensity between a test patch<br />
and its lighted surround has long served as a test of visual sensitivity. The<br />
threshold difference has been found to be a function of basic energy level as well<br />
as contrast between the patch and its reference illumination. Thus, the greater<br />
the background intensity, the smaller the ratio between the patch and the<br />
background required for detection. The data compiled in tile graphs in<br />
figure 4-7 illustrate an interaction between acceleration and the minimal<br />
discernible differential intensity (AI). The stimulus display used to collect the<br />
157
158 Bioastronautics Data Book<br />
data consisted of a background subtending 804 ' visual angle positioned<br />
28 inches from the eye and viewed monocularly through a circular aperture<br />
17.5 inches from the eye. The test patch, projected upon the background,<br />
subtended a 1°28 ' visual angle (Braunstein & White, 1962).<br />
Table 4-5<br />
Increase in Visual Stimulus Intensity* Required to Perceive a Stimulus<br />
as Equalling that at +1 Gz (P = 50%)<br />
Acceleration (+G z)<br />
Required Increase in Stimulus Intensity<br />
Fovea Periphew<br />
1 1 1<br />
2 -- 1.5<br />
3 2 3<br />
4 3.4 4<br />
*Expressed as a ratio of that at +1 G z.<br />
(Data of White, 1960)<br />
7.4 -<br />
_- 7.2-<br />
::L<br />
g_<br />
g<br />
<<br />
Z<br />
J 6.8<br />
7.0 _<br />
._1<br />
O<br />
T<br />
(,/')<br />
LU<br />
n'- 6.6<br />
I<br />
i-<br />
6.4<br />
FOVEAL THRESHOLDS<br />
POSITIVE G z NO PROTECTION<br />
I t I I I<br />
1 2 3 4 5<br />
ACCELERATION (G units)<br />
Figure 4-5. Threshold of foveal vision under +1 to +4G z acceleration.<br />
(Mter White, 1960)
t<br />
x<br />
4.0<br />
:::t.<br />
::& 3.8<br />
g_<br />
IiI<br />
g 3.6<br />
z<br />
--I<br />
J<br />
0<br />
T<br />
IJJ<br />
3.4<br />
,T 3.2<br />
1"<br />
3.0<br />
Sustained Linear Acceleration 159<br />
PERIPHERAL THRESHOLDS<br />
POSITIV<br />
O_ I I I I J<br />
1 2 3 4 5<br />
ACCELERATION (G units)<br />
Figure 4-6. Threshold of peripheral vision under +1 to +4 G acceleration.<br />
1<br />
q<br />
; ......... ] .....<br />
.01 02.03 05 .10 .2O.30 30 10 20 30 50 10 2O 30 2O _<br />
BACKGROUND LUM[NANC[ _"<br />
(After White, 1960)<br />
! Iii<br />
01 02 03 05 10 _ ,30 .50 L0 2.0 3,0 50 10 20 30 _) 100<br />
BACKGROUND LUMINANCE - h-k<br />
Figure 4,-7. Relationship between brightness discrimination and background luminance<br />
under four levels of pofitive (+Gz) (top) and five levels of transverse (+Gx) (bottom)<br />
acceleration. (After Braunstein & White, 1962)
160 Bioastronauties Data Book<br />
The effects of oxygen on brightness discrimination<br />
figure 4-8, from work by Chambers and Kerr (1962).<br />
K<br />
=¢<br />
16<br />
14<br />
_- _o<br />
z<br />
8<br />
_ 8<br />
12<br />
6 I 1<br />
8<br />
6<br />
0<br />
8_-...¢/x _. ,"<br />
+ G x Normal ACr<br />
÷Gx 100%O 2<br />
* G x 'JO0 % 02<br />
I 1 I<br />
2 3 4<br />
ACCELERATION IG umts)<br />
_%_us posnive grelsure<br />
A<br />
+Gx<br />
\<br />
I I<br />
5 6<br />
+ G z Normal Air<br />
*G z 100%O 2<br />
* G z 100%O 2<br />
plus positive pressure<br />
.._.........-o<br />
_"':.o:.----o---_ :..-_-'_---- - .-c<br />
I I I I I I<br />
1 2 3 4 5 6<br />
ACCELERATION (G units_<br />
S<br />
Figure 4-8. Brightness discrimination with different breathing gasses<br />
at different acceleration levels. (After Chambers & Kerr, 1962)<br />
are illustrated in<br />
Visual Distortion. In the -Gx vector, distortion becomes marked at -6 to<br />
-8 Gx. Smedal and his colleagues (1963) showed that this was not due to<br />
corneal distortion in the bulging eye but was associated with intermittent<br />
watering occurring at about the -6 Gx level.<br />
Visual Fields. Limitation in the visual field under acceleration exposure is, of<br />
course, related to the occurrence of grayout. At about +4.5 Gz, the field is<br />
narrowed to an arc of less than 46 ° . Figure 4-9 indicates the effect of the retinal<br />
position of a sign',d on the acceleration response. In the study which the figure<br />
illustrates, 115 subjects were exposed to +G z acceleration with a light array<br />
above. Almost invariably, subjects lost the 80 ° light before loss of the<br />
23 ° light. In 30 subjects, the 80 ° light loss occurred at a mean of 4.2 Gz,<br />
standard deviation -+0.7 G. In the same subjects, the 23 ° light loss occurred at a<br />
mean of 4.5 Gz, standard deviation -+0.8 G. Central light loss occurred at<br />
5.3 Gz, standard deviation :t0.8 G.
Mean (G z level)<br />
Range (G z level)<br />
Standard deviation<br />
Duration of symptommean<br />
(sec)<br />
Duration of symptomrange<br />
(sec)<br />
Sustained Linear Acceleration 161<br />
CENTER<br />
23 ° LIGHT 23°<br />
Comparison of 80 ° Light Loss, 23° Light Loss, and 0 ° Light Loss<br />
Clear<br />
3.8<br />
2.3 -- 5,1<br />
0.7<br />
80 ° LL<br />
4.2<br />
2.7 -- 5.7<br />
0.7<br />
5.4<br />
1.9 -- 17.0<br />
Symptoms<br />
23 ° LL<br />
4.5<br />
2.9 -- 6.4<br />
0.8<br />
5.1<br />
1.9 - 11.9<br />
Figure 4-9. Effect of retinal position of a signal on the perception<br />
of light signals under acceleration. (From Zariello et al., 1958)<br />
CLL<br />
5.3<br />
3.6 -- 7.0<br />
0.8<br />
6.8<br />
2.1 -- 23.4<br />
Pupillary Reactions. Pupillary dilation begins with loss of peripheral vision<br />
(Beckman et al., 1961). Accommodation is unaffected by acceleration (Smedal<br />
et al., 1963).<br />
Unconsciousness and Cerebral Function<br />
Loss of consciousness and complete impairment of cerebral function occur<br />
between +3 Gz and +8 G z, the specific level depending chiefly on biological<br />
factors and duration and rate of onset. Figures 4-10 and 4-11 indicate tile range<br />
of responses found. In tile other vectors, the subject normally reaches a<br />
tolerance threshold of another sort before unconsciousness occurs. On return to<br />
consciousness, there is usually a short (5 to 15 second) period of confusion<br />
(Franks et al., 1945).<br />
Convulsions with characteristic EEG changes are a common accompaniment<br />
of unconsciousness, having been found in 52 percent of 230 subjects (Franks<br />
et al., 1945). Sere-Jacobsen (1959, 1960) has recorded and photographed them<br />
in pilots in flight. Brent and coworkers (1960) have found that certain<br />
combinations of hyperventilation, hypoglycemia, and +Gz acc,leration will<br />
produce convulsions in all subjects.
162 Bioastronauties Data Book<br />
O<br />
o<br />
15<br />
10<br />
_ ,_r.'_ AVERAGE 2.8 2.3 2.1 1.g 1.7 1.5 1.4 t.2 I.I 1<br />
5.C<br />
0..c<br />
.<br />
.<br />
0.1<br />
0<br />
i i I I I<br />
4Gz TIME TO UNCONSCIOUSlNNESS AFTER GRAYOUT<br />
SHORTEST 1.6 1.3 1.2 1.1 1.0 0.9 II.ll 0.7 0.6 0<br />
lit." /"1 _.-_<br />
-...,<br />
1 2 3 4 5 6 7<br />
RATE OF ONSET OF ACCELERATION - G/see<br />
Figure 4-10. Time to unconsdousness as a function of rate of onset<br />
Z<br />
I-<br />
¢.1<br />
U<br />
16<br />
of positive acceleration (Gz). (After Stoil, 1956)<br />
o GRAYOU T<br />
IP<br />
• BLACKOUT<br />
o CONFUSION, POSSIBLY UNCONSCIOUSNESS<br />
J_' _-" •UNCONSCIOUSNESS _<br />
S<br />
o - s<br />
o<br />
o 5 Io 15 20 25 30 35<br />
TOTAL TIME FROM START OF ACCELERATION TO ENDPOINT - $ec<br />
Figure 4-11. Time to unconsdouanes_ as a function of varying rates<br />
of positive acceleration (Gz) onset, G amplitudes, and exposure times. (After Stoll, 1956)<br />
Pulmonary Response<br />
A naturally occurring pressure gradient exists even at 1 G between the apex<br />
and the base of the lung in the vertical subject and between the front and the<br />
back of the lung in the supine subject (Glaister, 1967; Wood, 1967; Rutishauser<br />
et al., 1967, and others). With increase in acceleration, there is an increase in<br />
perfusion of tile pulmonary vessels in the dependent portions of the lung and a
Sustained Linear Acceleration 163<br />
decrease in the upper zone (Bryan & MacNamara, 1964, and other workers).<br />
Figure 4-12 shows the relationships at +3 Gz, while figure 4-13 shows the<br />
relationships at 0, +1, and +3 G x. Individual relationships are shown in<br />
figure 4-14.<br />
dislance up lung Pa Pv tlow<br />
(cm) (crn H?O) (cmH20) zot_ dist ributio_<br />
2o -3o -4o I<br />
15 -15 -25<br />
25 -45 -55<br />
---- " 1o-- -- o -----1o----<br />
-- ---s----T-- --% ....<br />
o 3o 20 [11<br />
I<br />
0 flow<br />
Figure4-12. Theoretical pressure-flow relationships in vertical lung at +3 Gz; Pa,<br />
mean pulmonary arterial pressure; Pv mean pulmonary venous pressure. Hydrostatic<br />
indifference plane is taken to be 5 cm below the lung hilum; arteriovenous pressure<br />
difference is assumed to remain constant at 10cm water. (After Glaister, 1967;<br />
reprinted by permission of the Controller of Her Britannic Majesty's Stationery Office)<br />
<<br />
8<br />
X4<br />
>_ x3<br />
164 Bioastronautics Data Book<br />
:'.Tj':<br />
0G Intr_Burll<br />
VENTRAL CHEST WALL<br />
............. ,/<br />
Pulmonary<br />
pru=urga: Artery Vein PA PV<br />
DORSAL CHEST WALL<br />
-30 5G -40<br />
lure<br />
• ) 60 ,<br />
PA PV<br />
Figure 4-14. Effects of forward (+Gx) acceleration on intrathoracic pressures<br />
(dorsal-ventral dimension of lung is 20 cm_ Numerals indicate pressures as cmH20 ,<br />
and zero reference level is atmospheric pressure at midthoracic coronal plane. (After<br />
Wood et al., 1963)<br />
Lung Volumes and Mechanics of Breathing. Respiratory rate increases<br />
almost linearly with acceleration. Minute volume increases initially, but<br />
levels off at about +8 Gx, when acceleration is applied in that vector. Tidal<br />
volume, although increasing initially up to about +5 Gz, or +8 Gx,<br />
decreases with still greater acceleration. Positive pressure breathing<br />
(30 cm H20 ) diminishes the changes in lung volumes resulting from<br />
acceleration, and, in particular, allows a relative increase in ventilation of<br />
the lower lung. This effect, however, is abolished by the increase in<br />
abdominal pressure induced by wearing an inflated G-suit (Glaister, 1965),<br />
as shown in table 4-6. Glaister (1961) also showed that there was no<br />
change in lung stiffness or air resistance, at least up to +3 Gz. This was<br />
confirmed up to +4 G x by Watson and his colleagues (1960), who further<br />
demonstrated an increase in the resting relaxation pressure amounting to<br />
5 mm Hg/G as illustrated in figure 4-15.<br />
The oxygen cost of acceleration in the Gx vector was examined by<br />
Zechman and coworkers (1960) and by Glaister (1963). These investigators<br />
confirmed, with experiments at +2 to +3 Gz for 1/2 to 5 minutes, that at<br />
the lower levels of acceleration oxygen uptake does not increase during the<br />
exposure, and may even fall, although an oxygen debt is built up. This debt<br />
is, however, repaid on return to 1 G. These findings are summarized in<br />
table 4-7 and figure 4-16.<br />
Arterial Oxygen Saturation. The effect of the changed ventilation/perfusion<br />
relationships is to produce a progressive decrease in arterial<br />
oxygenation with increase in acceleration. Figure 4-17, from the work of<br />
Wood et al. (1963), shows the average and range of changes in arterial<br />
oxygen saturation in four healthy men exposed to +Gz acceleration, as<br />
indicated, breathing air.<br />
Alexander and his colleagues (1965) measured arterial oxygen saturation<br />
in a group of 25 pilots breathing air while exposed to +Gx accelerations<br />
representative of Apollo operations. The results are illustrated in figure 4-18.<br />
/<br />
_3 2<br />
+18
°°i=<br />
= o<br />
Sustained Linear Acceleration 165<br />
"_- _ +, +, +, +,<br />
,,, _ $ g $<br />
r_ _ 0 01<br />
tl:<br />
'_ g +r +t +l +l<br />
c ¢¢) _ _ r-,.<br />
(.9<br />
ae<br />
><br />
(O _ (D<br />
P _ +I +1 +1 +1<br />
o><br />
,,t _,<br />
+, +, +, +,<br />
> D<br />
_<br />
"El<br />
N m _ ; E<br />
ST_<br />
_ g<br />
1, _<br />
< _
166 Bioastronautics Data Book<br />
,°°F<br />
9O<br />
_ 8o<br />
Q.<br />
_ 70<br />
_ 60<br />
g so<br />
w<br />
J<br />
o<br />
o<br />
o<br />
-15 -10 -5<br />
1G<br />
2G 3G 4G<br />
o 5 lO 15 20 25 30<br />
INTRAPULMONIC PRESSURE (mm Hg)<br />
Figure 4-15. Static relaxation pressure-volume curves during control (+Gx) and +2, +3,<br />
and +4 Gx acceleration. All lung volumes were obtained at 1 G. (After Watson et al.,<br />
1960)<br />
Figure 6-19 illustrates a similar experiment with subjects breathing 100<br />
percent oxygen at 5 psi. It will be noted the rate of desaturation is slower and<br />
the rate of recovery is even more so.<br />
Arterial desaturation is also evident on exposure to acceleration in the -G x<br />
vector, although the severity is perhaps not so great. Figure 4-20, from the work<br />
of Smedal et al. (1963), indicates the results.<br />
In the +Gz vector, the effects of arterial desaturation are overshadowed by<br />
other more dramatic responses, but Barr (1962) demonstrated its occurrence and<br />
further showed that the rate and degree of desaturation were increased by<br />
repeated exposures. Arterial desaturation has also been observed with accelera-<br />
tion in the -Gz vector (Gauer & Henry, 1964).<br />
The "altitude equivalent," representing the extent of hypoxia commensurate<br />
with the intensity of +G x accelerations, is shown in figure 4-21.<br />
Renal Output<br />
Reduction of urine secretion under applied +G z acceleration, followed by an<br />
increased outflow on cessation of acceleration has been demonstrated in human<br />
subjects by Stauffer and Errobo-Knudsen (]953), with results shown in figure<br />
6-22.<br />
I
_-.,0<br />
_+...<br />
-_<br />
_ _._.<br />
_._<br />
_2<br />
0<br />
÷<br />
-t-<br />
X<br />
x<br />
X<br />
I<br />
Sustained Linear Acceleration 167<br />
X C_I LO ,'_<br />
(J<br />
W<br />
n<br />
W<br />
m 0 0 0 0<br />
0 _ ro _ _<br />
(J<br />
m (J _3 w u. (D 7- -- ._<br />
_0<br />
+1<br />
0<br />
+1<br />
0<br />
+1<br />
+1<br />
CO<br />
F_<br />
+1<br />
+1<br />
O_<br />
E<br />
N
168 Bioastronautics Data Book<br />
Figure 4-16..Effect<br />
_> 100<br />
149[<br />
A _ 0<br />
__118<br />
I<br />
83 o<br />
c _ o<br />
0 1 2 3 4 5 6 7 8<br />
m)n<br />
il oo<br />
152<br />
1 2 3 4 5 6 7 8 1,0[<br />
mln<br />
100<br />
"f_,co_<br />
B O<br />
_ 0.9<br />
0 1 2 34 5 6 7 8<br />
m_ n<br />
3 4 6 7 C 0.8<br />
rain 0 1 2 3 4<br />
rain<br />
5 6 7 8<br />
of podtive acceleration at +3 G z f._or 3rain on pulmonary<br />
ventilation (VE) , respiratory rate (f), and tidal volume (VT), at left; on 02 uptake<br />
(Vo2), CO 2 excretion (Vco2), and respiratory gas exchange ratio (R), at right. Period of<br />
acceleration is shaded. Horizontal lines give mean values for seven runs on five<br />
subjects, barred vertical lines indicate +SD deviation of mean. (After Ghister, ]963;<br />
reprinted by permission of the Controller of Her Britannic Majesty's Stationery Office)<br />
V -T- ...........<br />
941 J I T T T T T T T T _<br />
901_._._._.L____ ....... 1 a l l _ I L_--& I t I<br />
F -- 3.7G q<br />
0 .......... _ . _. _ _-___-z,_-J_ ,.,_- _'_ ,.,,_,__<br />
0 86 .....<br />
>.<br />
O<br />
I I_ O METER i<br />
/ ' I i" -f-H-H4-N VER"OE+R,NGE'<br />
r- ! I I [ I I I I I I I I [_ I I EARPIECEOXMETER<br />
t i , * I = t = iJ<br />
20 0 40 80 t 20 160 200 240 280 320<br />
TIME (_)<br />
Figure 4-17. Average and range of changes in arterial 02 saturation of four healthy<br />
men, recorded by cuvette and car oximeters dining 3 m at +2.1, +3.7 and +5.4 G z.<br />
(After Wood et al., 1963)
Sustained Linear Acceleration 169<br />
95 L _/_o ="<br />
I--0900::_ _i_ _ *4G +4G _ r.....,-..._:, ,,<br />
D 85<br />
Z 80 _' "=] +6G +6(3 ' /|<br />
>. ,<br />
0 75 ._<br />
'_ _,"........eG +sG /<br />
wE 70<br />
\ /<br />
<<br />
+10G +lOG<br />
65 "----g<br />
0 30 60 90 120 0 30 60 90 120 150 180<br />
I*DESATURATION PHASE't P_ RECOVERY PHASE<br />
TIME (sec)<br />
Figure 4-18. Means of arterial saturations in 25 subjects exposed to +G x acceleration<br />
breathing air at 14.7 psia.AV = 37 000 fps. (After Alexander et al., 1965)<br />
95 L.<br />
_ 90 _<br />
80 ,_,<br />
0 75 _.<br />
_ 70<br />
<<br />
15G/sec/_<br />
65<br />
0 30 60 90<br />
I=-DESA TURA TION PHASE-=I<br />
+6G +6G ....<br />
+8G +8(3 .,_<br />
.10(3 +10G /<br />
---t ,,-.---]<br />
120 0 30<br />
TIME(_c)<br />
//<br />
P'_--_RECOVERYPHASE<br />
,_4v,<br />
/<br />
60 90 120<br />
150 180<br />
Figure 4-19. Means of arterial sattwations in 25 subjects exposed to +G x acceleration<br />
lxeathing 100% 0 2 at 5 psia.lkW = 37 000 fps. (After Alexander et al., 1965)<br />
487-858 0 - 73 - 12
170 Bioastronautics Data Book<br />
_¢<br />
.<<br />
(3<br />
Z<br />
:=<br />
p.<br />
tw<br />
cD<br />
u<br />
o<br />
re<br />
L_<br />
+<br />
Z<br />
o<br />
p.<br />
E<br />
16 I<br />
15 _<br />
14<br />
13<br />
12<br />
11<br />
10<br />
9<br />
l<br />
"_" 6<br />
Sustained Linear Acceleration 171<br />
_ >_.L.....<br />
..,"<br />
Control /<br />
/<br />
/<br />
/-<br />
""" / //////<br />
/<br />
° 60 5.5 ..... 50 4.5 40 ;;o' .5 2.5 2 1 10 5'<br />
g_<br />
I L 1 I _ I<br />
i'0 , 20 ;0 ,'0,.5.5o<br />
Prerun lime, mJn Postrun<br />
Figure 4-22. Urine output before and after acceleration.<br />
(After Stauffer & Enrobo-Knudsen, 1953)<br />
The underlying mechanism has been postulated as involving an increase in<br />
secretion of antidiuretic hormone (ADH) as a result of stimulation of fluid<br />
volume receptors, or from change in glomerular filtration rate arising from<br />
hemodynamic effects on the renal artery. Increase in ADH levels has been noted<br />
in human subjects at +2 Gz acceleration for 30 minutes (Rogge et al., 1967).<br />
Mechanical Impedance and Natural Frequency<br />
The fundamental resonant frequency of the human body sitting erect under<br />
normal gravitational conditions is approximately 5 Hz (Coermann, 1963). A<br />
sustained +G z acceleration stiffens the seated human body in the direction of<br />
the spine and increases the fundamental natural frequency to 7 Hz at +2 Gz and<br />
8 Hz at +3 Gz. During +3 Gz acceleration, at vibrational frequencies up to about<br />
5 Hz, the body tends to respond as though it were a pure mass. The transmission<br />
factor decreases under +Gz acceleration, especially at the 5 Hz resonance, but<br />
increases considerably above 6 Hz. The damping coefficient of the erect sitting<br />
human remains unchanged at about 0.575 during +Gz acceleration. Some of the<br />
foregoing factors are illustrated in figure 4-23 from the work of Vogt et al.,<br />
1968.<br />
Tolerance to Sustained Acceleration<br />
Tolerance may be defined as the limit of man's capacity to endure the<br />
physical and emotional discomfort of a stressful environment. The limit may be<br />
difficult to define with certainty, and, in fact, may commonly be an arbitrary<br />
cutoff point imposed from without, rather than a subjective endurance
172 Bioastronautics Data Book<br />
6oo 7.0<br />
6.0<br />
S m<br />
_ 4.0<br />
:3.0<br />
w<br />
u<br />
z 2.0<br />
<<br />
r_<br />
Lu 1.0<br />
o.<br />
O<br />
1 2 3 4 5 6 7 8 9 10 11 12 13 14 15 1<br />
FREQUENCY IHz}<br />
Figure 4-23. Mechanical impedance of sitting human body, under (a) nornmi gravity,<br />
(b) +2Gz, (c) +3Gz, and compared with (d) mechanical impedance of simple<br />
mass-spring-damper system with fo = 8 Hz, m : 65 000 dyne sec2/cm, and 6 = 0.575.<br />
(After Vogt et al., 1968)<br />
threshold. In +G z acceleration, the occurrence of grayout, blackout, or<br />
unconsciousness can be used as a standard. In -+Gx acceleration, dyspnea, pain,<br />
and discomfort tend to be self-limiting features not amenable to quantification.<br />
Human Acceleration Experience<br />
Figure 4-24 is a compilation by Fraser (1966) from numerous sources, of<br />
various human experiences in sustained acceleration. The curves are an<br />
estimation of the maximum voluntary tolerance of healthy, well-motivated men<br />
but must be considered maximum levels and not operational levels. Higher levels<br />
than those indicated in figure 4-24 have been tolerated but not in the form of an<br />
acceleration plateau, for example, +20 Gx for a few seconds in the form of a<br />
haversine peak (Collins et al., 1958) and +25 G x for several seconds (Collins &<br />
Gray, 1959).<br />
Figure 4-25 compares average G tolerance for several axes (Chambers, 1963).<br />
As contrasted with the average tolerance illustrated in the previous two<br />
figures, figure 4-26 demonstrates the upper limits of voluntary tolerance of a<br />
group of highly motivated test pilots, preconditioned to the effects of<br />
acceleration and suitably restrained.<br />
Rate of Onset<br />
Figure 4-27 illustrates the effect of different rates of onset on the response<br />
of 15 subjects to +Gz acceleration (Stoll, 1956). From these data, a monogram<br />
was developed (figure 4-28) which, although empirical, indicates the expected<br />
duration before grayout at a given plateau and rate of onset.
Sustained Linear Acceleration 173<br />
o Positi_ iccelerilion I_G,I<br />
• Nlgntlve Eceler nlion t-G, I<br />
Transvti'se #r.cltlerllio_ _G. P<br />
G-_me • Tran$_rse eccel_'lio_ (-G. I<br />
.... ¢ immcesion K--x 0ur_ion 0t accelertion rmu_rU<br />
"x re, 0rbita_ Velgitf<br />
:tO I limit_ion/ i I _e¢ O LMeta{ _.celera/iofl I_._._)<br />
L_<br />
--- xa<br />
o o • e, e_ _. _ brl_hlr_<br />
_'--'_G-tiFr, e limit_ioIL _ _ II C-tim<br />
......... o-c_. _ _ o o "q_, _•• ---<br />
G.... ,,m(,etlo_. "/ ". _ o o o o ° _ .....<br />
-G, -• - --. _- - ".....:,.J ,,,____ AA Iks-- o<br />
G limital_n. -G, _- ..............<br />
TIME (see)<br />
mital_n, -G, --I G-_rilkm required IW _--"<br />
Figure 4-24. Human experience of sustained acceleration. Each datum point represents<br />
a plateau of acceleration, not an incidental peak. Curves estimate maximum voluntary<br />
tolerance in +Gz_-G z and +G x vectors using restraint harness, couches, or anti-G suits<br />
where applicable. Dotted fines are extrapolations on basis of other evidence. (After<br />
Fraser, 1966; data from many sources)<br />
z<br />
10_<br />
5O<br />
4O<br />
2C<br />
_- 10<br />
k.)<br />
.oi<br />
:""+---k.<br />
___+___.___<br />
! ! f , !<br />
i<br />
..... _ ..... 7<br />
...... " .... i /<br />
• -,,..,,,<br />
.... I i<br />
.02 ,05 .1 .2 .5 1.0 2,0 5.0 10 20<br />
TIME - rain<br />
Figure _-25. Comparison of average G tolerance in four vectors<br />
of sustained acceleration. (After Cl_mbers, 1963)<br />
5o
i 74 Bioastronautics Data Book<br />
14<br />
13<br />
._ 12<br />
g<br />
Z<br />
0<br />
V-- 10<br />
<<br />
J<br />
U<br />
U<br />
\ Gx<br />
0 100 200 300 400 500 600<br />
ENDURANCE TIME - sec<br />
Figure 4-26. Voluntary endurance of acceleration by highly motivated test pilots.<br />
13 ¢_szt<br />
(After Chambers & Hitchcock, 1963)<br />
I /Te' • cm,_u_<br />
/ I I • Blll:l_Ut<br />
"IIA/TM :<br />
I_ Z.3 GlSec<br />
_; 0.5 GISK<br />
6 • o 0..} C/see 0.2 G/SI_<br />
¢ ..... e----e .........<br />
0 5 10 15 20 25 30 35<br />
TOTAL TIME FROM START OF ACCELERATION TO END POINT (sec)<br />
Figure 4-27. Effect of rate of onset of acceleration on G tolerance.<br />
(Mter Stoll, 1956)
10<br />
8 ,o'q<br />
4<br />
Sustained Linear Acceleration 175<br />
IX,?_<br />
3 _<br />
.S 12G _r- _ N_<br />
.4 13G *_ _"_ N _,<br />
.2 14G' _ ",1 _"-"<br />
0 1 2 3 4 5 6 7<br />
RATE OF ACCELERATION (G/sec)<br />
Figure 4-28. Monogram relating rate of onset of acceleration to time to grayout.<br />
(After StoU, 1956)<br />
Posture and Podtion<br />
Figure 4-29 (Bondurant et al., 1958a) illustrates the effect on tolerance of<br />
various positions in the +Gx vector, while figure 4-30 specifies the advantages<br />
and disadvantages of a variety of positions. The ideal position for forward (+Gx)<br />
acceleration is considered to be in a seated posture, forward facing, with the<br />
trunk inclined forward 20 ° from the vertical, hips flexed to bring the knees to<br />
eye level, and lower legs extended (position B, figure 4-30).<br />
Very Prolonged Acceleration<br />
Exposure to levels of +3 G x and ÷4 G x has been withstood for durations up<br />
to I hour (Bondurant et al., ]958a; Miller et al., 1959) but there are few<br />
instances on record. Clark (1960) describes a 24-hour exposure to +2 G x in a<br />
reclining _seat. It was characterized by rotational illusions and discomfort. Ross<br />
and his colleagues (1963) report a study of 4 hours' duration.<br />
Restraint and Protection<br />
Standard aircraft harnesses provide no protection against sustained<br />
acceleration except to maintain the subject in general position. The development<br />
and usefulness of anti-G devices and clothing is summarized in table 4-8 from the<br />
work of Nieholson and Franks (1966).<br />
\
1 76<br />
c-<br />
z<br />
0<br />
p-<br />
tw<br />
LU<br />
._J<br />
c.)<br />
c.)<br />
15<br />
14 _K<br />
m<br />
13 -- _K_<br />
IO<br />
3<br />
2<br />
\<br />
.... Estimated tolerance<br />
Bioastronautics Data Book<br />
Established tolerance<br />
Duration o¢ acceleration re-<br />
quired to reach 18,000 mph<br />
i =<br />
9o I<br />
Curve Position Directionof<br />
acceleration<br />
A ,water .... [_'. .......<br />
immersionJ<br />
B............. /65Q ..........<br />
D ..................<br />
1<br />
0 .5 l ]2i 2 ] 4 5 6 7 8 9 ]0 15 30 60<br />
TIME (min)<br />
Figure 4-29. Effect of body position and posture on tolerance to acceleration.<br />
(After Bondurant et al., 1958a)<br />
Position greatest of Direction<br />
tolerance acceleration<br />
(waterimmersion)<br />
-lOo<br />
D _ "65° _"<br />
E J_ _<br />
A<br />
B3<br />
Positionof<br />
lesser<br />
tolerance<br />
,,,ooL \<br />
El J<br />
_____ -
o<br />
cD<br />
.<<br />
+<br />
o<br />
t.d<br />
m t_<br />
_ t5<br />
, c E<br />
_'_<br />
,_m<br />
c<br />
0<br />
t-J<br />
e_<br />
13<br />
Sustained Linear .Acceleration 177<br />
_. O. O.<br />
_ _ _ (.9 I _ t O0 _ m. I<br />
zo c_ o ¢q d c_ ,_t,/_: ,2 /\ ,2<br />
m<br />
'-- _<br />
_ _='=<br />
_" _g<br />
__ _ _<br />
_• - _:: __._<br />
_ m<br />
o _.._ _ - .._-<br />
° _ _!o :: "_-<br />
_.__ _._<br />
E<br />
0<br />
3<br />
c<br />
o _,<br />
o =<br />
.u_<br />
n<br />
.i<br />
"5<br />
u_<br />
t'_ .. 3<br />
t t.9 t.9<br />
i _ _ -_o<br />
r- 1 _<br />
• r, o<br />
= _ _<br />
_ a_ 8=<br />
0 t3.<br />
___ _<br />
E_<br />
° .._<br />
.l
178 Bioastronautics Data Book<br />
o<br />
_D<br />
+<br />
o_<br />
w to<br />
_.$<br />
_>o<br />
_._<br />
t-<br />
.o<br />
t (9 _9 o<br />
O "i"I -_<br />
_ • _ _-<br />
_i__o _._<br />
_A t=<br />
Q- "O ._--<br />
O<br />
C<br />
LI.<br />
"O<br />
O<br />
z
Sustained Linear Acceleration 179<br />
To counter +G acceleration, custom-molded contour couches have been<br />
developed and utilized in space flight to provide a body posture with inclination<br />
of the head, trunk, thighs, and legs that combines optimum tolerance with useful<br />
performance (Clark et al., 1959).<br />
For the -G vector, the "Ames system" is available which incorporates a<br />
posterior molded couch with frontal and head support (Vykukal et al., 1962).<br />
Seats with raschel nylon net as the primary support surfaces have been<br />
developed. These provide good support up to +16.5 Gx but demonstrate an<br />
undesirable rebound under severe vibration and impact acceleration (Peterson,<br />
1964).<br />
The possibilities of partial or total water immersion as a protective aid have<br />
been explored with some success (Wood et al., 1946; Gray & Webb, 1960, 1961)<br />
with exposures to +31 Gz for 5 seconds. Figure 4-31 shows the protection given<br />
against the effects of transverse acceleration (Gx) when the subject is immersed<br />
in water. Curves are also shown for subjects protected by optimal support and<br />
positioning.<br />
Vision<br />
Performance Under Sustained Acceleration<br />
Some of the basic visual responses have already been examined. This section<br />
is concerned more with the ability to perform specific activities.<br />
Visual Reaction Time. The majority of workers have found a prolongation in<br />
simple reaction time on exposure to severe but tolerable acceleration (Canfield<br />
et al., 1949; Brown & Burke, 1957; Frankenhaeuser, 1958; Chambers &<br />
Hitchcock, 1963). A typical response time to red signal lights is shown in<br />
figure 4-32 (Kaehler & Meehan, 1960). The two curves show mean response<br />
times (the time from appearance of a red signal light to the movement of the<br />
subject's hand from his lap) for five male college students, 20 to 25 years old,<br />
exposed to transverse accelerations. The solid line in the figure shows the<br />
combined response times for both right and left hand operation in more than<br />
900 (+Gx) exposures up to +8 G x. The dashed line shows the combined response<br />
times for both right and left hand operation in more than 500 (-Gx)<br />
exposures up to -4 G x. The times required to reach and operate a horizontal<br />
lever, a toggle switch, and a pushbntton were longer as the accelerations<br />
increased, and variable times were recorded for left and right hand operation.<br />
Still longer times were needed for adjusting a rotating knob and a vertical "trim"<br />
wheel.<br />
Reading Tasks. In a study by Warwick and Lund (1946), 24 percent of dial<br />
readings were erroneous at +3 Gz as compared with 18 percent at 1 1/2 Gz and 0<br />
percent at 1 G. The response under acceleration varies with luminance, as<br />
previously noted. This variation in response is reflected in dial reading, as shown<br />
iu figure 4-33 (White & Riley, 1958).
180 Bioastronautics Data Book<br />
E<br />
Z<br />
20 • •<br />
,',- ,5 _.;<br />
_,0 _<br />
5<br />
0<br />
O 2 6 B I0 12<br />
TIME TO TOLERANCE (rain)<br />
Figure 4-31. Protection against transverse(+Gx) acceleration afforded<br />
by water imersion, net support, and contour couch. (Bond_ant ct al., 1958b)<br />
A u<br />
LU<br />
I--<br />
LU<br />
Z<br />
0<br />
0.<br />
nl<br />
W<br />
Z<br />
<<br />
°'361<br />
0.32<br />
0.28<br />
0.24<br />
J<br />
Ox//<br />
0.20 I t t<br />
0 2 4 6 8<br />
ACCELERATION (G x units)<br />
Figure 4-32. Visual reaction time to red signal lights for subjects<br />
exposed to +G x acceleration. (After Kaehler & Meehan, 1960)<br />
•
Body Motion<br />
7O<br />
60
182 Bioastronautics DataBook<br />
Control and Tracking<br />
Control maneuvers involving gross motions of limbs are not practicable<br />
above 3 to 4 G, and become impossible, as noted above, as acceleration<br />
increases. Movement of hand controls is impaired relatively little, however, at<br />
high accelerations. The general characteristics of side-arm controllers and the<br />
general response to tracking task are shown in figures 4-34 through 4-42.<br />
Higher Mental Function<br />
Relatively little information is available on higher mental function. Increased<br />
time is required to complete multiplication tests at +3 G z for 2 to I0 minutes as<br />
compared with performance without imposed acceleration (Frankenhaeuser,<br />
1958). A decrement in color-naming has been observed during l-minute trials at<br />
+3 Gz, although no decrement was noted in arithmetic ability, number ranking,<br />
mid word separation tests in the same series (Wilson et al., 1951). According to<br />
Chambers (1963), repetitive memorization of a portion of a sequence of random<br />
numbers was satisfactorily undertaken at +5 Gx but the subjects involved stated<br />
that the concentration required at +5 Gx was much greater than at 1 G.<br />
Chambers also found in the same series of experiments that immediate memory.<br />
was unaffected to +5 Gx but impaired at +7 G x and above.<br />
AX_S ROLL<br />
AXIS ROLL<br />
2-AXIS, FINGER TiP 2-AXIS, HAND<br />
CONTROLLER CONTROLLER<br />
YAW<br />
AXIS<br />
PITCH<br />
AXIS<br />
3-AXIS, BALANCED _AXIS, UNBALANCED<br />
CONTROLLER CONTROLLER<br />
Figure 4-34. Four types of right hand, side-arm controllers. Under acceleration each<br />
responds differently. Pilot performance is influenced by both acceleration and type of<br />
control stick. (Chambers & Hitchcock, 1963)<br />
P_TCH<br />
AXIS
?o<br />
bo<br />
50<br />
40<br />
3o<br />
20<br />
IO<br />
o<br />
-Io<br />
-20<br />
Sustained Linear Acceleration 183<br />
• )-axis, typeI<br />
• 3-axis, type II<br />
+ Z-axis, typeII I<br />
• Z-axis. typeIV<br />
o 2-axis. typeV<br />
4-<br />
o<br />
Oa. 6a. -2a,<br />
la, Ca, _4a.<br />
ACCELERATION F IE LD<br />
Figure 4-35. Mean pilot efficiency scores using various sidearm controllers<br />
in different acceleration fields. (After Chambers, 1961)<br />
(.9<br />
Z<br />
<<br />
S<br />
0-<br />
2<br />
3<br />
4<br />
5<br />
6<br />
7<br />
8<br />
9<br />
10<br />
÷<br />
O<br />
o+<br />
Ik<br />
'= 3-axis, type I<br />
_. 3-axis, type II<br />
+ Z-axis, type III<br />
o Z-axis, type V<br />
i _ I I I I<br />
Oa. 6a. -2a. Oa. 6a. -2a.<br />
la. Oa. _la. la. On. 4,1.<br />
ACCELERATION FIELD<br />
Figure 4-36. Mean pilot ratings of vehicle controllability<br />
with different side-arm controllers. (After Chambers, 1961)
184 Bioastronautics DataBook<br />
><br />
"o<br />
cq<br />
180<br />
160<br />
140<br />
120<br />
100<br />
80<br />
60<br />
40<br />
2G<br />
• 3-axis, type I<br />
A 3-axis. type I!<br />
+ 2-.lxis, type II I<br />
• Z-axis, type IV<br />
o 2-,lxis, type V<br />
o<br />
+ ÷<br />
4,<br />
o<br />
,e.<br />
I i I<br />
Ca. 6a, -2a,<br />
ls, 0a,<br />
ACCELERATION FIELD<br />
Figure 4-37. Roll error scores for pilots performing tracking task in<br />
differing acceleration fields, using differing controllers. (After Chambers, 1961 )<br />
"F-<br />
100 I<br />
z 20 ........<br />
.11<br />
,o ed<br />
.20<br />
--'moderately _---<br />
cross-coupled _<br />
o 3-AXIS BALANCED<br />
• 3-AXIS UNBALANCED_<br />
• 2-AXIS, FINGER<br />
• 2-AXIS, HAND<br />
_Well _"_<br />
dGmped_<br />
moderately --_" -cross-coupled<br />
*6Gx '6G x -2G x -2G x<br />
0G z 0G z +4Gz +4Gz<br />
Figure 4-38. Mean tracking efficiency scores, influenced by type of controller, amount<br />
of damping and cross coupling, and acceleration vector. (After Chambers & Ititchcock,<br />
1963)<br />
÷
o i<br />
12.0<br />
m I0.0<br />
0<br />
rv<br />
t'v<br />
ILl<br />
,,, 8.0<br />
i.=<br />
r¢<br />
0<br />
tl.l<br />
I- 6.0<br />
z<br />
Z<br />
LLI<br />
:_ 4.0<br />
2.C<br />
Sustained Linear Acceleration 185<br />
/<br />
/ .... ;2-Y-2<br />
O 3.0 6.0<br />
TRANSVERSE ACCELERATION--Gx<br />
Figure 4-39. Mean integrated error in tracking display varying in x-axis, as a function<br />
of increased acceleration and various timelag constants. Error is caused by both<br />
changing timelag constants and acceleration. (After Kaehler, 1961)<br />
u<br />
+ z<br />
t_J <<br />
)<br />
cc<br />
o<br />
,,=,<br />
tic<br />
28O<br />
260<br />
240<br />
_ 220<br />
_u<br />
487-858 0 73 - 13<br />
ws0<br />
160<br />
_- 140<br />
120<br />
100-<br />
0<br />
2 4 6<br />
/I,<br />
t+ Gx<br />
s<br />
/ ,i'<br />
ACCELERATION - G units<br />
• • PITCH -EXTERNALLY<br />
DISTURBED;<br />
YAW-CONTROLLABLE<br />
(HAND CONTROLLER) -<br />
o PITCH _ EXTERNALLY<br />
a ROLL _ DISTURBED<br />
YAW ! IN ALL AXES<br />
L -- -+Gx<br />
I0 12 14 16<br />
Figure 4-40. Tracking with side-arm controllers;<br />
effect of changing pilot task. (After Crecr et al., 1962)
186 Bioastronautics Data Book<br />
50<br />
40<br />
Lu 5<br />
34<br />
33<br />
ACCELERATION (G}<br />
Figure 4-41. Effect of high sustained +G z and -+G x acceleration<br />
on root4nean-square tracking error. (After Creer, 1966)<br />
0 I 2 4 6 8 10 12 14 _6 16 14 12 10 8 6 4 2 1<br />
TRANSVERSE ACCELERATION--Gx<br />
Figure 4-42. Tracking performance decrement, using 3.5 mm target in dual pursuit<br />
task, in two subjects exposed to -16G x acceleration profile simulating reentry. (After<br />
Clarke et al., 1959)
Sustai_led Linear Acceleration i 87<br />
References<br />
Alexander, W. C., Sever, R. J., & Hoppin, F. G. tlypoxemia induced by sustained forward<br />
acceleration in pilots breathing pure oxygen in a five pounds per square inch absolute<br />
environment. NASA-TM-X-51649, National Aeronautics and Space Administration,<br />
Washington, D.C., 1965.<br />
Andina, F. "Schwarzsehen" als Ausdruk yon Blutdruckschwankungen bei Sturzflugen.<br />
Schweiz. Med. Wchnschn., 1937, 67, 753-756.<br />
Barr, P. O. Hypoxemia in man induced by prolonged +G z acceleration. Acta Physiologica<br />
Scandinavica, 1962, 54, 128.<br />
Beckman, E. L., Duane, T. D., & Coburn, D. R. Limitation of ocular motility and pupillary<br />
dilatation in humans due to positive acceleration. NADC-MAYo-140, Naval Air<br />
Development Center, Johnsville, Pennsylvania, 1961.<br />
Bondurant, S., Blanchard, W. G., Clarke, N. P., & Moore, F. Effect of water immersion on<br />
human tolerance to forward and backward acceleration. WADC-TR-58-290, Wright-<br />
Patterson Air Force Base, Ohio, July 1958. (b)<br />
Bondurant, S., Clarke, N. P., Blanchard, W. G., Miller, H., tiessberg, R. R., & Hiatt, E. P.<br />
Human tolerance to some of the accelerations anticipated in space flight. USAF Armed<br />
Forces Medical Journal, 1958, 9, 1093. (a)<br />
Brannstein, M. L., & White, W. J. The effects of acceleration on brightness discrimination.<br />
Journal of the Optical Society of America, 1962, 52, 931-933.<br />
Brent, H. P., Carey, T. M., Powell, T. J., Scott, J. W., Taylor, W. J. R., & Franks, W. R.<br />
Synergism between effects of hyperventilation, hypoglycemia, and positive acceleration.<br />
Aerospace Medicine, 1960, 31,101.<br />
Brown, J. L., & Burke, R. E. Effect of positive acceleration on visual reaction time.<br />
NADC-MA-5712, Naval Air Development Center, Johnsville, Pennsylvania, 1957.<br />
Browne, M. K., & Fitzsimmons, J. T. Electrocardiographic changes during positive<br />
acceleration. FPRC-IO09, Royal Air Force, Ministry of Defence, London, 1957.<br />
Bryan, A. C., & MacNarnara, W. D. The effect of acceleration on the distribution of<br />
pulmonary blood flow. RCAF SAM Rept. 64-RD-8, Institute of Aviation Medicine,<br />
Royal Canadian Air Force, 1964.<br />
Canfield, A. A., Comrey, A. L., & Wilson, R. C. A study of reaction time to light and sound<br />
as related to positive radial acceleration. Journal of Aviation Medicine, 1949, 20, 350.<br />
Chambers, R. M. Control performance under acceleration with side-arm controllers.<br />
NADC-MA-6110, Naval Air Development Center, Johnsville, Pennsylvania, 1961.<br />
Chambers, R. M. Long-term acceleration and centrifuge simulation studies. Aviation Medical<br />
Acceleration Laboratory, Naval Air Development Center, Johnsville, Pennsylvania,<br />
1963.<br />
Chambers, R. M. Acceleration. In P. Webb (Ed.), Bioastronauties Data Book. NASA<br />
SP-3006, National Aeronautics and Space Administration, Washington, D.C., 1964.<br />
Chambers, R. M., & Hitehcock, L. The effects of acceleration on pilot performance.<br />
NADC-MA-6219, Naval Air Development Center, Johnsville, Pennsylvania, 1963.<br />
Chambers, R. M., & Kerr, R. Effects of positive pressure breathing on performance during<br />
acceleration. NADC-M A-6308, Naval Air Development Center, J ohnsville, Pennsylvania,<br />
1962.<br />
Christie, R. L. Effects of radial and angular accelerations, ln: H. G. Armstrong (Ed.),<br />
Aerospace Medicine. Baltimore: Williams and Wilkins Co., 1961.<br />
Clark, C. C. Observations of a human experiencing 2 G for 24 hours. Paper presented at 31st<br />
Annual Meeting of the Aerospace Medical Association, Bell llarbor, Florida, 1960.
188 Bioastronautics Data Book<br />
Clark, C. C., Gray, R. F., Hardy, J. D., & Smith, F. K. A discussion of restraint and<br />
protection of the human experiencing the smooth and oscillating acceleration of<br />
proposed space vehicles. NADC-MA-5914, Naval Air Development Center, Johnsville,<br />
Pennsylvania, 1959.<br />
Clarke, N. P., Hyde, A. S., Chemiak, N. S., et al. Preliminary report of human response to<br />
rearward-facing re-entry accelerations. WADC-TN-59-109, Wright-Patterson Air Force<br />
Base, Ohio, 1959.<br />
Coehran, L. B., Gard, P. B., & Norsworthy, M. E. Variation in human G tolerance to positive<br />
acceleration. SAM Rept. 001-059.02.10, Naval School of Aviation Medicine, Pensacola,<br />
Florida, 1954.<br />
Code, C. F., Wood, E. H., Sturm, R. E., & Lambert, E. H. The sequence of physiological<br />
events in man during exposures to positive acceleration. Federation Proceedings, 1945,<br />
4,04).<br />
Coermann, R. R. The mechanical impedance of the human body in sitting and standing<br />
positions. In Human vibration research. London: Pergamon Press, 1963.<br />
Collins, C. C., Crosbie, R. J., & Gray, R. F. Letter report concerning pilot performance and<br />
tolerance study of orbital re-entry acceleration. NADC-LR-64, Naval Air Development<br />
Center, Johnsville, Pennsylvania, 1958.<br />
Collins, C. C., & Gray, R. F. Letter report concerning pilot performance and tolerance<br />
studies of re-entry acceleration. NADC-LR-90, Naval Air Development Center, Johnsville,<br />
Pennsylvania, 1959.<br />
Crcer, B. Y. Pilot performance during acceleration. In P. I. Altman and D. S. Dittmer (Eds.),<br />
Endronmental biology. AMRL-TR-66-194, Wright-Patterson Air Force Base, Ohio,<br />
1966.<br />
Creer, B. Y., Stewart, J. D., & Dourullier, J. G. Influence of sustained linear accelerations on<br />
certain pilot-performance capabilities. Aerospace Medicine, 1962, 33, 1086-1093.<br />
Duane, T. D. Observations on the fundns oculi during blackout. A.M.A. Archives of<br />
Ophthalmology, 1954, 51,343.<br />
Franks, W. R., Kerr, W. K., & Rose, B. Some neurological signs and symptoms produced by<br />
centrifugal force in man. Journal of Physiology, 1945, 104, 10-11.<br />
Frankenhacnser, M. Effects of prolonged gravitational stress on performance. Acta<br />
Psychologica, 1958, 14, 92.<br />
Fraser, T. M. Human response to sustained acceleration. NASA SP-103, National<br />
Aeronautics and Space Administration, Washington, D.C., 1966.<br />
Gamble, J. L., Shaw, R. S., Hem'?, J. P., & Ganer, O. H. Cerebral dysfunction during<br />
negative acceleration. Journal of Applied Physiology, 1949, 2, 133.<br />
Gauer, O. H., & Henry, J. P. Negative (-Gz) acceleration in relation to arterial oxygen<br />
saturation, subendocardial hemorrhage and venous pressure in the forehead. Aerospace<br />
Medicine, 1964, 35, 533-545.<br />
Glaister, D. H. Acceleration atelectasis-some factors modifying its occurrence and<br />
magnitude. FPRC/Memo 220, Royal Air Force, Ministry of Defence, London, 1965.<br />
Glaister, D. H. Breathing. Nature, 1961, 192, 106-108.<br />
Glaister, D. H. The effect of positive centrifugal acceleration upon the distribution of<br />
ventilation and perfnsion within the human lung, and its relation to pulmonary arterial<br />
and intraoesophageal presmres. Proceedings of the Royal Society, B, 1967, 168,<br />
311-334.<br />
Glaister, D. H. Pulmonary gas exchange during positive acceleration. FPRC-1212, Royal Air<br />
Force, Department of Defence, London, 1963.<br />
Gray, R. F., & Webb, M. G. High G protection. NADC-MA-5910, Naval Air Development<br />
Center, Johnsville, Pennsylvania, 1960.
Sustained Linear Acceleration 189<br />
Gray, R. F., & Webb, M. G. High G protection. Aerospace Medicine, 1961, 32, 425.<br />
Kaehler, R. C. The effects of transverse accelerations and exponential time-lag constants on<br />
compensatory tracking performance. ASD-TR-61-457, Wright-Patterson Air Force Base,<br />
Ohio, 1961.<br />
Kaehler, R. C., & Meehan, J. P. Human psychomotor performance under varied transverse<br />
acceleration. WADC-TR-60-621, Wright-Patterson Air Force Base, Ohio, 1960.<br />
Leverett, S. D. Biodynamies. USAF SAM Medical Services Digest, 1968, 19, 23.<br />
Lindberg, E. F., & Wood, E. H. Acceleration. In J. H. U. Brown (Ed.), Physiology of man in<br />
space. New York and London: Academic Press, 1963.<br />
Miller, H., Riley, M. B., Bondurant, S., & Hiatt, E. P. The duration of tolerance to positive<br />
acceleration. Aerospace Medicine, 1959, 30, 360.<br />
Newsom, W. A., & Lcverett, S. D. Retinal circulation in man during centrifugal acceleration.<br />
Transactions of the American Academy of Ophthalmology and Otolaryngology,<br />
Jan.-Feb. 1968, 39-49.<br />
Nicholson, A. N., & Franks, W. R. Devices for protection against positive (long axis)<br />
acceleration. In P. 1. Airman and D. S. Dittmcr (Eds.), Environmental biology.<br />
AMRL-TR-66-194, Wright-Patterson Air Force Base, Ohio, 1966.<br />
Peterson, R. L. Personnel seating research for Air Force aerospace vehicles. SAE.85IC,<br />
presented at the Air Transport and Space Meeting, New York, April 1964.<br />
Rogge, J. D., Moore, W. W., Segar, W. E., & Fasola, A. F. Effect of +Gz and +G x<br />
acceleration on peripheral venous ADH levels in humans. USAF SAM TR-67-286,<br />
School of Aerospace Medicine, Brooks Air Force Base, Texas, 1967.<br />
Ross, B. M., Chambers, R. M., & Thompson, R. R. Effects of transverse acceleration on<br />
performance of two running matching memory tasks. NADC-MA-6309, Naval Air<br />
Development Center, Johnsville, Pennsylvania, 1963.<br />
Rutishauser, W. J., Banchero, N., Tsakiris, A. G., & Wood, E. H. Effect of gravitational and<br />
inertial forces on pteural and esophageal pressures. Journal of Applied Physiology, 1967,<br />
22, 1041-1051.<br />
Ryan, E. A., Kerr, W. K., & Franks, W. R. Some physiological findings on normal men<br />
_bjected to negative G. Journal of Aviation Medicine, 1950, 21,173.<br />
Sere-Jacobsen, C. W. Electroencephalographic study of pilots stressed in flight. Aerospace<br />
Medicine, 1959, 30, 797-801.<br />
Sere-Jacobsen, C. W. Recording of in-flight stress in jet fighter planes. Aerospace Medicine,<br />
1960, 31,320.<br />
Smedal, H. A., Rogers, T. A., Duane, T. D., Iloiden, G. R., & Smith, J. R. The physiological<br />
limitations of performance during accelerations. Aerospace Medicine, 1963, 34, 48.<br />
Stauffer, F., & Erroho-Knudsen, E. O. Positive acceleration and urine output. SAM Rept.<br />
NM 001.059.02.04, Naval School of Aviation Medicine, Pensacola, Florida, 1953.<br />
Stoll, A. M. Human tolerance to positive G as determined by the physiological end-points.<br />
Journal of Aviation Medicine, 1956, 27, 356.<br />
Teichner, W. H., & Craig, R. L. Some human tolerance limits to several environmental<br />
s_esses of an Apollo mission: Compendium. NASA Grant NGR 22-007-070, Guggenhelm<br />
Center for Aerospace Health and Safety, Harvard School of Public tlealth, Boston,<br />
Massachusetts, 1966.<br />
Vogt, H. L., Coermann, R. R., & Fust, H. D. Mechmtieal impedance of the sitting human<br />
under sustained acceleration. Aerospace Medicine, 1968, 39, 675-679.<br />
Vykukal, H. C., Gallant, R. P., & Stinnett, G. W. An interchangeable, mobile, pilot-restraint<br />
system, designed for use in high sustaincd acceleration force fields. Aerospace Medicine,<br />
1962, 33, 279-285.
190 _oa_ronauti_ Data Book<br />
Warwick, M. J., & Lund, D. W. Effect of moderate positive acceleration on ability to read<br />
aircraft-type instrument dials. WADC-MR-694-10, Wright-Patterson Air Force Base,<br />
Ohio, 1946.<br />
Watson, J. F., Cherniak, N. S., & Zechman, F. W. Respiratory mechanics during forward<br />
acceleration. Journal of Clinical lmw_stigation, 1960, 39, 1737.<br />
White, W. J. Variations in absolute visual threshold during acceleration stress.<br />
WADC-TR-60-34, Wright-Patterson Air Force Base, Ohio, 1960.<br />
White, W. J., & Riley, M. B. Effects of positive acceleration on the relation between<br />
illumination and instrument reading. WADC-TR-5B-332, Wright-Patterson Air Force<br />
Base, Ohio, 1958.<br />
Wilson, R. C., Bryan, G. L., Green, G. A., Willmorth, N. E., Canfield, A. A., & Warren, N. D.<br />
After effects of intermittent positive radial acceleration. Journal of Atiation Medicine,<br />
1951, 22, 509-517.<br />
Wood, E. H. Some effects of gravitational and inertial forces on the cardiopulmonary<br />
system. Aerospace Medicine, 1967, 38, 225-233.<br />
Wood, E. H., Lambert, E. H., Baldes, E. J., & Code, C. F. Effects of acceleration in relation<br />
to aviation. Federation Proceedings, 1946, 5, 327.<br />
Wood, E. H., Nolan, A. C., Donald, E. E., & Cronin, L. Influence of acceleration on<br />
pulmonary physiology. Federation Proceedings, 1963, 22, 1024.<br />
Wood, E. H., Sutterer, W. F., Marshall, H. W., Lindberg, E. F., & Headley, R. N. Effect of<br />
headward and forward accelerations on the cardiovascular system. WADC-TR-60-634,<br />
Wright-Patterson Air Force Base, Ohio, 1961.<br />
York, E., Oleynick, R. J., & Patton, R. M. Human acceleration experience at the Aerospace<br />
Medical Research Department, Naval Air Development Center, Johnsville, Pennsylvania,<br />
January 1961-30 December 1965. Aerospace Medicine, 1968, 39, 68-71.<br />
Zarriello, J. J., No, worthy, M. E., & Bower, H. R. A study of early grayout thresholds as an<br />
indicator of human tolerance to positive radial accelerator,/force. Project NM-11-02-11,<br />
Report #1, Naval School of Aviation Medicine, Pensacola, Florida, 1958.<br />
Zechman, F. W., Cherniak, N. S., & Hyde, A. S. Ventilatory response to forward<br />
acceleration. Journal of Applied Physiology, 1960, 15, 907.
CHAPTER 5<br />
ROTARY ACCELERATION<br />
by<br />
T. Morris Fraser, M. Sc., M.D.<br />
University of Waterloo<br />
Waterloo, Ontario, Canada<br />
Rotary acceleration is defined as the acceleration which exists during angular<br />
motion when the axis of motion passes through some part of the body.<br />
Consequently, it is a manifestation of angular acceleration, and is always present<br />
during steady state spinning or tumbling, even when the angular velocity is<br />
constant. The problems related to the acceleration environment of rotating<br />
chambers, rooms, tables, and short radius centrifuges in which the axis of<br />
rotation is not through the body are not considered here. These are discussed in<br />
chapter 12, The Vestibular System.<br />
Rotary acceleration was first noted to be a problem in the tumbling and<br />
spinning that occurred during the deployment of early aircraft ejection seats,<br />
particularly during ejection at relatively high speeds. In the ejection situation,<br />
the problem is more than that of simple tumbling or spinning, since the motion<br />
may occur within a decelerative G-field, which, for short durations, may reach a<br />
peak or plateau of as much as 50 G. In a space vehicle, or during extravehicular<br />
activity, in the null gravity state, problems can arise from simple tumbling or<br />
spinning, following imparted motion by, for example, failure of a reaction<br />
control system, such as in Gemini 8 where severe tumbling was experienced.<br />
While a specific terminology for rotary acceleration has been suggested<br />
(Pesman, 1968), it is more common to use the G terminology defined in<br />
chapter 6, Impact, along with specification of the axis of rotation, where x refers<br />
to rolling, y to pitching, and z to yawing or spinning. The term tumbling is<br />
often used in place of pitching and rolling.<br />
Subjective Reactions and Tolerance<br />
Subjective reactions to rotary acceleration vary with the frequency, axis, and<br />
duration of rotation. Individual variability in response is marked. Vertigo, as<br />
Reviewed by Randall M. Chambers, Ph.D., NASA Langley Research Center.<br />
191
192 Bioastronautics Data Book<br />
manifest subjectively by dizziness, sometimes nausea, and occasionally vomiting,<br />
is a common feature of the initial and terminal phases of acceleration to and<br />
deceleration from constant angular velocity, but normally ceases after the<br />
motion has reached constant velocity, provided head movement is limited. In<br />
some individuals, it recurs during prolonged exposure. Vertigo and its associated<br />
phenomena are considered in chapter 12.<br />
Tolerance<br />
From the few reports available, tolerance to rotary acceleration does not<br />
seem to be a rectilinear function of rotation rate. Most subjects, without prior<br />
experience, can tolerate rotation rates up to 6 rpm in any axis or combination of<br />
axes. Most subjects cannot initially tolerate rotation rates in the region of 12 to<br />
30 rpm and rapidly become sick and disoriented above 6 rpm unless carefully<br />
prepared by a graduated program of exposure (Fletcher, 1968). On the other<br />
hand, rotation rates of 60 rpm for up to 3 or 4 minutes around the y-axis (pitch)<br />
and around the z-axis (spin) have been described by subjects as being not only<br />
tolerable but pleasant (Weiss et al., 1954; Urschell & Hood, 1966). Intolerability<br />
becomes manifest again at about 80 rpm in the pitch mode and at about 90 to<br />
100 rpm in the spin mode, although McCabe (1960) relates that one of the Ice<br />
Capades skating stars spins around the z-axis for 12 seconds at 420 rpm without<br />
manifest discomfort. In the pitch axis, with the center of rotation at the heart<br />
level, symptoms of negative acceleration (-Gz) are demonstrated at about 80 rpm<br />
and are tolerable for only a few seconds. Some effects of positive acceleration<br />
(+Gz), namely numbness and pressure in the legs, are also observed but develop<br />
slowly, with pain being evident at about 90 rpm. No confusion or loss of<br />
consciousness is found, but in some subjects disorientation, headache, nausea, or<br />
mental depression are noted for several minutes after a few minutes of exposure<br />
(Weiss et al., 1954). With rotation in the spin mode, when the head and trunk<br />
are inclined forward out of the z-axis, rotation becomes close to limiting at<br />
60 rpm for 4 minutes, although some motivated subjects have endured 90 rpm in<br />
the same mode (Courts, 1966). Except for unduly susceptible subjects, tolerance<br />
tends to improve with exposure. Long duration runs in the pitch mode have<br />
been endured for up to about 60 minutes at 6 rpm in selected subjects (Fletcher,<br />
1968).<br />
The center of rotation within the body determines, to a considerable extent,<br />
the nature of the resulting effects, as will be examined in connection with the<br />
discussion of physiological mechanisms. Figure 5-1 illustrates the general human<br />
tolerance to tumbling in the pitch plane with centers of rotation at the heart<br />
level and at the level of the iliac crest. On the basis of extrapolated data from<br />
dogs, Weiss and coworkers (1954) calculate that unconsciousness from<br />
circulatory effects alone would occur in man after 3 to 10 seconds at 160 rpm<br />
with the center of rotation at the heart and at 180 rpm with the center of<br />
rotation at the iliac crest.<br />
Tolerance to tumbling in the pre_nce of a superimposed G field is shown in<br />
figure 5-2.
Rotary Acceleration 193<br />
700 z SIMPLE TUMBLING: CENTER OF ROTATION AT HEART<br />
\<br />
=- -:J_ ± .o_E_ .... o'%lY UNKNOWN<br />
_'V:: \-_"',_"
194 Bioastronautics Data Book<br />
Tolerance to Gz 100 percent gradient spin is very closely related to tolerance<br />
to rotary acceleration, in that in the former the axis of rotation is tangent to the<br />
crown of the head. Figures 5-3 and 5-4 illustrate human tolerance to this form of<br />
rotary acceleration.<br />
z_ 7<br />
w<br />
L_<br />
O<br />
o_ 4<br />
z<br />
O<br />
_3<br />
er<br />
< ONE STANDARD<br />
=E<br />
X<br />
DEVIATION<br />
0 I I l 1 1 1 1<br />
10 20 30<br />
I J l I I 1 I I I l t 1 1 I 1 1 I | | I<br />
40 50 60 70 80 90 100 I tO 120 130<br />
TIME (min)<br />
Figure 5-3. Mean tolerance to 100% +Gz gradient spin for seven untrained subjects<br />
rotating around x-axis with center of rotation tangential to the head. The two isolated<br />
points represent tolerance times of a subject who utilized phydologieal countermeasures to<br />
increase his tolerance. His values are not induded in the means. (After Piemme et al., 1966)<br />
a: i<br />
O<br />
_. 8<br />
_o 6<br />
7-_z 5<br />
IE<br />
u. 3<br />
I i | I I I I I 1 I i I<br />
10 20 _ 40 50 60 70 80 90 tOO 110 120<br />
TIME Ira,n)<br />
Figure 5--4. Semilogarithmic plot of mean tolerance time vs acceleration at the feet during<br />
exposure to +Gz 10(F/o spin around the x-axis with center of rotation tangential to the head.<br />
(After Piemme et at., 1966)
Rotary Acceleration 195<br />
Pain and discomfort are not features of slow rotation but begin to bc<br />
manifest at about 80 rpm in the pitch and roll axes, largely because of fluid<br />
swelling of tissues from the imposed +G fields (Weiss et al., 1954). Even in the<br />
z-axis at these rotation rates, discomfort can be severe in the seated posture<br />
because of the hydrostatic gradient that develops along the forearms and<br />
thighs (Urschell & Hood, 1966).<br />
Perception<br />
The threshold of perception, or awareness, for rotary acceleration is in<br />
fact a measure of vestibular sensitivity, but warrants brief consideration<br />
here. Using a one-degree-of freedom simulator that could produce angular<br />
accelerations within narrow limits of error, Clark and Steward (1969)<br />
examined perception thresholds in the yaw axis in the erect seated position<br />
at the center of rotation with head fixed. Figure 5-5 shows the distribution<br />
of thresholds in 53 normal male subjects under these conditions.<br />
Table 5-1, from a review by Clark (1967), details the findings of<br />
25 studies on perception of angular acceleration in man. Clark points out<br />
that in evaluating the findings in the table, one must bear in mind the<br />
miscellany of definitions of threshold, the variation in rotation devices, and<br />
psychophysical methods. In general, the results indicate an extreme<br />
sensitivity to angular acceleration with perception thresholds varying from<br />
O.035°/see 2 to 8.2°/see 2.<br />
The relationship between a rotational input and a subjective or objective<br />
(for example, nystagmus) output may be so tenuous that time must elapse<br />
before the threshold of response is reached. Figure 5-6 indicates the latency<br />
time for perception of angular acceleration about the yaw axis, as also do<br />
figures 5-7 and 5-8.<br />
PERCEPTION<br />
OF ROTATION<br />
20 {deg/sec 2)<br />
N 53<br />
MEAN ,41<br />
STD DEV 35<br />
15 MEDIAN .32<br />
_ / I 05-2.20RANGE<br />
0 .01- .11-- .21-.31- ,41-,51- .61 .71- .81- .91-1.01 1.11-1.21-1.31-2.11-<br />
.10 .20 .30 .40 .50 .60 .70 .80 ,90 1.00 1.101,20 1.30 1.40 2.20<br />
THRESHOLD (°/sec2)<br />
Figure 5-5. Distribution of thresholds for perception of angular acceleration<br />
for 53 normal men. (After Clark& Stewart, 1969)
196 Bioastronautics Data Book<br />
e.<br />
o<br />
0D<br />
r_<br />
<<br />
<<br />
m<br />
O<br />
m o<br />
c<br />
L.<br />
r-<br />
c<br />
u<br />
.c_ _<br />
,._r')<br />
E<br />
0_<br />
a<br />
c m<br />
o<br />
0,"<br />
0¢'_1<br />
0<br />
?<br />
0<br />
0<br />
0<br />
fN<br />
0<br />
J1<br />
C<br />
"- o<br />
"r > UJ 01 Z<br />
c A _<br />
.0_ I '_ _ _r" I -,<br />
t_ _ > W r_ o<br />
_o v<br />
__.__ _ :_<br />
o- , ,,', 8<br />
,- _ ®<br />
o o _ - =<br />
z e,.,<br />
O.<br />
o _ -_<br />
r._ o®<br />
n- u,. _ uJ : Z-_<br />
c "_ _ o _<br />
tw u. -1- t_ z r_<br />
e'. _.. 0 ,.___ Q.<br />
-__ _ z _<br />
,-<br />
..j<br />
C<br />
0<br />
0<br />
_- _" _6'_<br />
em<br />
r.<br />
u<br />
N<br />
LD<br />
E _ "_<br />
0<br />
o<br />
0<br />
e.<br />
I<br />
n.- .,: n- _ E<br />
r"<br />
u<br />
8 _<br />
o
.z<br />
0<br />
o4<br />
Z e,<br />
f_ Ot_<br />
I_LO<br />
Ot_<br />
0 "0<br />
"I- _t'N<br />
0<br />
.__<br />
_J<br />
OCO<br />
_m<br />
0 co<br />
%<br />
0<br />
0<br />
0<br />
Rotary Acceleration 197<br />
E '-to<br />
_ o _ -z -6<br />
.l<br />
o o '- _ _ oE_<br />
o<br />
0 OZ "r "I" _JO rf<br />
' =E ._:._,.,_,<br />
& o _ _ o> _,_ z_<br />
6 _r >- "r 6o_<br />
•-- _ ,-<br />
_ = = _ _.-_.-<br />
_O.o-0 _:-_ -" -°o _ zZ_<br />
6_ m'_ - u_ > o _ _ '_<br />
-b,.- E<br />
o_ "_ 0 >.<br />
0,__ 0 ,_ ° _<br />
_<br />
_<br />
.-.-=<br />
_°--_<br />
O0 r_ "r "I" _ (J I- .- _ _<br />
OtNt<br />
%<br />
6<br />
%<br />
= _ _ "_ -6<br />
._o , _ _ _ , _._,<br />
B o B<br />
fr -r "I- _ (3<br />
_ e o._,<br />
_ ,s o 5<br />
o<br />
o-,? ,,,° #6 6 o .
198 Bioastronautics Data Book<br />
t-<br />
c_<br />
t-<br />
O<br />
4.b<br />
o<br />
c_<br />
o<br />
"O<br />
g_<br />
¢-<br />
8_<br />
QI<br />
0 e-<br />
T<br />
®_<br />
o<br />
u<br />
6<br />
¢J<br />
c_<br />
o .__<br />
6 _ g<br />
•_-_<br />
0 0 0<br />
d I1: u.<br />
-fi<br />
c_ _ o - _<br />
:? z _ ®<br />
u_ o. >- _ "1"<br />
' N<br />
O tW >. 1" 7"<br />
0 '- 0<br />
0 0<br />
o<br />
• _<br />
0_<br />
__ _o<br />
_ ._ co _-.<br />
0<br />
-r "1-__ _. tO<br />
O<br />
_: ,,_ _.o<br />
o _ _<br />
g<br />
O.<br />
E<br />
co<br />
It"<br />
_o<br />
c c<br />
.-.0<br />
_'_<br />
C<br />
.9<br />
r_ _ 8._'<br />
.o g o_ t.O_0<br />
0 ¢9 ¢.9 _ r,,.'O<br />
e-<br />
4- 0<br />
O_<br />
- _ _<br />
o _ o<br />
>o -g m<br />
ii<br />
E o .- _, _<br />
_-__ _<br />
.__<br />
,_'._<br />
.-,_ _g _ .--<br />
"_ _ _--<br />
O
_-<<br />
v<br />
.=<br />
O<br />
_D<br />
e_<br />
¢g<br />
.<<br />
°_<br />
I '.:<br />
Rotary Acceleration 199<br />
0<br />
.N<br />
I<br />
r,:<br />
tO<br />
,t-<br />
6<br />
t-<br />
O<br />
¢D<br />
.S<br />
1<br />
o
200 Bioastronautics Data Book<br />
• • KJ<br />
j<br />
I I i i I L<br />
(:)as) 31,_111 AON31V7<br />
• • x0 "<br />
7<br />
t<br />
.7 x<br />
o<br />
_%<br />
0 0<br />
0<br />
Z<br />
0<br />
k-<br />
W<br />
-J<br />
Q -J<br />
Z<br />
<<br />
(D<br />
<br />
II II<br />
E E<br />
2 o<br />
??<br />
11 II<br />
x •<br />
r_<br />
0<br />
__=<br />
_z<br />
0 0<br />
e-,<br />
e',<br />
,d I<br />
.._<br />
r_
g<br />
>-<br />
U<br />
z<br />
ill<br />
k--<br />
<<br />
_J<br />
35<br />
iI<br />
30 k •<br />
25<br />
Rotary Acceleration 201<br />
Ik° • 75% CORRECT<br />
[_ JUDGMENTS<br />
k_ o RESPONSE<br />
LATENCY<br />
.\<br />
10 _ •<br />
• o<br />
•01 .02 .03 .05 .1 .2 .3 .4 .5<br />
ANGULAR ACCELERATION (YAW) - deg/$ec 2<br />
_<br />
1.0 2.0 3.0 5.0 10<br />
Figure 5-7. Perception of angular accderation: Time required to judge direction of<br />
rotation about yaw axis as a function of angu|ar acceleration. Solid points indicate time to<br />
make judgments that are correct 75% of the time; open points = time to make judgments,<br />
correct or incorrect. (After Chambers (1964), adapted from others)<br />
t/1<br />
z<br />
o<br />
rt<br />
UJ<br />
p-<br />
U<br />
u.I<br />
rw<br />
tw<br />
O<br />
U<br />
p-<br />
Z<br />
t_<br />
u<br />
r_<br />
Lu<br />
n<br />
9O<br />
8O<br />
7O<br />
6O<br />
t 1<br />
0 .3 .4 .5 .6 .7<br />
YAW ACCELERATION - deg/sec 2<br />
Figure 5-8. Perception of angular acceleration. Correct direction-of-rotation judgments,<br />
expressed as percent of total, are plotted as a function of angular rotation (continuous line);<br />
75% correct point is considered threshold. Also included (dashed line) is plot of 75% correct<br />
response from figure 5-7. (After Chambers, 1964, from data of others)<br />
487-858 0 73 - [4<br />
J
202 Bioastronautics Data Book<br />
Performance During Rotary Acceleration<br />
Relatively few studies have been conducted to determine performance<br />
ability during rotary acceleration, that is, with the axis of rotation passing<br />
through the body, although numerous investigations have been conducted in<br />
rotating rooms and short radius centrifuges. Much of the work on performance<br />
bas been done in connection with investigation of the vestibular %,stem and is<br />
presented in that chapter.<br />
Visual Acuity<br />
During natural turning movements, vestibular and visual sensory inflow act<br />
synergistically to maintain clcar vision. Guedry (1968) measured visual acuity<br />
during rotary acceleration around the z-axis in seated subjects, with particular<br />
reference to the presence and intensity of concurrent nystagmus. The results are<br />
shown in figure 5-9. Rate of recovcry of visual acuity is related to the magnitude<br />
of the preceding stimulus, the stronger stimuli requiring Iongcr recovery times.<br />
In further testing, subjects were decelerated from an angular velocity of<br />
-180°/sec through 0 to +180°/sec at ratcs of 10 °, 15°, or 30°/see 2 for 18, 12,<br />
or 6 seconds, respectively, and visual acuity examined throughout the process.<br />
Results are shown in figure 5-10, which indicates the buildup of nystagmus and<br />
loss of visual detail during each of thc three stimuli, as well as the dccline of<br />
nystagmus and restoration of visual detail following each stimulus. Considerable<br />
individual difference was found among the IBsubjects, as indicated in<br />
figure 5-1 1.<br />
100r<br />
90_<br />
8o!<br />
7oi<br />
60,<br />
S _....<br />
m .<br />
_ _oF<br />
>" B-<br />
Z<br />
ot f<br />
LIGHT ON<br />
VELOCITY<br />
IN DARK<br />
MEAN VISUAL ACUITY CURVES<br />
SCALE CHANGE ioO 3 15%s_2 3oO r_¢2 ,_<br />
. _ , ,- :1o_8<br />
'_ _ _ " " /" MEAN NYSTAGMUS<br />
__ • j _[<br />
..... _, _ ,o°,,,.a -Jo _:z<br />
1 2 3 4 5 6 7 8 9 10 11<br />
TIME (sec)<br />
Figure 5-9. Decline of nystagmus and recovery of visual acuity following 10, 15, and<br />
30°/see 2 stimuli. Values are measures of means taken in initial acceleration and final<br />
deceleration of each trial. (After Guedry, 1968)
to<br />
5 t<br />
........ :-..'-': IF. .......<br />
25<br />
10 _lO .30 (' 5 10 15 20<br />
Rotary Acceleration 203<br />
,x<br />
.o.-I<br />
j 5 . II<br />
I "<br />
._ i, o , . i , 1°*o%.<br />
. ..-°" J .I<br />
i<br />
I0 20 _'<br />
I0$ 5 I0 15 20<br />
TIME (sect<br />
75<br />
g<br />
, _<br />
so<br />
*'" z<br />
i •<br />
$ I0 15 20<br />
Figure 5-10. Loss of recovery of visual acuity during and after nysta_mus from stimuli of<br />
different magnitudes. Blank areas were inserted in 15°/sec 2 and 30°/sec2results to<br />
compensate for differences in duration of stimuli and to aid in visual comparison of results.<br />
Dots are nysta_mus; solid lines are visual measures; arrow marks end of stimulus. (After<br />
Guedry, 1968)<br />
_15.<br />
I<br />
TARGET LOSS TARGET RECOVERY<br />
OURING ACCELERATION AFTER ACCELERATION<br />
1(1 lO°/r'ec2<br />
15 i<br />
5 10 15 20 25 30 SEC 351 5 I0 15 20<br />
• sMALLE ST SEt<br />
• LARGESt SET<br />
0 $SEC I0 f TIME 0 5 10 15<br />
STIMULUS<br />
t5°_c 2<br />
Figure 5-11. Number of subjects seeing each set of visual targets during each second of<br />
three different intensities of acceleration stimulus (10, 15, and 30°/see 2) from -180°/see<br />
through zero to + 180°/sec. (After Guedry, 1968)<br />
STIMULUS<br />
30°/_2<br />
STIMULUS
204 Bioastronautics Data Book<br />
Operational Tasks<br />
Using the Rotational Flight Simulator (RFS) of the U. S. Air Force School<br />
of Aerospace Medicine, an air-bearing vehicle capable of simulating various<br />
rotational profiles, Lim and Fletcher (cited in Rothe et al., 1967) investigated<br />
the time required for subjects to restore the simulator to a preset position by<br />
means of a joystick after exposure to various rotations. The profiles used were a<br />
"slow random" rotation of 4 +-2 rpm and a "fast random" rotation of 12 +4 rpm<br />
for periods of 2, 4, 8, 16, and 30 minutes. Representative results from one<br />
subject are shown in figure 5-12. Data from three subjects indicate they had<br />
different abilities in righting the RFS, that fast improvement occurred with<br />
practice, and that righting time was increased with duration of tumbling and<br />
increase of "randomness."<br />
t_<br />
I-<br />
=o<br />
_t: 15<br />
343-<br />
[]<br />
2oj<br />
10<br />
i<br />
1 2 3 4 5 6 ?<br />
TRIAL NUMBE RS<br />
] RANDOM SLOW<br />
l l<br />
Ii I I 1 1 I I I I I<br />
] RANDOM FAST<br />
5 10 15 2O 25<br />
DURATION OF TUMBLING (mln)<br />
Figure 5-12. Performance of control task during slow and fast random rotation; (A) time<br />
required in successive trials to bring back RFS to upright position from initial position;<br />
(B) righting time plotted as a function of duration of random tumbling at a slow rate;<br />
(C) fighting time plotted as a function of duration of random tumbling at a fast rate. (After<br />
Lira & Fletcher, cited in Rothe et al., 1967)
Rotary Acceleration 205<br />
It may be that a rotation rate of 6 to 12 rpm is more demanding than<br />
some higher rotations, since much higher rotations have been endured with<br />
relatively little performance decrement. Using the NASA Multi-axis Test<br />
Facility, Useller and Algranti (1963) investigated the ability of pilots to<br />
determine and apply corrective torques induced at rates up to 70 rpm.<br />
Performance error was determined as a percentage of the total time during<br />
which incorrect torque was applied. Error ranged from 6.5 percent to<br />
18 percent, depending on the individual, and was independent of the rate of<br />
rotation.<br />
In another form of operational performance task, Weiss and his<br />
colleagues (1954) examined the ability of subjects to release a lapbelt (5-1b<br />
spring tension) and pull a ripcord (20-1b spring tension) while being exposed<br />
to rotations around the y-axis (pitch) of up to 100 rpm with the center of<br />
rotation at the heart level, and up to 75 rpm with the center at the iliac<br />
crest, or hip. Results are shown in table 5-2. A slight increase in reaction<br />
time is observed during the constant speed portion of the run and during<br />
the "deceleration" phase. The effect of the deceleration phase is<br />
accentuated by requiring the subject to reach out and actuate a toggle<br />
switch before releasing the lapbelt. Results of this added test are shown in<br />
table 5-3.<br />
Numerical Processing and Coding<br />
Using a sophisticated All-Altitude Air-Bearing Research and Training<br />
Simulator (ARTS), Fletcher (1968) examined numerical processing<br />
performance during rotations of 3 to 24 rpm in eight individual axes. Tests<br />
involved simple arithmetic tasks conducted in four modes: auditory (with<br />
verbal response), visual (with remote control of presentation by subject),<br />
manipulatory (with digital manipulation of cards by subject), and
206 Bioastronautics Data Book<br />
the development of a hydrostatic pressure head along the vcctor of<br />
acceleration (see chapter4, Sustained Linear Acceleration). In rotary<br />
acceleration, however, with the axis of rotation passing through the body,<br />
two opposite vectors exist at the same time, their intensities being<br />
dependent on the site of the axis. In addition, rotation has a highly<br />
characteristic effect on the vestibular system (see chapter 12).<br />
Table 5-2<br />
Time Required for Release of Lapbelt and Parachute Ripcord<br />
During Various Phases of Rotation Around the Pitch Axis at 100 rpm<br />
Time from Switch to Lapbelt Release (sec)<br />
Subject Before Spin During Steady During<br />
Spin Deceleration After Spin<br />
R,L.<br />
H.S.<br />
R.E.<br />
H.N.<br />
R.M.<br />
J.R.<br />
E.S.<br />
J.S.<br />
H.S.<br />
AVERAGE<br />
R.L,<br />
H.S.<br />
R.E.<br />
H.N.<br />
R.M.<br />
J.R.<br />
E.S.<br />
J.S.<br />
H.S.<br />
AVERAGE<br />
(After Weiss et al., 1954)<br />
1.68<br />
1.04<br />
1.32<br />
1.06<br />
1.18<br />
1.16<br />
1.15<br />
1.31<br />
1.35<br />
1.2_<br />
1.16<br />
1.09<br />
1.30<br />
1.29<br />
1.17<br />
1.05<br />
1.10<br />
0.80<br />
1.26<br />
1.14<br />
1,8O<br />
1.10<br />
1.21<br />
1.07<br />
0.84<br />
1.12<br />
1.25<br />
1.66<br />
1.25<br />
1.40<br />
1.20<br />
0.87<br />
1.27<br />
1.37<br />
1.08<br />
t .87<br />
1.63<br />
1.33<br />
Time from Lapbelt to Ripcord Pull (sec)<br />
1.65<br />
1.30<br />
0.97<br />
1.36<br />
1.13<br />
1.43<br />
0.95<br />
1.00<br />
1.45<br />
1.25<br />
Cardiovascular-Theoretical Comiderations<br />
As noted above, the site of the center of rotation is critical in determining<br />
physiological effects. A centrifugal force directed away from the heart produces<br />
1.40<br />
1.40<br />
1.41<br />
1.73<br />
1.19<br />
0.80<br />
1.32<br />
1.30<br />
1.32<br />
1.10<br />
1.40<br />
1.27<br />
1.17<br />
1.72<br />
1.00<br />
1.70<br />
1.05<br />
1.30<br />
1.10<br />
1.30<br />
1.59<br />
1.50<br />
1.01<br />
1.21<br />
1.23<br />
1.22<br />
1.27
Rotary Acceleration 207<br />
Table 5-3<br />
Time (_c) Required to Actuate a Switch at Arm's Length<br />
in Front of Chest During Various Phases of Rotation at 100 rpm<br />
Around the Pitch Axis<br />
Subject Before Spin During Steady During After Spin<br />
Spin Deceleration<br />
R.L.<br />
H.S.<br />
R.E.<br />
H.N.<br />
R.M.<br />
J.R.<br />
E.S.<br />
H.S.<br />
AVERAGE<br />
(After Weiss et al., 1954)<br />
0.75<br />
1.04<br />
0.69<br />
0.73<br />
0.63<br />
0.76<br />
0.71<br />
1.18<br />
0.81<br />
0.80<br />
Missed<br />
1.29<br />
0.52<br />
0.60<br />
1.72<br />
0.88<br />
0.90<br />
0.96<br />
(Discounting<br />
miss)<br />
Table 5-4<br />
1.80<br />
1.70<br />
1.27<br />
1.80<br />
1.73<br />
1.66<br />
1.66<br />
Performance of Visual, Auditory, and Manipulatory Tasks<br />
During Rotation Around Various Axes<br />
Number of subjects: 17<br />
Number of test runs: 78<br />
Modes tested: Pitch<br />
Pitch forward<br />
Roll<br />
Yaw<br />
Pitch + roll<br />
Roll + yaw<br />
Pitch + yaw<br />
Pitch + roll + yaw<br />
Random<br />
Range: 3 - 24 rpm<br />
Typical results: A 21% performance decrement in four men exposed to<br />
(After Fletcher, 1968)<br />
0.90<br />
1.70<br />
0.79<br />
0.60<br />
1.07<br />
0.93<br />
0.80<br />
0.97<br />
6-rpm rotation in random axes while performing visual,<br />
auditory, and manipulating tasks
208 Bioastronautics Data Book<br />
an increment of pressure in both the venous and arterial sides of the circulatory<br />
system. Flow would continue unabated were it not for the highly distensible<br />
venous bed. When pooling in this bed is sufficient, the return of blood to the heart<br />
will be inadequate and cardiac output will fall. If this fall produces a pressure drop<br />
in the cerebral circulation greater than the increase in hydrostatic pressure occa-<br />
sioned by the rotation, cerebral hypoxia will ensue. When the center of rotation is<br />
moved towards the feet, the hydrostatic column to the foot is shortened and a<br />
lesser degree of pooling can be expected. Conversely, of course, the negative accel-<br />
eration (-Gz) effects on the cerebral circulation can be expected to increase. Move-<br />
mcnt of the center of rotation toward the head will increase the positive accelera-<br />
tion (+Gz) effects. Thus, final effects are governed by both the rate of rotation and<br />
the position of the center of rotation (Edelberg et al., 1954).<br />
Figure 5-13 is a model of hydrostatic pressure variation secondary to rotation<br />
in the pitch axis perpendicular to the Earth's gravitational field for a man 67 inches<br />
tall. The point of hydrostatic indifference is considered here to be at the level of the<br />
diaphragm.<br />
Table 5-5<br />
Performance Decrement in Four Simple<br />
Numeric Processing Tasks<br />
Rank order for four tasks at 3 rpm (pitch)<br />
1. Auditory input<br />
2. Simulated visual flying task<br />
3. Visual input<br />
4. Simulated manipulation flying task<br />
NOTES: Largest increase in time taken (auditory): 3.9 sec<br />
Smallest increase in time taken (manipulation): 2.5 sec<br />
Optimum time for test (0 rpm): 20.6 sec<br />
Change: 12% to 19%<br />
Rank order of eight rotational modes at 3 rpm (all tasks)<br />
1. Random<br />
2. Rotl + yaw<br />
3. Pitch<br />
4. Roll + pitch<br />
5. Yaw<br />
6. Roll<br />
7. Roll + pitch + yaw<br />
8. Pitch + yaw<br />
NOTES: Largest increase in time taken (random): 4.3 sec<br />
Smallest increase in time taken (pitch and yaw): 2.6 sec<br />
Optimum time for test (0 rpm): 20.6 sec<br />
Change: 12% to 21%<br />
(After Fletcher, 1968)
tOO<br />
153 " "'" • _ ....-21_iRpm_Hg<br />
A 3....<br />
EJ,<br />
121r _. . k<br />
G<br />
HEAD PRESS<br />
270 °<br />
Rotary Acceleration 209<br />
6_ 22<br />
i'" ......... RP<br />
91 cm ---_I x 9,_0 x 9_<br />
9tcm_ D<br />
o 26 _mH_<br />
PRESSURE VARIATION IN READ<br />
PART OF 8ODY<br />
FOOT PRESSURE VARfATION ARTERIAL .- {MAP - 5) - 26 SIN WI"<br />
• (MVP + 2) - 26 S_N WT<br />
HEAD UP PRESSURE VARIATION IN FOOT<br />
PART OF BODY:<br />
ARTERIAL - /MAP -- 5, _ * 67 S_N IW7 - 8 )<br />
VENOUS - (MVP • 2) + 67 SIN qWT 0)<br />
HEAD DOWN v_..._ t<br />
REFERENCE PRESSURE (RP) +4kP<br />
Figure 5-13. Simplified model of hydrostatic pressure variation secondary to rotation in<br />
pitch axis. In A, B, E, and F are indicated expected mean arterial pressures (A and E)and<br />
venous pressures (B and F) in the neck, diaphragm, and feet levels when subject is at 90 °<br />
and 270 ° positions. C and D illustrate calculation of hydrostatic pressure components from<br />
anatomical considerations and their sinusoidal variations. In G is shown expected<br />
hydrostatic pressure variation in head and feet. Circled sine wave refers to body position<br />
where maximum point corresponds to the head-up position and minimum point to<br />
head-down position. Maximum hydrostatic pressure at foot area lags head-up position by<br />
angle0sincesubject is in sitting position. MAP:mean arterial pressure; MVP=mean<br />
_enous pressure; 5 and 2 are hypothetical pressure drops along arterial and venous vessels,<br />
respectively. (After Lira & Fletcher; cited in Rothe et al., 1967)
210 Bioastronautics Data Book<br />
Cardiovascular Response to Rapid (70 to > 100 rpm) Rotation<br />
Figures 5-14 and 5-15 illustrate some of tile cardiovascular findings in human<br />
subjects rotated around the z-axis (yaw) with the center of rotation at the heart or<br />
the hips. The electrocardiogram (ECG) exhibits changes in the QRS and T vectors,<br />
which are probably the result of anatomical motion of the heart within the chest, as<br />
well as transient extrasystoles (abnormal beats). Some of these results are delineated<br />
in table 5-6. Table 5-7, from the work of Urscheli and Hood (1966), shows<br />
further aspects of change in blood pressure and heart rate.<br />
_e 7<br />
_,_ i<br />
!_ E ,_I_; _TEm_L P_ESStmF<br />
L VENOUS PRESSUR_ _*_e _<br />
*o o i0 _o 30 io so 6o<br />
Figure 5-14. Effect on human heart rate, respiration rate, pulse pressure, blood pressure of<br />
spinning around z-axis at 106 rpm with center of rotation at the heart. (After Weiss et al.<br />
1954)<br />
_= r _ - .CAR°TIp SINL_s 4<br />
\ AORTrC<br />
_ '_l EvE<br />
cArotiD<br />
_ / _ s,,,us ',<br />
,_ _,_o_ c _- .... _ _.<br />
ioo -. _RGH -<br />
• C_B AT IUAC CREST<br />
Z 80| _ ' . ' ,<br />
1o o lO _ 3_ 4o 5o<br />
Figure 5-15. Mean arterial blood pressures at eye level, carotid sinus, and aortic arch<br />
during rotation around z.axis at 106 rpm with center of rotation at the heart (upper figure);<br />
and at 72 rpm with center of rotation at the lilac crest (lower figure). (After Weiss et al.,<br />
1954)<br />
i
ECG Component<br />
Heart rate (bpm)<br />
Rotary Acceleration<br />
Table 5-6<br />
ECG Changes Associated with Rotation Around the Pitch Axis<br />
P--R interval (sec)<br />
Q--T interval (sec)<br />
QRS-T angle<br />
(degrees)<br />
Heart rate (bpm)<br />
P--R interval (sec)<br />
Q--T interval (sec)<br />
QRS-T angle<br />
(degrees)<br />
Center of Rotation at Heart (96--118 rpm)<br />
No. of<br />
Subjects<br />
=Significant at the 0.05 level.<br />
** Significant at the 0.01 level.<br />
(After Weisset al., 1954)<br />
Average Starting<br />
Values and SE<br />
Average Change<br />
from Starting Values and SE<br />
Before Tumblin 9 During Tumbling<br />
(96-118 rpm) After Tutoring<br />
12 83.0 +4.2<br />
12 0.18 +0.011<br />
12 0.40 -+0.007<br />
12 14.1 -+3.06<br />
10.0 -+2.7**<br />
- 0.01 +0.006<br />
0.03 -+0.007 * *<br />
-- 4.6 -+3.18<br />
Center of Rotation at Iliac Crest (75 -- 93 rpm)<br />
89.0 -+5.6<br />
0.17 -+0.012<br />
0.41 -+0.017<br />
22.1 -+8.96<br />
-22.0 +3.1"*<br />
0.0 -+0.0O5<br />
- 0.08 -+0.012"*<br />
6.0 -+2.67<br />
Cardiovascular Response to Slow _1 to 15 rpm) Rotatioa<br />
-26.0 +2.8**<br />
0.01 +0.005*<br />
- 0.04 -+0.006**<br />
1.8 -+1.49<br />
8.0 -+3.9<br />
- 0.Ol +0.005<br />
-- 0.03 +0.016<br />
-- 2.7 -+2.42<br />
Lim and Fletcher (cited in Rothe et al., 1967) examined the heart rate<br />
response to relatively slow rotation with the center of rotation at heart level.<br />
They recognized three different types of response in 82 exposures studied. Type I<br />
response, where the heart rate from cycle to cycle shows a minimum of scatter, is<br />
illustrated in figure 5-16. Superimposed is a sine wave representing the subject<br />
body position, 90 ° being head-up and 270 ° head-down. It will be noted that heart<br />
rate "tracks" the body position curve with increase in the head-up position and<br />
decrease in the head-down position. Type I response was observed in all but the<br />
very slow and very fast rates of rotation.The maximum heart rate, however, lags the<br />
90 ° position, and the lag increases as the rotation rate increases. Type II response,<br />
with more scatter evident, is found at very low rates (1 to 2 rpm), and is shown in<br />
figure 5-17. Type Ill response, in which little or no correlation is observed between<br />
heart rate and body position, is found in those situations where the half cycle<br />
period of the rotational rate approaches the maximum heart period. The response<br />
is illustrated in figure 5-18. Lim and Fletcher suggest that the type [II response<br />
may be due to the prolonged time constant of the parasympathetic response as<br />
compared with the sympathetic, such that the heart is still under vagal control<br />
when the subject comes up to and passes through the head-up position.<br />
211
212 Bioastronautics Data Book<br />
Table 5-7<br />
tleart Rate and Blood Pressure Changes at End of Constant Velocity Phase<br />
of Exposure (3 min) to Rotation (120 rpm) in the Roll Axis<br />
Slow Onset<br />
Subject Pulse Systolic Diastolic Mean Pulse<br />
Pressure Pressure Pressure Pressure<br />
Tu<br />
H<br />
B<br />
Ta<br />
Te<br />
Means<br />
Subject<br />
Tu<br />
H<br />
B<br />
Ta<br />
Te<br />
+40<br />
+74<br />
+66<br />
+67<br />
+70<br />
+63 + 6<br />
p < 0.001<br />
Pulse<br />
+62<br />
+61<br />
+30<br />
+74<br />
+76<br />
Means +61 +8<br />
p < o.oo5<br />
(After Urschell & Hood, 1966)<br />
+13<br />
-20<br />
-34<br />
-45<br />
-55<br />
-28 +--12<br />
Systolic<br />
Pressure<br />
-21<br />
-54<br />
-30<br />
--43<br />
-35<br />
-37 +5<br />
p < o.oo5<br />
Fast Onset<br />
+18<br />
+6<br />
-16<br />
-20<br />
-4<br />
-3 +-7<br />
Diastolic<br />
Pressure<br />
-2<br />
-24<br />
+ 1<br />
-16<br />
+ 1<br />
-8 +5<br />
+13<br />
-8<br />
-18<br />
-24<br />
-22<br />
-12_+7<br />
Mean<br />
Pressure<br />
-6<br />
-30<br />
-12<br />
-23<br />
--6<br />
-5<br />
-26<br />
-18<br />
-15<br />
-51<br />
-23 +8<br />
p
Rotary Acceleration 213<br />
6 RPM<br />
110 PITCH<br />
_20 1 _ T,S<br />
100<br />
B01-- / _ , 8Y-"5 a"O<br />
_f I t I<br />
40<br />
I I 1 1 I I I I I I I I I I<br />
80 120 160 200 240 280 320<br />
BODY POSITION (°}<br />
Figure 5-16. TyF I heart rate response to rotation (6 rpm in pitch axis) in axis<br />
perpendicular to Earth's g field plotted as a function of body position. (After Lim &<br />
Fletcher, cited in Rothe et al., 1968)<br />
120--<br />
40--<br />
:t0--<br />
1 I I I I 1 1 I I 1 I I I I 1 l l<br />
40 80 120 160 200 240 280 320<br />
BODY POSITION (o)<br />
Figure 5-17. Type II heart rate response to slow (1.5 rpm in pitch axis) rotation in axis<br />
perpendicular to Earth's g field plotted as a function of body position. (After Lim &<br />
Fletcher, cited in Rothe et al., 1968)<br />
Cardiovascular Response to Gz 100 Percent Gradient Spin<br />
While the distribution of vascular pressures is somewhat different during<br />
100 percent gradient Gz spin as compared with rotary acceleration, it is<br />
markedly different from that found in long radius sustained acceleration, and is<br />
illustrated in figure 5-19. In high gradient spin, pressures in the head and neck<br />
JN.
214 Bioastronautics Data Book<br />
are little "altered from normal while in low gradient configurations, central<br />
nervous system blood flow is maintained against a large head of pressure. The<br />
limitation to CNS blood flow in high gradient spin is not insufficient perfusion<br />
pressure but lowered cardiac output occasioned by insufficient venous return,<br />
•although the impedance to venous return is, in fact, less in high gradient spin<br />
than in long arm configuration (Piemme et al., 1966).<br />
3O<br />
40 80 120 160 200 240 280 320 360<br />
1® TSRp M<br />
_ 7o<br />
90 PITCH<br />
80 8<br />
30--<br />
- _-<br />
I I J I 1 I J 1 I I I I I I I f I l<br />
40 80 120 160 200 240 280 320 360<br />
BODY POSITION {o)<br />
Figure 5-]8. Type Ill heart rate response to fast pitch rotation at ]5 rpm; (A) heart rate<br />
response of 6 cycles averaged at each body position, (B) cycle to cycle heart rate variation.<br />
(After Lim & Fletcher, cited in Rothe et al., 1968)<br />
Mean pulse rates for subjects undergoing 100 percent gradient Gz spin are<br />
presented in figure 5-20. At lower G levels, some increase in pulse rate is found<br />
with onset of acceleration but this rapidly subsides to control levels. At higher G<br />
levels, rates increase progressively to termination of the experiment. No<br />
arrhythmias or other cardiac irregularities have been observed (Piemme et al.,<br />
1966).<br />
Other Physiological Findings<br />
Apart from investigations of the cardiovascular and vestibular parameters<br />
noted above and in the chapter concerning the vestibular system (chapter 12),<br />
very little attention has been paid to other physiological effects of rotary<br />
acceleration. During high speed rotation in dogs, Edelberg and coworkers (1954)<br />
noted that at rates above 140 rpm with the center of rotation at the heart level,
Rotary Acceleration 215<br />
respiration is inhibited. He attributes the apnea to pull on lung stretch receptors.<br />
When the center of rotation is moved tailward, however, respiration is maintained.<br />
In humans rotating at 106 rpm, respiration is still maintained, according to Weiss<br />
and coworkers (1954). Fletcher (1968) also notes that respiration, which tends to<br />
be rapid and shallow at 30 rpm, slows and becomes deeper at lower rotation rates.<br />
The subject in pitch rotation may, in fact, breathe synchronously with the inver-<br />
sion cycle.<br />
Subject<br />
_run<br />
Pre-<br />
J.N. _Post-<br />
/ru n<br />
Prevrun<br />
E'G" lPos t .<br />
" run<br />
}Pre-<br />
,A.R<br />
run<br />
Post-<br />
/FUrl<br />
_ Prefrun<br />
A'S'_Pos t .<br />
J run<br />
T.S, _Post-<br />
/run I<br />
_ Prefrun<br />
R'D'lPos t.<br />
.,run<br />
)rPur_"<br />
V.R "_Post-<br />
/ run<br />
Table 5-8<br />
Blood Pressure Values Before and After Rotation in the Roll Axis<br />
RPM*<br />
2 4 6 8 10 12 14 16<br />
*Revolutions per minute are midpoint rotational rate of class intervals.<br />
**S - systolic; [J -diastolic.<br />
(Rothe, et al., 1967)<br />
BP<br />
Reading<br />
S _*<br />
D**<br />
S<br />
D<br />
S<br />
D<br />
S<br />
D<br />
S<br />
D<br />
S<br />
D<br />
S<br />
D<br />
S<br />
D<br />
S<br />
D<br />
S<br />
D<br />
S<br />
D<br />
S<br />
D<br />
S<br />
D<br />
S<br />
D
216 Bioastronauties Data Book<br />
GRAVITY HIGH GRADIENT LOW GRADIENT<br />
I G 0 5G 4 5G<br />
TOP OF HEAD 0<br />
EYE<br />
HEART<br />
HAND 40<br />
BUTTOCK 80<br />
FOOT<br />
Figure 5-19. Phy_cal pressures (mm Hg) in absence of compensatory vascular reflexes at<br />
each level of the body in high _adient _ low gradient acceleration. At the feet, in each of<br />
the two figures to the right, a 5 G pressure exists. The difference in pressures against which<br />
the heart must perfuse the central nervous system in each ease amounts to little if any more<br />
than normal physiologic pressures in high gradient acceleration, as opposed to 100 or more<br />
mm llg in the low gradient profile. (After Piemme et al., 1966)<br />
180<br />
170<br />
160<br />
150<br />
1-<br />
140<br />
130<br />
u')<br />
t,-.12(]<br />
Ol10<br />
<<br />
_ 90<br />
•J 80<br />
_ 60<br />
51?<br />
3'°j 40<br />
:10<br />
z<br />
6<br />
7G<br />
6G<br />
5G<br />
I I I<br />
o ,o 2'o 1o 4'o _o 6'o<br />
TIME (rain)<br />
Figure 5-20. Pulse rates of seven subjects as a function of duration of exposure to +G z<br />
100% spin around the x-axis with center of rotation tangential to the head. Time zero<br />
identifies onset of 3 rain plateau of constant angular velocity. Each point represents mean<br />
for 'all subject veins at each level. (After Piemme et al., 1966)<br />
120<br />
160<br />
2OO<br />
240<br />
280<br />
320<br />
360<br />
40O<br />
440<br />
4G
Rotary Acceleration 217<br />
Pathological Effects of Rotary Acceleration<br />
Tile pathological effects of rotary acceleration, that is, those resulting in injury,<br />
have been studied to a vet3' slight extent in animals and observed occasionally in<br />
man. Table 5-9 presents a summary of postmortem findings in dogs after 1 minute<br />
exposures at 195 rpm in tile pitch axis. In addition, frequent nasal, oral, and conjunctival<br />
hemorrhage have been observed in dogs, occasionally associated with<br />
rectal bleeding (Edelberg et al., 1954). Extrapolation of animal findings to man<br />
must 'always be done with caution, but it is reasonable to assume that similar effects<br />
might be expected.<br />
Table 5-9<br />
Summary of Results of Postmortem Examination of Eleven Dogs<br />
after Rotation Around the Pitch Axis at 195 rpm (one to five runs,<br />
1 min each)<br />
Organ Description Positive Cases Negative Cases<br />
Brain Macroscopic cerebral hemorrhage 4 7<br />
Microscopic cerebral hemorrhage 5 6<br />
Hyperemic 6 5<br />
Heart Subendocardial hemorrhage 2 9<br />
Lung Atelectasis 4 7<br />
Hyperemia or edema 8 9<br />
Hemorrhage 2 9<br />
Viscera Hyperemia 7 4<br />
Rectal hemorrhage 1 10<br />
(After Edelberg et al., 1954)<br />
Humans have not been exposed to the same intensity of exposure, but<br />
conjunctival petechiae (pinpoint bleeding into the white of the eye) have<br />
been found along with petechiae on the top of the foot. Figure5-21<br />
illustrates the occurrence of conjunctival hemorrhage at various rotation<br />
rates (Weiss et al., 1954). Urschell and Hood (1966) note that all their<br />
subjects, spun around the z-axis, developed petechiae on the hands and feet<br />
during their rotation at 120 rpm. One experimental subject, following a<br />
4 minute exposure to 60 rpm, developed convulsions 3 hours later. These<br />
were attributed to a blood clot in the brain (cerebral embolus), although no<br />
other neurological findings were demonstrated (Urscheil & ttood, 1966). The<br />
incident, ahhough isolated, appears nevertheless to be significant.<br />
487 858 O - 73 IS
218 Bioastronautics Data Book<br />
w<br />
1000<br />
1oo<br />
10<br />
3<br />
2<br />
a<br />
\+<br />
o ',?.,<br />
o+%<br />
O NO HEMORRHAGE<br />
• OCULAR HEMORRHAGE<br />
i . , I i I i J i i i I i i i i i i<br />
20 40 60 80 100 120 140 160 180<br />
Figure 5-21. Incidence of conjunctival hemorrhage during rotation at various rates<br />
around pitch axis. Note that time in ordinate refers to duration of exposure. (After<br />
Weiss et at., 1954)<br />
RPM<br />
References<br />
Chambers, R. M. Acceleration. In P. Webb (Ed.), Bioastronautics Data Book. NASA<br />
SP-3006, National Aeronautics and Space Adminisl_ation, Washington, D.C., 1964.<br />
Clark, B. Thresholds for the perception of angular acceleration in man. Aerospace<br />
Medicine, 1967, 38, 443-450.<br />
Clark, B., & Stewart, J. D. Effects of angular acceleration on man. Aerospace<br />
Medicine, 1969, 40, 952-956.<br />
Clark, B., & Stewart, J. D. Perception of angular acceleration about the yaw axis of a<br />
flight simulator: Thresholds and reaction latency for research pilots. Aerospace<br />
Medicine, 1962, 33, 1426-1432.<br />
Courts, D. E. Tolerance to spinning in ejection escape. Aerospace Medicine, 1966, 37,<br />
133-135.<br />
Edelberg, R. The physiology of combined acceleration. In O. H. Gauer and G. D.<br />
Zuidema (Eds.), Gravitational stress in aerospace medicine. Boston: Little, Brown,<br />
and Co., 1961, Pp. 140-149.<br />
Edelberg, R., Weiss, H. S., Charland, P. V., & Rosenbaum, J. !. The physiology of<br />
simple tumbling. (Part I) Animal studies. WADC-TR-53-139, Wright.Patterson Air<br />
Force Base, Ohio, 1954.<br />
Fletcher, J. G. Further physiologic research on human tumbling. USAF-SAM-<br />
TR-68-109, Brooks Air Force Base, Texas, 1968.<br />
Guedry, F. E. Relations between vestibular nystagmus and visual performance.<br />
Aerospace Medicine, 1968, 39, 570-579.<br />
McCabe, B. F. Vestibular suppression in figure skaters. Trans. Amer. Aero. OphthaL<br />
Otolaryng., 1960, 64, 264-268.
Rotary Acceleration 219<br />
Meiry, J. L. The vestibular system and human dynamic space orientation. NASA<br />
CR-64545, National Aeronautics and Space Administration, Washington, D.C., 1965.<br />
Pesman, G. J. Acceleration terminology. In Principles of biodynamics, prolonged<br />
acceleration: Linear and radial. AGARD, Biodynamics Committee, NATO, 1968,<br />
Pp. 1-6.<br />
Piemme, T. E., Hyde, A. S., McCally, M., & Potor, G. Human tolerance to Gz 100%<br />
gradient spin. Aerospace Medicine, 1966, 37, 16-21.<br />
Roth, E. M. (Ed.) Compendium of human responses to the aerospace environment.<br />
(Vol. II Section 7) NASA CR-1205 (II), National Aeronautics and Space Administration,<br />
Washington, D.C., 1968.<br />
Rothe, W. E., Pope, E. E., Lim, S. T., & Fletcher, J. G. Research on the human<br />
physiologic response to prolonged rotation and angular acceleration. USAF SAM<br />
TR-67-69, Brooks Air Force Base, Texas, 1967.<br />
Urschell, C. W., & Hood, W. B. Cardiovascular effects of rotation in the z-axis.<br />
Aerospace Medicine, 1966, 37, 254-256.<br />
Useller, J W., & Aigranti, J. S. Pilot reactions to high speed rotation. Aerospace<br />
Medicine, 1963, 34, 501-504.<br />
Weiss, H. S., Edelberg, R., Charland, P. V., & Rosenbaum, J. I. The physiology of<br />
fimple tumbling. (Part 2) Ituman studies. WADC-TR-53-139, Wright-Patterson Air<br />
Force Base, Ohio, 1954.
CHAPTER 6<br />
IMPACT<br />
by<br />
Richard G. Snyder, Ph.D.<br />
University of Michigan<br />
The limiting factor of all methods of emergency escape and crash survival<br />
protection is the tolerance of the occupants to accelerative forces. Abrupt<br />
acceleration, deceleration, or impact is characterized by forces of very abrupt<br />
onset, short duration, and high magnitude. It is generally considered that impact<br />
involves the occurrence of forces of less than 0.2-second duration (Stapp,<br />
1961b). Some abrupt impact conditions to which aerospace or aircrews may be<br />
exposed include astronaut pre-lift-off tower escape, lift-off abort, ejection seat<br />
or modular capsule firings, launch vehicle staging, escape device parachute<br />
deployment, flight instability, clear air turbulence, aircraft or aerospace vehicle<br />
crash landing, and capsule water or land touchdowns. In situations such as<br />
saw-toothed accelerations produced by successive rockets firing in multistage<br />
propulsion systems, in extreme turbulence, or in many crash landings where<br />
multiple contacts are made with trees or other objects, the occupants will be<br />
exposed to a series of separate impacts. The tolerances of the human component<br />
of the abruptly decelerated system are related to the elastic and tensile limits of<br />
the tissues involved, as well as to profound physiologic, psychologic, and<br />
metabolic effects.<br />
Our current state of knowledge concerning human impact tolerances is very<br />
incomplete. While most human volunteer studies have been conducted on young<br />
healthy male subjects under rigidly controlled conditions with careful medical<br />
monitoring, they have been voluntarily terminated at levels below that of<br />
irreversible injury. No experimental impact data are available for females,<br />
children, or other segments of the population, and, due to the range of human<br />
variability, data derived from volunteer male subjects must be used with caution<br />
in other applications.<br />
Animals have been used extensively to obtain physiological data at impact<br />
levels above those potentially injurious to the human vohmteer. Cadavers offer a<br />
Reviewed by Randall M. Chambers, Ph.D., NASA Langley Research Center<br />
221
222 Bioastronautics Data Book<br />
means of determining structural limits of tissues, but cannot provide the<br />
physiological information which must be obtained on living systems.<br />
Accidental free-falls have provided still another means of determining human<br />
tolerances to extreme impacts beyond those to which human volunteers<br />
may be subjected in the laboratory. Other estimates of impact tolerance are<br />
obtained from clinical studies of impact trauma and from reconstruction of<br />
automotive, aircraft, or space vehicle accidents. While both mathematical<br />
modeling and anthropomorphic dummies are used extensively as tools to<br />
provide predictions, particularly of body kinematics and force-mass<br />
relationships within the body during impact, such simulations can be no<br />
more accurate than the very limited biological input information available.<br />
Determination of human tolerances to impact is complicated by many<br />
other physical factors influencing the outcome, including tightness and<br />
configuration of restraint and support (seat); body orientation; equipment<br />
such as helmets or parachute chestpacks, which can alter the force<br />
distribution on the body; and the magnitude, direction, distribution,<br />
duration and pulse shape of the force resulting from the impact. In<br />
addition, biological factors including sex, age, and physical and mental<br />
condition have been identified as influencing survival. Individual variability<br />
must be considered, for tolerance under identical test conditions will vary in<br />
the same individual as well as from person to person. Furthermore, while<br />
considerable data are available concerning impact forces in some body<br />
orientations, such as in forward or aft-facing positions, less is known of the<br />
effects in other orientations, such as in lateral impact. Limited experimental<br />
studies of exposure to simultaneous forces or to off-center forces have been<br />
conducted. Such conditions also greatly influence tolerance.<br />
It is not possible to state precisely what human tolerance to impact<br />
forces is without defining the specific conditions involved. It is the intent<br />
of this chapter to present a summary of the known data concerning human<br />
tolerance to impact.<br />
Terms and Definitions<br />
The biophysical terminology employed in the field of impact is generally<br />
consistent with terms used in the field of sustained acceleration. Some<br />
specialized meanings and distinctions have, however, developed. Most work<br />
is identified by descriptive terminology, such as forward, rearward or aft,<br />
headward, footward, or right or left lateral accelerations. Physiologically, the<br />
subject's orientation cart be described in relation to the force, and, since<br />
1961, terms using the x, y, z axis (table 6-1) have been recommended<br />
by the Biodynamics Committee of the Aerospace Medical Panel, AGARD, as<br />
the standard description for simple uniaxial accelerations (Gell, 1961). The<br />
physiological standard (System 4in the table) is recommended as the<br />
universal system. Air Force or Navy investigators may use the vernacular<br />
description relating "eyeballs" movement in inertial response to the applied<br />
acceleration.
ctz<br />
SYSTEM I<br />
-,,,,,,,,,,,,,,,,,,D_<br />
LINEAR MOTION<br />
Forward<br />
Backward<br />
Upward<br />
Downward<br />
To Right<br />
To Left<br />
LINEAR MOTION<br />
Forward<br />
Backward<br />
Upward<br />
Downward<br />
To Right<br />
To Left<br />
Impact<br />
Table 6-1<br />
Comparative Table of Equivalents<br />
Foo_atd<br />
Z<br />
o._ h '4"_'_" o.<br />
/<br />
SYSTEM 2<br />
Physiological<br />
Descriptive<br />
(Sys, 3)<br />
(1,2) Transverse<br />
P-A G Prone G<br />
Back to chest G<br />
Transverse A-P G<br />
Supine G<br />
Chest to Back G<br />
Positive G<br />
Negative G<br />
Left Lateral G<br />
Right Lateral (3<br />
Tr" _lcaPsG_"<br />
Aircraft Computer<br />
Standard (Sys. I)<br />
+ a x<br />
-a x<br />
-a z<br />
+ a z<br />
+ay<br />
-ay<br />
Negetive G<br />
tY<br />
_" Positive G G B<br />
SYSTEM 3 SYSTEM a<br />
TABLE A<br />
Direction of Acceleration<br />
TABLE B<br />
Inertial Resultant of Body Acceleration<br />
Physiological<br />
Standard (Sys. 4)<br />
-G x<br />
+G x<br />
Acceleration<br />
Descriptive<br />
(Sys. 2)<br />
Forward accel.<br />
Backward accel.<br />
Headward a¢cel.<br />
Footward accel.<br />
R. Lateral accel.<br />
L. Lateral accel.<br />
Vernacular<br />
Descriptive<br />
Eyeballs In<br />
Eyeballs Out<br />
+ G z Eyeballs Down<br />
-G z Eyeballs Up<br />
+ GV Eyeballs Left<br />
-Gy Eyeballs Right<br />
223
224 Bioastronautics Data Book<br />
Since body orientations and resultant inertial responses in off-axis impacts<br />
may involve complex multiaxial accelerations, a three-dimensional description is<br />
often used and expressed in terms of degrees of roll, pitch, and yaw relative to<br />
horizontal flight on a polar coordinate system. In the neutral position<br />
of 0-0-0 the crewman is seated upright facing toward the point of impact<br />
(figure 6-1). In the 0-5-180 orientation, a crewman would be seated upright, five<br />
degrees back from perpendicular with the back facing the point of impact.<br />
Inertail forces in this orientation are directed from anterior to posterior<br />
(Hanson, 1965). Similarly, 0-55-90 orientation would indicate a +Gy (eyeballs<br />
left) impact, 55 degrees back from the perpendicular, and 0-0-270 would<br />
correspond to a -Gy (eyeballs right) impact.<br />
+×<br />
+7<br />
--Z<br />
Figure 6-1. Coordinates for describing location of subject within an impact environment.<br />
(Modified from Coburn, 1970; Gell, 1961; revised 1966b by AGARD Biodynamics Panel).<br />
Historically, confusion of terminology has existed between researchers in the<br />
fields of impact and sustained acceleration. Early impact experimentation was<br />
accomplished on deceleration test devices, where the direction of force acting on<br />
the test subject is opposite to that which occurs in acceleration, even though the<br />
direction of motion is the same. Thus a test described as "forward facing<br />
impact" (deceleration) is equivalent to backward acceleration.<br />
Understandably, despite efforts to_.ard standardization, some confusion still<br />
exists. One reason for this is the limitation of the term "G" to the inertial<br />
reaction of the subject. This poses no problem to the investigator working in<br />
steady state acceleration, since the transient response is of minor consequence<br />
with most devices capable of producing sustained acceleration. For the<br />
investigator concerned with impact, the transient response is of major<br />
importance since most end points are established by a transient peak. Because of<br />
--×<br />
+7
Impact 22.5<br />
the time-varying nature of the transient response, the inertial reaction is<br />
continually changing. Moreover, due to the complicated reactions of the<br />
biological system, the inertial reaction varies tbroughout tile body during the<br />
impact. Thus tbe specification of a single "inertial response" magnitude as a<br />
descriptor of the experiment would be of little value to the researcher in impact<br />
tolerance. Some researchers have recognized this limitation but have used the<br />
"G" magnitude to indicate the input peak rather than the response. This is<br />
advantageous for purposes of experimental control and permits relatively easy<br />
measurement with generally available equipment.<br />
Acceleration<br />
Acceleration is defined as the time rate of change of velocity. Since velocity<br />
is a vector, acceleration occurs when either the magnitude (speed) or the<br />
direction of motion of a body changes. Most impact test devices use a track and<br />
sled system, operating either vertically (FAA, NASA, and 6570 AMRL drop<br />
towers, or the 6571 ARL HYGE) or horizontally (such as the USAF "Bopper"<br />
or "Daisy"). The test pulse is provided either initially, as the sled accelerates to<br />
speed, or terminally as the sled is slowed or stopped from a given speed. Impact<br />
pulses may be of a variety of waveforms, either as selected by the researcher or<br />
limited by the capability of the test device. Figure 6-2 shows an example of a<br />
rectangular profile, with a relatively long plateau or "dwell" time. Rise time<br />
depends upon how rapidly peak accelcration is reached. The term rate of onset<br />
(T) is frequently used synonymously. Jolt describes the rate of change of<br />
acceleration (displacement with respect to time), and has been found to be a<br />
strong limiting factor in tolerance. A variety of controlled pulse shapes are<br />
shown by Chandler (1967). Difficulty is often encountered in describing<br />
concisely a complex impact pulse shape, and a number of techniques have been<br />
adopted to provide consistent descriptors (the most recent, Mil-S-94793,,<br />
16 June 1967).<br />
The "G" System of Units<br />
Few units of measurement have been more misused and misunderstood than<br />
the unit "G." In the strictest sense, it is merely a dimensional representation of<br />
the magnitude of acceleration, expressed as a ratio of the magnitude of the<br />
measured acceleration to the magnitude of the "standard" acceleration of<br />
gravity, G = lal/lgol. Since acceleration is a vector quantity, having properties<br />
of both magnitude and direction, the capital letter G is used to denote that only<br />
magnitudes are being compared, so that the direction of the acceleration of<br />
interest does not necessarily coincide with the direction of the acccleration of<br />
gravity. The signs and subscripts of the standard terminology, previously<br />
discussed, are an attempt to restore directionality to the G nomenclature.<br />
Consideration of Newton's second law, stated in simplified form as F = ma,<br />
with weight defined as mass times "standard gravity" (W = mgo), can lead to the<br />
conclusion that G is also equivalent to the ratio of the force (required to<br />
accelerate the mass m at an acceleration level a ) to the weight (under standard
226 Bioastronautics Data Book<br />
gravitational conditions). This relationship would be stated: G = F/W. Thus G is<br />
often thought of as having both force and acceleration significance.<br />
2<br />
PEAK WG)<br />
E TIME_ _ DECAY TIM<br />
TIME tmsec)<br />
Figure 6-2. Example of rectangular-shaped impulse deceleration profile.<br />
(Adapted from Stapp, 1961)<br />
The quantity G is dimensionless, being the ratio of two accelerations or of<br />
two forces. However, by definition it is capable of telling how much force is<br />
acting and what acceleration is taking place in a given dynamic situation. Thus, if<br />
it can be stated that a body is experiencing a certain amount of G, the total<br />
amount of force can be determined in ordinary units if the given value of G is<br />
multiplied by the standard weight Wo of the body, or F = G Wo. Simi-<br />
larly, Gdefines magnitude of acceleration, a=Ggo. Although dimension-<br />
less, G possesses the same property of direction as do the force and acceleration<br />
which it connotes. Thus, it is possible to construct G vector diagrams in place of<br />
force or acceleration diagrams when analyzing dynamic problems. G is usually<br />
thought of.in respect to its "force" aspect (Dixon and Patterson, 1953).<br />
The symbol g has been widely abused in aerospace medical literature.<br />
Although g has been rigidly established by physicists as a symbol (go) for a<br />
specific physical quantity (32.2 ft/sec2), the acceleration of gravity, it is often<br />
indiscriminately used in place of G in the literature. In contrast to sustained<br />
acceleration, in impact a whole body can only be said to experience a<br />
certain G when that G refers to the whole body input, not response. On impact,<br />
each element of the body experiences a different G load, depending upon its<br />
I
Impact 227<br />
elastic, viscous, and/or plastic relation to the rest of the body, to the parameters<br />
of the impact pulse, to the support/restraint system, to the general structural<br />
characteristics of the test vehicle, and many other factors. Realistically,<br />
six degrees of freedom for motion of each clcment would have to be measured<br />
to accurately assess the force imparted. Although accelerometers have been<br />
available for at least five decades, the measurement of force and force<br />
distribution during impact has not yet been accomplished. To convert an<br />
acceleration measurement to a force measurement, one must know the mass<br />
upon which the acceleration is acting (F : ma). Due to the distributed mass and<br />
undefined interconnections of tissues encountered in the human body, the<br />
effective mass for the acceleration measured is not known. Therefore,<br />
investigators cannot yet speak of inertial force based upon body acceleration<br />
measurements without making crude guesses.<br />
Interpreting the Data<br />
There are other considerations which pose major problems to the impact<br />
engineer. The calibration, placement and attachment of transducers can cause<br />
artifacts in the data. Head or chest accelerometers, unless firmly attached or<br />
implanted in bone, are subject to distortion of the supporting strap or<br />
intervening tissue and result in higher acceleration readings than actually occur<br />
(Ewing, 1969). G forces may be recorded on a sled in one study and in various<br />
locations on the body in another, yet reported without distinction.<br />
To accurately specify acceleration it would be necessary to utilize<br />
three linear accelerometers and three angular accelerometers at the same point,<br />
or provide some other means of obtaining these data. Also, acceleration<br />
measurements change from point to point on any distributed body element<br />
unless it is rigid and moving in only one linear direction without rotation. Thus,<br />
one acceleration measure, even if properly made, is not representative of the<br />
acceleration distribution over the body (Chandler, 1970). For example, in lateral<br />
run No. 2530 programmed for 10sled G on the ttolloman Bopper, peak<br />
sled G was 8.48, peak G on subject's chest was 14.47, and head G was recorded<br />
as 22.04 (Zaborowski, 1966).<br />
Finally, results are subject to various interpretations depending upon system<br />
or computational parameters which may go unreported. For example, while<br />
most test results are presented in terms of peak G, some arc given as<br />
plateau G or average G. Some investigators "round-off" or "average" multiple<br />
peaks while others report the peaks. Frequency response and damping<br />
characteristics may differ. All of these factors should temper interpretation of<br />
reported tolerance limits.<br />
Human Tolerance Limits<br />
Tolerances have been variously defined, and different researchers have<br />
established different end points as criteria. Bierman (1947) defined tolerance as<br />
"that value of impact or load which produces a painful reaction;" Stapp used a<br />
variety of criteria ultimately defining tolerance as the limit beyond which either<br />
the subject or the experimenter fears to go lest there be serious injury. Injury has
228 Bioastronautics Data Book<br />
been termed "reversible" or "irreversible" depending upon whether or not the<br />
individual can recover. Aerospace and aviation medical research in impact has<br />
been concerned primarily with whole body response to impact forces. Most<br />
human tolerance limit data developed to date are based upon the seated, young<br />
male subject utilizing maximum body support. In the majority of tests body<br />
orientation is in relation to the four main body axes: forward (-Gx), rearward<br />
(+Gx), headward (+Gz), and footward (-Gz) acting forces. Only one series of<br />
right lateral (+Gy) tests with human subjects has been conducted (Brown, et al.,<br />
1966). Test results can be affected by body position, restraints, instructions<br />
given the subject prior to testing (e.g., relax or tense muscles during the test), the<br />
subject's task, etc.<br />
In figure 6-3 data from a number of sources have been combined to illustrate<br />
impact experience documented to date. It should be noted that numerous<br />
biophysical factors influence survival, and the "approximate survival limit"<br />
shown is only an estimate.<br />
DECELERATION I<br />
DISTANCE<br />
_oo<<br />
P_CHUTE _', X -- 400<br />
NOPE_N_,<br />
_'kt m_o # _ I_XI<br />
-- IO<br />
t/t/_,o-- - _o 8<br />
zt -'-,<br />
- 2<br />
I0 20 I_e*<br />
Figure 6-3. Impact documentation. Velocity and deceleration distance are shown on<br />
common axes, with magnitude of force and deceleration time shown on secondary scales.<br />
Hollow squares mark selected, well documented, free-fall survivals for which impact forces<br />
have been calculated. Extent of /issue deformation at impact for these free-falls is not<br />
known, thus deceleration distance is not always known. (Modified from Webb, 1964, with<br />
data of Snyder, 1963.69)<br />
z_
Tolerance to Transverse (--+Gx) Impact Force<br />
Impact 229<br />
In forward facing transver_ (-Gx) impact, tolerance limits for man are<br />
approximatcly 50 G peaks at 500 G/see rate of onset for 0.25 second's duration,<br />
provided there is adequate upper torso restraint (Stapp, 1951a). However,<br />
changes in the rate of onset directly affect human response for various impulse<br />
durations (Stapp, 1949-1968; Stapp & Hughes, 1956; Stapp & Blount, 1957;<br />
Eiband, 1959; Stapp, et al., 1964; Stapp, 1965). Air Force design recommendations<br />
are approximately 45 G for a duration of 0.1 second and 25 G for a<br />
duration of 0.2 second (U.S. Air Force, 1969). Restraint in the experiments<br />
establishing these limits was by means of a double harness with 3 inch wide<br />
shoulder straps, a seat belt with thigh straps, and a chest belt. With a less<br />
adequate restraint system, some debilitation and injury may occur at these levels<br />
and greater tolerance may be found with better protective systems.<br />
Stapp reported that peak acceleration of approximately 45 G (0.09 second's<br />
duration) with a rate of onset of 500 G/see resulted in no signs of shock. Yet, he<br />
found that 38 G's for 0.16 second at onset rates higher than 1300 G/see<br />
produced signs of severe shock (Stapp, 1949; 1968) and 45 G (for 0.23 second)<br />
at 413 G/see produced severe delayed effects (run 215, Stapp, 1949). A higher<br />
rate of onset usually implies a higher content of high frequency energy in the<br />
acceleration pulse, with a higher energy transfer to the human. Unfortunately,<br />
the data are too few and too often uncontrolled with respect to restraint systems<br />
for adequate interpretation (Holcomb, 1961; NASA, 1965).<br />
Human tolerance for impact in rearward facing (+Gx) body orientation has<br />
not been clearly established. Humans have survived impact, with reversible<br />
injuries, at a level of 83 G (chest acceleration, not actual input) at 3800 G/sec<br />
for 0.04 second's duration (Beeding & Mosely, 1960). The accepted Air Force<br />
design limit falls between this and the 45 G for 0.1 second end point for eyeballs<br />
out impact (U.S. Air Force, 1969). Stapp (1949) reported human tolerance for<br />
+G x (rearward-faeing impact) to be 30 G for 0.11 second's duration with a<br />
calculated rate of onset of 1065 G/see.<br />
Chimpanzee tests, backed by free-fall data for humans, indicate that limits<br />
for survival may be less than 237 G at 11 250 G/see for 0.35 seeond_ duration<br />
in the forward-facing (-Gx) body orientation when the subject is restrained by<br />
full-body harness, and about 247 G at 16 800 G/see over 0.35 second's duration<br />
(Stapp, 1961a) rate of onset. Persistent injury was found above 5000 G/see rate<br />
of onset, 135 G peak and 0.3_ "_ second s duration, although transient injury<br />
effects were observed at 60 G at higher than 5000 G/see rate of onset in the -G x<br />
direction (Stapp, 1958a).<br />
Attempts are being made to expand design criteria regarding the relationship<br />
between rate of onset and duration of transverse impact acceleration (U.S. Air<br />
Force, 1969). Figure 6-4 gives data related to abrupt transverse (+Gx) impacts<br />
which have been survived by men and animals. In view of these gaps in the data,<br />
the general form of the curves in this figure merits some comment (NASA,<br />
1965). It can be seen that for duration times up to 0.01 second, the tolerance<br />
level drops off linearly (log-log scale) as duration time increases. This can be
230 Bioastronautics Data Book<br />
explained in terms of dynamic response, since the critical human response occurs<br />
as in a relatively low frequency system. Short duration impacts do not possess<br />
sufficient energy to excite maximum response of this low frequency system.<br />
When full overshoot is attained (at about 0.01 second) any further increase in<br />
the duration of impact does not increase the man's response for a given input<br />
level, until the "long" duration regime is approached when hydraulic effects<br />
become noticeable and reduce the tolerance level still further (see also<br />
figure 6-12).<br />
2OO<br />
_l _ql •.<br />
_OO_ _<br />
40 J ltJ :<br />
:,iiiil I<br />
,:_ 5 _ UflJECT _FE_I_flC[<br />
3<br />
3<br />
, ! ;7<br />
.001 .002 003 005 01 .02 ,03 ,05 .1 .2 .3 ,5 1 2 3 4 5 10<br />
DURATION OF UNIFORM ACCELERATION (sec)<br />
_Gx (CHEST.TO.BACK)<br />
(a)<br />
100 _ _ ,,i<br />
::t_ .... _.. ,;;,-4-f+H+--q--F H-H4<br />
All i_lVivlbll Ii_llUll i ; TI_ I<br />
001 002003 005 .01 02 D3 05 1 .2 .3 5 1 2 3 4 5 10<br />
DURATION OF UNIFORM ACCELERATION (sec)<br />
G x {BACK TO-CHEST)<br />
(b)<br />
Figure 6-4. Survivable abrupt transverse (+Gx) impact. Reference numbers are those<br />
in original reports. (After Webb, 1964; based on data of Eiband, 1959)
Impact 231<br />
Figure 6-5 presents data for tolerance to +Gx impact as a function of<br />
velocity change and average acceleration. The curves of Gurdjian (1954) were<br />
calculated to define the dividing line between mild injury (no damage) and<br />
severe injury such as shock and retinal hemorrhage in humans, in terms of<br />
velocity change and average acceleration force. There are few human<br />
experiments at the high accelerations. Animal data support the shape and<br />
approximate location of file curve (Kornhauser, 1964). Because of all error<br />
found in the original calculations, they were recalculated and plotted as shown.<br />
Good agreement is noted except for the 0 to 0.02 region where the earlier model<br />
of Gurdjian shows a greater permissible velocity. It can be seen that for<br />
exposures of less than 0.02 to 0.06 second, the change in velocity, rather than<br />
the acceleration level, determines tolerance (as predicted by figure 6-12). More<br />
human data are needed to define the curve at short exposure durations.<br />
Z<br />
300<br />
200<br />
loo<br />
< 60<br />
--to<br />
_" 40<br />
I-.-<br />
S<br />
2C<br />
10<br />
DURATION (sec)<br />
I I<br />
20<br />
t<br />
/<br />
/ /<br />
NON-INJURY<br />
0.1<br />
I _ II If[ I<br />
50 1O0<br />
/<br />
/ /<br />
s' 006<br />
AVERAGE ACCELERATION (G)<br />
/<br />
/<br />
002<br />
/ INJURY<br />
KORNHAUSER TO6ERANCELINE<br />
(corrected)<br />
STANLEY TOLERANCE ANALYSIS<br />
t t t trill 1ooo<br />
Figure 6-5. Tolerance to rearward +G x short-duration accelerations as a function of<br />
velocity change and average acceleration. Dashed line rcpre_nts +G x tolerance curve for<br />
injury as determined by Kornhauscr and Gold (1961), corrected for errors found in the<br />
original duration times. The solid line is the tolerance curve resulting from more recent<br />
analysis of available usable impact data by Stanley Aviation Corp. (NASA, 1965). [After<br />
NASA (Stanley Aviation Corp.) 1965 ].<br />
Tolerance to Vertical (-+Gz) Impact Force<br />
Design curves for ejection seat and escape capsules (HIAD, 1960; General<br />
Dynamics, 1961) have been vague regarding the relationship between rate of<br />
onset and duration, especially in the region of short duration impact (Holcomb,<br />
1961). For example, whole body deceleration of 50-pound chimpanzees at 3 -G z<br />
using a trapezoidal deceleration profile with a plateau of 50- to 60-msec duration<br />
resulted in G amplification of 2.0 to 2.5 times the sled G, as detected by a
232 Bioastronautics Data Book<br />
miniature accelerometer rigidly mounted on the calvarium (Sonntag, 1967).<br />
Figure 6-6 gives data which may be helpful in this regard. It shows the<br />
durations and magnitudes of abrupt vertical decelerations, in both the<br />
tailward (-Gz) and headward (+Gz) directions, which have been withstood<br />
by animals and man.<br />
Impact tolerance has been assessed in terms of impact pressure (i.e.,<br />
force per unit area) as well as from the magnitude-duration point of view.<br />
The +Gz (headward) case is illustrated in figures 6-7 and 6-8. There is a<br />
considerable area of unknown effect between the region of voluntary human<br />
exposure and the region of known injury. The unknown area covers about<br />
20 G in tile ordinate in figure 6-7, which includes the region of most<br />
interest in space operations. It is clear from the figure that the boundaries<br />
of injury versus non-injury are not yet particularly well defined, and a few<br />
more reliable points might well change the general shape of the curves,<br />
particularly in the impulse region.<br />
Tolerance to Lateral (-+Gy) Forces<br />
Lateral (-+Gy) impact tolerances appear to be considerably lower than is<br />
tolerance in either the transverse (-+Gx) or footward (+Gz) body<br />
orientations, with a maximum of 14.lpeak sled G at 600G/see for<br />
0.]22 second's duration under full body restraint (Sonntag, 1968). When the<br />
subject is restrained by a lap belt only, the voluntary tolerance limit for<br />
belt (-Gy) lateral impact has been reported to be only 9 G (average) for a<br />
duration of approximately 0.I second (Zaborowski et al., 1965; Zaborowski,<br />
1966). More recent tests with the F-Ill restraint system (General Dynamics<br />
version) resulted in subjective tolerance levels at 9.2 to 10sled G's, or 12 to<br />
14 G on the chest (Sonntag, 1968). Few fight lateral impact (+Gy) tests<br />
have been done, but in this orientation with full Mercury mission-type body<br />
restraint, the subjective tolerance level has been reported to be above<br />
21.5 G (sled) maximum for ll90G/sec and 0.121 second's duration 0Veis et<br />
al., 1963a). With the early Apollo restraint system, 18.7 G (sled) was<br />
tolerated with no complaints (Brown et al., 1966).<br />
Computer Analyses of Plateau Tolerances<br />
Recent attempts have been made to supplement empirical curves with<br />
preliminary computer models employing impedance and resonance<br />
techniques (NASA, 1965). Art analysis of headward (+Gz) accelerations has<br />
shown that the maximum plateau input acceleration can probably he taken<br />
as 40 G with some degree of confidence. Although essential for computer<br />
studies, the selection of an equivalent spinal frequency (60) is not so well<br />
defined. Because of the shortage of results in the impulse region, the most<br />
reliable evidence can be taken from the critical velocity change deduced<br />
from drop tests which give a value for 62 of 225 rad/sec (Swearingcn et al.,<br />
1960).
487-858 0 - 73 - 16<br />
,tttm 6 - :I'I_)IH:IA 40 14OIIVil:l']:13_)V W_iO-tlN('l<br />
Impact 233<br />
\o<br />
g<br />
.J<br />
U<br />
u.<br />
8<br />
I-<br />
e-<br />
.=.<br />
0<br />
e-
234 Bioastronautics Data Book<br />
s_!u_ II - 3"I_IH3A :10 NOIJ.V_I3"I3_)_)¥ M_IO:IINN<br />
.E b_<br />
.=_<br />
O<br />
c_ r<br />
_z<br />
c_
60<br />
5O<br />
"_. 40<br />
14,,I<br />
,_<br />
30<br />
I,-<br />
U<br />
a.< RESULTINGI I J' I I _1" I II<br />
Impact 235<br />
10 I I I I I I I EFFECTS FROM<br />
8OD¥ACTSAS.4__I.___'S'HiF_f s OF I<br />
_'LUIDS_D O_NS<br />
c_<br />
.005 .01 .02 .03 .05 .1 .2 .3 .4 .5 1.0<br />
DURATION - leconds<br />
Figure 6-7. Impact sensitivity in terms of force per unit area for +G z impact. For<br />
shorter exposures, the body is believed to act as a rigid mass; for longer exposures,<br />
effects are caused by shifts in body fluids and tissues. Data points are taken from<br />
human experiments in drop towers, falls, and rocket sleds with various restraint<br />
devices. Two shaded areas define approximate areas of effect in terms of impact<br />
pressure for any duration. (After Webb, 1964, adapted from Thompson, 1962)<br />
1000<br />
500<br />
"" 400<br />
4=<br />
>- 300<br />
I--<br />
-_ 2011<br />
Z<br />
W<br />
o<br />
z 101)<br />
I-<br />
I.,.)<br />
5O<br />
40<br />
10<br />
/,<br />
2O<br />
//<br />
¢<br />
//"<br />
,H-<br />
/I<br />
/ //<br />
/Oo o/ /<br />
/ LA,/. /<br />
30 40 50 100 200<br />
AVERAGE ACCELERATION - G units<br />
300 500<br />
Figure 6-8. Dividing line between mild injury (no damage) and severe injury (shock<br />
and retinal hemorrhage) in humans [exposed to +G z impact, in terms of magnitude<br />
and duration of force application.] Data points are from human experiments in several<br />
laboratories. Animal data (not shown) support the shape and approximate location of<br />
the curve. (After Webb, 1964,, adapted from Kornhauser, 1962)
236 Bioastronautics Data Book<br />
In the transverse, backward direction (+Gx) the plateau tolerance line<br />
falls at a value of 45 G for the input acceleration, and the most reasonable<br />
position for the impulse tolerance line corresponds to an equivalent<br />
frequency of 95 rad/sec. This is somewhat higher than tile value suggested<br />
by the evidence from accident survival. The adoption of the more<br />
pessimistic tolerance hne appears justified since it satisfies the few sled test<br />
points available, and accident cases usually represent extreme end points and<br />
cannot be precisely reconstructed. No satisfactory conclusions can be made<br />
from the transverse forward data (-Gx) but a frequency of 95 tad/see, as for<br />
the backward case, is suggested. From a physiological standpoint, the<br />
plateau tolerance level for forward facing impact might be lower than that<br />
for the backward direction because of the position of the spine relative to<br />
the internal organs, but this also depends upon restraint. Until more<br />
relevant tests have been conducted, it is suggested that the allowable peak<br />
input acceleration be taken as 35 G.<br />
Tentative impact tolerance parameters suggested for use with the single<br />
degree of freedom, undamped dynamic model, are given in table 6-2. It<br />
should be remembered that these values are applicable to an undamped<br />
model. Damping will introduce changes in the tolerance levels considered to<br />
be small enough to be ignored at this stage of model development. Analytic<br />
results are also available for two and three degrees of freedom models<br />
(NASA, 1965). These bring out the factors determining the drop in<br />
tolerance levels at the longer durations of figurcs 6-4 and 6-6. The exact<br />
shapes of the curves are determined sequentially by tolerance of the head,<br />
lumbosacral, and spine-abdomen system as the duration of impulse is<br />
increased.<br />
Table 6-2<br />
Tentative Impact Tolerance Parameters for Use With Single Degree<br />
Parameter<br />
Equivalent frequency<br />
Maximum allowable mass<br />
acceleration<br />
Impulse region<br />
End of plateau<br />
of Freedom Undamped Dynamic Models<br />
Headward (+G z)<br />
225 rad/sec<br />
+80 Gz<br />
0 - 0.009 sec<br />
(After NASA, 1965, Stanley Aviation Corp.)<br />
Tolerance to Peak Impact Accelerations<br />
.00 sec<br />
Impact Direction<br />
Backward (+G x)<br />
95 rad/sec<br />
+90 G x<br />
0 - 0.02<br />
.06 sec<br />
Forward (-G x)<br />
95 rad/sec<br />
-70 Gx<br />
0 - 0.02<br />
.08 sec<br />
Figure6-9 indicates the peak accelerations that have been survived<br />
without permanent injury. Figure 6-10 shows the greatest vertical impact
Impact 237<br />
subjects would voluntarily endure and the type of symptoms noted at given<br />
rates of onset. Free-fall studies have indicated that the critical entrance<br />
velocity for human survival of water impact is about 100 ft/sec, feet-first<br />
(+Gz), and 97 ft/sec in the head-first (-Gz) body orientation (Snyder, 1965;<br />
Snyder & Snow, 1967). These velocity calculations were corrected for aero-<br />
dynamic drag and are thus lower than standard values.<br />
(a)<br />
1000 Jill [<br />
,oo ,<br />
300 ] : ::<br />
m ..... [<br />
.,: 200 _jTRANSVERSE<br />
Y//AI _ FA LLS<br />
o ,oo i<br />
z 50 s#_ _,r./Ad'/,.L._<br />
O slfA ty#lli'2 ,fn r/_<br />
< 30<br />
a: 20<br />
tu • •<br />
.J<br />
tu<br />
U 10, : : _:<br />
U<br />
,., 5 i iii<br />
lu_ 3 : :::<br />
(b)<br />
1 . . . J.... i<br />
.01 .02.03.05 .I<br />
70<br />
w<br />
:: 60<br />
g<br />
m<br />
Z<br />
0<br />
so<br />
< 4o<br />
_/<br />
_ 30<br />
U<br />
.<<br />
"r<br />
Ud 10 _<br />
ol<br />
.01<br />
I<br />
, I1! ,<br />
: : : i<br />
DAM'" _ GE<br />
: : '<br />
ZONE<br />
7, i i i<br />
VOLUNTARY::. v ! [<br />
I/TRANSVERSE _ _',, .... I<br />
• ,.ACCELERATIONS_ 7_///1<br />
! 1
238 Bioa_tronauties Data Book<br />
(b)<br />
(a)<br />
te<br />
8<br />
o<br />
e,,,<br />
t_<br />
c_<br />
_1<br />
.-}<br />
o<br />
-lu'}<br />
I--<br />
(..9<br />
Z<br />
LU<br />
e¢<br />
ev'<br />
UJ<br />
l-<br />
U.l<br />
o<br />
e,,'<br />
I,Ll<br />
,,--I<br />
ILl<br />
t.,l<br />
u<br />
.,,(<br />
o J<br />
z 250<br />
o<br />
I--<br />
w 200<br />
_1<br />
u<br />
u<br />
'_ 150<br />
I--<br />
Q.<br />
Z<br />
v 100<br />
U,J<br />
D..<br />
D 50<br />
_E<br />
X<br />
0<br />
14<br />
12<br />
I0<br />
2<br />
0! 0<br />
##<br />
/ tt<br />
//i<br />
t I<br />
I i A.<br />
///?<br />
.02<br />
u2<br />
z =" _"<br />
-- t.} O_<br />
u) J'- I-u.I<br />
"1- _'_<br />
1-(..1 _ ¢'_<br />
z$ u.J_<br />
z_ u"-N<br />
•,_r, zr,._<br />
U,.j UJ U-I "T" I_u)'-<br />
19000 G/see J _<br />
% %%<br />
%<br />
TIME- seconds<br />
10 000 G/see<br />
SEATED IN STANDING<br />
RIGID SOLID KNEES<br />
CHAIR LOCKED<br />
A<br />
LIMIT OF RANGE OF<br />
'%. '_CELEROMETER.<br />
\ \<br />
T TO 0.16 / sic<br />
.04 .06 .08<br />
c_<br />
tu<br />
z__<br />
.,_o<br />
Q-z<br />
50 000 G/see<br />
STANDING,<br />
LEGS<br />
ALLOWED<br />
TO FLEX<br />
B C<br />
u)<br />
o<br />
LU<br />
--I<br />
O-u)<br />
U.lu-I<br />
¢_ I.&l<br />
u4Z<br />
>v<br />
N_z<br />
26 000 G/see<br />
SQUATTING<br />
Figure 6-10. Durations and magnitudes of abrupt transverse decelerations endured by<br />
various animals and man, showing areas of voluntary endurance without injury,<br />
moderate injury, and severe injury. A: summarizes -G x data (chest-to-back impact);<br />
B: shows +G x data (back-to-chest impact). Reference numbers are those in the original<br />
reports. (After Webb, 1964; based upon Eiband, 1959). More recent tests with human<br />
volunteer subjects confirm in general these early data. The user is cautioned that these<br />
tolerances are greatly influenced by the type of restraint protection, which is not<br />
specified.<br />
D<br />
m
Other Factors Affecting Impact Tolerance<br />
Impact 239<br />
Besides the numerous factors affecting human tolerance to impact which<br />
have been indicated in studies to date, new environmental factors<br />
encountered in space flight may also exert some degree of influence. In extended<br />
space flight, astronauts will be exposed to ionizing radiation which may<br />
substantially change the functional state of the organism. However, no<br />
information is yet available concerning the effects of ionizing radiation on<br />
human impact tolerance and only a little animal data has been gathered.<br />
Exposure of mice irradiated in doses of 250 to 850 R to prolonged accelerations<br />
of 40 to 42 G for 3 minutes resulted in estimates of the limits of overload<br />
resistance of a human subject injured by ionizing radiation of about 52 days<br />
(Davydov et al., 1965). Extensive physiological, histological, and biochemical<br />
monitoring of two turtles aboard Zond-5, showed no correlation between<br />
radiation and impact effects (Gazenko et al., 1969).<br />
Preliminary acceleration studies (centrifuge) have been initiated relative to<br />
the effects of the circadian rhythmicity on impact tolerance, Bolend, 1970, but<br />
biological effects upon man's impact or deceleration tolerance have not been<br />
reported.<br />
Low-altitude, high-speed flight in turbulent conditions, which exposes crews<br />
to random multiple vertical impacts, has been found to result in markedly<br />
deteriorating performance after one hour of flight as terrain slopes steepen and<br />
airspeed increases from Mach 0.4 to 0.9 (Soliday & Schohan, 1965).<br />
Physiological and Biochemical<br />
Response to Impact<br />
Human tolerance criteria are largely physiologically determined, and it<br />
must be emphasized that most data related to the human have been<br />
obtained at impact levels at or below voluntary tolerance. Very limited<br />
human data, generally obtained in connection with accidents, are presently<br />
available at higher impact injury levels. Most estimates of lethal impact<br />
ranges are extrapolations from animal studies. A large number of<br />
environmental factors directly influence physiological responses, including<br />
body orientation, direction of application of force, and magnitude, duration,<br />
and rate of application of the acceleration pulse shape. In addition,<br />
supporting structures and restraint play a major role in variation.<br />
Cardiovascular Response to Impact<br />
Rate of onset has been shown to be a primary limitation and appears to<br />
influence clinical shock directly following impact (Stapp, 1955b; Taylor, 1963).<br />
The mechanisms of this physiological shock, which involve complex,<br />
*In semilunar flight from 15-21 September 1968; splash down landing in Indian Ocean.
240 Bioast ronaulics DataBook<br />
_muitaneous neural-humoral events, arenotyetclearlyunderstood. Post-impact<br />
bradycardia, or slowingof theheartratebelow60beatsperminute,hasbeen<br />
welldocumented (Bierman, Wilder,& Hellems, 1946;Stapp,1949;Ruff,1950;<br />
Rhcin& Taylor,1962;Tayloret al., 1962;Weiset al., 1963a;Brownet al.,<br />
1966).At 30Gpeakand100G/sec, unpleasant pressure sensations, pallor,drop<br />
in bloodpressure, increased pulserate,andoccasional retinalvenouspasms<br />
reportedlyoccur.Thesetransientchangeswerefoundin the absenceof<br />
mechanical failureor tearingof tissuesandorgansandwithoutbonefracture.<br />
Brownet al.,(1966)foundthatbradycardia post-impact isa functionof the<br />
acceleration profileandthesubject orientation, butlittleadditional documented<br />
informationis availablerelativeto theinfluenceof impactorientationand<br />
magnitude onpost-impact heartslowing.<br />
Mildbradycardia isproducedat 15Gimpactin theforward-facing position<br />
(-Gx)but is notasmarkedin therearward-facing (+Gx)position.Increasing<br />
levclsof impactincrease boththeseverityan durationofbradycardia upto the<br />
testedvoluntaryhumanlimitsof 30G (Taylor,1963). In impactpulsesof less<br />
than50msecandlessthan15Gthecardio-inhibitory reflexcausingslowingof<br />
theheartrate apparently does not occur. At low G forces (7.21 to 15.46 G), a<br />
tachycardia,<br />
1968).<br />
or speeding up of the heart rate, has been reported (Piotrowski,<br />
A carotid sinus reflex induced by sustained pressure rise in the carotid<br />
arteries was subjectively observed following exposure to forward-facing (-Gx)<br />
impact of 600 G/see to a plateau of 15 G sustained for 0.60 second (Stapp,<br />
Iq61a). The cardiovascular shock effect is characterized by pallor, sweating,<br />
drop in blood pressure and rise in pulse rate. Mild transient shock has been<br />
observed at less than 25 G peaks where duration was less than 0.1 second. Severe<br />
shock has resulted from exposure to 38.6 G at a 1370 G/scc onset rate for<br />
0.12 second's total duration (8 to 9 Hz resonant frequency) (Stapp, 1961b).<br />
Hematological and Biochemical Change<br />
In man, various changes in chemical constituents of the blood as well as<br />
adrenal gland activity have been reported to occur in conjunction with impact<br />
accelerations. Reduction in blood platelets (thrombocytopenia) after forward-facing<br />
(-Gx) impact at 20G (peak sled G) was observed one hour<br />
post-impact at 400 to 800 G/see onset rates (Taylor, 1963). Sympathoadrenal<br />
response to impact was suggested due to changes found in measurement of<br />
urinary excretion of vanehnandelic acid (VMA) (Hanson & Foster, 1966). More<br />
precise measurement of norepinephrine, epinephrine, and 17-hydroxycorticosteroid<br />
in urine pre- and post-impact showed a definite connection<br />
with sympathoadrenal function and emotional stress (Foster & Sonntag, 1969).<br />
Pulmonary and Muscular Effects<br />
In ÷Gx (rearward-facing) impact levels up to 25 G, no significant impairment<br />
of puhnonary function has been found to occur in the restrained +Gx<br />
(forward-facing) position ([tanson, 1965).
Impact 241<br />
In lateral (_cGy) impact, minor physical complaints such as muscle stiffness<br />
occurred in approximately 258 G/see rate of onset for durations of 0.3 to<br />
0.1 second (Zaborowski, 1966).<br />
Physiological Tolerance<br />
Symptoms of various degrees of shock are the first physiological signs<br />
limiting human voluntary tolerance to transverse acceleration. A 40 G peak at<br />
331 G/see onset rate of 0.32 second plateau duration (wearing upper torso<br />
restraint) can be tolerated with no indication of cardiovascular shock. Further<br />
increase in duration of acceleration (i.e., sustained acceleration) will not affect<br />
response (Lewis & Stapp, 1958). However, in seated forward or rearward-facing<br />
body orientations (-+Gx), physiological alterations in man have been reported<br />
when peak forces exceed approximately 15 G and onset rates are above<br />
400 G/see. When these levels are exceeded, subjects turn pale, perspire, and<br />
exhibit transient rises in blood pressure. More severe loads result in unconsciousness.<br />
At the maximum acceleration loads which have been applied,<br />
immediate effects are sometimes not pronounced, but delayed effects occur with<br />
gradual onset over the next 24 hours (Stapp, 1955, 1965; Pesman & Eiband,<br />
1956; Stapp & Hughes, 1956; Stapp & Blount, 1957; Beeding & Mosely, 1960;<br />
Stapp et al., 1964).<br />
The most severe shock observed in human testing occurred in a<br />
rearward-facing (+Gx) impact of 82.6 G at 3826 G/see measured on the sternum,<br />
or 40.4 G measured on the sled at 2.139 G/see for 0.04 second's duration (12 to<br />
14 Hz resonant frequency). In this case there was no blood pressure for<br />
30seconds post-impact, returning to 70systolic and 40diastolic within<br />
5 minutes. The subject complained of severe lower back pain, then lost<br />
consciousness 10 seconds post-impact. He was hospitalized for 3 days to recover<br />
from headache and back pain (Stapp, 1961).<br />
For the lateral body orientation, tolerance has been defined as subject<br />
discomfort with prolonged stiffness and soreness in the neck musculature<br />
(Zaborowski et al., 1965). Tests reported by Sonntag (1966) have placed<br />
voluntary limits in lateral impact with lap belt restraint only at 12 G at which<br />
point anal sphincter pain, attributed to vagal effect and acute dilation of the<br />
sphincter, has been observed. Two episodes of fainting in shock response are<br />
reported, with bradycardia but no nonreversible physiological effects. Earlier,<br />
human tolerance determinations, based upon body kinematics, had placed<br />
tolerance with lap belt restraint alone as well as lap belt plus shoulder harness at<br />
9 G for 0.1 second's duration.<br />
Apollo Impact Tests<br />
In a study of predicted Apollo command module landing impacts, Stapp and<br />
Taylor (1964) observed that impact forces produced effects to the nervous,<br />
cardio-respiratory and musculo-skeletal systems. Neurological effects of impact<br />
were momentary stunning and disorientation. A consistent effect on the<br />
cardiovascular system was transitory post-impact slowing of the heart rate in
242 Bioastronautics Data Book<br />
those body orientations in which the decelerative force acts in a footward<br />
direction (inertial force acts headward). Respiratory effects of impact were<br />
momentary shortness of breath and chest pain. Effects to the musculo-skeletal<br />
system were soreness and spasm of muscle groups of the neck and back. No<br />
effect to the human subject was severe enough to exceed human tolerance or to<br />
cause significant incapacitation of undue pain (tables6-3 and 6-4). In table 6-3<br />
subjects" complaints are compiled into 10 categories. The numbers under the<br />
column heading "Category of Complaints" in table 6-3 correspond to thc<br />
categories listed in the note at the end of the table. In some tests, more than one<br />
complaint was registered. The "Complaint G Range" indicates the range of<br />
impact at which complaints occurred, as measured on the sled used in the tests.<br />
To date no evidence of cumulative effects due to repeated exposure to<br />
impact forces close to voluntary tolerance limits has been reported. However,<br />
the number of subjects and exposures are too limited, and physiological and<br />
psychological tests do not permit valid differentiation of subtle effects of such<br />
stress from the changes which occur with time in individuals unexposed to<br />
impact.<br />
Physiological response of man subjected to linear, lateral, vertical, and<br />
free-fall impact, along with transient neurological and psychological alterations<br />
which have been reported, are summarized in tables6-5 to 6-12. Changes<br />
associated with off-axis impact can be found in table 6-14 at the end of this<br />
chapter.<br />
Biomechanical Factors of Impact<br />
The design capability of manned aerospace vehicles is limited by both the<br />
biological and the biomechanical "breaking points" of the human body. The<br />
body consists of a skeletal structure, held together by tough fibers, which<br />
provides both mechanical support and a lever system upon which the muscles<br />
act. The basic structural component is the spinal column of vertebrae which has<br />
four curvatures. These curvatures are found only in man with his upright<br />
posture. The vertebrae act as load carrying elements and are separated by<br />
intervertebral discs. These act mechanically as energy absorbers and connecting<br />
linkages. The thoracic organs (heart, lungs, and liver), contained in the rib cage,<br />
and the abdominal viscera are suspended freely by connective tissues from the<br />
muscle and bone framework.<br />
Tissues of the human body show mechanical properties such as<br />
compressibility, elasticity, and shear and tensile strength. In general, biological<br />
materials are muhiphase, noifllomogeneous, anisotrophic, and nonlinear. Fluids<br />
are generally non-Newtonian and solids are non-Hookean. Much work has been<br />
done to determine the mechanical properties of tissues, but the<br />
stress-strain-history law is not known for any tissue (Fung, 1968). Live, whole<br />
body response is known to be nonlinear and to exhibit a high degree of rate<br />
sensitivity (McElhaney & Byars, 1967). The body responds to impact with<br />
considerable variation, both within the same individual and between<br />
different indMduals.
E<br />
0<br />
C<br />
e_<br />
.<<br />
.2=<br />
e_<br />
©<br />
_rr<br />
8_<br />
>_,C<br />
_E 0<br />
CJO<br />
_8<br />
w<br />
el-<br />
m<br />
E_<br />
o<br />
U<br />
8_<br />
c .c<br />
o_<br />
_'8<br />
m_<br />
6<br />
Z<br />
0<br />
Impact 243<br />
tllllllIIll]lllll I IIIII I<br />
_-g_,_<br />
_o_oo_ _ ® o_ _ _ _ _ _ _ E<br />
_o<br />
oo<br />
c<br />
I<br />
C m 0<br />
o<br />
-_ E_._<br />
I _ _ _<br />
,. ,_ ,_ _._<br />
"_ _. _. _,,," _'o_" _._" _" '_ T o<br />
m_m_m_o_o o__ _o_%<br />
__z_z=z__z_m_<br />
00000000000000000<br />
oog oo_oo_<br />
6d666666666666_oo<br />
0 0 0000 0<br />
08080000888888088<br />
0 00000 0<br />
9 9_9 9<br />
0<br />
_<br />
00000<br />
80088 oo<br />
0<br />
8<br />
._ u ._ I<br />
_ _,_ _.__<br />
0 _ (_ 0<br />
r- _3 I<br />
"_'_-<br />
E '_:E =<br />
"_ o "
244 Bioastronautics Data Book<br />
Significant Physical Findings<br />
Harness burns (all first degree)<br />
Dazed and disoriented (lasting no longer<br />
than two minutes post-impact)<br />
Respiratory difficulty (lasting no longer<br />
than one minute post-impa'_t)<br />
Blood pressure difference (20 mm Hg<br />
at pre and post run physical exam)<br />
Table 6-4<br />
Significant Physical Findings<br />
Post-Impact in Apollo Impact Tests<br />
Test Position Test Numbers<br />
2 1537<br />
Sled G<br />
20.0<br />
7 1552 23.0<br />
17 1163 t7.4<br />
1187 18.9<br />
1204 21.7<br />
1205 25.8<br />
1456 19.6<br />
19 1295 30.0<br />
24 1303 28.1<br />
1182 24.6<br />
1403 16.5<br />
9 1387 9.8<br />
1 1517 17.2<br />
21 1610 19.0<br />
17 1187 18.9<br />
23 1191 19.5<br />
18 1215 24.6<br />
1216 23.2<br />
24 1217 23.7<br />
1403 16.5<br />
19 1295 30.0<br />
23 1192 19.4<br />
Pulse difference (20 beats/min at pre 17 1456 19.6<br />
and post run physical exam) 24 1441 20.2<br />
Engorged retinal vessels<br />
Back and/or neck pain and decreased<br />
range of motion<br />
(Brown et al., 1966)<br />
12 1819 19.5<br />
17 1204 21.7<br />
3 1487 9.2<br />
17 1205 25.8<br />
1 1517 17.2<br />
5 1559 25.1<br />
1591 21.0
U'3<br />
I<br />
E--*<br />
0<br />
P_<br />
,.=<br />
©<br />
to<br />
o<br />
rr<br />
0<br />
U.<br />
Q.<br />
E<br />
I<br />
c<br />
0 0. f,..<br />
'g I _ ><br />
_- _ _<br />
.-,_ s a _<br />
.E _<br />
_ _=_.- _ _' _ _<br />
.... c_ _<br />
_: .... _I (J<br />
+_x+l +<br />
o<br />
I I I +1<br />
Impact 24,5<br />
-<br />
,.- > _<br />
0 0 D<br />
EE _ 8<br />
_- ._ ',,T, E<br />
•c _ _ o<br />
• ,_ E<br />
'_' ® G<br />
_m<br />
0<br />
_.=- ._ _ ,',<br />
__ _<br />
L_ --.-_ --<br />
c<br />
o<br />
"10<br />
re c<br />
_ I _ c0+<br />
o @ ; _I 8<br />
t_<br />
¢j_ QD rio 0<br />
XXe;A<br />
m _ :_ _ z<br />
w _._<br />
g eEo_<br />
_._ _ -_ _.__<br />
O0<br />
+<br />
I<br />
o I<br />
A<br />
E<br />
"I"
246 Bioastronautics Data Book<br />
v<br />
e_<br />
t_<br />
e_<br />
e- ;.rd"<br />
I _<br />
©<br />
t-<br />
O<br />
0.<br />
O<br />
It<br />
E<br />
111<br />
x<br />
>.<br />
-- o) u<br />
.-- -1-<br />
÷<br />
9 A<br />
m<br />
0<br />
0<br />
_,...<br />
0
E<br />
..=<br />
0<br />
e_<br />
e_<br />
0<br />
o_<br />
_o<br />
+_ -,-t<br />
,-4<br />
c_<br />
_:<br />
o<br />
_o_o<br />
Impact 247<br />
d °" 2<br />
u o<br />
"_o<br />
_ _ o _<br />
o<br />
_o<br />
_©_.<br />
_o_<br />
.-,.o<br />
-_.o_<br />
_4 U N m m _<br />
•,-t o m<br />
a) o<br />
+_<br />
&.<br />
+:
248 ]ti_)_lstr, maulics [ )ata Book<br />
!<br />
v<br />
E<br />
e-,<br />
,:2<br />
i<br />
_2<br />
o 0<br />
0<br />
c_<br />
,v<br />
L_¸ _<br />
r_<br />
,c:,<br />
d_, _,
h ¢_ 0 0<br />
d d d<br />
'J --<br />
8 o<br />
o %<br />
o', t_ .<br />
_._ _} _<br />
h % %<br />
tO, i<br />
,-i o_ ,--i °_<br />
,i87 _tS_ 0 73 - 17<br />
,5'<br />
× ul<br />
d<br />
A<br />
d<br />
t_m<br />
t_<br />
Impact 249<br />
o _<br />
_°_o_ o<br />
d<br />
t_N<br />
+_<br />
_o<br />
. "_<br />
co<br />
,-4 t--_<br />
[--i<br />
cl<br />
&<br />
d<br />
0<br />
E
250 Bioastronautics Data Book<br />
,,D<br />
O<br />
LT2<br />
O<br />
e_<br />
o<br />
.,4<br />
o_<br />
,,4<br />
U<br />
O<br />
_o<br />
t/a _<br />
_o_<br />
_._<br />
,'-4<br />
d<br />
6<br />
d<br />
cd<br />
-J<br />
oo<br />
,,_8 _<br />
E-_ _<br />
,_'._<br />
o_<br />
_ o<br />
_ ,<br />
___ +_<br />
_2<br />
0<br />
,-4<br />
_._d<br />
.2<br />
vv<br />
A<br />
,-t o4<br />
t_l<br />
z<br />
v<br />
0<br />
_°_<br />
,_<br />
,-4<br />
t_
I<br />
o<br />
u<br />
o<br />
_ o<br />
"_. _<br />
) m<br />
o<br />
Impact 251
252 Bioastronauties Data Book<br />
I",-<br />
,.,.q<br />
e_<br />
E<br />
5<br />
L_2<br />
e_<br />
0<br />
¢t-* 03<br />
"d<br />
•.4 U<br />
N_<br />
g_<br />
._dg<br />
,--2<br />
t_<br />
oo<br />
_ u-x<br />
c<br />
o_<br />
oo<br />
o ,-i<br />
oo<br />
_._<br />
_._<br />
._,_<br />
5_ __<br />
_._-_
,r"<br />
,©<br />
+_<br />
07<br />
o_ •<br />
_., e0<br />
,-4 _<br />
o _<br />
i,:4 I<br />
i<br />
ddz 1<br />
r ,<br />
m<br />
Impact 253<br />
i<br />
o -_ c]<br />
o-_o<br />
• :, .,4<br />
_ a<br />
• c: .<br />
¢,<br />
_ c m --<br />
_"_ I<br />
d_d I<br />
i<br />
,4 .-<br />
._) rr.<br />
_ .--4<br />
_ m<br />
., .t_<br />
•,-4 ,q _t<br />
r,<br />
¢6<br />
:i<br />
I<br />
dd d<br />
_a<br />
• ,q<br />
÷'N2<br />
_g_X<br />
t<br />
o<br />
d<br />
d_ _t<br />
Rg Lg<br />
. . .
254 Bioastronautics Data Book<br />
v<br />
¢d<br />
J<br />
¢¢<br />
+<br />
v<br />
!<br />
LT.<br />
i<br />
o<br />
'.4 :/_<br />
:t<br />
_.,-_ _<br />
y:<br />
• .55 ,; ;<br />
u_<br />
V<br />
o<br />
!<br />
-o _,<br />
_ o _ u<br />
1.<br />
al<br />
_ m<br />
o i<br />
o_<br />
i,rxh<br />
b-o<br />
J ?<br />
I c; c;<br />
o<br />
g<br />
_'_<br />
_o'_<br />
_o_,<br />
o,.<br />
J
o<br />
o<br />
A_<br />
cq<br />
,-4<br />
e_<br />
co<br />
o<br />
i<br />
Impact 255
256 Bioastronautics Data Book<br />
e-<br />
E<br />
..a<br />
,..=<br />
o<br />
¢,<br />
_J<br />
° ....<br />
4o<br />
0 0 0 _0<br />
4<br />
F<br />
-- ...<br />
vl '_1<br />
o .<br />
]aa .,0 _ la.<br />
°<br />
c_<br />
,4 •<br />
*.) o-,<br />
t_<br />
,q.<br />
m,<br />
r_<br />
t_<br />
,-4<br />
L,<br />
tr_<br />
2__<br />
_.<br />
i_-" _<br />
• °<br />
.-I r ¢,<br />
c_g_g_<br />
,,a
I<br />
_=<br />
0<br />
Impact 257<br />
N
258 Bioastronautics Data Book<br />
==<br />
_=<br />
@<br />
v<br />
v<br />
u<br />
g<br />
i<br />
u<br />
co<br />
m<br />
_'_._, "0<br />
-_ , ._._,<br />
? ? E
_v<br />
c<br />
c_<br />
-_<br />
c<br />
o.c<br />
_ _<br />
_L<br />
_,'_-__-_r ._= -_ .<br />
_, _o_ _oo _<br />
m<br />
m m<br />
Impact 259
260 Bioastronautics Data Book<br />
$<br />
_ o _ _ o_<br />
m t_ _<br />
,z _ _ e e e z<br />
o ss<br />
b<br />
° !<br />
_o_<br />
.gd _.<br />
o •<br />
H<br />
d<br />
g g<br />
,-I
+_<br />
_ o_<br />
d d ¢_<br />
r_<br />
r_<br />
o<br />
t_<br />
w_<br />
ol<br />
o_<br />
_ c 4 _<br />
Impact 261<br />
u_<br />
_ _° _'._ ° _<br />
..&_<br />
_. j -__.<br />
o_ ._<br />
.._
262 Bioastronautics Data Book<br />
¢¢<br />
E<br />
-t-<br />
O v<br />
v<br />
',D<br />
L_<br />
.2o<br />
"d<br />
.4<br />
U<br />
o u •<br />
_ o<br />
S_<br />
_8<br />
_ o_<br />
o o •<br />
I<br />
t<br />
3t<br />
_,33 t_<br />
2 _ _'_3S<br />
,o_ _<br />
,<br />
_n ,4<br />
_ _.
_ .._ .._ _<br />
4 • ad _t 0<br />
t-<br />
cl<br />
£)<br />
_.r_<br />
_._<br />
_o _ .<br />
Impact 263<br />
_ .<br />
?g_<br />
_.._'_ _<br />
.,400 _<br />
O _ _ O<br />
O<br />
O<br />
L_<br />
¢'4<br />
_4<br />
O _,-t<br />
_ O<br />
-,q<br />
7<br />
_; _ I<br />
m_<br />
_u.a<br />
• o<br />
o ©<br />
txl o_<br />
,.D _4<br />
o<br />
d_<br />
4_<br />
_,_ _ _<br />
o _<br />
6 c; _,<br />
g8 _<br />
...... ]<br />
tal<br />
i lu i<br />
-,_ o _ _ 0<br />
o -,_<br />
o<br />
a N<br />
0a
264 Bioastronautics I)ata Book<br />
,-__ _,<br />
o ten _<br />
-r_ C¢<br />
r,<br />
r_,;_ ° _,_<br />
,-4<br />
t_'4_ _ t_<br />
o _<br />
t,-- o_'_<br />
asg<br />
_ .<br />
.,-i<br />
N<br />
_;_
E<br />
Ld<br />
"6 0<br />
o_<br />
487 _58 0 73 -i_<br />
o<br />
0<br />
i<br />
o<br />
o<br />
¢0<br />
% .<br />
8 ,_ _,<br />
o<br />
S S<br />
o<br />
.,D<br />
o7<br />
X,<br />
ox o- '_<br />
Impact 265<br />
m iv
266 Bioastronautics Data Book<br />
t4<br />
,-t<br />
c;<br />
o<br />
co<br />
•,,'I --'t<br />
•_ co _"<br />
..,_..__<br />
r7 _<br />
°_<br />
_o _<br />
oo<br />
&<br />
o"<br />
c_<br />
_o_
I<br />
_J<br />
E<br />
_o<br />
0,1--.1-<br />
u_<br />
q:<br />
0 _c_<br />
o_<br />
w_<br />
Impact 267<br />
°_<br />
_N<br />
_°<br />
22_<br />
u ,--t<br />
v_<br />
0 '_<br />
E<br />
,-I<br />
e o<br />
_._<br />
_o_ o_<br />
_+_<br />
o_<br />
tel<br />
c;<br />
K
268 Bioastronautics Data Book<br />
r.<br />
o=<br />
",-4<br />
m<br />
0 0<br />
%<br />
+_'_<br />
03<br />
%7<br />
7,<br />
°' _<br />
,_, ,_<br />
{xl ,-4 t4 .,a<br />
o<br />
;a
o o<br />
m _q<br />
._ _;'_ _ o<br />
od<br />
--_oh®<br />
o_<br />
_gg<br />
t_ ..-4 _0<br />
Impact 269<br />
,0 I<br />
d 4_ m 0<br />
i_ ca c_<br />
a<br />
0 E! gh<br />
g<br />
°ili°<br />
o<br />
+_<br />
4-'<br />
_goe<br />
a3 ,_q
270 Bioastronautics Data Book<br />
_o<br />
,r_<br />
¢J<br />
°_ ._<br />
,-4<br />
:: o<br />
o<br />
_ o<br />
_,o_O<br />
¢_ o<br />
_5 . .<br />
_o<br />
_ o_<br />
-,-t .1-4 N<br />
_o_<br />
•_ _<br />
_ _ o<br />
o _<br />
_ o
Impact 271<br />
For each region of the body, specific tolerance can be defined. The physical<br />
properties of bone are best known, but much less information is available concerning<br />
physical properties of most soft tissues and organ systems. Such information<br />
is important since human tolerance to a specific impact may be limited<br />
by the soft tissue damage to a critical organ at levels far below skeletal structural<br />
failure. Damage may occur at the cellular level with no gross evidence of shear,<br />
tensile, or compressive forces. Such localized trauma may limit whole body<br />
tolerance to the lowest threshold of an organ or tissue.<br />
Any attempt at stress analysis of man with respect to impact forces must<br />
take into account the responses of the body as a whole: the simultaneous<br />
responses of different kinds and states of materials in the body structure, such as<br />
the pneumatic and hydraulic behavior of gases and fluids, plastic deformation of<br />
soft tissues, the stretching of mesenteries and ligaments by organ masses, and the<br />
nonlinearities prevalent throughout the body. Human stress analysis must<br />
determine reversible and irreversible, disabling and fatal failure criteria for the<br />
human structure, and should relate measurements to points of structural<br />
weakness or of load concentrations (yon Gierke, 1961). To better understand<br />
the mechanics of the body, mechanical analogs have been devised (Coermann et<br />
al., 1960; Shapland, 1961; Payne & Stech, 1962; Feder & Root, 1964;<br />
Kornhauser, 1964; NASA, 1965; yon Gierke, 1967; Stech & Payne, 1968).<br />
Eventually, there may be sufficient data about impedence of segments, body<br />
masses, coupling, damping, kinetics, and other features of the models so that<br />
they may permit accurate predictions about the effects of the random, multivectored,<br />
and, often, sequential forces that operate under actual impact<br />
environments.<br />
Lastly, biomechanical effects of impact arc dependent, as are physiological<br />
effects, upon the environmental complex surrounding the impact event, that is,<br />
body orientation, velocity, protection, and so forth.<br />
Physical Properties of Human Tissue<br />
Table 6-13 shows some physical properties of human tissue. Data concerning<br />
the strength of the vertebrae are also available (Ruff, 1950; Perey, 1957;<br />
Gurdjian, 1962; Crocker & Higgins, 1966; Henzel, 1967).<br />
Vertebral Fracture<br />
Escape ejection accelerations from high performance aircraft have<br />
resulted in vertebral injury, generally compression of the anterior lips of the<br />
lumbar or thoracic vertebrae (Stapp, 1959; Jones et al., 1964; Chubb et al.,<br />
1965; Ewing, 1966; Collins et al., 1968; Klopfenstein, 1969). This may be<br />
due to poor seat padding, seat contour, inadequate restraint, forced head<br />
flexion, poor trunk-thigh angle, or spinal extension or flexion (Jones et al.,<br />
1964). Approximately 80percent of all vertebral injuries occur in the<br />
thoracic region. Available literature to 1965 on ejection-related vertebral<br />
injuries in aircrew together with basic findings and analysis of the ejection<br />
environment are contained in a study by Higgins et al., (1965.)
272 Bioastronautics Data Book<br />
c-<br />
¢¢<br />
2<br />
ee_<br />
• Q<br />
QO0<br />
xxx<br />
I x _<br />
_ t'N<br />
0<br />
_%%%<br />
XXXXXXI<br />
I I<br />
_>'>,_<br />
_-._<br />
IXXIX<br />
O0 0<br />
_o m<br />
_%%%%<br />
XXXXX<br />
f I<br />
• . o ,_ ._ i_,<br />
"- a) ® lu_
Impact 273<br />
Compressive load analysis of vertebra-disc complexes have demonstrated<br />
that the vertebral end-plates are the initial failing structures of the spinal<br />
column (Brown et al., 1957; Snyder, 1958; Roaf, 1960; Patrick, 1961;<br />
Stech& Payne, 1963; Henzel, 1967). Vertebrae of cadavers fail at loads as<br />
low as 435 pounds (Patrick, 1961). Compression fractures of the vertebrae<br />
have occurred under experimental test conditions. An experimental impact<br />
at 16mph of a B-58escape capsule at 43.6G (spinal) measured on the<br />
subject resulted in one reported compression fracture of T-3 (Holeomb &<br />
Huheery, 1962).<br />
An ejection seat impact profile of 18.8 peak G for 100 msec with rate<br />
of onset of 420 G/see and body orientation 34 ° back from the vertical axis<br />
(+Gz) produced compression fractures to the fourth and fifth thoracic<br />
vertebrae in one subject. Others have been exposed to 26 G and velocity<br />
change of 8 m/see in the +Gz orientation (off-axis 45 °) under the same<br />
conditions with complaint of occasional "mild transient pain" over the area of<br />
the second to fifth thoracic vertebrae (Henzel et al., 1965). More recently a<br />
human volunteer received a compression fracture of the seventh thoracic<br />
vertebra under impact conditions of 16.62 +Gz peak sled G, with an onset rate<br />
of ll60G/sec, entrance velocity of 39.8ft/sec and braking distance of<br />
26.5 inches (Klopfenstein, 1969).<br />
End-plate and vertebral body injury is much more apt to occur during spinal<br />
axial loading than is intervertebral disc disruption (Ruff, 1950; Perey, 1957;<br />
Roar, 1960; Henzel, 1967). Work by Kazarian et al., (1968) has identified file<br />
mechanisms of other vertebral body iujuries in +Gz vertical impact. There is<br />
general agreement that a peak of 20 to 21 G for a duration of less than<br />
0.1 second at a rate of onset of 250 to 300 G/sec is tolerable if the spine is<br />
properly positioned for +Gz impact (Watts et al., 1947b; Beckman et al., 1953;<br />
Jones et al., 1964). A thorough review of the biomechanical aspects of vertebral<br />
injury is found in ttenzel (1967). A viscoelastic rod model which includes<br />
damping has been used to simulate the spinal column mathematically (Terry &<br />
Roberts, 1968).<br />
Head Injury<br />
Injury to the head is the most frequent and severe result of impact, and<br />
75 percent of aircraft crash fatalities may be attributed to head injury. Usually<br />
such trauma occurs through head contact with the structure or projections<br />
rather than the action of acceleration forces on the head as a whole. The shape<br />
and elastic properties of the object injuring the head and exposure time are of<br />
prime importance in determining the degree of injury. Dynamic load measurements<br />
on the skull and knee bone conducted with less than 1 in.2 penetrators<br />
(such as a control knob) show that skull penetration takes place in five steps:<br />
initial load build-up as the penetrator loads the entire skull structure; sudden<br />
penetration of the outer layer of compact bone, with abrupt falloff in load, in<br />
primarily a tensile fracture approximately the circumference of the penetrator;<br />
compression of the diploe layer; a cone_haped shear failure extending to the<br />
hmer layer of compact bone; and finally fracture of the inner table in the form
274 Bioastronautics Data Book<br />
of a plug larger than the diameteof the penetrator. Soft tissue does not<br />
significantly (10 percent) alter the skull penetration load (Melvin et al., 1969).<br />
The frontal and occipital bones of the skull have been the subject of<br />
numerous impact studies (Gurdjian et al., 1949; Lissner & Evans, 1958;<br />
Gurdjian, 1962), but limited data are available related to lateral (_zGy) impact<br />
tolerance of the parietal or temporal bones (Nahum et al., 1968). Experimental<br />
studies in progress indicate that lateral blows to the parietal or temporal area<br />
result in fracture at about half the loads required to fracture a frontal bone.<br />
Within the conditions studied, the total energy required for skull fracture of<br />
frontal bone varies from 400 to 900 in.-Ib, with an average often assumed to be<br />
600 in.-lb (6.8 x 10⁸ ergs) (Roth, 1967).<br />
Experimental studies also indicate that facial bones fracture due to tension,<br />
not compression (Huelke, 1962). tlodgson (1967) found that 1000 lb of force<br />
was tolerated for durations of 3 msec or less, while impacts lasting beyond<br />
4 mscc produced fracture at approximately 2001b for a lin.2 area of<br />
distribution.<br />
A mathematical model describing the response of the cadaver zygomatic<br />
(check) bones to blunt impact has been used (Hodgson et al., 1966). Impacts as<br />
low as 30 to 40 G for 10 to 40 msec may produce transient unconsciousness.<br />
Fracture tolerance for the facial bones is about 30 G for the nose, 50 G<br />
cheekbone, 100 G for teeth (3.6 in2), 40 G mandible, 80 G for 3 msec (1 in.2<br />
area), or 150 G (4 in.2 area) for the forehead (Swearingen, 1965). For a contact<br />
area of 1 in.2, fracture tolerance values for the cheekbone have been found to<br />
approximate 200 to 225 lb, for the temporal-parietal (side of head) area, 450 to<br />
550 Ib,and 900 to 1100 Ib, for the frontal area (Nahum et al., 1968). A 600 Hz<br />
natural frequency, 0.01 damping factor, 9.5 ib simple system has been found to<br />
represent occiput acceleration response to impacts on the forehead for a 1 in.2<br />
area (within 5 percent), for a wide range of pulse durations and acceleration<br />
amplitudes in the cadaver (Hodgson & Patrick, 1968). Such results must be used<br />
with caution for the living human.<br />
Neck injury, especially to the cervical spinal cord at the first vertebra,<br />
appears to occur from hyperextension rearwards followed by abrupt flexion<br />
when the whole body is accelerated from back to front without head support.<br />
Neck injury may be aggravated by the increased mass of a helmet. Concussion<br />
may be accompanied by deformation or fracture of the skull with shear strains<br />
throughout the brain. An experimental model of the human head shows the<br />
existence of pressure gradients along three orthogonal axes, and at levels of<br />
impact to the forehead of less than 80 G, the pressure gradients are linear in<br />
shape. Cerebrospinal fluid flow can produce shear stresses previously<br />
demonstrated in the region of the brain stem (Roberts et al., 1966). There is a<br />
voluminous literature regarding head impact, skull fracture, cervical injury, and<br />
the mechanisms of brain injury (Lindgren, 1966; Caveness & Walker, 1966;<br />
National Institutes of Health, 1969; Gurdjian et al., 1970; Hodgson, 1970;<br />
Thomas, 1970).
Lower Limb Fracture<br />
Impact 275<br />
Mechanical stiffness of the lower limbs (Hirsch & White, 1965) and the<br />
fracture tolerance to bending force in impact (Snyder, 1961; Young, 1967;<br />
Mather, 1968) have been studied. The lower leg (tibia) can tolerate a<br />
concentrated impact of 1000 to 1500 lb prior to fracture (Young, 1967), and<br />
the knee and leg voluntary limit is 1050 Ib, with the fracture level at about<br />
1500 lb (SAE, 1970).<br />
Soft Tissues<br />
The mechanical properties of soft tissues have had limited study. The skin<br />
appears to fail more often in a tensile or cohesive manner than from a shearing<br />
or cutting action. Penetration resistance of human skin is thought to be about<br />
15 to 20 Ib (Gadd et al., 1967). Data are available relative to mechanical<br />
properties of the tendons, muscles, blood vessels (refer to extensive references in<br />
Fang, 1958) and the nervous system (Ommaya, 1968).<br />
Visceral motion responses in humans have been measured by<br />
cineradiography. Sixteen subjects were exposed to triangular deceleration pulses<br />
(velocity change of up to 2.44 m/sec, time duration of about 7.5 msec, peak<br />
acceleration up to 654 m/sec) with successive radiographic images (60/scc)<br />
obtained during the impulse. A density wave was observed and interpreted as a<br />
shear wave (dilation) traveling through the abdomen and torso. It was concluded<br />
that voluntary tolerance may be below 4 m/scc (13 ft/sec velocity change) (Weis<br />
& Mohr, 1967).<br />
Resonance and Impedance<br />
Studies such as that cited above suggest that the heart, great vessel branches,<br />
and associated visceral attachments behave as a spring-mass system with<br />
subcritical damping frequency of 7.5Hz for the human diaphragm when the<br />
abdominal musculature is relaxed voluntarily at impact 0Veis & Mohr, 1967).<br />
Whole body vibration studies with humans (von Gierke, 1964) suggest the<br />
thoracic viscera may respond as a spring-mass system with viscous damping. In<br />
these studies 4.5 Hz is reported for the diaphragm and heart (yon Gierke, 1964).<br />
Analysis of 29 human impact tests in the Gx position on the Daisy Decelerator<br />
indicated that the natural frequency of the response measured by sternum<br />
accelerometers varies inversely as the duration of the onset of the input<br />
deceleration. The value of the product of response frequency (Hertz) and onset<br />
duration (seconds) is approximately 0.5 (Chandler, 1962).<br />
The general impedance concept is ordinarily used in conditions where the<br />
motion is rectilinear but applies equally well for angular motions or<br />
combinations of rectilinear and angular motions (Weis & Primiano, 1966).<br />
Figure 6-11 illustrates some human impedance results. The figure indicates that<br />
except for the sitting and standing positions during steady-state vibration,<br />
impedance magnitude ranges from zero at low frequencies to higher values at<br />
higher frequencies. Critical frequencies are found at 7 and 12 Hz (Weis et al.,<br />
1963b, 1964). The locations of resonances obtained from transient data may not
276 Bioastronauties Data Book<br />
always coincide with those obtained under vibration conditions (Bowen et al.,<br />
1966). The human mechanical impedance for a particular experimental condition<br />
can be used to determine the motion of the human center of mass in the<br />
same condition (Weis & Primiano, 1966), although the effective center of mass<br />
for mechanical impendanee may not be the center of gravity.<br />
:t<br />
SFTTI_'5<br />
stu_ supmt<br />
taU_mL[NTm,,S_<br />
r_tQ_Nc_ - c p s<br />
01 _o _o 2oo<br />
r mE_l_ T cps<br />
!_o _v.Lt _ reals/<br />
_,o,j J<br />
....... ';o......;o'o<br />
_nEOU[NC_ - c r, s<br />
i<br />
i<br />
......_b<br />
o_ _o<br />
FRtQU_CY cos<br />
r_[OUENC_ cP_<br />
o_ _o _o 2oo<br />
Figure 6-I1. Human mechanical driving impedance in the transient (impact)environment.<br />
The impedance magnitudes and phase angles reveal critical frequencies at approximately 7<br />
Hz and 12 Hz. The impedance magnitude lends toward zero at tow frequencies and toward<br />
higher values at higher frequencies. This indicates that man is much like a pure mass over the<br />
frequency range of 0-20 Hz, but that resonances in certain frequency ranges depend upon<br />
body orientation. (After Weis et al., 1964)<br />
In impact exposure of less than one second when no fluid shifts have time to<br />
occur, it is believed that physiological effects are caused by localized pressures<br />
and relative tissue displacements. These may develop into pathological trauma if<br />
the mechanical stress limits of the tissues involved are exceeded. It has been<br />
found that the physical response of the body and its organs, and the impedance<br />
of this response on the duration and shape of the acceleration time function, can<br />
be calculated when the appropriate mechanical system, representative for the<br />
body or the particular situation, is known (Latham, 1957; Shapland, 1961;
hnpaet 277<br />
Payne, 1961a; Kornhauser, 1961, 1964; Linder, 1962; Feder & Root, 1964;<br />
Barrett & Payne, 1965; NASA, 1965; Stecb & Payne, 1968). Conditions involving<br />
unusual acceleration profiles in accidental or operational situations, nonlinearity in<br />
response of tissue, and limitation of complete directional data for the whole body<br />
tend to limit use of these models to first order approximations for aerospace design<br />
purposes.<br />
If the impact duration is to the same order of magnitude or larger than the<br />
natural periods of the body systems, maximum effect of impact functions usually<br />
results. Excitation follows a pattern from the dynamic response factor for the<br />
transient response of linear structures to shock typical of that shown in figure 6-12.<br />
Curves of equal physical displacement of organs are shown as a function of pulse<br />
duration and maximum acceleration. In such tolerance curves (see figures 6-5 and<br />
6-12) if the pulse duration is much shorter than the natural period of a system, the<br />
response is only dependent on the acceleration time integral, "impulse." It is equal<br />
to the differences in velocity of the system before and after impact and ceases to be<br />
a direct function of the peak acceleration (NASA, 1965). The curves in figure 6-12<br />
represent undamped responses, but note that the more complex damped responses<br />
more realistically represent the actual condition (Barrett & Payne 1965).<br />
2<br />
cc<br />
<<br />
Z<br />
>a<br />
0<br />
uJ<br />
¢-r<br />
0<br />
I.-<br />
_.1<br />
<<br />
1oo<br />
i ,',<br />
01 0.I I I0 100<br />
J PULSE LENGTH/PERIOD t-/To<br />
PULSE DURATtQN o_ FOR NATURAL o_ FREQUENCY ..... i ....... QF 55Hz lsec) _b<br />
.001 01 0.1 1<br />
PULSE DURATION FOR NATURAL FREQUENCY OF 30 Hz (sec)<br />
Figure 6-12. Theoretical impact tolerance curves of a one-degree-of-freedom system.<br />
Curves of equal physical displacement of organs as a function of pulse duration and max.<br />
acceleration. Figure shows, for various types of pulses, pulse height (as a function of ratio of<br />
pulse length to natural period of the system) needed to achieve same max. displacement of<br />
the system. (T = natural period of system; t = pulse duration). Pulse duration scales on<br />
abscissa are for a system with resonance at 5.5 Hz (main body resonance) and for a system<br />
with resonance at 30Hz (head resonance). (yon Gierke, 1964a, Transient acceleration<br />
vibration and noise problems in space flight. In Bioastronautics, copyright by the MacMillan<br />
Company, 1964, and used with their permission)
ttioastronautics l)ala Book<br />
In general resonant-response analysis applies to interaction of flexibily linked<br />
body masses, and probably to natural frequency characteristics of internally<br />
suspended organs, but factors relating to more sustained force application may<br />
determine the stress limit. Voluntary tolerance of the lower spinal column in<br />
_Gz vertical (longitudinal) impact of less than 6 G amplitude at sustained lowfrequency<br />
vibrations is in contrast to 20G, and even 50 G single impact<br />
tolerance under well-defined conditions (yon Gierke, 1961). This well illustrates<br />
the danger ill arbitrary conclusions about tolerance, stress limits, and generalized<br />
application of criteria beyond their definitions.<br />
Impact Other Than Along Primary Axis ("Off Axis")<br />
The majority of experimental impact studies have been concerned with<br />
simple, uniaxial accelerations. Few studies have been conducted of multiaxial<br />
acceleration and resultant inertial responses. The orientation of thc acceleration<br />
vector is a (:ritical factor in human tolerance limitations since the body<br />
structures and man's dynamic respon_ characteristics vary with the direction of<br />
the applied force. The ()dentation of the acceleration vector may be random and<br />
uncontrolled during aerospace emergency escape, the sequential acceleration<br />
environment, and i, ground landing impact in closed capsules. The polar<br />
e()ordinate system, in which orientation is expressed in terms of degrees of roll,<br />
pitch, and yaw, has been developed to define the precise multiaxial profiles<br />
tested (figure 6-13).<br />
fY<br />
POSTE_IO_ CLN_<br />
90" rNCL UO_'T_ ANG. F<br />
j / --,,<br />
't '7 ,o<br />
i; i_ "le<br />
[I<br />
SL[O POSIT tONS<br />
3 0 005 320<br />
4 0 055 530<br />
§ 0 045 0<br />
6 0 035 030<br />
7 0 005 040<br />
085<br />
iO 0 085 220<br />
II 0 085 270<br />
I_ 0 08,5 320<br />
I 3 0 085 0<br />
I 4 0 085 040<br />
5 O O85 090<br />
I 6 0 085 I 40<br />
-94 I 7 0 045 i80<br />
8 0 035 210<br />
I 9 0 005 220<br />
20 0 355 ZlO<br />
21 0 315 180<br />
_'Z 0 335 120<br />
3 0 005 140<br />
24 0 035 150<br />
NOTE DECELERATION FORCE<br />
ACTS TOWARD SUS4_CT<br />
Figure 6-13. Seated subject orientation in 0-0-0 polar coordinates of roll, pitch and yaw<br />
relative to direction of sled motion and resultant inertial force. Such a system is used to<br />
describe off-axis impacts involving complex multiaxis decelerations. Numbered lines<br />
represent direction of forces applied to subject during impact. Columns on right indicate<br />
translation of force orientations into seat position. (After Brown et al.,1966;<br />
Chandler, 1967'o; Stapp, 1968)
Impact 279<br />
To date only one study has been conducted of human response to the<br />
acceleration profiles of Project Mercury 0Veis et al., 1963a), and two studies<br />
have been conducted related to Project Apollo profiles (Stapp & Taylor, 1964;<br />
Brown et al., 1966). Table 6-14 provides a summary of other studies in which<br />
response of man and animals to impact loads at variable axes is known.<br />
A summary of the acceleration profiles and responses noted in subjects<br />
exposed to off-axis accelerations while seated in form-fitting couches used in<br />
Project Mercury is presented in figure 6-14 and table 6-15. In these experiments<br />
the 20 subjects wore the Mercury pressure suit hehnet and sat in a rigid vehicle,<br />
restrained with a low elasticity chest and pelvic harness, and were exposed to six<br />
deceleration profiles in seven orientations. In the lateral (+Gy) tests, both rigid<br />
foam couches and semirigid "microballoon" couches were used which were<br />
molded to the body contour. A vertical drop tower device was employed to<br />
decelerate the falling vehicle when a shaped plunger entered the water. In<br />
deceleration profiles ranging up to 26G (peak), 28ft/sec velocity, and<br />
2000 G/sec rate of onset, subjective tolerance levels were not reached (Weis et<br />
al., 1963). Transient premature ventricular contractions were produced, but no<br />
injuries occurred.<br />
For Project Apollo, Stubbs (1966, 1967) reviewed impact modes predicted<br />
at the couch in Apollo landings. Stapp and Taylor (1964) studied human<br />
response to predicted Apollo command module landing impacts in 146 tests of<br />
58 human volunteers, as did Brown et al., (1966) in 288 experiments. In the first<br />
series, impact forces were studied in 16 body positions in a combination of pitch<br />
and yaw, in seven configurations of onset at 1000, 1500, and 2000 G/sec, at<br />
magnitudes of 10, 15, 20, and 25G, and at durations from O.060to<br />
O.130second. The volunteer subject sat in a seat mounted in three sets of<br />
gimbals prodding 10° increments in yaw (0 ° to 360°), pitch (0 ° to 180°), and<br />
roll (0 ° to 180°), on a sled suspended by four slippers between cylindrical rails.<br />
Post-impact bradycardia of less than 30 seconds' duration resulted from<br />
headward force vectors exceeding 15 G magnitude. Stomach mobility or<br />
displacement occurs during whole body impact when angular force<br />
movements exceed 40 ° or more from the line of motion (in pitch or yaw.)<br />
No significant changes in blood or urine were recorded. All body positions<br />
and impact configurations studied were within voluntary tolerance limits<br />
except the forward-facing 45 ° reclining position. A forward-facing subject<br />
tipped back 45 ° in pitch sustained simultaneous compression and<br />
hyperflexion of the trunk by force vectors at right angles which produced<br />
persistent soft tissue injury in the sixth, seventh, and eighth thoracic<br />
vertebrae areas, from impact of 25 G at 960 G/sec in 97 msec. Loose<br />
restraints contributed to whole body resonancc amplification of impact.<br />
With a less sophisticated harness restraint system than the one used in the<br />
Apollo study, compression deformities of the fourth and fifth thoracic vertebrae<br />
have been reported in a human test subject exposed in laboratory experiments to<br />
an impact acceleration profile similar to that produced by ejection seat rockets.<br />
This injury was presumed to be the result of an impact profile having a peak<br />
acceleration of 18.8 G, a rate of onset of 420 G/sec and a base line duration of<br />
approximately 100 msec. The subject's long axis was inclined backward 34 °
280 Bioastronautics Data Book<br />
,o<br />
s °_<br />
4_7 _33 () 73 1_,<br />
Impact 281
282 Bioastronautics Data Book<br />
_o<br />
u<br />
o<br />
u<br />
S<br />
o°Sg<br />
+<br />
I<br />
o<br />
+<br />
+ + I+ _. u _: o m mo<br />
_o +" :_:+++++<br />
!_!:-,<br />
++o,..++<br />
+6<br />
7<br />
.. o'_ _+ I+ ,_<br />
+.-,o p. _ • ....++!+_<br />
.,&<br />
o<br />
o _ _
_ n<br />
_ _°<br />
%<br />
-o<br />
o_<br />
lmpact 283
284 Bioastronautics Data Book<br />
from the vertical force vector (Roth, 1967). Stapp and Taylor (1964)<br />
recommend head fixation, energy attenuation to keep impact force below 20 G<br />
magnitude and above 60 msec pulse duration, and automatic retraction of the<br />
harness prior to impact to prevent slack and relative body motion. The most<br />
favorable position was found to be backward-facing (+Gx), bowing 45° from<br />
vertical.<br />
Information relative to the effects of simultaneous muhiaxial impact forces<br />
combined with other environment conditions are not known. For data on<br />
complex multi-environmental stresses, the reader is referred to chapter 19.<br />
X-AXIS<br />
_e_,___ Z-AXIS<br />
*AX'S #33<br />
(b)<br />
R"h' 9° /N4"''''oo<br />
1ooo--- _- .....<br />
"_ 80C '<br />
1-<br />
200<br />
/ -u.<br />
(a)<br />
0 llll<br />
0.I .2 .3 .5 1.0 2 3 5 10 20 30 50 100<br />
FREQUENCY - cyc_ell/sec<br />
Figure 6-14. Off-axis impact: a Project Mercury profile. Data for tolcrability of impacts<br />
applied Laterally and off major body axes. A: Directions of impact for 5 positions 45 ° off<br />
axis, and for +Gy axis. B: Power density spectra of 6 deceleration profiles ranging from<br />
13.4 - 26.6 G wiih onsets from 426-177 G/sec. No injuries resulted. (Adapted from Weis<br />
et al., 1963)
m<br />
,E<br />
OO<br />
C<br />
o<br />
gl<br />
oo<br />
r<br />
r_<br />
E,.<br />
O3<br />
0<br />
Z<br />
C .-'0 _<br />
2:<br />
Impact 285<br />
_JZ<br />
•_: ._- = =<br />
_-=_,_<br />
.5 1_,2 _ > c,o<br />
>a at---o-5,. _c<br />
t_ "0-- "0<br />
,-¢ c E"4,_<br />
__ ,u,, .a .<br />
_o= o_,Ec _._ c<br />
o<br />
.tz<br />
m<br />
.C_"0<br />
C'9 _3Z<br />
O. °'E<br />
._o_<br />
P _.__<br />
o<br />
z<br />
O<br />
Z<br />
%<br />
n'-<br />
0 0<br />
z z<br />
G o<br />
0 .X I_1<br />
.__<br />
I<br />
_'o'_ _<br />
._ i e-_ .<br />
o LO<br />
,-_oc<br />
_',_<br />
D.<br />
D<br />
o<br />
Z<br />
o<br />
z<br />
6<br />
o<br />
c o<br />
c _<br />
o<br />
.__E_<br />
I-'G ,.<br />
3<br />
,,6<br />
c e_<br />
_, _ _ _<br />
= "°_-'° _ o<br />
-D 0 _-,<br />
•_ _ o._ ._ ':-<br />
•-=. o. _ m'o "o _ i _<br />
_ua. c :<br />
_ o<br />
a_ z .-_<br />
u .E<br />
o<br />
0 ._ .c<br />
Z ._<br />
.E .E<br />
0 0 0 0<br />
Z Z Z Z<br />
0 0 0 0<br />
Z Z Z Z<br />
o o<br />
o to 0 0<br />
_°o _o o_ 0<br />
><br />
.c<br />
.c o_<br />
00<br />
o<br />
I<br />
_-._"<br />
,'- •<br />
I E
286 Bioastronauties Data Book<br />
References<br />
Air Force Systems Command, Headquarters. Handbook of Instructions for Aircraft Design<br />
(HIAD). Rept. ARCDM-80-1, Andrews AFB, Washington, D.C. 1960.<br />
Aldman, B. Biodynamic studies on impact protection. Acta Physiologica Scandinavia, 1962,<br />
56(192), 1.<br />
Ames, W. H. Tolerance to acceleration in the automatic pilot ejection seat. U.S. Army<br />
Medical Department Bulletin, 1947, 7(9).<br />
Barrett, S. & Payne, P. R. ,Response of a linear damped dynamic s/stem to selected<br />
acceleration inputs. Rept. AMRL TR-6540, Aerospace Medical Research Labs., Wright-<br />
Patterson AFB, Ohio, April 1965.<br />
Bcckmazl, E. L., Zicgler, J. E., Duane, T. D., & Hunter, H. N. Some observations on human<br />
tolerance to accelerative stress. Phase II. Preliminary studies on primates subjected to<br />
maximum simple accelerative loads. Journal of Aviation Medicine, 1953, 24(5),<br />
377-392.<br />
Beeding, E. L., Jr. Daisy track and supporting systems. Rept. AFADC TR-8, 6571st<br />
Aeromcdical Research Laboratory, Holloman AFB, New Mexico, June 1957a.<br />
Bceding, E. L., Jr. Daisy track tests. Rept. AFMDC TR-57-6, 6571st Aeromedical Research<br />
Laboratory, HoUoman AFB, New Mexico, April-June 1957b.<br />
Beeding, E. L., Jr. Daisy track tests. Rept. AFMDC TR-58-7, 6571st Aeromedical Research<br />
Laboratory, Holloman AFB, New Mexico, June 1958.<br />
Beeding, E. L., Jr. Daisy tract tests - test numbers 338-519. Rept. AFMDC TR-59-14,<br />
6571st Aeromedical Research Laboratory, Holloman AFB, New Mexico, May-July<br />
1959.<br />
Beeding, E. L., Jr. Daisy decelerator tests. Rept. AFMDC 60-4, 6571st Aeromedical<br />
Research Laboratory, Itolloman AFB, New Mexico, July 1960.<br />
Beeding, E. L., Jr. Human forward-facing impact tolerance. Aerospace Medicine, 1961,<br />
32(3), 220.<br />
Beeding, E. L., Jr., & Cook, J. E. Correlation tests of animals and humans. 5th Stapp<br />
Automotive Crash Field Demonstration Conference, 1962.<br />
Beeding, E. L., Jr., & Hessberg, Jr. Daisy track tests 271-337. Rept. AFMDC TR 28-8, Run<br />
4 Feb.-9 May 1958, 1958.<br />
Beeding, E. L., Jr., & Mosely, J. D. Human deceleration tests. Rept. AFMDC-TN-60-2, Air<br />
Force Missile Development Center, Holloman AFB, New Mexico, January 1960.<br />
Bierman, H. R. The protection of the human body from impact forces of fatal magnitude.<br />
Military Surgeon, 1947, 100-125.<br />
Bierman, H. R., & Larson, V. R. Reactions of the human to impact forces revealed by high<br />
speed motion picture technique. Journal of Aviation Medicine, 1946, 17, 407-412.<br />
Bierman, H. R., & Larson, V. R. Distribution of impact forces on the human through<br />
restraining devices. Project X-630, Report No. 4, Naval Medical Research Institute,<br />
Bethesda, Maryland, March 1946.<br />
Bierman, it. R., Wilder, R. M., Jr., & Hellems, H. K. The principles of protection of the<br />
human body as applied in a restrainittg harness for aircraft pilots. Project X-630, Rept.<br />
6, Naval Medical Research Institute, Bethesda, Maryland, May 1946.<br />
Bierman, H. R., Wilder, R. M., Jr., & Hellems, H. K. The physiological effect of compressive<br />
forces on the torso. Project X-630, Rept. 8, NavalMedical Research Institute, Bethesda,<br />
Maryland, December 1946.<br />
Bolend. (Unpublished test data), 1970.
Impact 287<br />
Bowen, 1. G., Fletcher, E. R. et at. Biophysical mechanisms and scaling procedures<br />
applicable in assessing responses of the thorax energized by air-blast overprcssures or by<br />
non-penetrating missiles. DASA-1857, Defense Atomic Support Agency, Washington,<br />
D.C., November 1966.<br />
Brown, T., Hanscn, R. V., & Yorra, A. S. Some mechanical tests on the lumbosacral spine<br />
with particular reference to the intervertebral discs, a preliminary report. Journal of<br />
Bone and Joint Surgery, 1957, 39(5), 1135-1164.<br />
Brown, W. K., Rodastein, J. D., &Fostcr, P. Human response to predicted Apollo landing<br />
impacts in selected body orientations. Aerospace Medicine, 1966, 3 7(4), 394-398.<br />
Caveness, W. F., & Walker, A. E. (Eds.) Head injury conference proceedings. Philadelphia:<br />
J. B. Lippincott Co., 1966.<br />
Chandler, R. F. Unpublished communication. National Bureau of Standards, Washington,<br />
D.C., 1970.<br />
Chandler, R. F. The daisy decelerator. Rept. ARL-TR-67, 3, 6571st Aeromedical Research<br />
Laboratory, Holloman AFB, New Mexico, May 1967.<br />
Chandler, R. F. Lateral impact data. Unpublished summary, 6571st Aeromedical Field<br />
Laboratory, Holloman AFB, New Mexico, January 1966.<br />
Chandler, R. F. Determination of equivalent natural frequency indicated by accelcrometers<br />
mounted over the sternum during human impact in the G x direction. Rept.<br />
ARL-TDR-62-29, 6571st Aeromedical Research Laboratory, Holloman AFB, New<br />
Mexico, December 1962.<br />
Chubb, R. M., Dietrick, W. R., & Shannon, R.H. Compression fractures of the spine during<br />
USAF ejections. Aerospace Medicine, 1965, 36,968-972.<br />
Coburn, K. R. Physiological end points in acceleration research. Aerospace Medicine, 1970,<br />
41(1), 5-11.<br />
Coermann, R. R., Ziegenruecker, G. H., Wittmer, A. L. et at. The passive dynamic<br />
mechanical properties of the human thorax-abdomen system and of the whole body<br />
system. Aerospace Medicine, 1960, 31,443-455.<br />
Cofer, F. S., Sweeney, H. M., & Frenier, C. E. History of development since 1941: USAF<br />
ejection seats. ASTIA ATI, 1946, 9213.<br />
Collins, T. A., Sawyer, C. H., Ferrari, V. J., & Shannon, R. H. Five-year injury experience in<br />
escape from USAF ejection seat equipped aircraft. Aerospace Medicine, 1968, 39,<br />
627-632.<br />
Cook, J. E., & Mosely, J. D. Visceral displacement in black bears subjected to abrupt<br />
deceleration. Aerospace Medicine, 1960, 31(1), 1.<br />
Critz, G. T., Highly, F. M., Jr., & Hendler, E. Determination of human tolerance to negative<br />
impact acceleration. Phase 1I. Paper (2)presented at the 34th Annual Meeting of the<br />
Aerospace Medical Association, Los Angeles, California, April-May, 1963.<br />
Crocker, J. R., & Higgins, L. S. Phase IV, investigation of sla'ength of isolated vertebrae.<br />
TI-1313-66-2, Technology, Inc., Dayton, Ohio, May 1966.<br />
Davydov, B. I., Antipov, V. V., & Saksonov, P. P. Reactivity of the irradiated organism<br />
during acceleration of critical magnitude. Cosmic Research, 1965, 3(1), 97-102.<br />
Translated from Kosmicheskie lssledovaniya, 1965, 3(1 ), 159-166.<br />
DeHaven, H. Mechanical analysis of survival in falls from heights of fifty to one hundred<br />
and fifty feet. War Medicine, 1942, 2, 586.<br />
DeHaven, H., & PetiT, R. M. Informative accident number 7- Crash injury research.<br />
Cornell University, Medical College Crash Injury Research, May 1948.<br />
Dixon, F., & Patterson, J. L. Determination of accelerative forces acting on man in flight<br />
and in the human centrifuge. Project NMO01 059.04.01, U.S. Naval School of Aviation<br />
Medicine, Pensacola, 1953.
288 Bioastronautics Data Book<br />
Eiband, A. M. Human tolerance to rapidly applied accelerations: A summary of the<br />
literature. NASA Memo-5-19-59E, June 1959.<br />
Ewing, C. L. Vertebral fracture in jet aircraft accidents: A statistical analysis for the period<br />
1959 through 1963, U.S. Navy. Aerospace Medicine, 1966, 37(5), 505-508.<br />
Ewing, C. L., Thomas, D. J., Patrick, L. M., Beeler, G. W., & Smith, M. J. Living human<br />
dynamic response to -Gx impact acceleration. II. Accelerations measured on the head<br />
and neck. Thirteenth Stapp Car Crash Conference, Society of Automotive Engineers,<br />
Inc., New York, 1969.<br />
Feder, H. C. & Root, E. H. Dynamic response analysis of +Gx impact on man.<br />
ARL-TR-64-11, Aeromedical Research Laboratory, Holloman AFB, New Mexico,<br />
November 1964.<br />
Foster, P., & Sonntag, R. W., Jr. Urinary excretion of catecholamines and 17-hydroxycortieosteroids<br />
following +G x impact in humans. Aerospace Medicine, 1969, 40(1),<br />
18-23.<br />
Fung, Y. B. Biomechanics: its scope, history, and some problems of continuum mechanics<br />
in physiology. Applied Mechanics Review, 1968, 21(1 ), 1-20.<br />
Gadd, C. W., Peterson, F. J., & Lange, W. A. Strength of skin and its measurement with<br />
special application to trauma. American Society of Mechanical Engineers, New York.<br />
Biomeehanics Monograph 1967, 184-191.<br />
Gazenko, O. G., Antipov, V. V., Parfenov, G. P., & Saksonov, P. P. Results of a biological<br />
experiment conducted aboard the automatic station "Zond-5". Aerospace Medicine,<br />
1969, 40(11), 1244-1247.<br />
Geertz, A. Grenzen und sonderprobleme 6ei der anwendung yon sitnkatapulten. [Limits<br />
and special problems in the use of seat catapults[, Translation No. U 10-46-22, AAF<br />
Aero Medical Center, 1944.<br />
Cell, D. F. Table of equivalents for acceleration terminology: Recommended for general<br />
international use by the Acceleration Committee of the Aerospace Medical Panel,<br />
AGARD. Aerospace Medicine, 1961, 32, 1109-1111.<br />
General Dynamics/Convair. Capsule escape system specifications, FZC-4-344(G), San<br />
Diego, Calif., February 1961.<br />
Goldman, D. R., & von Gierke, H. E. The effects of shock and vibration on man. Lecture<br />
and Review Series No. 60-3, Naval Medical Research Institute, Bethesda, Maryland,<br />
January 1960.<br />
Gurdjian, E. S. Experiences in head injury and skeletal research. In Impact Acceleration<br />
Stress Symposium, Brooks AFB, Texas, November 1961. NAS-NRC-977, National<br />
Academy of Sciences, National Research Council, Washington, D.C. 1962.<br />
Gurdjian, E. S., Webster, J. E., & Lissner, H. L. Studies on skull fracture with particular<br />
reference to engineering factors. Journal of American Surgery, 1949, 78, 736-742.<br />
Gurdjian, E. S., Lissner, H. R., Webster, J. E., Latimer, F. R., & Haddad, B. F. Studies of<br />
experimental concussion. Relation of physiologic effect to time duration of intracranial<br />
pressure increase at impact. Neurology, 1954, 4,674-681.<br />
Gurdjian, E. S., Lange, W. A., Patrick, L. M., & Thomas, L. M. Impact injury and crash<br />
protection. Springfield: C. C. Thomas, 1970.<br />
Hanson, P. G. Maximum voluntary ventilation after +G x impact in humans. Rept.<br />
ARL-TR-65-22, 6571st Aeromedical Research Laboratory, Holloman AFB, New<br />
Mexico, November 1965.<br />
Hanson, P. G., & Foster, P. Urinary excretion of vanilmondelic acid after +G x impact in<br />
humans. Rept. ARL-TR-66-6, 6571st Aeromedical Laboratory, Holloman AFB, New<br />
Mexico, March 1966.<br />
Hirsch, C., & White, L. A. Mechanical stiffness of man's lower limbs. ASME Paper No. 65<br />
WA/HUF.4, 1965.
hnpact 289<br />
Hodgson, V. R. Physical factors related to experimental concussion. In Impact injury and<br />
crash protection. Springfield: Charles C. Thomas, 1970.<br />
Hodgson, V. R. Tolerance of the facial hones to impact. American Journal of Anatomy,<br />
1967, 120, 113-122.<br />
Hodgson, V. R., Lange, W. A., & TalwMker, R.K. Injury to the faciM boues. Proceedings of<br />
the Ninth Stapp Car Crash Conference. St. Paul: Univcrsity of Minnesota Press, 1966.<br />
}Iodgson, V. R., & Patrick, L. M. Dynamic response of the human cadaver head compared<br />
to a simple mathematical model. Proceedings of the Twelfth Stapp Car Crash<br />
Conference. Society of Automoliw_ Engineers, Inc., New York, 1968.<br />
Holcomb, G. A. Impact studies of the United States aerospace industry, presented at the<br />
Symposium on Impact Acceleration Strea_, Brooks AFB, San Antonio, Texas, Novem_r<br />
1961.<br />
ttolcomb, G. A., & Huhecy, M. A minimal compression fracture of T-3 as a result of<br />
impact. In Impact acceleration stress Publication 977, National Academy of Sciences,<br />
National Research Council, Washington, D.C., 1962.<br />
Headley, R. N., Brinkley, J. C., Lokatos, G., & Managan, R. F. Human faclors responses<br />
during ground impact. Aerospace Medicine, 1962, 33(2), 141.<br />
llenzel, J. It., Clarke, N. P., Mohr, G. C., & Wets, E. B., Jr. Compression fractures of<br />
thoracic vertebrae apparently resulting from experimental impact, a case report. Rcpt.<br />
AMRL-TR-65-134, Aerospace Medical Laboratories, Wrig.Jtl-Pattcrson AFB, Ohio,<br />
August 1965.<br />
itenzel, J. H. 'llw human spinal column and upward ejection acceleration: an appraisal of<br />
biodynamic implications. Rept. AMRL-TR-66-233, Aerospace Medical Laboratories,<br />
Weigh t-Patterson AFB, Ohio, September 1967.<br />
}{ensehkc, U. Acceleration tolerances of the human body. ASTIA ATI, 1945, 59,705.<br />
Higgins, L. S., Enfield, S. A., & Marshall, R.J. Studies on vertebral injuries sustained during<br />
aircrcw ejection. Technolog3' incorporated final report. Office of Naval Research,<br />
Washington, I).C., May 1965.<br />
Itighly, F. M., Critz, G. T., & Hendler, E. Determination of human tolerance to negative<br />
impact acceleration. Paper (1)presented at the 34th Annual Meeting of the Aerospace<br />
Medical As_ciation, Los Angeles, California, April-May 1963.<br />
Huclkc, D. F. Biomechmlical studies of fl_c face. Impact acceleration stress,Publication 977,<br />
reprint, National Academy of Sciences, National Rc_areh Council, Washingl_m, D.C.,<br />
1962.<br />
Jones, W. L., Madden, W. F., & Lucdeman, G. W. Ejection _a! accelerations and injuries.<br />
Aerospace Medicine, 1964, 35(6), 559-562.<br />
Kalogeris, J. G. Pilot emergency escape upper torso harness support development lest of<br />
Model F- 106 A. A STIA A D, 1956, I,I4,950.<br />
Kazarian, L. E., yon Gierkc, It. E., & Mohr, G. C. Mechanics of vertebral body injury as a<br />
result of G z spinal impact. Presented at the 39th Annual Meeting, Aerospace Medical<br />
Association, Bal Harbour, Florida, 1968.<br />
Klopfenstein, H. W. Compression fracture of tire seveufll thoracic w:rtcbra cau_d by<br />
experimental impact: a ca_c n:porl. Paper presented al the 40th Annual Scientific<br />
Meeting, Aerospace Medical Association, San Francisco, May 1969.<br />
Kornhauscr, M. Structural effects of impact. Baltimore: Spartan Books, Inc., 1964.<br />
Latham, F. A study in body b',dlistics: scat ejection. Series B. Proceedings of the Royal<br />
Society, (London), 1957, 147, 121-139.<br />
Latham, F. Linear deceleration studies and human tolerance. Clinical Science, 1958, 17( 1 ),<br />
121.
290 Bioastronautics Data Book<br />
Lewis, S. T., & Stapp, J.P. A crash restraint demonstrator. Report TN 57-9, Holloman<br />
AFB, New Mexico, June 1957(a).<br />
Lewis, S. T., & Stapp, J. P. Experiments conducted on a swing device for determining<br />
human tolerance to lap belt type decelerations. Report TN 57-1, Holloman AFB, New<br />
Mexico, December 1957(b).<br />
Lewis, S. T., & Stapp, J. P. Human tolerance to aircraft seat belt restraint. Journal of<br />
Aviation Medicine, 1958, 29(1), 187-196.<br />
Linder, G. S. Mechanical vibration effects on human beings. Aerospace Medicine, 1962, 33,<br />
939-950.<br />
Lingren, S. O. Experimental studies of mechanical effects in head impact. Aeta Chirurgica<br />
Scandinavica, 1966, Supplementum 360, Stockholm.<br />
Lisaner, H. L., & Evans, F. G. Engineering aspects of fractures. Clinical Orthopedics, 1958,<br />
8, 310-322.<br />
Lombard, C. F., Close, P., Theide, F. C., & Larmie, F. Impact tolerance of guinea pigs<br />
related to orientation and containment. Aerospace Medicine, 1964(a), 35( 1 ), 1-6.<br />
Lombard, C. F., Bronson, D. S., Theide, F. C., Close, P., & Larmie, F. Pathology and<br />
physiology of guinea pigs under selected conditions of impact and support restraint.<br />
Aerospace Medicine, 1964(b), 35(9), 860-866.<br />
Lovelace, W. R., Baldes, E., & Wulff, V. J. The ejection seat for emergency escape from<br />
high-speed aircraft. ASTIA ATI, 1945, 7245.<br />
McElhaney, J. H., & Byars, E. F. Dynamic response of biological materials. American<br />
Society of Mechanical Engineers, New York. Biomechanic_ Monograph, 1967.<br />
Martinez, J. L., Wickstrom, J. K., & Barcelo, B. T. The whiplash injury-a study of<br />
head-neck action and injuries in animals. American Society of Mechanical Engineers,<br />
65-WA/HUF-6, 1965.<br />
Mather, B. S. Observations on the effects of static and impact loading on the human femur.<br />
Journal of Biomeehanics, 1968, 1(4), 331-336.<br />
Melvin, J., Fuller, P., Daniels, R., & Pavliscak, G. Human head and knee tolerance to<br />
localized impacts. Report 690477, Society of Automotive Engineers, Inc., May 1969.<br />
Nahum, A. M., Gotts, J. D., Gadd, C. W., & Danforth, J. Impact tolerance of the skull and<br />
face. Proceedings of Twelfth Stapp Car Crash Conference, Society of Automotive<br />
Engineers, Inc., New York, 1968.<br />
National Academy of Sciences, National Research Council. Symposium on impact<br />
acceleration stress, with a comprehensive chronological bibliography, Brooks AFB,<br />
Texas, November 1961. NAS-NRC-977, Washington, D.C., 1962.<br />
National Aeronautics and Space Administration. A study of the dynamic model technique<br />
in the analysis of human tolerance to acceleration. NASA-TN-D-2645, Stanley Aviation<br />
Corporation, Denver, Colorado, March 1965.<br />
National Institutes of Health. A survey of current head injury research. A report prepared by<br />
the subcomittee on head injury, National Advisory Neurological Diseases and Stroke<br />
Council for the National Institutes of Health, Bethesda, Maryland, 1969.<br />
Noble, R., Mendelsen, E. S., & Watts, D.T. Dynamic responses in the ejection seat system.<br />
Bureau of Aeronautics Report No. 5, TED NAM-255005, Navy Department, August<br />
1947.<br />
Ommya, A. K. Mechanical properties of the tissues of the nervous system. Journal of<br />
Biomeehanics, 1968, 1(2), 127-138.<br />
Patrick, L.M. Caudo-cephalod static and dynamic injuries to the vertebrae. The Fifth Stapp<br />
Automotive Crash and Field Demonstration Conference, The University of Minnesota,<br />
Minneapolis, 1961.
Impact 291<br />
Payne, P. R. The dynamics of human restraint _stems. In Impact Acceleration Stress.<br />
Proceedings of the National Academy of Sciences-National Research Council Publication<br />
977, November 1961(a).<br />
Payne, P. R. An analog computer which determines human tolerance to acceleration.<br />
Report 101-1, Frost Engineering Development Corp., Denver, Colorado, 1961(b).<br />
Payne, P. R., & Stech, E. L. Human body dynamics under _ort-term acceleration. Tech.<br />
Rept. 115-2, Frost Engineering Development Corp., Denver, Colorado, June 1962.<br />
Perey, O. Fracture of the vertebral end plate in the lumbar spine. Acta Orthopedica<br />
Scandinavica, Supplement XXV, 1957, Stockholm.<br />
Pesrnan, G. J., & Eiband, A. M. Crash injury. NACA-TN-3775, 1956.<br />
Piotrowski, J. P. The effects of low-level sub-injury impacts on the heart rates of humans.<br />
Masters Thesis, State University of New York at Buffalo, January 1968.<br />
Reader, D. C. The restraint afforded by tile USAF and proposed RAF IAM seat harnesses<br />
for the F-111 under high forward and lateral decelerations. RAF Institute of Aviation<br />
Medicine, Farnsborough, England, September 1967.<br />
Rhein, L. W., & Taylor, E. R. Increased skeletal muscle activity following impact. ARL<br />
TDR 62-26, December 1962.<br />
Richter, H., Bateman, J. B., Lovelace, W. R., Baldes, C. J., & Wulff, V. J. Ejection<br />
experiments with the catapult scat. ASTIA ATI 1945, Appendix 9, 7245.<br />
Roaf, A. A study of the mechanics of spinal injuries. Journal of Bone and Joint Surgery,<br />
1960, 42(4), 810.<br />
Roberts, V. L., Hodgson, V. R., _ Thomas, L. M. Fluid pre_ure gradients caused by impact<br />
to the human skull. Paper 66-ttUF-I, presented before ASME meeting, 1966.<br />
Robinson, F. R., Hamlin, R. L., Wolff, W. M., & Coermann, R. R. Response of the rhesus<br />
monkey to lateral impact. Aerospace Medicine, 1963, 34(1), 56-62.<br />
Roth, E. M. (Ed.) Impact. In Compendium of human responses to the aerospace<br />
environment. Vol. If, Section 7, 1967. Prepared under Contract No. NASA-115 by<br />
Lovelace Foundation for Medical Education and Research for National Aeronautics and<br />
Space Administration, Report NASA CR-1205 (11).<br />
Rothstein, J. D., & Brown, W. K. Feasibility study. Lateral impact with standard aircraft<br />
harness configuration. Rept. ARL-TR-66-3, 6571st Aeromedieal Research Laboratory,<br />
Holloman AFB, New Mexico, 1966.<br />
Ruff, S. Human resistance to certain types of uneven acceleration. ASTIA ATI, 1942,<br />
47632.<br />
Ruff, S. Brief acceleration: less than one _cond. German Aviation Medicine-World War II,<br />
1950, 1 122 and 139. Department of the Air Force, Washington, D.C.<br />
Ryan, J. J. Human crash deceleration tests on _at belts. Aerospace Medicine, 1962, 33(2),<br />
167.<br />
Savely, H. E., & Ames, W. H. Arm rests on ejectio,l scats. TSE AA 695-66G, Air Technical<br />
Service Command, January 1948.<br />
Savely, H. E., Ames, W. H., & Sweency, H. M. Laboratory tests of catapult ejection scat<br />
using human subjects. ASTL4 AT I, 1946, 119947.<br />
Schrenk, O., irrgang, R., Lovelace, W. R. et al. Studies on the catapult scat. Technische<br />
Berichte, 1941, 8, 24-30.<br />
Shapland, I). J. The dynamic model, an engineering approach to the problem of tolerance<br />
to abrupt accelerations. Stanley Aviation Corporation. Paper presented at the<br />
Symposium on Impact Acceleration Slress, Brooks AFB, San Antonio, Texas, November<br />
1961.
292 Bioastronautics Data Book<br />
Shaw, R. S. Human tolerance to negative acceleration of short duration. Journal of<br />
Aviation Medicine, 1948, 19(1), 39.<br />
Snyder, R. G. et al. Pathology of trauma attributed to restraint systems in crash impacts.<br />
Aerospace Medicine, 1968, 39(8), 812-829. (a)<br />
Snyder, R. G. Impact injury tolerances of infants and children in free fall. Paper presented<br />
at Thirteenth Conference of the American Association for Automotive Medicine,<br />
University of Minnesota, October 1969.<br />
Snyder, R. G. Terminal velocity impacts into mow. Military Medicine, 1966(a), 131(10),<br />
1290-1298.<br />
Snyder, R. G. Physiological effects of impact: Man and other mammals. In P. L. Mlanan &<br />
D. S. Dittmer (Eds.), Environmental biology. AMRL-TR-66-194, Aerospace Medical<br />
Research Laboratories, Wright-Patterson AFB, Ohio, 1966(b).<br />
Snyder, R. G. Survival of high-velocity free-falls in water. FAA-AM-65-12, Federal Aviation<br />
Agency, Oklahoma City, Oklahoma, April 1965.<br />
Snyder, R. G. Human tolerances to extreme impacts in free-fall. Aerospace Medicine, 1963,<br />
34(8), 695-709.<br />
Snyder, R. G. A case of survival of extreme vertical impact in seated position. Civil<br />
Aeromedical Research Institute Report 62-19, October 1962.<br />
Snyder, R. G. Tibial fracture in cadaver impacts. Civil Aeromedical Research Institute,<br />
Federal Aviation Agency, Washington, D.C., 1961. (Unpublished report)<br />
Snyder, R. G. Unpublished test data, 1958.<br />
Snyder, R. G., & Snow, C. C. Fatal injuries resulting from extreme water impact. Aerospace<br />
Medicine, 1967, 38(8), 779-783.<br />
Snyder, R. G., Young, J. W., & Snow, C. C. Experimental impact protection with advanced<br />
automotive restraint systems: Preliminary primate tests with air bag and inertial<br />
reel/inverted-Y yoke torso harness. Yleventh Stapp Car Crash Conference, Society of<br />
Automotive Engineers, Inc, New York, 1968. (b)<br />
Society of Automotive Engineers. Human tolerance to impact conditions as related to<br />
motor vehicle design. SAE J885b, SAE Information Report (in preparation, revised<br />
version of SAE J885a), 1970.<br />
Soliday, S. M., & Schohan, B. Task loading of pilots in simulated low-altitude high-speed<br />
flight. Human Factors, 1965, 7, 45-53.<br />
Sonntag, R. W. lntracranial pressure in Macaca speciosa during controlled abrupt<br />
deceleration. In Prepriats of Scientific Program, Annual Scientific Meeting, Aerospace<br />
Medical Association, Washington, D.C., April 1967.<br />
Sonntag, R. Unpublished test data with human volunteers. 6571st Aerospace Medical<br />
Laboratory, tlolloman AFB, New Mexico, 1966.<br />
Stapp, J. P. Human exposures to linear deceleration. Part I, Preliminary survey of aft-facing<br />
seated position. AF Tech. Rept. 5915, June 1949.<br />
Stapp, J. P. Human exposures to linear deceleration, Part II, The forward-facing position<br />
and the development of a crash harness. December 1951(a).<br />
Stapp, J. P. Human exposure to linear decelerative forces in the backward-facing seated<br />
positions. Military Surgeon, 1951(b), 109, 106-108.<br />
Stapp, J. P. Human and chimpanzee tolerance to linear decelerative force. Paper presented<br />
at Conference on Problems of Emergency Escape in High Speed Flight. Wright-Patterson<br />
AFB, Ohio, September 1952.<br />
Stapp, J. P. Crash protection in air transports. (Notes 1947 pig tests Holloman rocket sled.)<br />
Aeronautical Engineering Review, 1953, 12(4), 71-78.
Impact 293<br />
Stapp, J. P. Tolerance to abrupt deceleration. Collected papers on aviation medicine.<br />
Advisory Group for Aeronautical Research and Development, North Atlantic Treaty<br />
Organization, Butterworths Scientific Publications, London, 1955(a).<br />
Stapp, J. P. Effects of mechanical force on living tissues. I. Abrupt deceleration and<br />
windblast. Journal of Aviation Medicine, 1955(b), 26,268-288.<br />
Stapp, J. P. Accelerations of space flight. Preprint No. 700-58, American Rocket Society,<br />
November 1958(a).<br />
Stapp, J. P. Biodynamics of manned space flight. Air University Quarterly Review, 1958(b),<br />
10(2), 47-52.<br />
Stapp, J. P. Escape from aircraft. In E. Evard, P. Bergeret, & P. M. Van Wulfften Palthie<br />
(Eds.), Medical aspects of flight safety. London: Pergamon Press, 1959.<br />
Stapp, J. P. Unpublished manuscript. Jolt effects of impact on mall. November ! 961(a).<br />
Stapp, J. P. Human tolerance to severe, abrupt acceleration. In Ganer & Zuidcma (Eds.),<br />
Gravitational stress in aerospace medicine. Boston: Little, Brown & Co., 1961(b).<br />
Stapp, J. P., Mosely, J. D., Lombard, C. F., & Nelson, G. A. Part I. Biodynamies of<br />
maximal decelerations. Part !1. l)ynanlic respon_ of restrained subject during abrupt<br />
deceleration. Analyzed and biodynamics of selected rocket-sled experiments. I]SAF<br />
School of Aerospace Medicine, July 1964.<br />
Stapp, J. P. Collected data on 46 rocket _ed experiments (Holloman AFB). NSL-65-94,<br />
Northrop Space Labs., Hawthorne, Calif., May 1965.<br />
Stapp, J. P. Voluntary human tolerance levels. Paper presented at Wayne Slate University<br />
Ceutcnnial-Biomechanics Symposium, Detroit, Michigan, May 1968. (in press)<br />
Stapp, J. P., & Blount, W. C. Effects of mechanical force on living tissues. I!i. A<br />
compressed air catapult for high impact forces. Journal of Aviation Medicine, 1957, 28,<br />
281-290.<br />
Stapp, J. P., & Hughes, C. D. Effects of mechanical forcc on living tissues. I!. Supersonic<br />
deceleration and windblast. Journal of Aviation Medicine, 1956, 27, 407-413.<br />
Stapp, J. P., & Taylor, E. R. Space cabin landing vector effects on human physiology.<br />
Aerospace Medicine, 1964, 35, 1117-1132.<br />
Stapp, J. P., Taylor, E. R., & Chandler, R. Effects of pitch angle on impact tolerance. In C.<br />
C. Thomas, Proceedings of the Seventh Stapp Car CraWl C_mfcrcncc, 1965.<br />
Stapp, J. P. Whole body tolerance to impact. In P. L. Altman & D. S. Dittmer (Eds.),<br />
Environmental biology, AMRL-TR-66-194, Aerospace Medical Research Labs,<br />
Wright-Patterson AFB, Ohio, November 1966.<br />
Stapp, J. P. Voluntary human tolerance levels. Paper presented at Wayne State University<br />
Centennial Biomechanics Symposium, Detroit, Michigan, May 1968.<br />
Steeh, E. L., & Payne, P. R. The effect of age on vertebral braking strength, spinal<br />
frequency and tolerance to acceleration in human beings. Rept. No. 122-101, Frost<br />
Engineering Development Corp., Denver, January 1963.<br />
Stech, E. L., & Payne, P. R. Dynamic models of the human body. Rept. AMRL-FR-66-157,<br />
Aerospace Medical Research Laboratories, Wright-Patterson AFB, Ohio, 1968.<br />
Stubbs, S. M. Landing characteristics of the Apollo spacecraft with deployed-heat-shield<br />
impact attenuation systems. NASA-TN-D-3059, January 1966.<br />
Stubbs, S. M. Dynamic model investigation of water pressures and accelerations<br />
encountered during landings of the Apollo spacecraft. NASA-TN-D-3980, September<br />
1967.<br />
Stuekman, E. C. Project Mercury pilot support system development live specimen<br />
experiment. McDormeli Aircraft Corporation Report 6875(11), 1959.<br />
Swearingen, J. J., Garner, J. D., McFadden, E. B., & Blethrow, J. G. Human voluntary<br />
tolerance to vertical impact. Aerospace Medicine, 1960, 31(12), 989.
294 Bioastronautics Data Book<br />
Swearingen, J. J. Tolerance of the human face to crash impact. FAA-AM-65-20, Federal<br />
Aviation Agency, Oklahoma City, Oklahoma, July 1965.<br />
Taylor, E. R. Thrombocytopenia following abrupt deceleration. ARL-TDR-62-30,<br />
HoUoman AFB, New Mexico, December 1962.<br />
Taylor, E. R. Biodynamics, past, present and future. Rept. ARL-TDR-63-10, 6571st<br />
AeromedicM Research Laboratory, HoUoman AFB, New Mexico, March 1963.<br />
Taylor, E. R., Rhein, L. W., & Beers, G. R. Effect of atropine upon the relative bradycardia<br />
associated with impact. Rept. No. ARL TDR 62-13, 6571st Aeromedical Research<br />
Laboratory, Holloman AFB, New Mexico, August 1962.<br />
Taylor, E. R., Rhein, L. W., Carter, V. L., & Chandler, R. The effects of severe impact on<br />
bears. 6571st Aerospace Medical Research Laboratory, Holloman AFB, New Mexico,<br />
ARL-TDR-64-6, July 1964.<br />
Terry, C. T., & Roberts, V. L. A viseoeleastic model of the human spine subjected to +G z<br />
accelerations. Journal of Biomechanics, 1968, 1,161-168.<br />
Thomas, L. M. Mechanics of' head injury. Ill Impact injury and crash protection.<br />
Springfield, II1.: Charles C. Thomas, 1970.<br />
Thompson, A. B. A proposed new concept for estimating limit of human tolerance to<br />
impact acceleration. Paper presented at 33rd Annual Aerospace Medical Association<br />
Meeting, Atlantic City, New Jersey, April 1962.<br />
United States Air Force. Crash protection and escape/survival. Section 392, Chapt. 3,<br />
Aerospace vehicle safety design. Headquarters, Air Force Systems Command, design<br />
handbook, series 1-0, general. AFSC D-I! 1-6, System safety. (Second Ed.), July 1969.<br />
yon Gierke, |t. E. Biomechanics of impact injury. In Impact Acceleration Stress,<br />
Publication 977, National Academy of Sciences National Research Council, 1962.<br />
yon Gierke, H. E. Transient acceleration, vibration and noise problems in space flight, In K.<br />
E. Schaefer (Ed.), Bioastronauties. New York: MacMillan, 1964(a).<br />
yon Gierke, H. E. Biodynamic response of the human body. Applied Mechanics Review,<br />
1964(b), ! 7(12), 951-958.<br />
yon Gierke, H. E. Response of file body to mechanical forces an overview. In Lectures in<br />
Aerospace Medicine, Sixth series, School of Aerospace Medicine, Brooks AFB, Texas,<br />
February 1967.<br />
yon Gierke, H. E., & Goldman, D. E. Effects of shock and vibration on mart. Shock and<br />
vibration handbook. New York: McGraw-Hill, 1961.<br />
Watts, D. T., Mendelson, E. S., & Hunter, tl. N. Evaluation of face curtain and arm rest for<br />
use on ejection seats. Bureau of Aeronautics Report No. 4, TED NAM-256005, Navy<br />
Department, Washington, D.C., 1947(a).<br />
Watts, D. T., Mendelson, E. S., & Korufield, A. T. Human tolerance to accelerations applied<br />
from seat to head during ejection seat tests; pilot's escape from high performance<br />
aircraft mechanism for development and test of. ASTIA ATI, 1947(b), 206 052.<br />
Webb, P. Impact and vibration. In P. Webb (Ed.), Bioastrotmutics data book.<br />
N ASA-SP-3006, 1964.<br />
Weis, E. B., Jr., & Primiano, F. P., Jr. The motion of the human center of mass and its<br />
relationship to the mechanical impedance. Rept. AMRL-TR-65-50, Aerospace Medical<br />
Research Laboratories, Wright-Patterson AFB, Ohio, June 1966.<br />
Weis, E. B., Jr., Clarke, N. P., & Brinkley, J. W. Human response to several impact<br />
acceleration orientations and patterns. Aerospace Medicine, 1963(a), 34(12),<br />
1122-1129.<br />
Weis, E. B., Jr., yon Gierke, H. E., & Clarke, N. P. Mechanical impedance as a tool in<br />
biomechanics. ASME-63-WA-280, 1963. American Society of Mechanical Engineers,<br />
Winter Annum Meeting, Philadelphia, Pa., November 1963(b).
Impact 295<br />
Weis, E. B., Brinkley, J. W., Clarke, N. P., & Temple, W. E. Human response to lateral<br />
impact. Paper presented at 34111 Annum Meeting of the Aerospace Medical Association,<br />
Los Angeles, Calif., April-May 1963(c).<br />
Weis, E. B. Jr., Clarke, N. P., & Brinkley, J. W. Mechanical impedance as a tool in research<br />
on human response to ac_leration. Aerospace Medicine, 1964, 35(10) 945-950.<br />
Weis, E. B. Jr., & Mohr, G. C. Cincradrographic analysis of human visceral responses to<br />
short duration impact. Aerospace Medicine, 1967, 38(10), 1041-1044.<br />
Young, J. W. Unpublished report. Tibial fractures in cadavers. 1967.<br />
Zaborowski, A. ttuman tolerance to lateral impact with lap belt only. 8th Stapp car crash<br />
and field demonstration conference, Wayne State University Press, Detroit, 1966.<br />
Zaborowski, A. V., Rothstein, J. D., & Brown, W. K. Investigations in human tolerance to<br />
lateral impact. Paper presented at 36th annum meeting, Aerospace Medical Association,<br />
New York, April 1965.
CHAPTER 7<br />
VIBRATION<br />
by<br />
Richard J. Hornick, Ph.D.<br />
Litton Systems, Inc.<br />
Travel in vehicles of all types subjects man to mechanical vibration. This<br />
chapter presents the results of investigations concerning vibration that con-<br />
tribute meaningful data which may be applied to the design of future transport<br />
systems. Emphasis is placed on data describing man's reactions to vibration<br />
rather than on the vibration characteristics of vehicles. Vibration characteristics<br />
of future vehicles will vary in accordance with differences in size, propulsion<br />
system, mass, and maneuvering envelopes, while man's reactions to vibration<br />
intensity and frequency can be expected to remain essentially constant.<br />
Vibration effects described in this chapter are organized into the following<br />
areas: performance effects reflected in tracking proficiency, reaction time,<br />
visual impairment, and other measures related to man's ability to control a<br />
system; physiological reactions; biodynamic responses; subjective reactions; and<br />
human "tolerance" limits. Most attention is placed on performance effects<br />
because of the importance of human performance in the operation of<br />
sophisticated man-machine systems and because a significant amount of<br />
performance data has been developed in recent years. Technological refinements<br />
in shaker systems, better experimental designs, and better attempts to control<br />
other attendant variables have all served to give recent data a greater degree of<br />
validity.<br />
Major vehicular resonances generally occur in the range of l to 30 cycles per<br />
second (liz)*. Man's performance capability is known to be affected by<br />
frequencies in that range. Further, whole body and organic resonances occur in<br />
this range with potential adverse effects for physiological responses and<br />
subjective" tolerance. It is for these reasons that the bulk of human vibration<br />
studies have been conducted in this low frequency band.<br />
*Hertz (Hz)has been adopted as the standard notation for cycles/second.<br />
Reviewed by Henning E. yon Gierke, Dr. Eng., Wright-Patterson Air Force Base.<br />
487-858 0 - 73 20<br />
297
298 Bioastronautics Dala Book<br />
Certain types of motion are not extensively treated in this chapter.<br />
Oscillation below 1 tlz is not usually characterized as vibration since such<br />
motion is not known to affect performance or body resonances. Instead, motion<br />
sickness associated with otolith stimulation is the most severe effect of motion<br />
below 1 Hz. Frequencies above 30 to 60 ttz are not normally a problem for man,<br />
and, in any case, are easily damped by body-support cushioning as well as by the<br />
tissues of the human body.<br />
Another form of vibration not treated extensively here is localized vibration;<br />
that is, vibration appfied to a limited body area such as the fingertips or the<br />
hand. That type of vibration occurs primarily with the use of hand tools such as<br />
pneumatic jackhammers. This problem has become less severe in recent years<br />
due to tile increasing use of automated power equipment.<br />
Very few animal studies are cited. They have been selected only as they<br />
exemplify a need for some consideration important for the human.<br />
Terminology of Motion Axes<br />
The Vibration Environment<br />
Terminology for the vibration environment is generally consistent with that<br />
described in chapter 6, Impact. However, whereas bias or steady state acceleration<br />
is identified with an upper case "G," oscillatory vibration is described with<br />
a lower case "g." The complete description of a vibration environment includes<br />
identification of the bias acceleration. Figure 7-1 and table 7-1 illustrate the<br />
major axes of motion and the terminology involved.<br />
+G,, . '- x<br />
_Gv /<br />
+G z<br />
Figure 7-1. Major body axes for acceleration and vibration description.
o ©<br />
._=<br />
.<<br />
Vibration 299<br />
+_ +1 +1<br />
__ $ ,_o<br />
u. I (_<br />
.&<br />
E _ QJ Q;<br />
m I ..J<br />
+ I + I + I<br />
1.1.1 ILl I.U _ ttt<br />
E
300 Bioaslronautics Data Book<br />
To describe completely thc vibration environmcnt for a given situation,<br />
uondimensional G and g units arc used. In the case of a human standing upright<br />
in a laboratory on a shake table moving in a direction parallel to the spine, the<br />
description would appear as +lGz%tg z where r2 would be quantified. In a<br />
spacecraft during boost, with the occupants in the usu',d scmisupine posilion and<br />
with vibration being experienced laterally with respect to the body, the dynamic<br />
environment might be described as +3.5Gx-+O.5g v. An astronaut would be<br />
experiencing a 3.5 G boost acceleration force, eyeballs in,with vibration mo_ing<br />
him from side to side.<br />
Mathematical Derivations<br />
Vibration is characterized by the periodic displacement of a mass over time<br />
and is dcfincd hy the amplitude and the frequency of .the displacement.<br />
Mathematic',rl expressions for sinusoidai vibration are derived from two basic<br />
parameters--frequency and amplitude. Frequency can be expressed in any<br />
manner related to a time scale -cycles per second (cps), cycles per minute<br />
(cpm), Ilertz (ttz), etc. The Hz notation will be used in this chapter.<br />
Conpled with frequency is amplitude or intensity. Amplitude is typic',dly<br />
expressed by velocity, acceleration, or jerk quantities. The amplitude quantities<br />
have bccn cxpresscd in metric terms and, more often in the United States, in<br />
inches or feet pcr second. A useful quantity is the nondimensional g which can<br />
lx_ ronvcrtcd into any kind of cxpn:ssion which the user wishes to employ.<br />
Sinusoidal Vibration. For simple harmonic motion, the following relationships<br />
exist between acceleration, velocity, and displacement (Society of<br />
Automotive Engineers, 1965):<br />
x = xo sin (2 7r t)t = xo (_)t<br />
V¢ her("<br />
x = instantaneous displacement from static position, inches<br />
xo = maximum displacement amplitude front static position, inches<br />
t = time from zero displacement, seconds<br />
f : frequency of oscillation, Hz<br />
: 2 7rf, radians per second<br />
Since the number of gravities of vibration acceleration can be exprcssed as<br />
the following:<br />
(2 7rf) 2 xo sin 2 rrft<br />
g- G
where<br />
then<br />
where<br />
G = 386 inches/sec 2<br />
g = 0.0511Df 2<br />
Vibration 301<br />
D is 2x o and is peak-to-peak displacement amplitude<br />
To convert from one numerical system to another, the following equivalent<br />
values for g are:<br />
acceleration in m/sec 2 ft/sec 2 in./sec 2<br />
g = 9.80 - 32.2 386<br />
Occasionally, frequency is expressed in radians, particularly when angular<br />
velocity is involved. Angular velocity co in radians per second = 2_rf = 6.28 times<br />
the frequency in Hertz. Figure 7-2 illustrates the relations of the parameters in<br />
simple harmonic motion.<br />
Random Vibratmn. Man most often experiences random vibration while<br />
traveling in a vehicle. Vibration can be random with respect to frequency and<br />
amplitude. At a given frequency, the amplitude may vary from oscillation to<br />
oscillation; or amplitude may remain fairly constant and frequency may vary.<br />
And, there is motion that varies both with respect to frequency and amplitude.<br />
Amplitude is expressed typically as a root-mean-square (RMS) value in g's.<br />
The frequency spectrum (range) is indicated by mean-square spectral density and<br />
expressed as power spectral density (PSD), the units being g2/Hz (Meeder,<br />
1964). Vibration acceleration RMS defines the total energy across the entire<br />
frequency band. PSD defines the power at discrete frequencies in the selected<br />
bandwidth. A plot of PSD (g2/ltz) versus frequency illustrates the power<br />
distribution of the vibration environment.<br />
In order to equate mathematically a pure sinusoidal amplitude of equivalent<br />
RMSg values of random, the peak amplitude of the sinusoid is divided by X/_.<br />
Vibration Spectra<br />
Data presented here indicate, in general terms, the vibration characteristics<br />
of some contemporary vehicles. Future vehicles may well have vibration<br />
characteristics which are quite different.
302 Bioastronautic_ Data Book<br />
_6 0><br />
I-<br />
_.)<br />
w<br />
><br />
x<br />
<<br />
FREQUENCY(Hz}<br />
Figure 7-2. Relations in simple harmonic motion. For example, if a mass has an amplitude<br />
of 1 in. at a frequency of 1 Hz, the intersection of the vertical line for frequency 1 and the<br />
diagonal line for 1 in. amplitude can be used to find velocity and g intensity. Reading<br />
horizontally, maximum velocity equals about 6.2 in./sec; reading diagonMly, maximum<br />
acceleration is about 0.1 g. (From Society of Automotive Engineers, 1965)<br />
Helicopters. Helicopters generate significant vibrations in all major axes. In<br />
1958, Russian helicopters were reported to have significant vibration in a<br />
spectrum from 10 to 70 Hz, with amplitudes ranging from 0.4 mm for 70 Hz to<br />
2.4 mm for 10Hz (Borshchevskiy et al., 1958). Neel (1959) studied the<br />
vibration experienced i,, a suspended litter in the t1-13 and 1t-19 helicopters and<br />
found "unpleasant" vibration experienced between 25 and 75 Hz. The Utt-IF<br />
helicopter, at the base of the pilot seat, shows _gz vibration at 25 Hz with the<br />
major frequency components between 100 to 1000 Hz, and a lateral, +_ ,<br />
resonance at 5 Hz at a double amplitude of 0.10 inch. At the seat, the CH-46)k<br />
has a basic frequency of 4.5 Hz _gz, with a major resonance at 12 Hz, and<br />
s_ondary peaks at 28, 38, and 48 Hz (Dean et ai., 1964).<br />
In summary, the characteristic helicopter vibration spectrum has a basic low<br />
frequency vibration related to the number of overhead rotor blade passes per<br />
_cond. Resonances depend on structural characteristics. The intensity changes<br />
of the primary and resonant frequencies depends significantly on load, airspeed,<br />
and flight phase.<br />
Aircraft. Prior to jets, the primary source of aircraft vibration was propeller<br />
rotation. Vibration was relatively high in frequency (several hundred to several<br />
thousand Hertz) and very low in amplitude. While there is a general trend away
Vibration 303<br />
from the pistonengine/propeller-driven aircraft,it is likely that special<br />
applications of such craft, such as the OV-10, will keep them in service for some<br />
time to come. Average vibration amplitude for typical propeller-driven military<br />
aircraft has been reported to be affected very little by aircraft size, with levels<br />
considerably below the envelope at which airborne equipment is tested for<br />
military standards (Abeling & Bassett, 1967). Figure 7-3 shows a representative<br />
envelope of large aircraft vibration.<br />
u<br />
e-<br />
tu O.1<br />
a<br />
..1<br />
et<br />
< o.01<br />
tit<br />
O0<br />
o<br />
a<br />
I o.o01<br />
z<br />
tit<br />
<<br />
•J o.0001<br />
Q.<br />
r_<br />
0.00001 1 1<br />
10 10o 1000<br />
FREQUENCY (Hz)<br />
Figure 7-3. Envelope of vibration; B-52, JRB-52B,<br />
and YB-52, selected locations. (From Abeling & Bassett, 1967)<br />
When jet aircraft engage in low altitude, high speed flight, the dynamic<br />
environment experienced by the pilot is a function of many factors--maneuver<br />
loads, wing loading, gust sensitivity, aircraft size, structural bending modes,<br />
atmospheric conditions, the type of terrain traversed, and airspeed velocity.<br />
Lateral _g_ and vertical _gz motion for these aircraft generally have a power<br />
peak nearYl Hz, with secondary resonances from 1 to 12 Hz. For a variable,<br />
swept-wing configuration, significantly improved ride quality can be achieved by<br />
proper design of seating and cushioning; little improvement can be made with<br />
fixed-wing configurations (Yamamoto, 1965). Care should be taken, however,<br />
that cushioning materials damp rather than amplify the undesirable motion,<br />
since the converse is indeed possible.
304 Bioasironauli(,s Data Book<br />
Primary oscillation for high altitude aircraft is due to atmospheric<br />
turbulence. It has been predicted (Notess & Gregory, 1963) that a supersonic<br />
transport plane flying above 60000 feet, would have higher lateral gust<br />
sensitivities than propeller aircraft (but lower than current jet aircraft) because<br />
of higher speeds with excitation of rigid body and flexible modes. Vertical gust<br />
sensitivity, on the other hand, would be very low in an SST, due to the low<br />
density of tile air at cruise altitude. In general, the probability of encountering<br />
periods of turbulence could be expected to be lowest for an SST.<br />
Spacecraft. Relatively little inflight data exist for low frequency vibration<br />
for space vehicles. Recording accelerometers lypically used have low frequency<br />
cutoffs at 20 or 10 llz. During the first Mercury llights, astronauts complained<br />
of vibration during boost which interfered with their vision. A modification was<br />
made to the head support padding resulting in more subjectively acceptable<br />
vibration levels. A "pogo stick" phenomenon was found in the Titan I1 rocket<br />
engine. This consisted of intense vibration at I I llz, experienced along the entire<br />
length of tile vehicle. A similar problem was detected in an early Saturn V test.<br />
Fuel pump and engine phasing changes reduced tile intensity to acceptable<br />
levels.<br />
Tile only significant _4bration levels routinely encountered in spacecraft<br />
Ol)erations occur during the maximum aerodynamic pressure (max q) portion of<br />
boost, with less during atmospheric entry. Since the vibration does occur during<br />
boost and entry, it is coupled with a siguificant bias G acceleration load. Data on<br />
tile humml effects of a coupled vibration-acceleration environment must be<br />
obtained from studies conducted with a shaker system coupled with a<br />
centrifuge.<br />
Tracking<br />
Performance Effects<br />
A clear statement of the effect of vibration exposure on hunlarl tracking<br />
performance is not easily achieved for a number of reasons. Paramount is tile<br />
fact that investigations of vibration stress have used many and diver_' tasks,<br />
involving a variety of control systems (single axes, multiple axes, fly-to, fly-from,<br />
center-stick, side-stick, wheel and column, and steering wbeci) ill addition to<br />
different control system dynamics, llowever, when similar tasks are used in<br />
comparable vibration environments, reasonable agreement of research results is<br />
found.<br />
Since most vibration studies have been conducted with seated humans<br />
experiencing vertical motion, most data exist for a +lGz-+ng z situation.<br />
Coltsidered first arc tracking changes found with sinusoidal vibration ill the<br />
z-axis.<br />
Sinusoidal _6"z Vibration. Table 7-2 presents representative fhldings for the<br />
sinusoidal _ IGz_lg z environment. Conclusions for random motion and for track-<br />
ing effects in other axes are presented at tile end of the tracking effects section.
C_]<br />
E"<br />
L_<br />
C¢2,<br />
<br />
.=<br />
+1<br />
bc<br />
c,.?<br />
,,-,w<br />
+<br />
0<br />
u}<br />
uJ<br />
I--<br />
t--<br />
.o e.,<br />
"13<br />
fo<br />
(1)<br />
8<br />
><br />
U) ,..-<br />
,8<br />
•-- ><br />
"{3 0<br />
g<br />
8_<br />
2_<br />
_o. 8<br />
O. c_<br />
:6 b<br />
CO ,,."<br />
_.o<br />
o _ _<br />
"_._><br />
O_<br />
{D<br />
O)<br />
d<br />
.a"<br />
0<br />
>.<br />
<<br />
0<br />
E<br />
880<br />
c 'r"<br />
Vibraton 305<br />
.><br />
e-<br />
(,3<br />
.s ,8 __<br />
-_'_ 8<br />
o _ ;<br />
•_ _ & __<br />
_ _<br />
0<br />
u3_ _2<br />
_ . ,._<br />
9.N<br />
o<br />
__._ 8_<br />
_ 8<br />
oi _- _ o<br />
..'o _ _ ._.-<br />
• ><br />
("91,0 LO 0 .-<br />
00_ re.c_ ,_..<br />
_.o o_ ._ _ _ oE<br />
+L ,_ '_ • ,_ _ _ . c<br />
_nc_ c_0 o I >-_<br />
+1 (5 d +1 _ _<br />
t- u<br />
o x _<br />
_0 .,.88<br />
_ -___<br />
_._<br />
oo<br />
- _,= _, o._ ,_<br />
3 "_ _<br />
_._=<br />
_t- {3.0<br />
_o° _oi_<br />
o_ _ ._<br />
__ m .__<br />
_ _._<br />
e-<br />
_ _ 8<br />
•"r "o<br />
00"o o i i<br />
_2 +io_<br />
¢_" _ +1 +1
306 Bioastronautics Data Book<br />
I<br />
co O<br />
-r<br />
•-_d<br />
+i<br />
-i_'o<br />
W c "0<br />
c<br />
0 _<br />
-r<br />
c<br />
E<br />
7 _<br />
o _.<br />
u o<br />
c I<br />
0<br />
'_ o<br />
><br />
_.__<br />
_.-<br />
0<br />
E "<br />
,- ';_ "_'=_<br />
_._ = ,,<br />
z==>8_'<br />
0 _ ._ _ _<br />
O<br />
r-<br />
E<br />
o -_<br />
x 6<br />
o_._.<br />
"_. 0 0<br />
0 I I<br />
+1<br />
m +1 +1
Vibration 307<br />
Sinusoidal versus Random gz Vibration. Comparatively few studies have<br />
investigated the relative effects of sinusoidal and random vibration. In 1961,<br />
Parks used a two-axis tracking task with a wheel and column control in random<br />
and sinusoidal motion. Of several parameters tested, only the vertical tracking<br />
task was affected, at 2.5 Hz sinusoidal at approximately 0.40 gz" Weisz and<br />
coworkers (1965) used a side-stick controller in a two-axis tracking task in<br />
sinusoidal 5 Hz, 5 Hz with random amplitude, and a frequency band of 4 to<br />
12 Hz random. Larger errors were reported for vertical tracking than for<br />
horizontal tracking: Concerning the relative influence of the vibration environments,<br />
error occurred at lower g levels sinusoidal than for random amplitude<br />
5 |Iz; and random 4 to 12 ltz vibration did not result in tracking error. These<br />
studies tend to establish that random vibration is not as detrimental to tracking<br />
performance as is sinusoidai.<br />
Random gz Vibration. In recent years, knowledge about random gz vibration<br />
effects has come largely from studies which have simulated tile low altitude, high<br />
speed aircraft response spectrum. For such aircraft, the characteristic motion<br />
environment is random, with high energy peaks in the low frequency range.<br />
Since many simulations lack a multiaxis motion capability, lateral gy motion<br />
effects (as from lateral gusts) are not fully known. Nevertheless, the lengthy<br />
duration of test exposures makes the gz data quite valuable. Table 7-3<br />
summarizes the studies of long duration random vibration.<br />
Other Axes. The influence of lateral _gy and fore-aft _gx vibration on<br />
tracking performance has not been extensively examined. Two studies are<br />
indicative, but cannot be applied universally to the _gv and -_gx situations.<br />
Fraser and coworkers (1961) studied two-axis tracking in'the three major axes.<br />
Frequencies of 2, 4, 7, and 12 Hz were used, with single amplitudes of 1/16, 1/8,<br />
3/16, and 1/4 inches. No effect of "longitudhlal," +lGzAngx, vibration was<br />
detected. Error was greatest in the _'gz axis, followed by the side-to-side. . Ag..y<br />
axis. Hornick and coworkers (1961) studied a horizontal axis trackmg task m<br />
+lGz-+ng x and _Gz:!:ngy. Frequencies of 1.5, 2.5, 3.5, 4.5, and 5.5 [|z were used<br />
at sinusoidal intensities of -+0.15, 0.25, and 0.30g x and :!:0.15, 0.25, and<br />
0.35 g.. In the _gx axis, tracking error was related to vibration intensity level.<br />
Subjects did not completely recover tracking ability during a 15-minute<br />
postvibration period. Finally, there was a slight trend for error to increase as a<br />
function of time (during 0.5-hour vibration periods). Similar effects were found<br />
for tracking in the _gy axis, with the greatest error rate at the lowest (1.5 and<br />
2.5) frequencies.<br />
Summary of Tracking Effects. The following statements can be made<br />
concernin_ the effects of vibration on the tracking ability of a seated human:<br />
1. For the range of 4 to 20 Hz, sinusoidal gz vibration will significantly<br />
impair performance when the double amphtude (D.A.) of 0.05inches is<br />
exceeded. Figure 7-4 indicates the regions of affected and nonaffected<br />
performance as delineated by the 0.05 inch D.A. line.
308 Bioastronautics Dala Book<br />
J<br />
t,_<br />
-2- 4--<br />
E<br />
0<br />
0<br />
c<br />
0<br />
C)<br />
t-<br />
O<br />
.0<br />
i<br />
>,<br />
-g<br />
3<br />
6<br />
i£<br />
t<br />
s=<br />
N<br />
"," 0<br />
r- ",_<br />
"O c -I'<br />
,_ _ .-<br />
_.- -_-__=<br />
,_<br />
ffl<br />
-$ _ "z<br />
03 CO ¢_ 'I"<br />
__ _ _<br />
.,_ _ "_ O<br />
_._ _<br />
o° g_<br />
_,_ _-_<br />
>__ -_,_._<br />
___ - __ _ __,__ o<br />
o#-,_ _ o__<br />
,,.. 70<br />
_._ _.{_ z:<br />
t4_<br />
8"_ -_ ..:<br />
_<br />
_c_O_ o<br />
t3<br />
gO<br />
tl,.<br />
.g<br />
N"<br />
"l-<br />
t.O<br />
[<br />
•-- O.<br />
.__<br />
} ":<br />
£<br />
, 6<br />
,,,=_ £.o_=<br />
gs<br />
.E .£ . ,- ._<br />
t_ a)<br />
6 ° _ _ _<br />
_._ _<br />
_,_._.c.-<br />
"-- 0 0<br />
o._ =>o<br />
E, o _ k,"<br />
__ _,_<br />
_=__E_<br />
__ 6<br />
"0<br />
_d<br />
f4<br />
"_ 3
(D<br />
t- 60<br />
¢_ o<br />
_- r_ rr<br />
w- -0 U U<br />
6_ _'_ _ "_ _' _<br />
ID "-<br />
C<br />
-0-6 o _ _o<br />
c'- N _ ,,-.5 _:<br />
$.o _,'r .__ ® S S<br />
",_"_ _ .o_<br />
_ _ _EE<br />
_ _ c c m<br />
o_._._ _ o<br />
"_ 8<br />
_.") ><br />
o.-._, o<br />
-_<br />
'_<br />
"6<br />
><br />
.-u "_ _E<br />
4-'<br />
_ tl- "O '_ ,tl"<br />
.-- 13"0<br />
Vibration 309
:; 10 Bioaslronaulics Data Book<br />
N<br />
F<br />
F C<br />
s' o B o<br />
_- C F N F 0 _ 0<br />
s s s S sBs B H<br />
÷gz _ cC S F B C B C<br />
1.c(_S S S sBs H C_ o<br />
s S s S sos<br />
/<br />
F 0 D Lt_t_D<br />
°/ o<br />
_' o Er_ic_s<br />
a<br />
:I°°o ..........................<br />
o<br />
o, L I L I° e5<br />
o s lo ,5 •<br />
FREQUENCY (Hz)<br />
Figure 7 -4. Summary of reported effects of -t-gz vibration<br />
on human tracking performance.<br />
'2. Sinusoidal low frequency vibration from -+0.20 to :!:0.80g z can produce<br />
tracking error up to 40 percent greater than that found in static base conditions.<br />
Vehicle control systems must consider the dynamic environment and cannot be<br />
desi_,_wd solely on the basis of static base simulations.<br />
3. ttigher RMSg levels are required for random vibration to impair<br />
performance as compared to sinusoidal vibration.<br />
4. For sinusoida| vibration, increases in error arc related to increases in<br />
intensity; for randont vibration, tracki,g error is not related to intensity to<br />
approximately 0.40 RMSg. Tracking error during either type of vibration is very<br />
much a function of tracking task difficulty, suggesting tile use of controls and<br />
displays to comprise simplified control task situations.<br />
5. For both random and sinusoidal gz motion, vertical tracking error is<br />
larger tt_an that found for horizontal tracking.<br />
C
Vibration 311<br />
6. Forrandom vibration of long duration, there is no trend for error to<br />
increase as a function of time until about 2.5 to 3 hours is reached. Performance<br />
deteriorates for difficult tracking tasks at that time, apparently as a result of<br />
"fatigue."<br />
7. The type of controller used influences the degree of tracking error<br />
experienced. Use of a side-stick and arm support can reduce vibration-induced<br />
error in the vertical axis by as much as 50 percent when compared to<br />
conventional center-stick controllers.<br />
8. When tracking impairment is experienced during vibration, a residual<br />
effect may last up to one-half hour after exposure.<br />
9. Vibration in the "+'gx and _gy axes is not known to cause decrement<br />
greater than that for _'gz"<br />
Reaction Time<br />
Ability to respond rapidly to a stimulus during exposure to vibration has<br />
been subjected to much investigation in a wide variety of vibration conditions.<br />
Studies of reaction time for sinusoidal _gz vibration are reported by Schmitz,<br />
Simons, and Boettcher (1960), Buckhout ([964), Shoenberger (1967), Johnston<br />
and Ayoub (c. 1969); for sinusoidai and random gz vibration by Parks (1961)<br />
and Weisz, Goddard, and Allen (1965); for random g vibration by Soliday and<br />
Schohan (1965), Schohan, Rawson, and Soliday (19z65), Hornick and Lefritz<br />
(1966), Holland (1967); and in gz and g_ axes by Hornick, Boettcher, and<br />
Simons (1961). Included in these studiesYare frequencies from 1 to 20 Hz;<br />
intensities to -+0.60g; random vibration intensities to 0.40 RMSg; sitting and<br />
standing subjects; hand, foot, and whole body reaction; and simple to complex<br />
reaction tasks. The data deafly indicate that (1)vibration does not typically<br />
affect human reaction time; (2)when reaction time is affected during or<br />
following vibration exposure, only several one-hundredths of a second are added<br />
to the static base reaction time, normally 0.02 to 0.05 second; (3) increases in<br />
vibration intensity or duration do not produce corresponding change in reaction<br />
time.<br />
It is possible, when the task is a secondary monitoring task, that reaction<br />
time deterioration can occur. A secondary vigilance task to monitor and detect<br />
propulsion thrust changes in a low altitude, high speed piloting simulation was<br />
used by ttornick and Lefritz (1966). A change in displayed thrust command<br />
occurred randomly once in each half hour during the 4 hour random vibration<br />
session. Vigilance response time was markedly impaired, from 2.4 seconds in<br />
nonvibration to 8.1 seconds during vibration.<br />
Visual Impairment<br />
When evaluating visual impairment from vibration, the type of vibration, the<br />
posture of the man, illumination levels, and the kind of visual task must be<br />
considered. Visual impairment is extremely sensitive to the specific
312 Bioastronautics DataBook<br />
vibration/task situation.To beconsidered alsoin anyoperational settingare<br />
whetherornotaprotectivehelmet iswornandwhether thedisplayisvibrating<br />
alongwiththemanorisindependently damped.<br />
In general, the rangeof 10 to 25 ltz is most detrimental to visual<br />
performance, though occasionally frequencies above and below this band cause<br />
decrement. The relationship of subject and display is important in that lower<br />
frequencies (below 10 Hz) more readily cause visual decrement if the display<br />
alone or the display and man are vibrating. Above 10 Hz, vibration of the human<br />
more frequently results in visual decrement, as compared to motion of the<br />
display alone. Decrement increases as a function of amplitude or intensity level.<br />
Visual performance during vibration can bc protected by proper design of<br />
displayed matter. Cluttered displays result in relatively greater decrement during<br />
vibration than do those which arc easier to read. At relatively short distances,<br />
vibration can be expected to cause crrors in _icwed numerals or letters<br />
subtending about 9 minutes of arc or less.<br />
In the supine position, a helmet can reduce visual error when motion is in<br />
the x-axis. Significant error reduction in the z-axis results when the head can<br />
move freely. There is _mn_ indication that higher frequencies (11 and 15 Hz) in<br />
the y-axis may result in larger crror when a helmet is worn. Use of any helmet<br />
and liner configuration can be expected to modif T man's visual response<br />
significantly, and each specific configuration should be the subject of dynamic<br />
base tests for high performance vehicle application.<br />
The few studies which investigated random vibration effects have not<br />
revealed any visual impairment up to levels of 0.40 RMSg z. Table 7-4 presents<br />
the major results of primary studies and figures 7-5, 7-6, and 7-7 illustrate<br />
selected results.<br />
Miscellaneous Performance Effects<br />
Certain performance effects are related to hiodynamic characteristics,<br />
though they are not completely biodynamic in nature. For example, typing<br />
accuracy' t_n be impaired duriltg vibration because of biodynamic disturbance of<br />
the arm rather than a disruption of the basic process of typing per se. The<br />
influence on speech, auditory, and complex mental processes has also been<br />
examined by a number of investigators. Table 7-5 summarizes the results of<br />
studies of the influence of vibration on these processes.<br />
Vibration appears to act on the biodynamic and psychomotor properties o1'<br />
man rather than on central neural proeesscs. Tasks which require accurate<br />
placement of a limb or movements of controls (figure 7-8) are adw_rscly affected<br />
hv virtm_ _f leg, arm,hand, or t'ingcr displaccmcnl (Clark et al., 1965;Schmitz ct al.,<br />
li)60). In cases where accuracy itself docs not suffer (figure 7-9), time to<br />
complete the task increases during vibration (Guignard & Irving, 1960; 1)ean et<br />
al., 1967; Seeman & Williams, 1966). There is somc support of the hypothesis<br />
that vibration degwadcs performanee at frequencies where major body resonances<br />
occur.
¢2<br />
¢2<br />
¢2<br />
c"<br />
¢-<br />
><br />
"6<br />
s<br />
"6<br />
U.I<br />
I-<br />
0<br />
0<br />
0<br />
g<br />
><br />
I-.<br />
_g<br />
ft"<br />
r_<br />
4_7 858 0 73 - 21<br />
10<br />
.ff<br />
h-<br />
ff.<br />
E<br />
"r-<br />
e_<br />
><br />
><br />
><br />
"6_ oG<br />
.,_. ,_ ,_<br />
_ o +1x<br />
Vibration 313<br />
_ff<br />
c 0<br />
_.__<br />
"0<br />
..<br />
"I" c.o _- I--<br />
o _ _ .-,_<br />
_ o¢_<br />
"¢t<br />
__ _ _ "_N_<br />
,_ _ ,,_ _ _:_ _ __<br />
,- _ _E<br />
o<br />
"'_-- _ _ _ "_ _ "_'_ _._ -_ i" N<br />
.E<br />
e-<br />
o _<br />
__ -o-E "o,,<br />
¢:.T _ m<br />
0 0<br />
t_ 0<br />
> +I o<br />
+, Eo-_ _+,<br />
_ _'u +1 °<br />
_ .E _ _.<br />
+_/ o ,_- ,,N<br />
e") ,_ _"r<br />
7d _ 7N<br />
r_<br />
tO<br />
O_<br />
.G<br />
h-<br />
Eo<br />
"0<br />
o<br />
co<br />
_x<br />
o-<br />
'--_'0<br />
_s<br />
E<br />
'-- D<br />
__.o_<br />
"60.E<br />
,2<br />
+1
314 Bioastronautics Data Book<br />
IJJ<br />
I-<br />
><br />
00<br />
o .__ _ _o<br />
N 0<br />
0 _ I I ,.<br />
O_ C ....<br />
• ® _ '_ _ "_<br />
t_ O ,- E<br />
i<br />
t- • O<br />
• - _j_<br />
E<br />
.-_ '6 _ "6<br />
m o gN<br />
N'_,<br />
O tip<br />
a"<br />
g g g _<br />
¢o<br />
- ;. _ _= ._ '_ _,<br />
o _o_<br />
n v,<br />
E0 ._<br />
_- ff "_<br />
,-- r- t- _ ,_<br />
"_'o .- b"<br />
'_ : ___ "_ _ ,' -,<br />
"1:3 _ "._ 8<br />
-<br />
c<br />
-4-I<br />
N<br />
÷<br />
I "r -r ,-._<br />
"Zt I --<br />
to
co -- c"<br />
v_ _-<br />
g _E g$<br />
_-_ _ ,<br />
._ _ _ _<br />
.._ E<br />
,_ ._ .,, _E<br />
_= _ _'_"<br />
, _o. ,.'r<br />
o __<br />
E ,S<br />
E_c<br />
=_<br />
_,_ _,_<br />
_ __<br />
._ _<br />
0<br />
b z__<br />
t_<br />
+Ix N +IN_.. _<br />
m<br />
0 0<br />
Z Z<br />
o<br />
Vibration 315<br />
"6<br />
0<br />
0<br />
"E<br />
-I<br />
0<br />
Z<br />
c-<br />
_. _ 7 .-_<br />
8_<br />
r¢<br />
n" ,,,<br />
t'--"_ rf<br />
z_<br />
-r -5 -"_N<br />
'_ O<br />
N<br />
3<br />
'-_ N<br />
_6
316 Bioastronautics Data Book<br />
25<br />
20<br />
15<br />
101<br />
5<br />
0<br />
COUNTER<br />
SUBTENDED<br />
ARC(min)<br />
A 24<br />
B 15<br />
C 12<br />
O 9<br />
E 6<br />
WITH<br />
I I I I l<br />
A B C D E<br />
COUNTER<br />
Figure7-5. Digit reading errors as a function of vibration and digit height.<br />
Significant errors occur only for subtended arcs of 9and 6 min_ (From Teare &<br />
Parks, 1963)<br />
M<br />
v<br />
¢,o<br />
n-<br />
90<br />
80<br />
70<br />
60<br />
O 50<br />
nn-<br />
LU<br />
z 40<br />
<<br />
ILl<br />
3O<br />
20- •<br />
O<br />
:°::::=o°= \<br />
|0-"---- HELMET RESTRAINED<br />
HELMET UNRESTRAINED<br />
I I I<br />
0 6 11 15<br />
FREQUENCY (Hz)<br />
Figure 7-6. Errors on difficult dial reading task (400 range dial) as a function<br />
of frequency and helmet restraint conditions for vibration in y-axis. (Taub, 1964)<br />
T<br />
ON
3<br />
><br />
+1<br />
-.1<br />
0<br />
CONSTANT ACCE LE RATION 1,0 g¥<br />
Vibration 317<br />
FREQUENCY IHz)<br />
Figure 7-7. Visual acuity as a function of display versus observer vibration.<br />
(From Rubenstein & Kaplan, 1968)<br />
While speech intelligibility itself may not be greatly affected, the quality of<br />
speech is impaired by vibration. That is, a listener can still understand the<br />
spoken material, but does perceive quality loss. No effect on significant hearing<br />
ability has been found (Weisz et al., 1965; Holland, 1966). At most, vibration<br />
may produce a practically insignificant effect on the auditory thresholds for low<br />
frequency sound (Guignard & Coles, 1965).<br />
Tasks involving primarily higher mental processes are not adversely affected<br />
by low frequency vibration. Mental addition, pattern recognition and matching,<br />
and navigational behavior have been shown not to be impaired below 20 Hz. A<br />
single example does exist where vibration at 70Hz at 4.0 g interfered with<br />
"continuous counting" (loseliani, 1967).<br />
Physiological Effects<br />
Physiological disturbances which occur during vibration are found at<br />
intensity levels much higher than those necessary to cause performance<br />
decrement. Further, those changes which do occur are usually very small and<br />
have no practical significance. Experimental data for physiologically damaging<br />
vibrations are of course, not available for humans. In the operational setting,<br />
men have been exposed to extremely intense vibration levels in helicopters when<br />
rotor blades are lost in flight. It has been speculated that deaths in these<br />
instances have resulted from rupture of the aorta.
318 Bioastronautics Data Book<br />
t-..<br />
.-9<br />
3_<br />
gi<br />
,, g<br />
I<br />
o'_<br />
EE<br />
><br />
_D<br />
1<br />
0<br />
g<br />
O. __<br />
O<br />
¢=<br />
.-<br />
0<br />
Z<br />
_E 8 o {<br />
E<br />
C<br />
j t-<br />
! E<br />
,'_ Eo<br />
'-- O<br />
_:_ _V z<br />
"0<br />
"_ 8o" -0<br />
m _2.0 >.<br />
_6 > _ "-_<br />
•_. ..._<br />
0 '._<br />
+1 _ o I<br />
= _ c_:z:<br />
+l +1 { +1 +1<br />
c<br />
r'r" _ '-<br />
"_-.a<br />
__ _<br />
'i'- _ i ®<br />
g ,-<br />
: = ® '_<br />
c<br />
n_<br />
-9.<br />
<<br />
.9<br />
_, ,.,,<br />
.._ "r<br />
8_<br />
,.,'_<br />
6"1"<br />
'' e'J<br />
.0
0<br />
E<br />
0<br />
n<br />
0<br />
¢..9<br />
p_<br />
Q<br />
t_<br />
@<br />
a<br />
_,_ _o '-_<br />
'z _ -_ !_<br />
_ _ _ _t ._ :," _.-<br />
_. _._ _._ __<br />
- .._<br />
-_ _<br />
0<br />
iz<br />
I<br />
r,i<br />
'6<br />
.E<br />
O<br />
I<br />
N'_<br />
tr e_<br />
rr<br />
o<br />
e-<br />
o<br />
6<br />
_.'.E<br />
OE<br />
Vibralion 319<br />
E<br />
_8<br />
Y_<br />
_o.<br />
_6<br />
+tin _+1<br />
-6<br />
O<br />
X- O .
320 Bioastronautics Data Book<br />
.__<br />
E_<br />
e. e-<br />
.='=<br />
=<br />
rf2<br />
U')<br />
W<br />
0<br />
_5<br />
c<br />
0<br />
g<br />
0 0<br />
x X<br />
Z Z<br />
_r<br />
,= __8<br />
• - 0<br />
u<br />
gg<br />
m<br />
_ "1"<br />
P,- o<br />
+1 o ,_-<br />
®<br />
0<br />
'_ 0<br />
_5 z<br />
,
o<br />
"I"<br />
g<br />
0 0 0<br />
Z Z Z<br />
0<br />
.:.- _<br />
_ "-<br />
. >-<br />
(D<br />
o _<br />
"_ 0<br />
w- _j<br />
o=_ ._<br />
I.O .tO<br />
F = -v .E<br />
.__ _<br />
.,_ z's<br />
Ip_ ._<br />
m n<br />
N _ E 0<br />
d r.."<br />
I _"<br />
n,"<br />
"& 0<br />
o<br />
>.<br />
= _'_<br />
._= o<br />
"0<br />
.6_._<br />
> 0<br />
33 0<br />
0 O.<br />
=q<br />
_ o_"<br />
Vibration 321
322 Bioastronautics Data Book<br />
",r<br />
a..<br />
Z<br />
O rr<br />
kU<br />
<<br />
el:<br />
KI<br />
><br />
<<br />
7I<br />
6<br />
5<br />
,i<br />
3<br />
PRE<br />
"G<br />
b-<br />
I<br />
VIBRATION POST<br />
10<br />
9<br />
8<br />
• 7<br />
Z<br />
i oi<br />
Figure 7-8. Foot pressure error in prey,brat,on, vibration<br />
13.0--<br />
12.E --<br />
12.0 -<br />
11.5-<br />
and postvibration periods. (From Sehmitz et al., 1960)<br />
3<br />
f I I I<br />
0 0.2 0,4 0.6<br />
VIBRATION LEVEL (RMSg)<br />
2<br />
.35 G'S<br />
oI 1<br />
PRE VIBRATION POST<br />
Figure 7-9. Digital input time for vibration intemdty level.<br />
(From Dean et al., 1967)<br />
I<br />
0.8
Vibration 323<br />
Table 7-6 summarizes tile known physiological effects of vibration. The<br />
experiments summarized in table 7-6 indicate that mall does not experience major<br />
physiological change while enduring whole body vibration of normal intensity. A<br />
shght degree of byperventilation is suggested, however. No dramatic changes are<br />
seen ill blood chemistry or endocrine chemical composition. Anesthesia reduces<br />
those changes which do occur, suggesting a stress effect of a psychological rather<br />
than mechanical nature. There is substantial evidence that heart rate increases<br />
occurring in early stages or during short periods of vibration are anticipatory<br />
general stress responses, because of a gradual return to resting state levels during<br />
continued vibration (Hornick & Lefritz, 1966; Holland, 1967; Ziegcnruccker &<br />
Magid, 1959; Temple et al., 1964). No clearly consistent blood pressure changes<br />
have been identified after exposures to +lGzAng z from 1 to 27 liz (Chancy,<br />
1965). The conclusion of von Gierke (1965) is yet valid: "...to date these effects<br />
in no way characterize vibration as a severe stress nor do the results give us a<br />
handle to use these response'functions as a basis for criteria."<br />
Biodynamic Effects<br />
Of all recorded vibration effects, there is more agreement in research results in<br />
the area of biodynamics than in any other. Biodynamic effects are those<br />
phenomena which consist of body movement reactions to vibration inputs. When<br />
the human body is vibrated, it does not react in a rigid and passive manner; rather,<br />
the body and its organs can be likened to a complex set of masses, springs, and<br />
dampers. There have been attempts to derive a mathematical model which could be<br />
used to define and predict man's motion responses to vibration inputs. By and<br />
large, attempts to develop such a model may be as overambitious as the model<br />
would be valuable. Such a model does not yet exist, due primarily to the wide<br />
variety of environmental parameters of importance--such as frequency, intensity,<br />
randomness, bandwidth, axis, duration, body-support, etc.--as well as of<br />
personal parameters--such as body size, weight, posture, age, sex, fatigue, degree<br />
of relaxation, and so forth. Discussions to be consulted which treat biodynamic<br />
phenomena are the following: Goldman and yon Gierke, 1960; Coermann, 1962;<br />
yon Gierke and Hiatt, I962; Weis, 1963; yon Gierke, 1964; Pradko, Lee, and<br />
Kaluza, 1966; Lee and Pradko, 1968.<br />
From a design standpoint, probably the most useful biodynamic data are those<br />
dealing with whole body transmissibility -timt is, the ratio of output to input<br />
motion. Resonances of internal organs, though of value, are not vital to system<br />
design becau_ dangerous organ resonances are thought to occur only at severe<br />
intensities where subjective tolerance limits (often associated with pain) are<br />
reached.<br />
Two terms which are commonly used with reference to biodynamic response<br />
to vibration are mechanical impedance and tra nsmissibility. Mechanical impedance<br />
is defined as the ratio of applied force to the resulting body or organ output<br />
velocity. Transmissibility is the ratio of body output motion to applied motion in<br />
terms of velocity, amplitude, or intensity.<br />
Sinusoidal _z Vibration<br />
Table 7-7 summarizes results of studies in the gz axis with seated subjects.
324 Bioastronautics Data Book<br />
e-<br />
.w<br />
¢m<br />
p..,<br />
t =<br />
t,- ._<br />
E<br />
E<br />
IJJ<br />
O<br />
O<br />
ca.<br />
"O e-<br />
8 c<br />
O<br />
.Q_<br />
><br />
0<br />
C<br />
W<br />
v<br />
.E<br />
= 8<br />
C<br />
°. _<br />
= o<br />
._0 _<br />
t_ =<br />
-s g :_<br />
_ _ g__<br />
c<br />
0 0 0 '__.<br />
Z Z Z :_<br />
E<br />
T<br />
,¢ _ I _<br />
+1 "<br />
c<br />
I +1
z m I<br />
m "O<br />
g _._-<br />
,e I<br />
t- .._<br />
e_<br />
Vibrat ion 3 25
326 Bioastronautics Data Book<br />
OQ<br />
,<<br />
t-- -I-i -<br />
e.<br />
o<br />
_D<br />
O<br />
¢)<br />
o<br />
o<br />
o<br />
_D<br />
"_ _ = E<br />
,- "_ 0, o<br />
•-- t-<br />
... _ ._- "c.<br />
"I" _ _. zx<br />
o _ _o o-<br />
•..0 _ t e<br />
c<br />
• c<br />
¢.<br />
o<br />
fl:<br />
m<br />
o" ,2<br />
,,i-<br />
p,.<br />
_D<br />
0<br />
0<br />
o _. _.<br />
E<br />
._ (2_<br />
,_. _ ,_o<br />
_ i_<br />
"mi m<br />
r.. "_:_ c<br />
N" N" "I"m .
Vibration 327<br />
Seated and Standing Subjects. Dieckmann (1958) measured transmissibility<br />
and mechanical impedance in comparing the biodynamic effects of sitting and<br />
standing postures, lie found 4 to 5 Itz to be the resonant frequency at the head<br />
and shoulders of the seated subject. When the subject is standing, impedance is<br />
greatest at 5 Hz with a secondary peak at about 12 |lz.<br />
Comparing the biodynamic effects of sitting versus standing, Coermann<br />
(1962) reported peak impedance at 6 Itz for sitting erect; at 5 to 6 Hz for sitting<br />
relaxed; and at 6 and 11 to 12 Hz while standing erect. The data in the<br />
Dieckmmm and the Coermann studies arc for one subject and are, therefore,<br />
only suggestive that body resonance differs for the standing person. Coermann<br />
further reported that use of an MC-3 pressure suit adversely affects biodynamic<br />
as well as subjective response. Edwards and Lange (1964) also reported a<br />
standing relaxed resonance near 4 to 5 Hz.<br />
Shoulder transmissibility in standing subjects during 1 to 27 }lz was recorded<br />
by Chaney (1965). He reported a maximum transmissibility ratio of 1.5 for the<br />
4 to 6 Hz range, with attenuation below 2 Hz and above 7 tlz (figure 7-10).<br />
o<br />
190<br />
180<br />
170<br />
16(3<br />
15£<br />
14C<br />
13C<br />
12C<br />
11£<br />
10(3<br />
9C<br />
S£<br />
70 i<br />
60<br />
50<br />
40<br />
3O<br />
20<br />
10<br />
0<br />
I I 1 I I I I i L _-_- L_<br />
I _ _ _ L _ I 1_ l 112 14 16 18 20 22 24 26 28<br />
FREQUENCY [Hz}<br />
Figure 7-10. Shoulder acceleration expressed as a percentage<br />
• of table acceleration for standing subjects. (From Chaney, 1965)<br />
To determine whether the bent leg can serve as an effective isolator, Hornick<br />
(1962) had subjects attempt to isolate the input motion as much as possible at 2<br />
and 5 tlz. A 1 inch double amplitude was used (-+0.21 and +1.3 g, respectively).<br />
Subjects visually fixated on a spot 6 feet forward during 2 minute exposures.<br />
The legs effectively attenuated the input vibration as measured at the head,<br />
though there was a gradual loss in their ability to do so over time. More effective<br />
isolation was achieved at 5 |lz. Figure7-11 shows that transmissibility
328 Bioastronautics Data Book<br />
acceleration increases from 68 to 93 percent for 2 Hz and from 25 to<br />
39 percent for 5 Hz during the 2 minute test time.<br />
1OO<br />
9O<br />
so<br />
>" 70<br />
I--<br />
i"5O<br />
40<br />
m<br />
1<br />
2c/s<br />
III<br />
,5c/s,<br />
10-<br />
I I I I I I I I<br />
0 I 2 3 4 5 6 7 8<br />
TIME SEGMENT<br />
Figure 7-11. Percent of acceleration b'ansmitted to headsof standing l_rsons<br />
with knees slightly bent. (From Hornick, 1962)<br />
Random gz Vibration<br />
In 1966, Hornick and Lefritz recorded acceleration at pilots' heads during<br />
simulated LAIIS flight with various RMSg z levels for a zero to 12 Hz spectrum.<br />
It is interesting to note that, for a lO-minute sample, output acceleration is<br />
greatest from 4 to 6 Hz, with attenuation below 2.5 tlz and above 11 Hz<br />
(figure 7-12). These results agree very well with those obtained during sinusoidal<br />
conditions.<br />
Other Axes and Postures<br />
The head motions of seated and standing subjects in +lGz+ng x conditions<br />
were recorded by Dieckmann (1958). Figure7-13 shows that the head<br />
follows the horizontal motion in a flat ellipse at low frequencies. As 5 llz is<br />
reached, the elliptical shape of the head movement becomes vertically<br />
oriented for the standing person and becomes circular fl_r tile sitting person.<br />
Transmissibility at the head, chest, and pelvic regions was recorded by<br />
Hornick, Boettcher, and Simons (1961) in + IGz_lg x conditions. Figure 7-14<br />
shows that motion at the head level is attenuated through 5.5 [lz, while<br />
transmissibility exceeds unity for the chest and belt levels with maximum<br />
amplification at 5.5 Hz. In the _me experiment, foot pressure constancy was<br />
recorded during the Y-gx motion. Greatest limb motion is experienced at 3.5 Ilz.
Vibration 329<br />
The loss in control of foot pressure constancy becomes more severe as intensity<br />
level increases from -+0.15 to 0.30 g.<br />
£<br />
0.010<br />
jPI LOT'S<br />
i<br />
FOREHEADi<br />
I<br />
INPUT RMSg = 0.149 J<br />
SAMPLING<br />
SIMULATION PLATFORM<br />
PERIOD = 10MIN<br />
4 6 8 10 12<br />
FREQUENCY (Hz)<br />
Figure 7-12. Biodyrmmic transmissibility during random gz vibration.<br />
(From Hornick & Lefritz, 1966)<br />
J PLATFORM<br />
t C/S<br />
1.5 C/S<br />
(_ 2 CIS<br />
3C/S<br />
4 C/S<br />
5 C/$<br />
%<br />
O<br />
Figure 7-13. ltead movement of standing subject (left)<br />
and sitti.g subject (right) with -+gx vibration. (From Dieckmann, 1958)
330 Bioas/ronautics Data Book<br />
300<br />
250<br />
2.0(3<br />
1513<br />
.50<br />
+'O--<br />
BELT I<br />
CHEST<br />
HEAD I<br />
t I<br />
0 ------ I I I I I<br />
1.5 2.5 3.5 4.5 5.5<br />
FREQUENCY (Hz)<br />
Figure 7-14. Transmissibility at belt, head, and chest levels during _g. vibration.<br />
Standard deviations are presented for each mean for 20 subjects. (From Horn%k et al., 1961)<br />
Hornick, Boettcher, and Simons (1961) also recorded transmissibility at tile<br />
head, during +lGz+ngy conditions. Figure 7-15 reveals that from 1.5 to 5.5 Hz,<br />
the body does an excellent job of attenuating motion as recorded at the head<br />
during the side-to-side vibration. The least attenuation at 1.5 Hz suggests that<br />
_gy re_nance lies somewhere near that frequency. Again, foot pressure<br />
constancy was recorded, with greatest foot constancy error occurring near<br />
1.5 |lz, the region of greatest head motion. As with the x-axis, foot motion<br />
errors arc directly related to the _gy intensity levels.<br />
Woods (1967) also studied +lGz+ngy vibration to 7 tlz with seated subjects.<br />
Ills results confirm those discussed above. Transmissibility is generally below<br />
unity abovc 2.0 llz for the hip, knee, shoulder, and head. He confirms that _gy<br />
resonance is about 1.5 Ilz.<br />
Roman, Coermann, and Ziegenruccker (1959) studied the chest-abdomen<br />
resonance in supine subjects with +lGx+ng z conditions. From 2 to 17 ttz,<br />
there is amplification in the +gz axis, with highest transmissibility (ratio of<br />
3.5) occurring at 5.9 llz.
1.60<br />
_ 120<br />
Vibration 331<br />
1.40 _35 O<br />
15E<br />
6( _t6Qi<br />
20<br />
4( _<br />
°i ,!s 2'.5 3's 4.5 6.5<br />
FREQUENCY IHz}<br />
Figure 7-15. Transmissibility at the head during _ vibration. Standard deviations appear<br />
for each mean for 20 subjects. (Fro& ltornick et al., 1961 )<br />
Clark, Lange, and Coermann (1962) recorded pelvic, chest, and abdomen<br />
motion in supine subjects during +lGx-+ng x conditions, from 2 to 20 Hz.<br />
Body deformation "strain" (as described earlier) was employed for measure-<br />
ment. All strains are at a maximum at 6.7 Hz (see figure 7-16).<br />
_. 0.04<br />
c<br />
L_<br />
tr<br />
o.osl<br />
0.03<br />
z o.o2<br />
0.01<br />
O.(X<br />
0<br />
UPPER ABDOMEN _ jl_\<br />
, ',<br />
/ "\<br />
s /,. \<br />
! / ". ',,<br />
] I \ ,<br />
/ / \ ',<br />
• \<br />
s;" /' \ _'_<br />
,,>/_.E_,---/ '.,, ,,,<br />
_:._ :.'5"/" _ \'x._. _'-.<br />
2 4 6 8 10 12 14 16<br />
FREQUENCY (Hz}<br />
Figure 7-16. Mean strain of 7 subjects exposed to _'gx vibrations<br />
in semisupine position. (From Clark et al., 1962)<br />
A<br />
g
332 Bioastronautics Data Book<br />
Edwards and Lange (1964) exposed subjects in the supine position and<br />
resting on their sides to +lGx_:ng x and +lGy_mgy vibration from zero to<br />
20 Hz. In the relaxed supine position, it was again found that the first<br />
resonance for the chest and abdominal regions occurs between 5.5 to<br />
7.5 Hz. A similar result in impedance peak occurs for subjects resting on<br />
their sides, with the peak near 5 Hz.<br />
Summary of Biodynamic Effects<br />
No matter what technique is used to record major body or whole body<br />
response to vibration, results are in good agreement.<br />
1. Internal organs have unique resonant frequencies which can differ in<br />
each axis.<br />
2. Whole body resonance for seated subjects is in the region of 4 to<br />
6 Hz in the !g z axis.<br />
3. For the seated subject, maximum hip amplification occurs at higher<br />
frequencies, about 10 Hz, in the _gz axis.<br />
4. Motion experienced in the seated subject at the upper torso may be<br />
amplified from 1.5 to 4.0 times at the resonant frequency.<br />
5. Use of helmets modifies head motion, and it is suggested that the<br />
helmet-free condition is better than the helmet-restrained condition.<br />
6. Standing subjects, with motion in the _gz axis, have a major body<br />
resonance near 4 to 6Hz. A secondary resonance occurs near 12Hz.<br />
Standing with the legs bent serves to attenuate the input vibration, but<br />
fatigue occurs and effectiveness of this as a damping technique is gradually<br />
lowered.<br />
7. Wben seated and experiencing !g x vibration, tile lower body amplifies<br />
the motion, but motion is attenuated at the head. Resonance is above<br />
5.5 ltz.<br />
8. When seated and experiencing _-gy vibration, motion in the upper<br />
torso is attenuated, but maximum response occurs near 1.5 Ilz.<br />
9. In subjects who are supine or resting on their sides, chest and<br />
abdominal response is greatest in the 5 to 8 Hz region, indicating that man's<br />
torso should be protected from such frequencies when in these positions.<br />
Subjective Tolerance Levels<br />
The system designer is confronted with a large body of conflicting data<br />
when he attempts to determine vibration levels which are subjectively<br />
acceptable to man. It is true that levels which are virtually imperceptible to<br />
man can be identified, as well as those where extreme pain or discomfort<br />
occur, tlowever, the designer is most often faced with the nebulous area<br />
between the extremes. Tolerance limits are treated here along with<br />
subjective levels since a tolerance limit may be considered as the uppermost
Vibration 333<br />
subjective level. A true tolerance limit would be based on pathological data<br />
such as organic damage or actual mortality. Man is not used as an<br />
experimental animal for such purposes; therefore, estimates of tolerance<br />
limits are based on subjective reactions to pain and anxiety or fear.<br />
The basic problems in defining valid subjective levels are: (1) interpersonal<br />
variability--different persons label the same intensity level with<br />
different terms; (2)intra-personal variability--the same individual describes<br />
an intensity level as "disturbing" at one time, and "hardly noticeable" at<br />
another; (3)situation specificity--a particular intensity level is perceived<br />
differently depending on whether the individual is in an aircraft, an<br />
automobile, or in his home; and (4) semantics--a lack of consistent<br />
definitions of terms such as "annoying," "objectionable," "disturbing," etc.<br />
Subjective levels and tolerance limits presented in this section, therefore,<br />
should be used with some degree of caution. The system designer should<br />
not believe, for instance, that a potential change of 0.10 g suddenly places<br />
his system in an "objectionable" range. He must use the described levels<br />
advisedly, knowing that while they may be the best data available, limits<br />
are quite flexible because of the factors mentioned above.<br />
Historically, subjective studies have largely provided the basis for<br />
proposed vibration standards. Various schemes have been used in attempts<br />
to provide standards which could be universally applied to the population.<br />
Typically, a set of frequency-intensity curves are provided representing<br />
different levels of subjective reaction; then conversion functions might be<br />
added to arrive at levels for different axes, for random motion, and for<br />
duration of exposure.<br />
Two agencies have been active in trying to define acceptable standards.<br />
In the United States, Working Group $3-W-39 of the American National<br />
Standards Institute (ANSI)is writing standards with respect to annoyance,<br />
work interference, and hazard. Technical Committee ISO/TC 108/WG 7 of<br />
the International Organization of Standardization (ISO) is determining<br />
thresholds of vibration and shock acceptable to man (ISO, 1970; Hornick,<br />
1969).<br />
Probably the first attempt to organize subjective levels was made by<br />
Goldman (1948), who summarized several independent studies with curves<br />
describing comfort and discomfort regions. These curves were used as design<br />
guidelines without distinction for axis, duration, or randomness. In more<br />
recent years, studies have been conducted to define more clearly the<br />
influence of these factors on subjective reactions.<br />
Sinusoidal _'gz Vihcation<br />
A short-term tolerance limit from 1 to 15Hz was established by<br />
Ziegenruecker and Magid (1959). Lowest tolerance is the range of 4 to<br />
8Hz. Subjective symptoms frequently reported included abdominal pain,
334 Bioaslronautics DataBook<br />
chestpain,dyspnea, andgeneral discomfort;<br />
with relatively fewer reports of<br />
testicular pain, head symptoms, and anxiety. Extending this study, Magid,<br />
Coermann, and Ziegenruecker (1960) estimated the g levels which might be<br />
tolerated for 1 and 3 minute exposures (figure 7-17).<br />
k-<br />
w<br />
5<br />
w 3<br />
<<br />
' ' 3 ' ' ' • ' ' ' t J t i , , i . I ,<br />
GO 1 2 4 5 6 7 8 9 10 11 12 13 14 15 16 17 18 19 20<br />
FREQUENCY (Hz)<br />
Figure 7 17. Short time, 1 rain. and 3 min. tolerance limits.<br />
(Magid et al., 1960)<br />
Showing that the nranner of respiration affects tolerance, Mandcl and<br />
Lowry (1962) obtained higher tolerance limits for 1 minute exposures.<br />
Subjects were instructed to continue to breathe normally instead of<br />
erratically during vibration. Figure7-18 compares the Mandel and Lowry<br />
data with those of Magid, Coermann, and Ziegenruccker (1960). Figure 7-19<br />
illustrates wide variability in subjective tolerance levels reported by subjects<br />
exposed to 1 to 27 Hz in studies by Parks and Snyder (1961) and Chaney<br />
(1964) using identical facilities.<br />
A psychophysical approach to the quantification of subjective levels has<br />
recently been devised by Shoenberger and Harris (1969), whereby magnitude<br />
_timation and intensity matching replace qualitative descriptions. For each<br />
frequency, results are plotted as straight line functions on log-log graphs of<br />
subjective intensity versus physical intensity. Subjects then match the<br />
intensity of 9 Hz at 0.08, 0.16, 0.26, 0.36, 0.46, and 0.56 gz with vibration<br />
at each of the other six frequencies. According to Shoenberger and Harris,<br />
equal intensity curves from the magnitude estimation data show the same<br />
general shape and comparable levels as corresponding curves determined<br />
experimentally using the intensity matching procedure. Figure7-20 shows<br />
the derived curves from the intensity matching and magnitude estimation<br />
data based upon a value of 0.006gz for the threshold of vibration<br />
perception at 9 ilz, with the six acceleration levels then corresponding to
Vibration 335<br />
the multiples of that base. These results indicate that subjective response to<br />
vibration can be assessed by techniques similar to those used in acoustics,<br />
and that they could eventually be used for estimating the severity of<br />
complex vibration conditions.<br />
A<br />
3.5<br />
3.0<br />
'E 2.5<br />
?<br />
(.9<br />
z 2.0<br />
0<br />
{E<br />
,,, 1.5<br />
.J<br />
iii<br />
{.)<br />
o<br />
1.0<br />
0.5<br />
LEGEND:<br />
= =ONE-MINUTE TOLERANCE (Mandel & Lowry)<br />
O- ..... -oSHORT-TIME TOLERANCE t (Magid et al)<br />
\ X-- .....<br />
',\<br />
XONE-MINUTE TOLERANCE<br />
7<br />
j<br />
\', // /<br />
\. '...... \ "-- Z_," " ./"<br />
'_....._..... 1 "_<br />
1 1 I 1 1 I I I<br />
0 _\ 3 4 5 6 7 8 9 10<br />
FREQUENCY (Hz)<br />
Figure 7-18. Short duration tolerance as a function<br />
of respiration technique. (From Mandel & Lowry, 1962)<br />
Subjective levels for dual frequency sinusoidal _gz motion were<br />
investigated by Brumaghim (1967). Subjects estimated the severity of 4, 5,<br />
6, 8, and 10 Hz when each was experienced (1)with no other vibration,<br />
(2) with 17Hz at 024 RMSg added, and (3) with 17Hz at 0.43 RMSg<br />
added. Subjects were instructed to "ignore" the background 17 Hz motion<br />
in identifying perceptible, mildly annoying, and extremely annoying levels<br />
for the basic frequencies. When the background intensity was 0.43 RMSg,<br />
higher intensity levels of the basic frequency were necessary for the subjects<br />
to identify them subjectively. Figure7-21 shows the change in intensity<br />
required for the basic frequencies to be found "perceptible," etc., when<br />
paired with the 0.43 RMSg, 17 Hz vibration. It appears that difficulty is<br />
experienced in perceiving the primary frequency when a background<br />
vibration is present.<br />
In figure 7-22 are data which present subjective levels for sinusoidal<br />
vibration.
336<br />
OOl!<br />
Bioaslronauti_ Data Book<br />
.._'.. ,., .... , --__-.-, ............. _. "-_. _.o/_,._<br />
_,[ ...............................<br />
Or/ .,"<br />
I<br />
FigUre 7-19. Subjective tolerat_ce cUrves COmparison. (Chancy, 1964)<br />
it1<br />
3 __0<br />
_f_EQUENcy _;_z_<br />
Figure 7_20. gqaal subjective intensity curves. (From Shoenberger &/-/arns, 1969)<br />
Eer_L[
Vibration 337<br />
.80 .... WITH BACKGROUND OF 0.43 RMS g, 17Hz<br />
.70<br />
SINGLE FREOUENCY<br />
0 _<br />
I-- ._ _.. ..... _-- E<br />
°<br />
_ M<br />
1_ .30<br />
>.<br />
rr" .20 E - EXTREMELY ANNOYING<br />
_C M -- MILDLY ANNOYING<br />
n"<br />
o.. .10<br />
p - PERCEPTIBLE<br />
...._...-..---- p<br />
I I I 3 I<br />
4 5 6 8 10<br />
FREQUENCY (Hz)<br />
Figure 7-21. Change in intensity required for basic frequency to reach designated<br />
subjective thresholds with and without background vibration. (Compiled from data of<br />
Brumaghim, 1967)<br />
SHORT T_ME (Zle,_*nt_ker & Mag,dl<br />
......<br />
._ I_ ONE Md_UT_ 4Mag,d el it_<br />
L_8 _. / 1 / ,Po,,_&Sr,_derl<br />
O5<br />
04<br />
.g 03 L<br />
_J6HL "f VASJ,_RLE<br />
SUBJECTIVE TERMS<br />
LJSEI_4N THIg RANGE<br />
0?F<br />
0 i_ OBJECTIONABLE ifi,.n,agh,r_l_<br />
oo_<br />
oo_,b , PEE_CIpIIEJLE<br />
o o_ EChJ_ey_<br />
0175<br />
o r_<br />
12 _4 16 18 2o 22 _4 26<br />
FBEOUENCY ;Hzl<br />
Figure "/-22. Subjective levels and tolerance limits for -_gz _ibrafion.
338 Bioastronautics Data Book<br />
Reports of Pain. Reports of pain are scattered widely in tile vibration<br />
literature. Most often, these are relatively casual references to general<br />
complaints or to pain in some region of the body by some of the<br />
participating subjects. These accounts are not treated in detail here because<br />
of the typically sporadic character of the reports, though some generalizations<br />
may be made. Little is known with respect to the specific causes of<br />
pain during vibration. However, it is widely believed that organic resonances<br />
and consequent stretching of supportive muscles and tissue is a major<br />
contributor. Most reports of pain occur at levels above those necessary to<br />
cause performance decrement. As tolerance limits and "alarming" levels are<br />
approached, the proportion of complaints can be expected to increase. In<br />
the frequency range of 4 to 8 Hz, complaints are often made at levels over<br />
approximately :!:0.25gz, intensities fairly well below "alarming" levels. Pain<br />
and discomfort disappear with the cessation of vibration.<br />
Random gz Vibration<br />
Table 7-8 summarizes reactions to random gz vibration.<br />
Absorbed Power Concept. In recent years, a concept of "absorbed<br />
power" has been advanced by Pradko and his coworkers which is claimed<br />
to correlate subjective and quantified values quite well. Detailed explanations<br />
and the mathematical structure of the technique are available in<br />
several papers and are, therefore, not presented here (see Pradko & Lee,<br />
c. 1965; Pradko et al., 1966; and Lee & Pradko, 1968). The technique<br />
involves use of power spectral density (PSD), but with the added measure-<br />
ment of the rate at which the vibration input is used by means of a<br />
transfer function of input to output energy. The rate of flow of energy<br />
characterizes the interaction of the vibrating human and the environment.<br />
The energy fl0w occurs as a result of the complex damped elastic properties<br />
of the anatomy, and this flow is designated as "absorbed power." This<br />
concept is yet largely a hypothetical approach, and its attempts at<br />
correlations with subjective reactions, while mathematically precise, are<br />
based on too fcw subjects to be applicable at this time.<br />
Other Axes<br />
Lee and Pradko data (1968) support the notion that the gx and gy axes<br />
may not differ much for subjective comfort, and that these axes differ from<br />
the gz axis as follows: below 4 Hz, comfort is lower for the gx and gy<br />
axes; above 4 Hz, comfort is greater in the gx and gy axes.<br />
Earlier, Pradko (1964) used sinusoidal and random vibration from 1 to<br />
30 ltz in several axes and combinations--gz; pitch; roll; gz and roll; pitch<br />
and roll; and gz and pitch and roll. With random motion, tolerance is<br />
greatest for roll. Overall highest tolerance is to random motion which<br />
indicates that generalizing from sinusoidal limits to random vibration is not<br />
appropriate and that gz limits cannot be used for other axes. To do so<br />
could result in overly conservative design limits not desirable for system design.
0<br />
;><br />
E<br />
0<br />
"I0<br />
t-<br />
O<br />
(.,)<br />
-I-<br />
.=."<br />
14.<br />
£r.-<br />
CJ<br />
¢,)<br />
I<br />
c<br />
0<br />
E<br />
D<br />
"0<br />
C<br />
E<br />
uO<br />
c<br />
0<br />
nO<br />
E<br />
0<br />
].<br />
E<br />
o E<br />
"0<br />
t=<br />
r"<br />
Vibration 339<br />
_ e e<br />
i i<br />
O 0<br />
e _ _ g<br />
"- _' '_ _ o<br />
g 5'- _<br />
._ =<br />
_ . _<br />
r_ ._ o<br />
0 c-<br />
O e_<br />
m _r o N<br />
I _ CO<br />
.0 C t-<br />
_ ._o .o_<br />
-<br />
o o<br />
0 0 0<br />
CO Z Z<br />
6 c_ 6 6 6 c_ c_ 6
340 Bioastronautics Data Book<br />
Woods (1967) compared subjective reactions to sinusoidal and random<br />
motion in the gz and g. axes with 10 seated subjects. Descriptor opinions were:<br />
(1) "neutral;" (2) some unpleasant effects;" (3)"some unpleasant effects<br />
cannot be ignored;" (4)"definitely unpleasant;" (5)"most unpleasant;" and<br />
(6) "quite unacceptable." Figures 7-23 and 7-24 show the general nature of his<br />
findings. Random vibration is better tolerated than is sinusoidai motion in both<br />
the gz and gy axes.<br />
I<br />
t_<br />
Itj<br />
UJ<br />
U.<br />
.3<br />
¢_ _ .2<br />
Ow --<br />
Sg<br />
o<br />
_ RANDOM<br />
% /<br />
o,"<br />
i SINUSOIDAL<br />
I I I I<br />
0 2 4 6 8 10<br />
FREQUENCY (Hz)<br />
Figure 7-23. Comparison of random and sinusoidal gz subjective reaction of "'some<br />
unpleasant effects cannot be ignored". (From Woods, 1967; used by permission of<br />
Aircraft Engineering)<br />
_0<br />
UJ<br />
tl<br />
I<br />
Ow _<br />
C,),J<br />
_rsW<br />
.3<br />
%1<br />
/<br />
/<br />
_° /<br />
/;s_A NsDoOI_A L<br />
1 I I 1<br />
0 2 4 6 8 10<br />
FREQUENCY (Hz)<br />
Figure 7-24. Comparison of random and sinusoidal gy subjective reaction of "some<br />
unpleasant effects cannot be ignored". (From Woods, 1967; used by permission of<br />
Aircraft Engineering)
Vibration 341<br />
"Annoying" and "objectionable" levels for aircraft passenger situations<br />
were studied by Brumaghim (1969). Subjects were seated in aircraft seats in<br />
a simulator and experienced several types of vibration--_gz, _g., single and<br />
combined frequencies, single and combined axes, and combine_ frequencies<br />
and axes. These results also indicate that lateral .tg. vibrations are more<br />
objectionable than gz motion in the range to 3 Hz (Figure 7-25). Combined<br />
frequency tests were conducted in gz and g. axes to determine if reactions<br />
• y<br />
to muhifrequency vibration could be linearly predicted from the values<br />
obtained for each frequency separately. That is, for the 1 and 4Hz<br />
combination, halves of each separate frequency intensity called objectionable<br />
were summed as the predicted value for the combined frequencies.<br />
Brumaghim found good agreement between predicted and actual values.<br />
However, the results for prediction of combined axis vibration reactions<br />
were not good, again indicating the nonequivalence of the axes of motion<br />
with respect to subjective reaction.<br />
.16<br />
o, 14<br />
Z_o .12<br />
0:<br />
.10<br />
.08<br />
02<br />
o VERTICAL<br />
O LATERAL<br />
I I J _ I J I I I t I<br />
0.2 Q45 0.70 1.0 1.5 2 3 4 5 6 7<br />
FREQUENCY (Hz}<br />
Figure 7-25. Subjective "objectionable" response levels<br />
for :t_ axes. (From Brumaghim, 1969)<br />
Temple and coworkers (1964) conducted a study with subjects<br />
semisupine at +1 G x experiencing -+'gx, -+-gy, and -+'gz vibration from 3 to<br />
20 Hz to evaluate tolerance endpoints for several couch support and head<br />
restraint configurations. The data indicate that tolerance is extremely sensitive<br />
to the type of support, and that complex interactions exist between type of<br />
support system and axis of motion.<br />
Summary of Subjective Responses<br />
Subjective levels and tolerance limits in older literature are not useful for<br />
design because they (1)are based on antiquated studies; (2) use grossly
342 Bioastronautics DataBook<br />
subjectivesemantics; (3)dependon "data"fromoneor veryfewsubjectsor<br />
"observers;" (4)do notaccount forvariability; (5)donotaccount forduration;<br />
(6)donotaccount for personal variables; and(7)do notdifferentiateamong<br />
axes.Certainagencies arein theprocessof defininglimitswhichmaybecome<br />
universallyacceptableas designguidelines.However, theseare not yet<br />
_tisfactorilydefined.<br />
Tworeviewshaveastheirobjectivetheexplorationof thelimit problem<br />
ratherthanthedefinitionof discrete levels.Bryce(1966)exploredthebasisof<br />
thedisagreements in thesubjectivecomfortareaandsuggests thatthemost<br />
prominent discrepancies areattributable to theamountof restraint affordedby<br />
the bodysupport.GartleyandBeldam(1967)exploredthe feasibilityof<br />
establishing acceptable exposure criteriaandconclude that"theinconsistencies<br />
andgeneral lackof agreement...make it impossible todevelop realisticvibration<br />
exposure criteria..."<br />
Beyondthesubjectivedatareportedin figure7-23andtable7-6,it can<br />
reasonably bestatedthatsubjective comfort togvandgxmotionislessthanfor<br />
gzbelow4Hz;above4Hz,gzislikelytobemo_edisturbing thanfortheother<br />
axes.Further, thesmallamountofdatacomparing sinusoidal motiontorandom<br />
suggests thatrandommotionisbettertoleratedthanissinusoidal. Published<br />
exposurelimits at thistimearedifficult to justify andmustbe applied<br />
cautiously.<br />
Interaction of Vibration with Other Environmental Parameters<br />
Limited research has combined vibration stress with other environmental<br />
stressors such as acceleration, noise, and altitude. Visual performance during<br />
linear acceleration with vibration was studied by Clarke and coworkers (1965).<br />
Conditions of +3.85Gx:!:ng x were used, with vibration intensities ranging from<br />
-+0.8 to -2.4 g at 11 Hz. No effect was found for an easy dial reading task, but<br />
increased intensity of vibration was related to increased error scores for a<br />
difficult task. In terms of very gross errors, no real effect was noted until +1.6 gx<br />
was reached.<br />
A similar set of conditions was used by Vykukal and Dolkas (1966) and<br />
Vykukal (1968) where tracking, dial reading, and subjective assessment of<br />
performance decrement were evaluated during +nGx:tng x conditions.<br />
Acceleration and vibration intensifies up to +4 G x and +-3.0 gx in the 2.5 to<br />
20 Hz frequency range were used. Results indicate that decreased visual acuity is<br />
the most serious effect. Rapid deterioration of control performance occurred at<br />
_:0.7 gx for 11 Hz. With a +3.5 G x bias, vibration levels above -+0.30 gx at 11 ttz<br />
are believed to jeopardize spacecraft mission success. Body resonances were<br />
observed at 7 Hz; between 9.5 and 12.5 Hz; and at 15 and 18 Hz. Magnitude of<br />
the resonances increases as a function of the bias acceleration for the same level<br />
(:tO.4 gx) of vibration. Observance of pain at 7 and 18 Hz suggests a lower<br />
tolerance to vibration at resonant frequencies when combined with high linear<br />
acceleration s.
Vibration 343<br />
Typing performance was studied by Rulon, Sampson, and Schohan (1951)<br />
during actual flight conditions with turbulence. Steady state acceleration levels<br />
ranged from +1 to +3G z with turbulence producing added oscillation.<br />
Experienced teletypists and "hunt-and-peck" typists were subjects. There was a<br />
large practice effect observed, and accuracy of the hunt-and-peck typists actually<br />
increased during the flights. However, the high proficiency teletypists<br />
experienced more response (wrong finger) and displacement (hand on wrong<br />
key) errors during the flights. No data were presented relating errors to vibration<br />
intensity or duration.<br />
A complex study concerning pilot control during turbulence was reported by<br />
Hitchcock and Morway (1968). In this study, pilots "flew" through turbulent<br />
storms in a simulated 720-B cockpit on a centrifuge with a shake platform<br />
included to provide 4.7 and 7 Hz associated with aircraft vibration. Flight<br />
accelerations ranged to +3.5 G z with -+0.5 gz at 7 Hz and +1.5 gz at 4.6 Hz. It<br />
was noted that under the experimental conditions pilots were willing to follow<br />
and capable of following prescribed penetration procedures. They chose,<br />
however, to terminate attempts to achieve new headings and altitudes when<br />
heavy turbulence was encountered. Finally, the study suggested that use of a<br />
"turbulence flight director" enables pilots to maintain better speed control and<br />
results in a reduced load factor.<br />
Much additional research is needed in the area of vibration combined with<br />
other stresses in order to provide data which can more adequately describe the<br />
reactions of man in a dynamic environment.<br />
References<br />
Abeling, A. B., & Bassett, H. L. A study of propeller ah-craft vibration. Contract<br />
N62269-3112, Project A-866, Technical Report Number3, Georgia Institute of<br />
Technology, Atlanta, Georgia, August 1967.<br />
Ashe, W. F. Physiological and pathological effects of mechanical vibration. Report 862-4,<br />
NIH Grant OH-6, Ohio State University Research Foundation, Columbus, Ohio,<br />
September 1961.<br />
Ashe, W. F. Physiological and pathological effects of mechanical vibration on animals and<br />
man. Report 862-5, NIH Grant OH-00006-06, Ohio State University Research<br />
Foundation, Columbus, Ohio, January 1964.<br />
Ayoub, M. M. Performance and recovery under prolonged vibration. Unpublished<br />
manuscript, School of Engineering, Texas Technological College, Lubbock, Texas,<br />
c. 1969.<br />
Blivaiss, B. B., Litta-Modignani, R., Galansino, G., & Foa, P. P. Endocrine and metabolic<br />
response of dogs to whole-body vibration. AMRL-TDR-64-54, Wright-Patterson Air<br />
Force Base, Ohio, June 1964.<br />
Blivaiss, B. B., Magid, E. B., & Litta.Modignani, R. Effects of wbole4mdy vibrations on<br />
plasma and urinary corticosteroid levels in man. AMRL-TDR-64-53, Wright-Patterson<br />
Air Force Base, Ohio, June 1964.<br />
Borshchevsldy, I. Ya., Koreshkov, A. A., Markaryan, S. S., Preobrazhenskiy, V. V., &<br />
Terent'yev, V. G. The effect of vibrations of certain types of modern helicopters and<br />
airplanes. Voyenno Meditsinslciy Zhurnal, 1958, 1.
344 Bioastronautics Data Book<br />
Brumaghim, S. H. Subjective reaction to dual frequency vibration. Report D3-7562, Boeing<br />
Company, Wichita, Kansas, December 1967.<br />
Brumaghim, S. H. Subjective response to commercial aircraft ride: Passenger ride quality<br />
testing. Paper presented to International Symposium on Man Machine Systems,<br />
Ergonomic Research Society, United Kingdom, Republic of Ireland, September 1969.<br />
Bryce, W. D. A review and assessment of criteria for human comfort derived from subjective<br />
response to vibration. Report No. R. 286, U.D.C. No. 534.1:613.64, National Gas<br />
Turbine Estabfishment, November 1966.<br />
Buckhout, R. Effect of whole body vibration on human performance. Human Factors,<br />
t964, 6(2), 157-163.<br />
Caiger, B. Some effects of vertical vibration on a pilot's head motion and his instrument<br />
reading capability. Aeronautical Report LR-463, National Research Council of Canada,<br />
Ottawa, Canada, August 1966.<br />
Catterson, A. D., Hoover, G. N., & Ashe, W. F. Human psychomotor performance during<br />
prolonged vertical vibration. Journal of Aviation Medicine, 1962, 33, 598-602.<br />
Chancy, R. E. Subjective reaction to whole-body vibration. Report D3-6474, Boeing<br />
Company, Wichita, Kansas, September 1964.<br />
Chancy, R. E. Whole-body vibration of standing subjects. Report D3-6779, Military<br />
Airplane Division, Boeing Company, Wichita, Kansas, August 1965.<br />
Chancy, R. E., & Parks, D. L. Tracking performance during whole-body vibration. Report<br />
D3-3512-6, Boeing Company, Wichita, Kansas, November 1964.<br />
Chancy, R. E., & Parks, D. L. Visual-motor performance during whole-body vibration.<br />
Report D3-3512-5, Boeing Company, Wichita, Kansas, November 1964.<br />
Clark, W. S., Lange, K. O., & Coermann, R. R. Deformation of the human body due to<br />
uni-directional forced sinusoidal vibration. Human Factors, 1962, 4(5), 255-274.<br />
Clarke, N. P., Mohr, G. C., Brinkley, J. W., Martin, P. J., Wooding, H. C., Henzel, J. H., &<br />
yon Gierke, H. E. Evaluation of peak vs RMS acceleration in periodic low frequency<br />
vibration. Aerospace Medicine, 1965, 36(11 ), 1083-1089.<br />
Clarke, N. P., Taub, H., Scherer, H. F., Temple, W. E., Vykukal, H. E., & Matter, M.<br />
Preliminary study of dial reading performance during sustained acceleration and<br />
vibration. AMRL-TR-65-110, Wright-Patterson Air Force Base, Ohio, August 1965.<br />
Coermann, R. R. The mechanical impedance of the human body in s/tting and standing<br />
position at low frequencies. Human Factors, 1962, 4(5), 227-253.<br />
Coermann, R. R., Magid, E. B., & Lange, K.O. Human pcrfonnance under vibrational stress.<br />
Human Factors, 1962, 4(5), 315-324.<br />
Cope, F. W., & PolLs, B. D. Increased plasma glutamic-oxalacetic transaminase activity in<br />
monkeys due to nonspecific stress effect. Journal of Aviation Medicine, 1959, 30,<br />
90-96.<br />
Dean, R. D., Farrell, R. J., & Hitt, J. D. Effect of vibration on the operation of decimal<br />
input devices. Paper presented at Human Factors Society Annual Meeting, Boston,<br />
Massachusetts, September 1967.<br />
Dean, R. D., MeGlothlen, C. L., & Monroe, J. L. Performance and physiological effects of<br />
six-hour exposure to helicopter noise and vibration. Boeing Company, Seattle,<br />
Washington, May 1964.<br />
Dennis, J. P. Some effects of vibration upon visual performance. Journal of Applied<br />
Psychology, 1965, 49(4), 245-252.<br />
Dennis, J. P. The effect of whole-body vibration on a visual performance task. Ergonomics,<br />
1965, 8(2), 193-205.<br />
Dieckmann, D. A study of the influence of vibration on man. Ergonomics, 1958, 1(4),<br />
347-355.
Vibration 345<br />
Edwards, R. G., & Lange, K. O. A mechanical impedance investigation of human response to<br />
vibration. AMRL-TR-64-91, Wright-Patterson Air Force Base, Ohio, October 1964.<br />
Ferustrom, R. W., Gschwind, R. T., & Horley, G. L. Cross-country speed and driver<br />
vibrational environment of the M60 main battle tank. Technical Memorandum 7-65,<br />
Human Engineering Laboratories, Aberdeen Proving Ground, Maryland, July 1965.<br />
Fraser, T. M., Hoover, G. N., & Ashe, W. F. Tracking performance during low frequency<br />
vibration. Aerospace Medicine, 1961,32, 829-835.<br />
Gartley, C. W., & Beldam, E. M. Feasibility of establishing acceptable vibration exposure<br />
criteria. 67-RD-2, Canadian Forces Medical Service, Institute of Aviation Medicine,<br />
Toronto, Canada, March 1967.<br />
yon Gierke, H. E. Biodynamic response of the human body. Applied Mechanics Reviews,<br />
1964, 17(12), 951-958.<br />
yon Gierke, H. E. On noise and vibration exposure criteria. Archives of Environmental<br />
Health, 1965, 11,327-339.<br />
yon Gierke, H. E., & Hiatt, E. P. Biodynamics of space flight. In S. F. Singer (Ed.), Progress<br />
in the aeronautical sciences. Amsterdam: North-Holland Publishing Company, 1962, Pp.<br />
345401.<br />
Goldman, D. E. A review of subjective responses to vibratory motion of the human body in<br />
the frequency range 1 to 70cps. Project NM 004 001, Report No. 1, Naval<br />
Medical Research Institute, Bethesda, Maryland, March 1948.<br />
Goldman, D. E., & yon Gicrke, H. E. The effects of shock and vibration on man. Lecture<br />
and Review Series No. 60-3, Naval Medical Research Institute, Bcthe_a, Maryland,<br />
January 1960.<br />
Guignard, J. C. Physiological effects of mechanical vibration. Proceedings of the Royal<br />
Society of Medicine, 1960, 53, 92-96.<br />
Guignard, J. C., & Coles, R. R. A. Effects of infrasonic vibration on the hearing. Fifth<br />
Congress International D'Acoustique, Liege, France, September 1965.<br />
Guignard, J. C., & Irving, A. Effects of low frequency vibration on man. Engineering.<br />
Cardiff, England: British Association, September 1960, Pp. 364-367.<br />
Harris, C. S., Chiles, W. D., & Touchstone, R. M. Human performance as a function of<br />
intensity of vibration at 5 cps. AMRL-TR-64-83, Wright.Patterson Air Force Base, Ohio,<br />
September 1964.<br />
Harris, C. S., & Shoenberger, R. W. Effects of frequency of vibration on human<br />
performance. Journal of Engineering Psychology, 1966, 5(1 ), 1-15.<br />
Harrison, J. Y. The effect of vibration on the ability to generate human muscle power.<br />
Unpublished manuscript submitted to tfuman Factors, 1969.<br />
Hitchcock, L., Jr., & Morway, D. A. A dynamic simulation study of the sweptwing transport<br />
aircraft in severe turbulence. Joint Report, NADC-MR-6807, Naval Air Development<br />
Center and FAA-DS.68-12, Federal Aviation Agency, October 1968.<br />
Holland, C. L. Performance and physiological effects of long term vibration.<br />
AMRL-TR-66-145, Wright-Patterson Air Force Base, Ohio, October 1966.<br />
Holland, C. L. Performance effects of long term random vertical vibration. Human Factors,<br />
1967, 9(2), 93-104.<br />
Hornick, R. J. Vibration effects on man - an overview of recent research. Litton Systems<br />
TDOC-690, paper presented to Human Factors Society 13th Annual Meeting,<br />
Philadelphia, Pennsylvania, October 1969.<br />
Hornick, R. J. Vibration isolation in the human leg. Human Factors, 1962, 4(5), 301-303.<br />
487 858 O - 73 - 23
346 Bioastronautics Data Book<br />
Hornick, R. J., Boettcher, C. A., & Simons, A. K. The effect of low frequency, high<br />
amplitude, whole body, longitudinal and transverse vibration upon human performance.<br />
Final report, Contract DA-11-O22-509-ORD-3300, Bostrom Research Laboratories,<br />
Milwaukee, Wisconsin, July 1961.<br />
Hornick, R. J., & Lefritz, N. M. A study and review of human response to prolonged<br />
random vibration. Human Factors, 1966, 8(6), 481-492.<br />
International Standards Organization Technical Committee 108, Working Group 7. Guide<br />
for the evaluation of human exposure to whole body vibration: Mechanical vibration<br />
and shock. March 1970.<br />
ioseliani, K. K. The effect of vibration and noise on the mental faculty of man under time<br />
stress. NASA TT-F-11-142, National Aeronautics and Space Administration,<br />
Washington, D.C., July 1967.<br />
Johnston, W. L., & Ayoub, M. M. Body orientation under low frequency, whole-body<br />
vibration. Unpublished manuscript, School of Engineering, Texas Technological College,<br />
Lubbock, Texas, c. 1969.<br />
Lamb, T. W., & Tenney, S. M. Nature of vibration hyperventilation. Journal of Applied<br />
Physiology, 1966, 21(2), 404-410.<br />
Lange, K. O., & Coermann, R. R. Visual acuity under vibration, tlaman Factors, 1962, 4(5),<br />
291-300.<br />
Lee, R. A., & Pradko, F. AnalyticM analysis of human vibration. 680091, Society of<br />
Automotive Engineers, presented at Automotive Engineering Congress, Detroit,<br />
Michigan, January 1968.<br />
Magid, E. B., Coermann, R. R., & Ziegenrueeker, G. H. Human tolerance to whole body<br />
sinusoidal vibration: Short-time, one-minute and three-minute studies. Journal of<br />
Aviation Medicine, 1960, 31,915-924.<br />
Mandel, M. J. Effect of sinusoidai vertical vibration on the urinary sediment in man.<br />
AMRL-TDR-62-63, Wright-Patterson Air Force Base, Ohio, June 1962.<br />
Mandel, M. J., & Lowry, R. D. One-minute tolerance in man to vertical sinusoidal vibration<br />
in the sitting position. AMRL-TDR-62-121, Wright-Patterson Air Force Base, Ohio,<br />
October 1962.<br />
McClements, A. Operational aspects of helicopter vibration. Paper read at RAS Symposium,<br />
Great Britain, January 1951.<br />
Meeder, E. A. Random vibration analysis. Machine Design, 10 September 1964, 179-184.<br />
Mozell, M. M., & White, D. C. Behavioral effects of whole body vibration. Aviation<br />
Medicine, October 1958, 716-724.<br />
Neel, S. H. Noise and vibration exposure of combat zone evacuees. ACAM Report, USAF<br />
School of Aviation Medicine, February 1959.<br />
Niekerson, J. L., & Paradijcff, A. Body tissue changes in dogs resulting from sinusoidal<br />
oscillation stress. AMRL.TDR-64-58, Wright-Patterson Air Force Base, Ohio, August<br />
1964.<br />
Nixon, C. W. Influence of selected vibrations upon speech: 1. Range of 10 cps to 50 eps.<br />
Journal of Auditory Research, 1962, 2, 247-266.<br />
Nixon, C. W., & Sommer, H. C. Influence of selected vibrations upon speech (range of 2 cps<br />
- 20 cps and random). AMRL-TDR-63-49, Wright-Patterson Air Force Base, Ohio, June<br />
1963.<br />
Notesa, C. B., & Gregory, P. C. Requirements for the flight control of a supersonic<br />
transport. Society of Automotive Engineers, paper presented at National Aero-Nautical<br />
Meeting, Washington, D.C., April 1963.<br />
Oshima, M. The effect of vibration on the visual acuity. Proceedings of the I Vth International<br />
Symposium on Space Technoiogy and Science, Agne Corp., Tokyo, Japan, 1962.
Vibration 347<br />
Parks, D. L. A comparison of sinusoidal and random vibration effects on human<br />
performance. Report D3-3512-2, Boeing Company, Wichita, Kansas, July 196l.<br />
Parks, D. L., & Snyder, F. W. Human reaction to low frequency vibration. Report<br />
D3-3512-1, Boeing Company, Wichita, Kansas, July 1961.<br />
Pradko, F. Human response to random vibration. The Shock and Vibration Bulletin,<br />
Bulletin 34, Part 4, U.S. Naval Research Laboratory, Washington, D.C., February 1965.<br />
Pradko, F. Human vibration response. Proceedings of the lOth Annual Conference on<br />
Human Factors Research and Development, Fort Rucker, Alabama, 1964, 154-168.<br />
Pradko, R., & Lee, R. A. Vibration comfort criteria. U.S. Army Tank-Automotive Center,<br />
Research and Engineering Directorate, Advanced Systems and Concept Research<br />
Division, Systems Simulation Branch,Warren, Michigan, c. 1965.<br />
Pradko, F., Lee, R., & Kaluza, V. Theory of human vibration response. Paper<br />
66-WA/BHF-15, American Society of Mechanical Engineers, New York, November<br />
1966.<br />
Pradko, F., Orr, T. R., & Lee, R. A. fluman vibration analysis. U.S. Army Tank-Automotive<br />
Center, Research and Engineering Directorate, Systems Simulation Branch, Warren,<br />
Michigan, c. 1963.<br />
Roman, J. A., Coermann, R., & Ziegenrueckcr, G. Vibration, buffeting and impact research.<br />
Aviation Medicine, February 1959, 118-125.<br />
Rosenberg, B., & Segal, R. The effects of vibration on manual fire control in helicopters.<br />
Technical Report 1-168, Franklin Institute Research Laboratories, March 1966.<br />
Rubenstein, L., & Kaplan, R. Some effects of y-axis vibration on visual acuity.<br />
AMRL-TR-68-19, Wright-Patterson Air Force Base, Ohio, June 1968.<br />
Rubenstein, L., & Taub, H. A. Visual acuity during vibration as a function of frequency,<br />
amplitude and subject display relationship. AMRL-TR-66-181, Wright-Patterson Air<br />
Force Base, Ohio, June 1967.<br />
Rulon, P. J., Sampson, P. B., & Schohan, B. The effects of "G" forces on the performance<br />
of teletype operators. Technical Report 6568, Educational Research Corporation,<br />
Wright-Patterson Air Force Base, Ohio, October 1951.<br />
Schmitz, M. A., Simons, A. K., & Boettcher, C. A. The effect of low frequency, high<br />
amplitude, whole body vertical vibration on human performance. Report 130, Contract<br />
DA-49-007-MD-797, Bostrom Research Laboratories, Milwaukee, Wisconsin, January<br />
1960.<br />
Schohan, B., Rawson, H. E., & Soliday, S. M. Pilot and observer performance in simulated<br />
low altitude high speed flight. Human Factors, 1965, 7(3), 257-265.<br />
Seeman, J. S., & Williams, R. B. Deck motion simulator program: Horizontal sinusoidal<br />
oscillation effects upon performance of standing workers. NASA TN D-3594, National<br />
Aeronautics and Space Administration, Washington, D.C., October 1966.<br />
Shoenberger, R. W. Effects of vibration on complex psychomotor performance. Aerospace<br />
Medicine, 1967, 38, 1264-1269.<br />
Shoenberger, R. W. Investigation of the effects of vibration on dial reading performance<br />
with a NASA prototype Apollo helmet. AMRL-TR-67-205, Wright-Patterson Air Force<br />
Base, Ohio, February 1968.<br />
Shoenberger, R. W., & Harris, C. S. Psychophysical assessment of whole body vibration.<br />
Unpublished manuscript, Wright-Patterson Air Force Base, Ohio, 1969.<br />
Snyder, F. W. Effects of low frequency vertical vibration on human performance. Paper<br />
presented at Aerospace Medical Association Meeting, Atlantic City, New Jersey, April<br />
1962.<br />
Society of Automotive Engineers. Ride and vibration data manual. SAE J6a Information<br />
Report, New York, December 1965.
348 Bioastronautics Data Book<br />
Soliday, S. M., & Schohan, B. A simulator investigation of pilot performance during<br />
extended periods of low-altitude, high-speed flight. NASA CR-63, National Aeronautics<br />
and Space Administration, W ashington, D.C., June 1964.<br />
Soliday, S. M., & Schohan, B. Task loading of pilots in simulated low-altitude high-speed<br />
flight. Hun_n Factors, 1965, 7(1), 45-53.<br />
Taub, H. A. The effects of vibration on dial reading performance. AMRL-TDR-64-70,<br />
Wright-Patterson Air Force Base, Ohio, July 1964.<br />
Taub, H. A. Dial-reading performance as a function of frequency of vibration and head<br />
restraint system. AMRL-TR-66-57, Wright-Patterson Air Force Base, Ohio, April 1966.<br />
Teare, R. J., & Parks, D. L. Visual performance during whole-body vibration. Report<br />
D3-3512-4, Boeing Company, Wichita, Kansas, November 1963.<br />
Temple, W. E., Clarke, N. P., Brinkley, J. W., & Mandel, M. J. Man's short-time tolerance to<br />
sinusoidal vibration. Aerospace Medicine, 1964, 35(10), 923-930.<br />
Tinker, M. A. Effect of vibration upon speed of perception as measured by reading speed.<br />
American Journal of Prychotogy, 1948, 61, 386-390.<br />
Torle, G. Tracking performance under random acceleration: Effects of control dynamics.<br />
Ergonomics, 1965, 8(4), 481-486.<br />
Vykukal, H. C. Dynamic response of the human body to vibration when combined with<br />
various magnitudes of linear acceleration. Aerospace Medicine, 1968, 39, 1163-1166.<br />
Vykukal, H. C., & Dolkas, C. B. Effects of combined linear and vibratory accelerations on<br />
human body dynamics and pilot performance capabilities. Paper presented to XVllth<br />
International Astronautical Congress, Madrid, Spain, October 1966.<br />
Weis, E. B. Experimental analysis of the human body as a mechanical system.<br />
AMRL-TR-65-8, Wright-Patterson Air Force Base, Ohio, 1965.<br />
Weisz, A. Z., Goddard, C., & Allen, R. W. Human performance under random and sinnsoidal<br />
vibration. AMRL-TR-65-209, Wright-Patterson Air Force Base, Ohio, December 1965.<br />
White, G. W., Jr., Lange, K. O., & Coermann, R. R. The effects of simulated buffeting on<br />
the internal pressure of man. Human Factors, 1962, 4(5), 275-290.<br />
Woods, A. G. Human response to low frequency sinusoidal and random vibration. Aircraft<br />
Engimsering, July 1967, 6-14.<br />
Yamamoto, T. G. Structural dynamic response of a terrain following vehicle due to<br />
turbulence. NA-64-1324, North American Aviation, Los Angeles, California, 22 January<br />
1965.<br />
Ziegeuruecker, G. H., & Magid, E. B. Short time human tolerance to sinusoidal vibrations.<br />
WADC-TR-59-391, Wtight-Patterson Air Force Base, Ohio, July 1959.
CHAPTER 8<br />
WEIGHTLESSNESS<br />
by<br />
Charles A. Berry, M.D.<br />
National Aeronautics and Space Administration<br />
Gravity is a force which is ever present, continuously utilized, and little<br />
understood. Its invariant nature underlies our every activity. We walk, we build,<br />
we play games-in every instance relying on the constant effect of gravity and<br />
seldom realizing that this is the case. The world of unit-gravity is very familiar<br />
and very comfortable. A world without gravity would be strange indeed. Yet the<br />
designers of space missions and space equipment must plan systems and devices<br />
for perfect operation in a world in which there is no gravity.<br />
From the design engineering vantage point, two aspects of the weightless or<br />
reduced-weight state are especially important. The first of these, of course, is the<br />
absence of weight itself; the second, the tractionlessness which accompanies it.<br />
The gravitational weight of the body is a quantity to which the human nervous<br />
system has become accustomed to responding over the entire period of<br />
development of the species on Earth. Tile removal of man from Earth's<br />
gravitation environment can therefore reasonably be expected to have significant<br />
impact on the organism, notably in the areas of perceptual-motor performance,<br />
sensory performance, and basic physiological functioning.<br />
Perceptual-motor responses are conditioned to overcoming the existing pull<br />
of gravity on both the limbs and on any objects one wishes to lift or move. One<br />
learns to judge the weight of objects and to predict their movement by forces in<br />
the limbs upon handling various objects. With no gravitational force to<br />
overcome, free-floating objects will accelerate with the application of the<br />
smallest force. Actual space flight experience fortunately has shown that man's<br />
effectiveness in handling objects in that environment is not a problem. On the<br />
contrary, one adapts readily to this aspect of the environment, and it has<br />
frequently been used to advantage (Berry, 1970). Positioning tools, for example,<br />
in "mid-air" at a work site and _aring from place to place are obviously<br />
convenient when such behavior is desired.<br />
Certain special senses are subject to functional alterations in the weightless<br />
environment. This is particularly true of the body's balance mechanism, the<br />
349
350 Bioastronautics Data Book<br />
gravity-dependent otolith organ. The physiology of these responses will be<br />
discussed in detail in chapter 17 and will only be mentioned briefly in the<br />
present chapter. Since the sense of cutaneous touch depends on stimulation of<br />
the touch receptors in the skin, the gravity free environment virtually eliminates<br />
this sensation. This seems to create for the inhabitant of the space capsule an<br />
unusual but not inconvenient situation.<br />
The satisfactory performance of purely motor functions has posed a more<br />
challenging problem in the space environment. The execution of tasks which<br />
require push-pull forces and locomotion itself in the weightless state and under<br />
lunar gravity conditions has been facilitated through the development of various<br />
restraints and specialized tools and preflight astronaut training employing<br />
neutral buoyancy and other simulation techniques.<br />
Unfortunately, prediction of physiologic respons_ during weightlessness is<br />
more complicated than prediction of work performance. Many of the problems<br />
anticipated have proved to be without foundation. Some, however, have been<br />
borne out. For example, it was reasonable to expect that head colds would be<br />
more troublesome in 0 g than in the Earthbound environment since sinus<br />
drainage is gravity dependent. During the Apollo 7 mission, crewmembers who<br />
suffered head colds reported considerable discomfort and indicated that the<br />
space flight environment was in fact detrimental to relieving cold suffering.<br />
Earthbound analogs of weightlessness are available, but these are little more than<br />
useful tools. None actually simulates weightlessness since none eliminates gravity<br />
effects. At best, these techniques permit long-term study of isolated aspects<br />
similar to those which would be experienced in the weightless environment. Bed<br />
rest studies, for instance, are useful for more closely examining the effects of<br />
prolonged inactivity on such functions as calcium metabolism. The neutral<br />
buoyancy technique is unsuitable for the study of long-term physiological<br />
change because human subjects obviously can be submerged only for limited<br />
periods of time.<br />
Since true weightlessness can be achieved within the influence of Earth's<br />
gravity for no longer than 1 min (usually 30 to 40 sec) (Gerathewohl & Ward,<br />
1960), the most reliable predictor of the effects of long-term weightlessness on<br />
the human organism is, without doubt, actual orbital space flight experience. To<br />
date, this experience is limited to 2 weeks' exposure during the Gemini 7 mission<br />
and 24 days in the Soviet Salyut/soyuz 11 flight. (See appendix for a<br />
chronology of U.S. and Soviet space flight missi,_n durations.)<br />
Animal data have been obtained during a 22-day mission where dogs were<br />
placed in orbit by Soviet scientists aboard the Kosmos 110 satellite (Parin et al.,<br />
1968). This and similar animal experiments are, like ground-based simulation, a<br />
valuable, but by no means perfect, tool for studying weightlessness effects.<br />
Whereas extrapolation from simulated to actual space flight conditions must be<br />
made cautiously because ground-based studies cannot eliminate gravity effects,<br />
direct applicability of orbital animal flight data is markedly restricted because of<br />
the inherent danger of generalizing results across species. Such experimentation<br />
does, however, offer the possibility of performing procedures which could not<br />
be ethically applied to man, and animals can be subjected to excessive
Weightlessness 351<br />
environmental exposures in searchof thresholdtolerances (but still mustbe<br />
instrumented carefullyif anyresultsaretobeinterpretable).<br />
All informationavailable to dateindicates thatmanadjustswellto zero<br />
gravityfor theperiodshe hasflown.Somereversiblephysiological changes<br />
havebeennoted,principallyin the cardiovascular system.To limit the<br />
magnitudeof thosechanges, somecountermeasures to weightlessness maybe<br />
required,but thesemaybe no morecomplicatedthanthe provisionof<br />
dietarysupplements. Withfewexceptions, adjustment to weightlessness has<br />
beeneffortless.<br />
Informationaboutweightlessness effectshasbeengainedby increasing<br />
man'sexposureto theweightless environment in cautious incremental steps.<br />
In theSkylabprogram, scheduled to commence in 1973,thisapproachwill<br />
be expanded andsystematized. TheSkylabspacestationwill permita much<br />
higherlevelof complexityof medical/behavioral laboratorytechniquesand<br />
equipment aswellaslongermissiondurationsof 28to 56days.Missions<br />
suchas thesewill pro',4dethe first stepstowarda soundbasisfor<br />
committingmanto evenlongerstaysin space,perhapsupto several years'<br />
duration.<br />
Dataobtainedduringmannedmissionsin spacehavedonemuchto<br />
dispelspeculation concerning thepotentialhazardsof spacetravel.However,<br />
somechangeshavebeenseenandalthoughtheydo notappearto suggest<br />
that man is seriouslycompromised physiologically by spaceflight<br />
experience theynonetheless mustbe watchedcarefullyto insurethatthey<br />
are not progressive in nature.The necessityfor moredatais further<br />
emphasized by the smallnumberof individualstudiedthusfar andthe<br />
inevitableindividualvariabilitywhich exists.Increasingmissionlength,<br />
however, increases theimportanceof providinganenvironment for manin<br />
spacewhichassureshis safeandsatisfactoryperformance. Spacevehicles<br />
mustbe designedwith all aspectsof operationin zerogravitytakeninto<br />
account.<br />
Effects of Weightlessness on<br />
Physiological Systems<br />
Prior to actual space flight experience, many legitimate concerns were<br />
expressed about man's potential response to the space flight environment.<br />
Table 8-1 lists a number of the effects predicted. Some of these involved<br />
pure conjecture; others could be more reasonably expected on the basis of<br />
early orbital animal flight experience and parabolic aircraft flight<br />
experimentation involving both men and animals. Inflight and postflight<br />
studies reported for individuals who have lived and worked in space indicate<br />
that many predicted problems were baseless, at least for stays up to<br />
2 weeks. Some physiological changes have been consistently noted, but none<br />
have been permanently debilitating.
352 Bioastronautics Data Book<br />
Dysbarism<br />
Table 8-1<br />
Predicted Human Response to Space Flight<br />
Disruption of circadian rhythms<br />
Decreased g-tolerance<br />
Skin infections and breakdowr<br />
Sleepiness and sleeplessness<br />
Reduced visual acuity<br />
Disorientation and motion sickness<br />
Pulmonary atelectasis<br />
High heart rates<br />
Cardiac arrhythmias<br />
High blood pressure<br />
Low blood pressure<br />
Fainting postflight<br />
Electromechanical delay in<br />
cardiac cycle<br />
Reduced cardiovascular response<br />
to exercise<br />
Sedative need<br />
Stimulant need<br />
Reduced blood volume<br />
Reduced plasma volume<br />
Dehydration<br />
Weight loss<br />
Bone demineralization<br />
Loss of appetite<br />
Nausea<br />
Renal stones<br />
Urinary retention<br />
Diuresis<br />
Muscular incoordination<br />
Muscular atrophy<br />
ttallucinations<br />
Euphoria<br />
Impaired psychomotor<br />
performance<br />
Infectious disease<br />
F at igu e<br />
Table 8-2 summarizes the responses of the United States astronauts and<br />
Soviet cosmonauts to space flight exposure in the Mercury, Gemini, Apollo,<br />
Vostok, Voskhod, and Soyuz missions. Observation and measurement of these<br />
responses were made possible by a number of techniques, including preflight,<br />
inflight, and postflight studies. Television, telemetry and voice communication<br />
plus in flight sampling and, in one instance (Voskhod 1), inflight clinical evaluation<br />
by a physician, permitted an assessment of real time physiological changes.<br />
Table 8-3 lists the principal techniques employed to monitor minute-<br />
to-minute inflight responses.<br />
The sections which follow elaborate the physiological and performance areas<br />
which have been or may be expected to be affected by weightless space flight.<br />
Cardiovascular Responses and Hematological Effects<br />
Oxygen and nutrients in the internal environment of the body would be<br />
rapidly exhausted if they were not continually replenished by circulating blood.<br />
Likewise, the end products of metabolism would soon build up to toxic levels<br />
were they not removed from the tissues. This exchange is accomplished in<br />
capillary beds. At the arterial end of the capillaries, hydrostatic pressure due to
CO<br />
-__ £,<br />
C/3<br />
m<br />
o<br />
D<br />
ILl<br />
.c _ ><br />
E<br />
_.-<br />
• 0<br />
0 "0<br />
"10 .N<br />
__ o<br />
,,, Z<br />
I.-<br />
<<br />
fr-<br />
ill<br />
'5. =<br />
Weightlessness 353<br />
x<br />
><br />
t_<br />
Z<br />
._ e_<br />
$o<br />
A<br />
._c ,_.<br />
-- • ¢_<br />
o_<br />
_ 0 _<br />
u.I<br />
0<br />
Z<br />
rr<br />
W<br />
--I<br />
o<br />
I.-<br />
0<br />
I<br />
I--<br />
I'-<br />
o<br />
-r<br />
Fn,<br />
O<br />
z<br />
E<br />
oE-o<br />
E<br />
0<br />
"0<br />
><br />
-u E<br />
.o_<br />
CO<br />
t.,t CO<br />
k_v<br />
0<br />
Z "<br />
kn-<br />
O<br />
_1<br />
Z
354 Bioastronautics Data Book<br />
c¢<br />
e_<br />
OO<br />
= ==<br />
v ct_<br />
e_<br />
o<br />
o<br />
Z,<br />
I.U<br />
(.9<br />
>-<br />
-3<br />
?,<br />
E<br />
Z<br />
I--<br />
"r<br />
L9<br />
-J<br />
U.<br />
I--<br />
O<br />
ts<br />
e-<br />
.__ r.D<br />
.c_<br />
ii<br />
e_<br />
{D<br />
E-<br />
--- etn<br />
J<br />
:= ,_-<br />
_v<br />
E_<br />
:_ 0<br />
.J CL<br />
J<br />
LU<br />
a<br />
O<br />
O<br />
_I<br />
l.IJ<br />
I.-<br />
A<br />
o E<br />
_o _<br />
E<br />
E<br />
a_<br />
O<br />
.9.0<br />
-3<br />
E<br />
-3<br />
.,-I<br />
,,_I<br />
l,,IJ<br />
0<br />
0<br />
--I<br />
o<br />
LLI<br />
r'r<br />
'0 0 ID<br />
o_:,_<br />
A<br />
_ o _<br />
Ill<br />
O<br />
z<br />
lad<br />
..I<br />
O<br />
><br />
/<br />
er<br />
0<br />
E<br />
"10 0<br />
0 _,<br />
IJJ<br />
>.<br />
I-<br />
I-<br />
--I<br />
or<br />
I.r_<br />
ILl<br />
--I<br />
ILl
t_<br />
O'J<br />
E<br />
0<br />
z<br />
v<br />
m t_<br />
E<br />
0<br />
z<br />
t_<br />
CrJ<br />
o;<br />
0<br />
Z<br />
_A<br />
t- ,_.<br />
"_ o<br />
t_<br />
E<br />
0<br />
Z<br />
z<br />
o<br />
l-<br />
z<br />
LI-<br />
>..<br />
n*"<br />
Z<br />
0<br />
--I<br />
Weightlessness 355<br />
>.<br />
_z =-<br />
"0<br />
z<br />
E<br />
wow<br />
O.<br />
OC<br />
,,z,_ m<br />
o<br />
E<br />
z
356 Biaostronautics Data Book<br />
V<br />
O<br />
Or_<br />
O<br />
O<br />
_=<br />
>-<br />
D<br />
O<br />
rr<br />
w<br />
A°<br />
'_- .:-: ',7-<br />
¢-<br />
0 _<br />
Z 0<br />
to c<br />
_EE.Eo<br />
A<br />
C<br />
0<br />
0<br />
Z<br />
0<br />
0<br />
z<br />
0<br />
W<br />
<<br />
.J<br />
D<br />
W<br />
><br />
0<br />
0<br />
A<br />
><br />
n<br />
III<br />
--1<br />
__o<br />
C v<br />
e"<br />
D<br />
0<br />
Z<br />
C<br />
I-<br />
<<br />
z<br />
o<br />
n-<br />
O<br />
0<br />
0
A<br />
0 0<br />
Z Z<br />
z<br />
z<br />
2<br />
0_<br />
o<br />
t-<br />
t<br />
Weightlessness 357<br />
tt<br />
o$_o=<br />
E<br />
E<br />
0<br />
"0<br />
7:<br />
m<br />
O<br />
ta<br />
O_<br />
z<br />
tlJ<br />
t-<br />
>-<br />
-1<br />
OA<br />
-1<br />
kU<br />
_D<br />
7:<br />
10<br />
__ ra<br />
0<br />
o<br />
tr
358 Biaostronautics Data Book<br />
CO O<br />
O<br />
e-<br />
£,<br />
>-<br />
I1:<br />
D<br />
ntU<br />
A<br />
£-<br />
u<br />
t-<br />
O<br />
c _v<br />
q_ ¢11<br />
I'-<br />
X<br />
O tu<br />
Q o<br />
>- I<br />
°i!<br />
-I<br />
0 0<br />
_._<br />
W<br />
z<br />
0<br />
Ir<br />
0<br />
IE<br />
-_._<br />
®<br />
><br />
E<br />
c<br />
X<br />
c<br />
._._ _,<br />
B<br />
¢-i<br />
g<br />
Z<br />
I-<br />
><br />
-.I<br />
0<br />
n.-<br />
I.-<br />
w<br />
_1<br />
W
"0<br />
t.-<br />
7¢._E<br />
} 0<br />
z<br />
x<br />
E<br />
"g o<br />
0 _.<br />
-- IJJ<br />
tlA<br />
.--I<br />
C_<br />
Weightlessne_ 359<br />
g<br />
_g<br />
_e<br />
_g<br />
•g g:<br />
a_<br />
E<br />
E E<br />
"z<br />
g_<br />
0<br />
z<br />
o<br />
E
360 Bioastronautics Data Book<br />
or)<br />
_z<br />
v 0Q<br />
o<br />
.S<br />
4.d<br />
E<br />
Z<br />
c.r)<br />
z<br />
O<br />
I--<br />
<<br />
fr<br />
UJ<br />
I-<br />
_1<br />
<<br />
._1<br />
<<br />
n.-<br />
O<br />
...1<br />
i1<br />
O<br />
n-<br />
-_o_ _ _<br />
.- _.__<br />
•_ _ ._ .-__<br />
___>_,_<br />
0<br />
m'_<br />
_ __<br />
A<br />
0<br />
z<br />
,,_<br />
z<br />
.J<br />
.J<br />
z<br />
.J<br />
W<br />
iT-<br />
_0<br />
0<br />
x<br />
_J<br />
z<br />
0<br />
<<br />
5<br />
<<br />
rr
o<br />
(/)<br />
z<br />
0<br />
0<br />
0<br />
_ ><br />
0<br />
0<br />
I--<br />
o<br />
><br />
487-858 0 73 - 24<br />
0<br />
g<br />
0<br />
Weightlessness 361<br />
.c___<br />
__ _ I_<br />
U.I<br />
w<br />
if)<br />
..1<br />
_ v v<br />
7= _5<br />
_s _g<br />
_._- _<br />
_.__<br />
',_ t= _<br />
=_ =<br />
0 ._ "-<br />
W<br />
(.)<br />
7<br />
II;<br />
..1<br />
0<br />
I-<br />
(.)<br />
I.--<br />
F--<br />
0 "1tn,-<br />
0<br />
0<br />
-I-<br />
o_<br />
o<br />
0<br />
T<br />
F-<br />
'1"<br />
Uz
362 Biaostronautics Data Book<br />
o<br />
v<br />
O<br />
e_<br />
"11-<br />
_1<br />
I-<br />
0<br />
6<br />
E<br />
r .._<br />
!°<br />
.-g_.<br />
2_<br />
_. 0<br />
><br />
8<br />
g<br />
_1<br />
..1<br />
o<br />
t_<br />
0<br />
0<br />
-I<br />
u.I<br />
i-<br />
-T<br />
._ -_<br />
<<br />
IJ,l<br />
r_<br />
0<br />
0<br />
r_<br />
ILl<br />
_ o _<br />
o<br />
><br />
,<<br />
,<<br />
.=.I<br />
o.<br />
v<br />
UJ<br />
>-<br />
I-<br />
><br />
F-<br />
<<br />
_I<br />
<<br />
o<br />
rr<br />
t-<br />
O<br />
UJ<br />
_.1
o_<br />
_><br />
_m<br />
r"<br />
v<br />
8t<br />
"0<br />
t-<br />
m"<br />
0<br />
z<br />
u_ m_<br />
0 0<br />
m _ .0_ __<br />
L. _ m<br />
E co cO a .=-°<br />
o o<br />
z<br />
o<br />
p<br />
z<br />
u.<br />
>-<br />
_c<br />
<<br />
z<br />
0<br />
.J<br />
o<br />
Weightlessness 363<br />
_D<br />
_-6<br />
UJ<br />
v t_<br />
_><br />
_6<br />
A<br />
CL<br />
>_<br />
_'><br />
©.=<br />
, £::)U,l<br />
X ,,I rr<br />
Hl<br />
0<br />
r.<br />
._><br />
O.
364 Bioastronautics Data Book<br />
O0<br />
_¢<br />
0<br />
:I:<br />
v<br />
0<br />
v<br />
_A<br />
_o<br />
_c<br />
,_ 0<br />
_ c<br />
0 0<br />
z> .___<br />
__<br />
<<br />
I.U<br />
Z<br />
0<br />
n<br />
W<br />
n"<br />
if-<br />
<<br />
-1<br />
I-<br />
W<br />
><br />
._c .__<br />
_ o_"<br />
_, _<br />
.__<br />
.__<br />
._o<br />
g_<br />
._- 10<br />
X _<br />
._- _ _<br />
_ z<br />
0<br />
88<br />
2_<br />
_g<br />
_ E<br />
Z<br />
0<br />
< E<br />
F-<br />
<<br />
Z<br />
W I1:<br />
m 0<br />
._ 0
e- A<br />
tO<br />
< t,<br />
¢O<br />
O<br />
_D<br />
"O<br />
z<br />
tn<br />
v c<br />
N "O<br />
O<br />
t-<br />
O<br />
><br />
_,.=_<br />
_: .__<br />
.o_ 3<br />
_.__<br />
z<br />
o<br />
I-<br />
,<<br />
I-<br />
Z<br />
UJ<br />
o<br />
t-<br />
O<br />
_A<br />
O<br />
m v<br />
O<br />
O<br />
0<br />
O.<br />
C _<br />
Weightlessness 365<br />
"O O<br />
O<br />
e"<br />
t-<br />
O<br />
-1<br />
_A<br />
"a 5<br />
O _<br />
z<br />
W<br />
I-<br />
>.<br />
--I<br />
O_<br />
I_,,-<br />
I-_<br />
..J<br />
W<br />
.r:<br />
m<br />
O<br />
e_<br />
t-<br />
_ D<br />
<<br />
D
366 Bioastronautics Data Book<br />
z<br />
0<br />
I.-<br />
>-<br />
0<br />
I-<br />
W
7:<br />
v<br />
0<br />
Zrr<br />
>.<br />
0<br />
0<br />
el<br />
_m<br />
t,i<br />
O'U 0<br />
.J<br />
Weightlessness 367<br />
z<br />
o
368 Bioastronautics Data Book<br />
.o _<br />
_ o<br />
>" 0<br />
0 Z<br />
cu-_<br />
m 0 _<br />
-- 0<br />
_ ._ m z<br />
(1)<br />
Z<br />
0<br />
rr<br />
_ Z<br />
0 _<br />
o ca<br />
112 Z<br />
_ 5<br />
W<br />
o<br />
n<br />
x<br />
Z<br />
0<br />
n"
Weightlessness 369<br />
References for Table 8-2<br />
1. Berry, C. A., Coons, D. O., Catterson, A. D., & Kelly, G. F. Man's response to<br />
long-duration flight in the Gemini spacecraft. In Gemini Midprogram Conference.<br />
Symposium presented at NASA Manned Spacecraft Center, Houston, Texas, 23-25<br />
February 1966, p. 235-261. (NASA AP-121)<br />
2. Berry, C. A. Summary of medical experience in The Apollo 7 through 11 manned<br />
spaceflights. Aerospace Medicine, 1970, 41,500-519.<br />
3. Mandrovsky, B. The Soyuz-6, Soyuz-7, and Soyuz-8 mission. Prepared by Library of<br />
Congress, Reference Department, for NASA, Washington, D.C., January 1970.<br />
4. National Aeronautics and Space Administration. Gemini Summary Conference.<br />
Symposium presented at NASA Manned Spacecraft Center, Houston, Texas, 1-2<br />
February 1967. (NASA SP-138)<br />
5. Parin, V. V. (Ed.) Aviation and space medicine. NASA, Washington, D.C., December<br />
1964. (NASA TT F-228)<br />
6. Bayevskiy, R. M., & Gazenko, O. G. Reactions of the cardiovascular and pulmonary<br />
system in humans and animals under conditions of weightlessness. Kosaicheskiye<br />
issledomniya, 1964, 2,307.<br />
7. Vallbona, C., Dietlein, L. F., & Judy, W. V. Effect of orbital flight on the duration of<br />
the cardiac cycle and of its phases. Aerospace Medicine, 1970, 41,529-537.<br />
8. Fedorova, T. A., et al. Some metabolic indices in the cosmonauts Gagarin, Titov,<br />
Nikolayev, and Popovich. In A. T. D. Press, Special Issue,Space Medicine, 1964,3(107.<br />
(Library of Congress, N64.2635 7)<br />
9. Berry, C. A. Apollo 7 to 11: medical concerns and results. NASA Manned Spacecraft<br />
Center, Houston, Texas, November 1969. (NASA TM X-58034)<br />
10. Lutwak, L., et al. Mineral, electrolyte and nitrogen balance studies of the Gemini VII<br />
fourteen-day orbital space flight. The Journal of Clinical Endocrinology and<br />
Metabolism, 1969, 29(9), 1140-1156.<br />
11. Volynkin, Y. M., & Vasil'yev, P. V. Some results of medical studies conducted during<br />
the flight of the Voskhod. In N. M. Sisakyan (Ed.)Problems of Space Biology, Vol. VI,<br />
NASA, Washington, D.C., July 1969. (NASA TT F-528)<br />
12. Gazenko, O. G., & Gyurdzhian, A. A. Physiological effects of gravitation. NASA,<br />
Washington, D.C., August 1965. (NASA TT F-376)<br />
13. Gazenko, O. G., Gurfinkel, V. S., & Malkin, V. B. Electroeneephalographic studies in<br />
space medicine. In N. M. Sisakyan (Ed.) Problems of Space Biology, Vol. VI, NASA,<br />
Washington, D.C., July 1969. (NASA TT F-528)<br />
14. Mandrovsky, B. The Soyuz.4 and Soyuz-5 joint space mission. Prepared by Library of<br />
Congress, Reference Department, for NASA, Washington, D.C., February 1969.<br />
15. Yazdovskiy, V. I., et al. Sentry-motor coordination in conditions of prolonged<br />
weightlessness during actual space flight. In A. T. D. Press, Special Issue, Space<br />
Medicine, 1964, 3(107. (Library of Congress, N64-26357)<br />
16. Lovelace Foundation. Compendium of human responses to the aerospace environment.<br />
Vol. II, Section7. Prepared for NASA, Washington, D.C., November 1968. p.<br />
7-38-7-55. (NASA CR-1205 II)<br />
17. Gazenko, O. G. Medical _udies on the cosmic spacecrafts Vostok and Voskhod.<br />
NASA, Washington, D.C., December 1964. (NASA TT F-9207)<br />
18. Gazenko, O. G., Parin, V. V., & Chernigovskii, V. N. Space physiology, some results<br />
and outlooks of experimental invcstigations. ANL Trans-209, Argonne National<br />
Laboratory, Argonne, Illinois, July 1965.
370 Bioastronauties Data Book<br />
19. Dictlein, L. F., & Rapp, R. M. Experiment M-3, inflight exercise-work tolerance. In<br />
Gemini Midprogram Conference. Symposium presented at NASA Manned Spacecraft<br />
Center, Houston, Texas, 23-25 February 1966, p. 393-396. (NASA SP-121)<br />
20. YazAovskiy, V. I., & Denisov, V. G. Flights of space vehicles Vostok-5 and Vostok-6.<br />
Vestnik Akndemii Nauk SSSR, Vol. XXXIII, No. 9, Moscow, September 1963, 17-22.<br />
21. Berry, C. A. Preliminary clinical report of the medical aspects of Apollos 7 and 8.<br />
NASA Manned Spacecraft Center, Houston, Texas, May 1969. (NASA TM X-58027)<br />
References 22-29 are articles appearing in: Gazenko, O. G. & Gurovskiy, N. N. (Eds.)Space<br />
Biology and Medicine, Moscow: Meditsina Publishing House. Vol. 4, No. 6, 1970.<br />
22. Vorob'yev, Ye. I. Yegorov, A. D., Kakurin, L. I. & Nefedov, Yu. G. Medical support<br />
and principal results of examination of the Soyuz-9 spaceship crew. pp. 26-31.<br />
23. Butusov, A. A., Lyamin, V. R., Lebedev, A. A., et at. Results of routine medical<br />
monitoring of cosmonauts during flight on the Soyuz 9 ship. pp. 35-39.<br />
24. Cherepakhin, M. A., & Pervushin, V. I. Space flight effect on the neu. romuscular system<br />
of cosmonauts, pp. 46-49.<br />
25. Kalinichenko, V. V., Gornago, V. A., Machinskiy, G. V., et at. Dynamics of orthostatic<br />
stability of cosmonauts after flight aboard the Soyuz-9 spaceship, pp. 100-112.<br />
26. Molchanov, N. S., Krupina, T. N., Balandin, V. A., et al. Results of clinical examination<br />
of A. G. Nikolayev and V. I. Sevast'yanov. pp. 39-42.<br />
27. Petukhov, B. N., Pruakhin, Yu. N., Georgiyevskiy, V. S., et al. Regulation of erect<br />
posture of cosmonauts after an 18-day orbital flight, pp. 50-54.<br />
28. Vorob'yev, Ye. I., Ncfedov, Yu. G., Kakurin, L. I., et al. Some results of medical investi-<br />
gations made during flights of the Soyuz-6, Soyuz-7, and Soyuz-8 spaceships, pp. 65-73.<br />
29. Biryukov, Ye. N., Krasnykh, I. G. Change in optical density of bone tissue and calcium<br />
metabolism in the cosmonauts A. G. Nikolayev and V. I. Sevast'yanov. pp. 42-45.<br />
30. Gazenko, O. G. Personal communication.<br />
31. Kakurin, L. 1. Medical research performed on the flight program of the Soyuz-typc<br />
spacecraft, NASA TT F-14, 026, National Aeronautics and Space Administration,<br />
Washington, D.C., November 1971.<br />
32. Chekirda, l. F., Bogdashevskiy, R. B., Yerewin, A. V., & Kilosov, I. A. Space Biology<br />
and Medicine, 1971,5(6), 71-77.<br />
References 33-36 are articles appearing in: N. M. Sisakyan (Ed.)Problems of Space Biology..<br />
Vol. 4, NASA, Washington, I).C., March 1966. (NASA TT-F-368)<br />
33. Kas'yan, I. I., Kopanev, V. I., & Yazdovskiy, V. I. Reactions of cosmonauts to<br />
weightlessness, p. 260.<br />
34. Alckseyeva, O. G. Some natural immunity factors and eo_'nonaut autoflora during the<br />
training period and foUowing the flights of Vostok, Vostok 2, Vostok 3, and Vostok 4.<br />
p. 278.<br />
35. Zhukov.Verezhnikov, N. N., et al. Results of microbiological and cytological<br />
investigations conducted during the flights of Vostok type vehicles, p. 252.<br />
36. Yazdovskiy, V. I., Yemel'yanov, M. D., Vasil'yev, P. V., & Kopanev, V. I. Some results<br />
of biomedical investigation conducted during the training period and flights of<br />
cosmonauts V. F. Bykovskiy and V. V. Tereshkova. p. 231.<br />
37. Komendatov, G. L., & Kopanev, V. 1. Motion sickness as a problem in space medicine.<br />
Problems of space biology and medicine. JPRS18395. Joint Publications Research<br />
Service, Washington, D.C., 1962.
Weightlessness 371<br />
38. Catterson, A. D., McCutcheon, E. P., Minners, K. A., & Pollard, R. A. Aerornedical<br />
observations. Chapter 18 in Mercury project summary, NASA Manned Spacecraft<br />
Center, Houston, Texas, 15-16 May 1963. (NASA SP-45)<br />
39. Berry, C. A. Aeromedical preparations. Chapter 11 in Mercury project summary,<br />
NASA Manned Spacecraft Center, Houston, Texas, 15-16 May 1963. (NASA SP-45)
372 Bioastronautics Data Book<br />
O3<br />
E o<br />
O3 o.<br />
c_<br />
O3 _=<br />
O3 c<br />
c_<br />
O3<br />
E<br />
O<br />
e-<br />
E<br />
co<br />
o_<br />
6<br />
o_<br />
.c_. ¢_<br />
._<br />
dX<br />
-0o<br />
=8<br />
_gE<br />
O><br />
E _<br />
o_ _<br />
gf_<br />
6<br />
c<br />
0<br />
..c<br />
o.<br />
o<br />
D<br />
_J<br />
O.<br />
C<br />
J_<br />
.o<br />
-- c<br />
_E<br />
:> 0<br />
U<br />
C.O<br />
_-_ --<br />
._p_ ¥<br />
_f a<br />
-o _<br />
0 _.<br />
o.<br />
O0<br />
c ,J<br />
_,o _<br />
_OE-<br />
E_U_ _<br />
_ _Oo<br />
E - o<br />
_ o o ®<br />
__><br />
"i<br />
0<br />
c<br />
o<br />
o.<br />
_E<br />
_g<br />
®_<br />
_g<br />
c<br />
o<br />
><br />
lo<br />
..o<br />
o<br />
e- ,E<br />
o<br />
0<br />
m<br />
- L<br />
E<br />
m<br />
E E<br />
E :<br />
o m_<br />
._ o_<br />
o E °<br />
> _"o<br />
.E,_"<br />
*0o'_<br />
_ m<br />
E. __<br />
®g
Weightlessness 373<br />
the heart's action drives oxygen and nutrient-bearing fluid into the spaces<br />
between the tissue cells. The drop in pressure in the venous end permits depleted<br />
fluid to return to the capillaries, thence to the central circulation. To effectively<br />
balance these two operations, or maintain homeostasis, blood plasma must be<br />
delivered in sufficient volume and with sufficient pressure. The cardiovascular<br />
system and all the complex reflexes which govern its function are devoted to<br />
maintaining this balance.<br />
In advance of space flight experience, both plasma volume and blood<br />
pressure changes were predicted on the basis of extrapolation from bed rest<br />
studies (Deitrick, Whedon, & Short, 1948) and what could reasonably be<br />
expected as a consequence of the reduction in hydrostatic pressure gradients at<br />
zero gravity. Reduction of hydrostatic pressure gradients will, for example,<br />
greatly diminish pressure exerted on blood vessels; the end result of which can<br />
be a reduction in the reactivity or sympathetic tone of the vessels (particularly<br />
the veins).<br />
It was thus predicted that over long periods of time the reduced load upon<br />
the heart, lowered blood pressure, and reduced hydrostatic pressure differences<br />
experienced in weightlessness ultimately might become manifest as a malfunction<br />
of one or more of the cardiovascular control loops responsible for<br />
homeostatic regulation. The pressure regulation and blood volume loops which<br />
are susceptible to hydrostatic effects were expected to be the most likely to<br />
deteriorate, if deterioration should occur, since these are subjected to minimal<br />
stress during prolonged weightless space flight. The consequences of such<br />
phenomena, might, it was thought, diminish or obliterate man's ability to<br />
withstand the gravitational load associated with reentry accelerations.<br />
Prior to actual flight, it was not possible to say with any reliability whether<br />
weightlessness would alter other aspects of the cardiovascular system. Hence,<br />
careful measurements were made to detect any changes in heart rate and<br />
electrical conductance. Changes in the formed elements of the blood also were<br />
watched closcly. The following section describes the principal findings.<br />
Space Flight Results. Cardiovascular indices have been monitored during all<br />
United States space flights and have been within expected physiological ranges.<br />
No significant changes have been noted in blood pressure while heart rate has<br />
tended to stabihze at a lower level. Only in the Apollo 15 crew have any<br />
significant irregularities been noted in electrocardiographic recordings. Postflight,<br />
reduced orthostatic tolerance has been observed with regularity. It has so<br />
far been the most pronounced and consistent finding. This phenomenon has also<br />
been seen following Soviet space missions. Orthostatic intolerance accompanied<br />
by elevated heart rate was first noted on capsule egress in the Mercury 8 pilot.<br />
Cardiovascular function has therefore been extensively investigated following all<br />
subsequent flights.<br />
Cardiovascular Profile. The heart function profile has been as follows:<br />
• Heart Rate. Peak heart rates (table 8-2) have been observed at launch<br />
and at reentry, normally reaching higher levels during the latter. During the
374 Bioastronautics DataBook<br />
weightless phaseof spaceflight,heartrateshavetendedto stabilizeat lower<br />
levelsandhaveresponded, at theselevels,adequately to physicaldemands.<br />
So_4et investigators (Akulinichev etal.,1964;Volynkin& Vasil'yev, 1969)have<br />
reportedthatnormalization ofheartrateoccurred inflightbutthatheperiodof<br />
timerequiredtoachievepreflighthcartrateswasconsiderably extendedbeyond<br />
theperiodrequiredfor normalization followingsimilaraccelerative stresses on<br />
Earth.Postflightheart ratcs havebeenfoundto be elevated(Berry,<br />
1967a; 1970)and,hereagain,normalization hasbeeninhibited.Following<br />
UnitedStatesApollomissions, 30to 50hoursweregcnerallyrequiredfor<br />
preflightbaseline heartratesto bereestablished.<br />
• Cardiac Electrical Activity. By far the most serious finding in the sphere<br />
of cardiovascular response have been the aberrations in cardiac electrical activity<br />
noted in the Lunar Module Pilot and the Commander of Apollo 15. The<br />
Apollo 15 crew had engaged in strenuous activity on the lunar surface during<br />
which time the arrllythmias were first noted. These were well outside the range<br />
of normal. The Lunar Module Pilot experienced numerous premature ventricular<br />
contractions both on the lunar surface and during the return to Earth. Twelve<br />
bigeminis were recorded, as were premature auricular contractions. The mission<br />
Commander experienced four premature ventricular contractions during a sleep<br />
period on the morning of reentry when a heart rate of only 28 beats per minute<br />
was recorded. This was followed by additional premature auricular contractions<br />
and occasional premature ventricular contractions which lasted for about one<br />
hour. ttowever, neither crewmember exhibited any evidence of arrhythmia upon<br />
postflight examination (Berry, 1972). Extrasystoles had been noted during prior<br />
United States and Soviet space missions but these occurred rarely and no<br />
individual experienced more than an occasional arrhythmia (Berry, 1967;<br />
Akulinichev et al., 1964; Yazdovskiy & Denisov, 1963). Postflight examinations<br />
of the Apollo 15 crew revealed potassium deficits which were linked to the<br />
irregular heartbeats. Supplementary dietary potassium and less strenuous work<br />
schedules eliminated this problem for the Apollo 16 crew (Berry, 1972).<br />
• Heart Size. During the Vostok flights, increases were noted in electromechanical<br />
delay (Bayevskiy & Gazenko, 1964), while electric and mechanical<br />
systole in tt_e Soyuz crews showed no significant difference from preflight<br />
baselines inflight (Kakurin, 1971). This parameter has not been measured<br />
inflight for U.S. crews. Study of pre- and postflight posterior/anterior chest films<br />
from all U.S. flights reveal a decreased cardiac size postflight. Specific studies in<br />
Apollo t6 correlating several X-ray views taken at the same time in cardiac cycle,<br />
systole or diastole, revealed an apparent decrease in the cardiac silhouette.<br />
• Blood Pressure Measurements. Blood pressure recordings, including<br />
those taken at reentry, indicate that systolic and diastolic pressures have<br />
remained within the envelope of normality (Berry, 1967a). Soviet experience<br />
(Volynkin & Vasil'yev, 1969) indicates a definite overall decrease in pulse<br />
pressure under the conditions of weightlessness. Pulse pressures following Apollo<br />
flights have been found to be quite labile for up to 3 days postflight (Berry,<br />
1970).
Weightlessnesss 375<br />
• Orthostatic Tolerance. Significantly reduced orthostatic tolerance,<br />
evidencing cardiovascular deconditioning, to the one g environment has been<br />
observed in every United States space mission since the last two Mercury flights.<br />
Soviet investigators have also reported the phenomenon in their Voskhod and<br />
Soyuz missions (Petukhov et al., 1970; Volynkin & Vasil'yev, 1969; Kakurin,<br />
1971). While there were no noticeable changes in any of the recorded parameters<br />
after 2-day flights, all the cosmonauts showed signs of orthostatic instability<br />
after 3-to 5-day flights (Kakurin, 1971).<br />
In order to reveal the full extent of cardiovascular deconditioning to 1 g or<br />
conditioning to 0 g, several types of postflight cardiovascular provocation are<br />
employed while various indicators are monitored. The point of provocative<br />
testing is that it often reveals changes otherwise undetectable in resting<br />
individuals because compensatory mechanisms may mask any sign of<br />
physiological decrement. Gemini astronauts, for example, showed no signs of<br />
orthostatic hypotension prior to provocative testing. The methods employed<br />
have included the application of lower body negative pressure and passive<br />
orthostatic tests. In the U.S. static stand procedure, the subject demonstrates<br />
stable heart rate and blood pressure in the resting, supine position for 5 minutes,<br />
after which he is assisted to a standing position with minimum delay and<br />
movement. He remains motionless in tile upright position for 5 minutes while<br />
heart rate and blood pressure are again recorded each minute. The Soviet<br />
procedure involves 10 minutes of tilting in a rotating chair to a vertical position<br />
(88 °) after the subject has rested in a supine position for at least 20 minutes,<br />
while hemodynamic, gas exchange and respiration measures are made.<br />
Space crews have required, at the longest, 13 days postflight to reach<br />
preflight baselines. The Soyuz 9 and Apollo 15 crews' recoveries were markedly<br />
slower than those of previous Apollo crews who reached preflight levels within<br />
3 days after space flight.<br />
Whatever the factors causing orthostatic intolerance, heart rate remains the<br />
most sensitive index (Berry, 1970). Postflight heart rate increases during tilt<br />
table testing for Gemini crewmen were 17 to 105 percent greater than those<br />
exhibited preflight. In the Apollo series, 90 ° passive standing revealed<br />
significantly elevated pulse rates in all crewmembers tested. Figure 8-1 indicates<br />
representative heart rate changes.<br />
Blood pressure, on the other hand, has not proved to be a consistently<br />
reliable index of deconditioning. Decreased pulse pressure has been noted in<br />
15 of 21 Apollo crewmembers tested postflight (Rummel et al., 1972).<br />
Hematological Profile. The folowing paragraphs describe all blood<br />
changes for United States rmsslons to date. It should be noted that these changes<br />
were completely reversible.<br />
• Plasma Volume. Plasma volume changes associated with weightlessness<br />
have been variable in direction and temporary, not lasting more than 10 days.<br />
This is strikingly different from results of bed rest studies, in which decreases<br />
continue for several weeks. Table 8-2 summarizes individual findings. A later
376 Bioastronautics Data Book<br />
i<br />
m<br />
e.,<br />
F_<br />
120<br />
110<br />
100<br />
90<br />
80<br />
70<br />
60<br />
50<br />
6_ HOURSPOSTFLIGHT_ I I<br />
/<br />
/<br />
X x/X x<br />
/<br />
X_ _X_x/ // •<br />
_X_x/•__ /I'" PREFLIGHTMEAN<br />
I<br />
SUPINE " I "_ 90 ° STAND<br />
I 1 j I I I 1 1 1<br />
1 2 3 4 5 6 7 8 9<br />
TIME (MINUTES)<br />
Figure 8-1. Representative changes of heart rate during 90 ° passive<br />
standing preflight and postflight (Berry, 1970)<br />
discussion concerning endocrine and electrolyte response to weightless space<br />
flight presents an explanation of this phenomenon.*<br />
• Red Blood Cell Mass. Hematological changes have been compared in<br />
three Gemini crews (4,5,and7) and the crews of Apollo missions<br />
7, 8, 9, 14, and 15 by Johnson & Driscoll (1972). When tile Gemini crews were<br />
compared with the Apollo crews on missions which did and did not employ the<br />
lunar module, a statistically significant difference was noted in the percent<br />
change of red blood cell mass (using 51Cr) among the groups; no such change<br />
was seen in controls. These results are indicated in table 8-4. No difference was<br />
found in the mean survival time of red blood cells, and no difference was found<br />
between the two types of Apollo missions compared.<br />
Blood studies of Soyuz 9 cosmonauts indicated increased hemoglobin 1.5 to<br />
2 hours postflight (Molchanov et al., 1970).<br />
Table 8-4<br />
Red Cell Mass Percent Change<br />
(Premission vs Immediately Postmission)<br />
GEMINI APOLLO & LM APOLLO<br />
Crew 15.6 +2.3 7.4 +1.2 -2.4 -+1.6<br />
Controls -1.1 -+1.0 +0.1 -+1.6<br />
(From Johnson & Driscoll, 1972)<br />
*Plasma volume decreases are suggested hi the Soyuz crew by increases in hemoglobin and<br />
red blood cell mass postfl,.'ght (Kakurin, 1971.)<br />
10
Weightlessness 377<br />
• White Blood Cells. Net increases in the number of white blood cells were<br />
consistently noted in Gemini missions and continued to occur during Apollo<br />
missions. Similar changes have been reported for Soviet cosmonauts (Molchanov<br />
ct al., 1970). Soyuz9 results showed thrombocytopenia for two weeks<br />
postflight. Although other leucocytes have decreased in number, substantially<br />
elevated neutrophil counts account for the net increase (Berry et al.,<br />
1966; 1970). Table 8-5 summarizes changes in hematological responses for the<br />
Apollo 7 througtl 11 missions.<br />
Parameter<br />
Red blood cells<br />
Hematocrit<br />
Hemoglobin<br />
Reuculocytes<br />
White blood cells<br />
Platelets<br />
LEGEND:<br />
NeutrophHs<br />
Lyrnphocytes<br />
Monocyles<br />
Eosinophils<br />
Basophils<br />
0 No occurrence<br />
_t Significant trend (negative)<br />
VV -20<br />
VVV -30<br />
AA +30<br />
AA A +30"<br />
Table 8-5<br />
Apollo Blood Profile Summary<br />
Apollo 7 Apollo 8<br />
o AA<br />
o AA<br />
o AA<br />
0 0<br />
AAb, AAA<br />
AA AA<br />
VV VV<br />
o VV<br />
Mission<br />
Apollo 9 Apollo 10<br />
VV AA<br />
o AA<br />
AA o 0<br />
o AA<br />
o AAA<br />
o VV<br />
0 0<br />
VV<br />
VV<br />
Apollo 11 Overall<br />
0 0<br />
0 0<br />
0<br />
0<br />
AAA AAA<br />
AAA AA<br />
VV VV<br />
VV VV<br />
VV V<br />
0 0 0 0<br />
0 0<br />
Simulation Studies. As early as 1948, Deitrick, Whedon, and Shorr noted<br />
that hypodynamia, produced by bed rest and standardized by cast immobilization<br />
of the pelvic girdle and legs, brought about a definite deterioration in the<br />
mechanisms essential for adequate circulation in the erect position. Figure 8-2<br />
shows the percentage change from resting levels of pulse rate and pulse pressure<br />
for their subjects during tilt table testing. Increases in pulse rate and decreases in<br />
pulse pressure of 40 to 70 percent were noted prior to immobilization. During<br />
immobilization, thesc changes exceed 70 percent. Syncope was also common.<br />
4n7-_58 (_ 73 2 _,<br />
0
378 Bioastronautics Data Book<br />
CONTROL BED REST RECOVERY<br />
% PULSE RATE<br />
_,_ _._ % PULSE PRES-<br />
% 70 iI_" - _ _ _ SURE DECREASE<br />
901 E.M jp_,_ _ _NCRE ASE<br />
_ x x _ x _ 2O2O 10 I_ xx _x_ x _<br />
MINUTES AFTER T_LT_NG TO FAINTING<br />
% 9O 70 l "_CO<br />
50<br />
._<br />
% 70_<br />
90 A S<br />
22<br />
MtNUTES TO FAtNT<br />
i • , , , 6 13' 19'<br />
WEEKS<br />
X - OlD NOT FAINT e = ABDOMEN BOUND +- LEGS SOUND WITH<br />
W4TH ACE BANDAGES ACE BANDAGES<br />
Figure 8-2. Effect of immobilization on the responses of pulse rate and pulse pressure to<br />
tilting to 65 degrees feet downward for twenty minutes in four normal male subjects. (From<br />
Deitrick, Whedon, & Short, 1948)<br />
To examine to what extent bed rest parallels weightlessness, the flight data<br />
obtained during the Gemini mission series were compared with data from bed<br />
rest studies of equal duration. Figure 8-3 shows resting heart rate changes<br />
(expressed as a percentage of preexposure values) for each. Although the two<br />
conditions show very similar trends, the magnitude of change is markedly<br />
different. This, perhaps, indicates that factors other than those simulated hy bed<br />
rest are involved in the changes in heart rate noted after exposure to<br />
weightlessness.<br />
Conclusions. Cardiovascular deconditioning, as evidenced by diminished<br />
orthostatic tolerance, is the most consistently observed and most profound of<br />
the effects upon the cardiovascular system following exposure to up to 18 days<br />
of weightless space flight. This condition is reversible and appears to have no<br />
serious lasting implications. Rare irregularities have been noted in the electrical<br />
activity of the heart. These appear to be controllable through maintenance of<br />
electrolyte balance. An apparent decrease in cardiac silhouette postflight has<br />
been consistently observed in U.S. flights.<br />
The factors accounting for deconditioning of the cardiovascular system are<br />
not yet clear. Soviet investigations (Volynkin & Vasil'yev, 1969) suggest that<br />
relative hypodynamia and, possibly, physical fatigue observed inflight are related<br />
and that these together might be responsible for decrease in myocardial<br />
contractility., a breakdown of the mechanisms regulating coordinated activity of
HEART RATE<br />
CHANGE DURING<br />
INITIAL POST-<br />
FLIGHT TILT AS<br />
% OF PREFLIGHT<br />
VALUE<br />
PERCENT<br />
CHANGE<br />
140<br />
120<br />
I00<br />
80<br />
60<br />
40<br />
20<br />
rl<br />
Weightlessness 379<br />
13Z<br />
0 2 4<br />
5_<br />
! I<br />
6 8 10<br />
DAYS<br />
[] GEMINI FLIGHT<br />
DATA<br />
[] BED REST DATA<br />
12 14 16<br />
Figure 8-3. Gemini missions and bed rest; resting pulse rate change vs. time.<br />
the heart and vessels, and a decrease in venous tone. Fatigue has not been a<br />
feature of any significance during United States missions except when<br />
inadequate rest had been obtained or when heavy workloads were imposed on<br />
the lunar surface. Weightlessness per se appeared to reduce rather than increase<br />
fatigue, since movement seems to require much less work in weightlessness than<br />
in the unit gravity environment (Berry, 1970).<br />
Examination of endocrine and electrolyte data offers clues to the nature of<br />
the changes that present as orthostatic intolerance postflight. An hypothesis as<br />
to tile mechanisms involved is pre_nted later in this chapter ill conjunction with<br />
the discussion of endocrine and electrolyte responses to space flight.<br />
Red blood cell mass decreases which have been noted may be explained by<br />
one important difference among missions: the amount of residual nitrogen in<br />
the space cabin atmosphere. Iiyperbaric oxygen (at 2 atmospheres or greater) is<br />
known to have a hemolytic effect. Conclusive data are not available for<br />
atmospheres of 100 percent oxygen delivered at 5 psi. A normal 51Cr red blood<br />
cell half time indicates that hemolysis did not occur in the Apollo program. The<br />
decrease in red blood cell mass noted in the absence of external bleeding suggests<br />
that the probable cause for the decrease is inhibited erythropoiesis (Johnson &<br />
Driscoll, 1972, cited in Berry, 1972).<br />
The only persistent hematological change, transient increases in the white<br />
blood cell count, is probably a consequence of increased blood epinephrine and<br />
steroid levels associated with mission stre_ and is reversible by two days<br />
postflight.
38O Bioastronautics Data Book<br />
Work Capacity (Exercise Tolerance)<br />
In assessing the physiological cost of manned space flight, it is essential to<br />
determine to what extent the many factors inherent in the weightless<br />
environment affect the capability to do physical work. This capacity can be an<br />
index of cardiopulmonary function. Significant deterioration in physical work<br />
capacity is a phenomenon noted in individuals subjected to bed rest. For this<br />
reason, exercise capacity tests are routinely performed before and after space<br />
flights. For the most part, work capacity tests have employed an electronic<br />
bicycle ergometer capable of producing a fixed workload. The load is increased<br />
in regular increments until elevated heart rates, usually 160 or 180 beats per<br />
minute, are reached. Oxygen uptake per kilogram of body weight and systolic<br />
blood pressure serve as the indices, with oxygen consumption the more reliable<br />
of the two. Cardiac output has also been estimated indirectly by the single<br />
breath method requiring instantaneous gas composition and oxygen<br />
consumption data.<br />
Space Flight Results. A reduction in work capacity has been noted in both<br />
Gemini and Apollo crews. In Gemini 7 work capacity was reduced 19 percent in<br />
the Command Pilot and 26 percent in the Pilot. Twenty-five of 30 Apollo<br />
astronauts tested have shown a significant decrease in exercise tolerance<br />
postflight. Table 8-6 shows typical results, in this case for the Apollo 14 crew. In<br />
general, preflight levels have been reattained within 24 to 48 hours postflight.<br />
The single exception to this rule was the Apollo 15 crew. In this crew, preflight<br />
exercise capacity was not reached in the Command Module Pilot until 3 to<br />
5 days postflight; in the Lunar Module Pilot, until 9 days postflight; and in the<br />
Commander, until 13 days postflight. Exercise tolerance was reduced in the<br />
Apollo 15 crew by about 44 percent compared with a deficit of 20 percent in<br />
the Apollo 16 crew.<br />
CDR<br />
LMP<br />
CMP<br />
Table 8-6<br />
Work Capacity Indicators for Apollo 14 Crew<br />
02 Consumption/ SystolicBlood<br />
160 H.R. Pressure/160H. R.<br />
Preflight 2.40 I/rain. 233 mm Hg<br />
R + 0 2.48 238<br />
Preflight 3.05 225<br />
R + 0 2.86 207<br />
Preflight<br />
R+O<br />
= statistically significant decrease,<br />
(Barry, 1971)<br />
2.40 216<br />
1.81 _ 156 t
Weightlessness 381<br />
In conducting a functional test consisting of 30 knee bends during the day<br />
after the Voskhod 1 mission (Volynkin & Vasil'yev, 1969), all Soviet<br />
cosmonauts showed a greater increase in pulse rate than they did during the<br />
preflight period. Soyuz cosmonauts in all flights beyond 5 days' duration<br />
exhibited decreased work capacity. In the Soyuz 9 crew, this was ascertained by<br />
examination of postflight gas-energy exchange determined by the method of<br />
Douglas and Hoiden and by minute volume determinations (using the Fick<br />
method), as well as by bicycle ergometry (Kakurin, 1971).<br />
Conclusions. Significant decrements have been noted in work capacity after<br />
space flight. The physiologic mechanisms responsible for the changes observed<br />
remain to be identified through further investigation. Hypokinesia leading to<br />
decreased muscle tone appears, from Soviet findings, to play a part.<br />
Supplementary U.S. data indicate that work performance decrements are not<br />
due to altered pulmonary function or to dinfinished ability to extract oxygen<br />
from the atmosphere (Berry, 1970). It is more likely that these changes are in<br />
some way associated with cardiovascular deconditioning. To elucidate further<br />
the physiological mechanisms underlying the reduction in work capacity, cardiac<br />
output assessments are being made to determine whether a decrease in peripheral<br />
resistance plays a part. Increases in cardiac output for given oxygen consumption<br />
levels were noted in crewmen of Apollos 14 and 15 but not in Apollo 16. No<br />
change in peripheral resistance was indicated in Apollo 16 results, and thus the<br />
mechanisms still await further study.<br />
Respiratory Responses<br />
The aspects of respiratory function which have been of concern with relation<br />
to prolonged weightless space flight include changes in lung volume and airway<br />
conductance, and the possibility and consequences of atdectasis.<br />
Hypothetically, pulmonary circulation and pulmonary gas diffusion might also<br />
he affected. In an extensive review of respiratory physiology in the space<br />
environment published in advance of the Apollo missions, the National Academy<br />
of Sciences (1967) expressed the opinion that none of these would pose<br />
problems of any real consequence.<br />
Space Flight Results. Pulmonary function in weightlessness appears<br />
completely unimpaired. Pre- and postflight X-rays during the Gemini mission<br />
series have failed to reveal any evidence of atclcctasis. Peak respiratory rates<br />
were noted during heavy workloads, but even when these rates have exceeded<br />
40 breaths per minute, they have not been accompanied by symptomatology<br />
(Berry, 1967a). No respiratory problems were noted during lunar surface activity<br />
and Apollo pre- and postflight X-rays have shown no atelectasis.<br />
During the Soviet Voskhod I and 2 missions, somewhat higher respiratory<br />
rates were noted, as was also the case during preparation for and conduct of the<br />
Soyuz spacewalk (Kakurin, 1971).<br />
Conclusions. The weightless environment appears to have no significant<br />
impact upon either respiratory mechanics or lung structure. Inflight pulmonary<br />
function evaluation in Skylab should further clarify pulmonary status in<br />
weightlessness.
382 Bioastroanutics Data Book<br />
Skeletal Responses<br />
Gravity and countergravitational muscular effort are important for the<br />
maintenance of skeletal strength. In zero or reduced gravity conditions,<br />
elimination or reduction of mechanical forces such as those produced by weight<br />
bearing and muscle tension can result in the loss of calcium, and other related<br />
elements, from the bones. If such losses were to continue unabated over a long<br />
period of time, it is conceivable that demineralization, leading to loss of skeletal<br />
strength, could ultimately occur. A 1 to 2 percent per month figure has been<br />
predicted as reasonable for the rate of bone loss for persons in the weightless<br />
state (Hattner & McMillan, 1968). It is possible, on the other hand, that<br />
stabilization may occur at some point in time. Calcium balance does, for<br />
example, appear to normalize after some years in paralyzed patient-subjects<br />
(Heaney, 1962).<br />
Space Flight Results. To minimize both muscle and skeletal deterioration<br />
during weightlessness, rigorous exercise routines have been adhered to by United<br />
States astronauts and Soviet cosmonauts. During the 18-day Soyuz 9 flight,<br />
cosmonauts exercised twice daily, for 120 minutes a day. Rubber bungec cords<br />
attached to tile cosmonauts' suits at one end and to the floor at the other<br />
provided for increased load during simulated walking and running exercises. The<br />
cosmonauts reported a feeling of "muscular exhilaration" after exercise which<br />
lasted for the entire work day (Vorob'yev et al., 1970). Similar, but less<br />
extensive, exercise routines were followed by United States astronauts. Despite<br />
tiffs regimen, both groups experienced loss of bone mass.<br />
Lo_es in bone mass were observed in the Gemini and Apollo missions. These<br />
were directly demonstrable using a bone densitometric X-ray technique.<br />
Tables 8-7 and 8-8 indicate bone density changes for the Gemini 7 crew and the<br />
Apollo 7 and 8 crews, respectively. When compared with changes observed<br />
during bed rest studies, calcium losses for Gemini 7 crewmen were far lower than<br />
for Gemini 4 and 5 crewmen. This is illustrated graphically in the case of heel<br />
bone density in figure 8-4. The figure also indicates the realtive calcium intake in<br />
each nffssion. In addition to receiving supplementary calcium (approaching<br />
1000 milligrams per day), the Gemini 7 crew routinely exercised.<br />
Although loss of bone density varies considerably from site to site and in<br />
individuals, none of the losses noted in either the Gemini 7 or the Apollo 7 and<br />
8 missions approached the maximum 20 percent loss noted in the calcanei and<br />
metacarpals of the Command Pilot and Pilot of the Gemini 5 voyage (Mack &<br />
LaChance, 1966).<br />
In contrast to earlier finding, Apollo 14 bone mineral content<br />
determinations did not reveal bone demineralization. Pre- and postflight<br />
examinations of the left central os calcis and the right distal radius and ulna by<br />
means of a monoenergetic photon absorption technique revealed no significant<br />
mineral losses during the 10-day mission.<br />
Optical density studies of bone tissue of Soyuz 9 cosmonauts after their<br />
18-day flight rew_aled effects similar to those seen for Genfini and Apollo crews
Weightlessness<br />
Table 8-7<br />
Bone I)ensity Changes in Gemini 7<br />
(Percentage Decrease)<br />
Conventional os calcis scanning section<br />
Overall os calcis involving multiple<br />
traces over 60% of bone<br />
Section through distal end of talus<br />
Multiple traces covering hand<br />
phalanx 4-2<br />
Multiple traces covering hand<br />
phalanx 5-2<br />
Greatest change in any section of<br />
os calcis<br />
Greatest change in hand phalanx 4-2<br />
Greatest change in hand phalanx 5-2<br />
(Mack, Vogt, & LaChance, 1966)<br />
Skeletal Sites<br />
Os calcis<br />
Hand phalanx<br />
4--2<br />
Hand phalanx<br />
5--2<br />
Capit_te<br />
Distal radius<br />
Distal ulna<br />
Table 8 8<br />
Bone Density Changes in Apollo 7 and 8<br />
Command Pilot Pilot<br />
- 2.91 - 2.84<br />
- 2.46 - 2.54<br />
- 7.06 - 4.00<br />
- 6.55 - 3.82<br />
- 6.78 - 7.83<br />
- 5.17 - 7.66<br />
- 9.11 - 8.00<br />
-12.07 -14.86<br />
Individual Crewman Percentage Change During Flight<br />
-5.35<br />
4.07<br />
9.30<br />
--3.25<br />
-3.02<br />
Apollo 7<br />
40.74<br />
+2,04<br />
+3.31<br />
+3.34<br />
+2.12<br />
+2.27<br />
--6.50<br />
--3.44<br />
-3.64<br />
-3.41<br />
--2.1 3<br />
--2.19<br />
--2.07<br />
--9,60<br />
--8.76<br />
--6.42<br />
Apollo 8<br />
- 6.95<br />
-- 2.41<br />
--3,09<br />
-1 2.11<br />
- 11.06<br />
--12.41<br />
-- 2.93<br />
+4.81<br />
-- 1,00<br />
- 6.65<br />
--11.39<br />
--16.17<br />
383
384 Bioastronautics Data Book<br />
W<br />
z<br />
<<br />
I<br />
o<br />
--16<br />
GEMINI<br />
4 DAYS<br />
600 TO 700<br />
mg Ca<br />
8 DAYS<br />
300<br />
mg Ca<br />
[] COMMAND PILOT<br />
[] PI LOT<br />
[] BED REST SUBJECT<br />
vii<br />
14 DAYS<br />
1000<br />
rng Ca<br />
Figure 8-4. Loss of os calcis density on Gemini 4, 5, and 7 missions.<br />
examined by application of the same technique. Table 8-9 summarizes these<br />
findings. During the postflight period, optical density levels increased, but by<br />
50-days postflight the initial status of the bone tissue had not yet been restored.<br />
The decreases in optical densi_ noted compared to levels characteristic of 62 to<br />
72 days of bedrest confinement. Biryukov and Krasnykh (1970) note that since<br />
these decreases ill optical density were less than those found in the same bones<br />
for the Gemini crewmembers and ahnost equalled tile decreases observed duriltg<br />
the 4-day Soyuz 3 flight, some positive effect may have been associated with the<br />
use of the inflight exercise routine. The differences between the findings for<br />
each of the cosmonauts are thought to be attributable to age and the differences<br />
in tile nature of the exercise loads performed by each.<br />
Mineral balance studies conducted during tile Gemini 7 mission (Berry,<br />
1967a) indicate a slightly negative calcium balance. Soviet investigators report<br />
similar findings (Fedorova et al., 1964). Although no overall changes in calcium<br />
or magnesium levels have been found, there have been individual instances of<br />
clcvated urinary calcium and magnesium.<br />
A less equivocal picture of dcmineralization has been providcd by an<br />
exanfination of plasma and urinary hydroxyproline levels. Large amounts of<br />
hydroxyproline arc present in collagen, which is found in connective tissue and<br />
bone. An increased excretion of this substance, it was reasoned, might<br />
accompany demineralization and dissolution of bone matrix (Berry, 1967a).<br />
Bioassay revealed that bound plasma hydroxyproline levels immediately<br />
following the 14-day Gemini mission were elevated, while larger quantities of<br />
calcium were excreted later in the flight than during the early phases. Similar<br />
changes were noted after the Apollo 8 mission.
Weightlessness<br />
Table 8-9<br />
Change in Optical Density of X-Ray Image of Bone Tissue<br />
Investigated Parts<br />
Bone<br />
(In Percent of Initial Level) Postflight (Soyuz 9)<br />
2 phalanx (finger)<br />
3 "<br />
4 "<br />
5 "<br />
Heel bone<br />
(Biryukov & Krasnykh, 1970)<br />
A. G. Nikolayev V.I. Sevast'yenov<br />
Period of Investigatlion<br />
Day 2 Day 22 Day 2 Day 22<br />
--5.0<br />
--3.1<br />
-_1.7<br />
-8.5<br />
Biochemical confirmation for bone demineralization, and partial restoration,<br />
was also found for Soyuz 9 cosmonauts. Figure 8-5 indicates urinary calcium<br />
excretion on the last day of flight exceeded the first day's level by 29 to<br />
60 percent. During the postflight period, however, calcium excretion in the urine<br />
decreased until preflight levels were reached.<br />
mg/da,<br />
400<br />
300<br />
200<br />
01<br />
BEFORE<br />
FLIGHT<br />
ORBITAL<br />
FLIGHT<br />
-2.5<br />
4- 0<br />
--1.6<br />
--4.5<br />
i!!!!<br />
!i!ii<br />
--4.1<br />
-5.0<br />
--4.3<br />
--8.9<br />
--9.6<br />
AFTER<br />
FLIGHT<br />
r--t tt_l r_t_t I"'1 g:r:rl I I-"1_ _1_<br />
1 2<br />
18 1 2 3<br />
DAYS<br />
....,<br />
I<br />
f<br />
J<br />
I<br />
-I<br />
iii!i<br />
Figure 8-5. Renal excretion of calcium for Soyuz 9 cosmonauts. White bars---calcium<br />
excretion for A.G. Nikolayev; shaded bars .... for V.I. Sevast'yanov. (Biryukov &<br />
Krasnykh, 1970)<br />
,.:.;<br />
::'.::<br />
;';C<br />
I<br />
I<br />
I<br />
I<br />
I<br />
I<br />
4-0<br />
--5.0<br />
--1.4<br />
4.4<br />
-3.4<br />
385
386 Bioastronautics Data Book<br />
Simulation Results. A number of studies (cited in Hattner & McMillan,<br />
1968) indicate that normal, immobilized humans have shown unabated negative<br />
calcium balance. Deitrick, Whedon, and Shorr (1948) have demonstrated a net<br />
calcium loss of up to 2 percent in healthy subjects immobilized in plaster casts<br />
for up to 6 weeks. Their subjects also showed increased excretions of<br />
phosphorus, sodium, and nitrogen. All of the changes noted were reversible<br />
within about 6 weeks postexposure.<br />
In a more recent study (Donaldson et al., 1969) of longer duration than most<br />
previously reported, subjects were confined to bed for periods of 30 to<br />
36 weeks. A regime of supine exercise failed to prevent negative mineral balance.<br />
Space flight effects on bone tissue have been more severe than those changes<br />
produced by equal periods of bedrest.<br />
Conclusions. Overall, bone density has been minimally reduced after space<br />
flight. The reason for the divergence of results is unclear. Mineral balance data<br />
have shown a negative balance trend indicative of calcium loss from tile bones.<br />
Further, although no overall changes in calcium or magnesium levels have been<br />
noted, there have been instances of elevated urinary calcium and magnesium. In<br />
addition, elevated bound plasma hydroxyproline levels immediately following<br />
the 14-day Gemini mission are consistent with resorptive 'changes in bone<br />
matrix. Subsequent mission data will be needed to clarify the reason for the<br />
disparity in bone mineral data; it may be simply a matter of altered technique<br />
(Berry, 1971a).<br />
One final point regarding reduced bone mineral content should be made.<br />
Although functional underloading of skeletal muscle and the decrease in energy<br />
expended during muscular work in the weightless state are undoubtedly closely<br />
linked to skeletal muscle changes, other possibilities must be taken into account.<br />
Biryukov and Krasnykh (1970) suggest that "calcium metabolic mechanisms<br />
associated with general impairment in regulatory processes under the influence<br />
of space flight stress may be involved." These might include the endocrine<br />
mechanisms responsible for regulating the general metabolism of the body. It is<br />
possible, for example, that calcium ions are mobilized from the bone cation pool<br />
in order to correct the electrolyte balance changes occurring in weightlessness.<br />
Changes in parathormone and calcitonin levels will be investigated in subsequent<br />
missions to further clarify the mechanisms of mineral loss from the bones<br />
(Berry, 1971a).<br />
Neuromuscular Changes<br />
Muscle structure, like bone structure, can reasonably be expected to<br />
deteriorate in the absence of gravity and counter-gravitational effort. Deitrick,<br />
Whedon and Shorr (1948) noted increased urinary nitrogen excretion and<br />
muscle atrophy from 2 to 12.5 percent in the arms and thighs of their bed rested<br />
subjects. Because it was an area likely to manifest effects, the neuromuscular<br />
system has been examined closely after all manned space flights.<br />
Space Fl_,ht Results. Fourteen days of exposure to weightlessness did not<br />
cause muscle atrophy or any impairment in coordination (Berry, 1967b).
Weightlessness 387<br />
Mineralbalancestudiesfor astronauts exposed to twoweeksof spaceflight,<br />
however, indicatedslightlynegativenitrogenbalances whichpersisted postflight<br />
despiteincreased dietarynitrogenintake(Berry,1967a). After18daysofspace<br />
flight,however, the picturechangedradically.Uponreturnto Earth,the<br />
Soyuz9cosmonauts exhibitedextremechanges in the motorsphere. They<br />
reportedthattheirlimbsfeltunusually heavyandtheyha difficultywalkingand<br />
liftingobjects.Whenin theproneposition,theysensed"beingpressed" into<br />
theirbeds.Onthesecondto thefifth daypostflight,musclepainwasreported.<br />
Muscletoneandstrength, aswellasthecircumference of thelowerextremities<br />
werediminished. Reflexexcitabilityof theneuromuscular system, determined<br />
byrecording thebioelectric activityof muscles duringkneetendonreflexes, was<br />
increased.<br />
Conclusions. Cherepakhin and Pervushin (I970) surmised that the principal<br />
cause of decrease in muscle tone during 18 days of space flight is weightlessness<br />
per se, since this condition makes it unnecessary to maintain posture, and, as a<br />
result, the tonic stress of the muscle tissue through application of effort. This,<br />
they feel, is confirmed by the fact that muscle groups subjected to a lesser load<br />
showed the highest degree of change. Since neuromuscular tone plays an<br />
important part in regulating many body functions, these authors conclude,<br />
deterioration of tone following exposure to weightlessness plays an important<br />
part in determining the characteristics of the readaptation period. Apparently,<br />
too, the longer the space flight the more stressful will be the adaptation to<br />
Earth's gravity. Exercise is undoubtedly helpful, but other techniques, for<br />
example preventive medications may, these authors suggest, have to be explored.<br />
Vestibular Responses<br />
Information related to body orientation is relayed to the brain via<br />
innervation from two structures in the inner ear: the semicircular canals and<br />
the otohth apparatus. The semicircular canals respond to angular accelerations,<br />
and the otoliths to linear acceleration. In the absence of gravitational<br />
force, there is "physiological deafferentation" of the otolith apparatus, but<br />
no corresponding dramatic effect on the semicircular canals. Movements of<br />
the head will, in weightlessness as in unit gravity, generate angular accelerations<br />
sufficient to stimulate the canals. However, the linear accelerations<br />
caused by head movement and occasional changes in spacecraft velocity and<br />
attitude might not, it was feared, provide sufficient stimulation for the<br />
otoliths under extended 0 g (Graybiel et al., 1967). In fact, there was some<br />
question'as to whether otolithic stimulation would be adequate to provide<br />
an appropriate cue concerning the upright of the spacecraft. There is much<br />
evidence to indicate that visual cues compensate for vestibular and kinesthetic<br />
cues that normally contribute to orientation. Moreover, disorientation rarely<br />
occurs without reduction in vision (Clark & Graybiel, 1955), and this does not<br />
occur in space. On the other hand, the relationship between the gravity<br />
dependent vestibular apparatus and motion sickness is well established. In view<br />
of these considerations, close attention has been paid to the function of the<br />
vestibular apparatus in weightless space flight.
388 Bioastronautics DataBook<br />
Space Flight Results. In the Gemini mission series, no disorientation was<br />
noted. Crews adjusted easily to the weightless environment and did not observe<br />
aberrant sensations during head movements. Visual orientation was achieved<br />
with reference to the spacecraft interior and to the Earth. During extravehicular<br />
activity, the sky and Earth provided reference points. There were no instances of<br />
motion sickness. Apollo crewmen, however, experienced motion sickness<br />
symptoms which ranged from mild stomach awareness to nausea and vomiting.<br />
Symptoms lasted from 2 hours to 5 days, after which time adaptation occurred<br />
(Berry, 1970). Orientation illusions have also been reported. These symptoms,<br />
along with the history of motion sickness for Apollo crewmembers, are listed in<br />
table8-10. It should be noted, howcver, that despite the reported symptoms,<br />
specific tests for alteration of vestibular function have been negative (Berry, in<br />
press; Graybiel et al., 1967).<br />
Vestibular and vestibular-related aberrations in Soviet cosmonauts have been<br />
reported to occur with greater frequency than for United States astronauts.<br />
"Space sickness," characterized by a decrease of appetite followed by nausea,<br />
has been reported for nearly every Vostok and Voskhod mission (Volynkin &<br />
Vasil'yev, 1969, Yuganov, 1964). Illusions of inverted position have also been<br />
noted (Volynkin & Vas_i'yev, 1969). These were said to affect cosmonauts when<br />
Table 8-10<br />
Illusions and Motion Sickness Symptoms Experienced by Apollo Astronauts<br />
Aission Astronaut<br />
1t<br />
13<br />
14<br />
15<br />
A X<br />
Motion Sickness History<br />
In Land, Air In Zero-G<br />
and Sea Vehicles Parabola<br />
B X X<br />
C X<br />
D X<br />
E X X<br />
F X X<br />
G<br />
In StC Egress Tumbting<br />
or Egres_ Training Illusions<br />
X<br />
X X<br />
H X X<br />
I X X X<br />
J X<br />
K X<br />
L X<br />
N X X X<br />
0 .X._ X<br />
X<br />
*Concomitant illness.<br />
(Adapted from Berry, in press)<br />
X<br />
×<br />
X<br />
!<br />
X<br />
Illusions/Motion Sickness<br />
Symptoms in Space Flight<br />
Stomach<br />
Awareness Nausea<br />
X x<br />
x X<br />
X<br />
X<br />
X X<br />
X<br />
X X<br />
X<br />
X<br />
i i<br />
Vomiting<br />
X"
Weightlessness 389<br />
their eyes were both open and closed and reportedly lasted for the duration of<br />
the effect of weightlessness, disappearing completely only with the onset of<br />
reentry accelerations. Changes in the function of ti_e vestibular apparatus are<br />
thought to be implicated.<br />
Electrooculograms recorded during the flights of Vostok 3 and 4, sometimes<br />
simultaneou_y with the administration of special tests, revealed no asymmetry<br />
of oculomotor reactions or nystagmus (Akulinichev et ai., 1964). The otolith<br />
apparatus' threshold of sensitivity to galvanic current, examined after the flight<br />
of Voskhod 1 (Volynkin & Vasil'yev, 1969) was unchanged.<br />
Soyuz 9 crewmembers reported some Coriolis-like sensations in the earlier<br />
portion of their flight which disappeared after the normal adaptation period<br />
(third to fifth day). They found, as did Apollo astronauts, that taking care to<br />
make no abrupt hcad movements during this period lessened symptoms. Analysis<br />
of the writing of vertical letters inflight, a test of vestibular function, revealed<br />
the magnitude of slope angles to be increased threefold over groundbased<br />
baselines, indicatiltg an increase in reactivity of the cupuloendolymphatic system<br />
of the vestibular analyzer to Coriolis acceleration under weightless conditions<br />
(Kakurin, 1971). Postflight, increases were noted in the indices of general center<br />
of _avity (GCG) oscillations and the frequency of cardiac contractions when the<br />
eyes were closed (Petukhov et al., 1970; Kakurin, 1971).<br />
No perceptual-motor impairment has been observed in conjunction with U.S.<br />
space flight. Soviet investigators have noted some changes. During the<br />
Voskhod 1 mission, the accuracy of carrying out slight coordinated movements<br />
was found to decrease (Volynkin & Vasil'yev, 1969), and in the Soyuz 3 flight, a<br />
subjective increase was reported in the pause between the decision to perform a<br />
motor activity and the act itself (Kakurin, 1971).<br />
Conclusion. Both Apollo astronauts and Soyuz cosmonauts have reported<br />
sensations resembling sea sickness during spaceflight. On the whole, however,<br />
U.S. astronauts do not appear to be excessively plagued by motion sickness<br />
symptoms. A clue to the ease with which the vestibular system of these<br />
individuals appears to adapt to the zero-g environment may be provided in the<br />
results of a study conducted by Clark and Stewart (1972). These investigators, in<br />
attempting to establish the relationship between reports of motion sickness and<br />
_lectcd vestibular tests, found that pilots as a group clearly report less<br />
experience with motion sickness thau do nonpilots. The pilot's less frequent<br />
experience with motion sickness may well be an important contributing factor in<br />
his selection of flying as a profession. The U.S. astronaut population to date is<br />
comprised entirely of pilots, most of whom have extensive experience as test<br />
pilots (Berry, 1972).<br />
Metabolism<br />
Metabolism in the broad sense may be defined as tissue change. This tissue<br />
change is the end product of the conversion of small molecules into larger ones,<br />
for example, amino acids to proteins, and the breaking down of larger molecules
39O Bioastronautics Data Book<br />
into smaller ones. In the former process, anabolism, encrgy is consumed; in the<br />
latter, catabolism, energy is given off. All energy used by the body (except that<br />
for outside work) finally appears as heat. Since oxygen is used in the process of<br />
breaking down nutrieuts to yield carbon dioxide and water, oxygen<br />
consumption and carbon dioxide production are useful indices of metabolic rate.<br />
Direct metabolic measurements have not been nmde during actual space<br />
flight. Metabolic costs }lave been infcrred from examination of total carbon<br />
dioxide production by chemical analysis of spent lithium hydroxide canisters.<br />
This technique established an average heat production rate during multiman<br />
missions. Other, more direct techniques have been used to assess metabolic costs<br />
duriltg lunar surface activities. Metabolic rate has been determined from<br />
telcmetry data by use of three methods: thermal balance, oxygen consumption,<br />
and heart rate. Thermal balance was determined by comparing the inlet and<br />
outlet temperatures in the water cooled undergarmenl_ during lunar surface<br />
activity; oxygen usage from the portable life support system was measured; and<br />
heart rate during lunar activity was compared to that on an energy cost<br />
"'calibration curve obtained preflight by bicycle ergometry. (For detailed<br />
treatment of these methods, the reader is referred to Carson, 1972).<br />
Space Flight Results. Inflight metabolic data from both Soviet and U.S.<br />
space flights show close agreement. Figure 8-6 compares the average metabolic<br />
rates for the Vostok, Mercury, and Gemini missions. The higher rate observed<br />
during the Gemini mission, graphed at the far left of the figure, undoubtedly is<br />
duc to the fact that these were short flights during which crewmen did not sleep.<br />
Metabolic rate, based on carbon dioxide output, for the longest American<br />
mission (Gemini 7) was estimated to be 2219 calories per day (figure 8-7). This<br />
expenditun; was adequately provided for by tile diet (2333 calories per day).<br />
Iii<br />
< re<br />
O<br />
_1<br />
O<br />
tv_<br />
<<br />
I.D<br />
t.kl<br />
t.9<br />
<<br />
tw U.I<br />
><br />
<<br />
100<br />
V<br />
0 2 4 6<br />
_1 VOSTOK<br />
_ MERCURY<br />
[_ GEMINI<br />
MISSION DURATION (days)<br />
8 10 12 14<br />
Fignlre 8-6. Average metabolic rates during actual space flight.<br />
(Berry, 1967a)
26O0 V<br />
2333<br />
........ 22--19 ...............<br />
I<br />
i 2000! 1804<br />
F - __-_TC_-g-<br />
Weightlessness 39 !<br />
,,oonnIli<br />
0 1 2 3 4 5 7 9 10 11 12<br />
MISSION DURATION (daysl<br />
[] Pilot [] Command Pilot<br />
-- - -- Average Caloric Intake __ __ Average Catoric Intake<br />
Figure 8-7. Calorie intake on Gemini 7. (Berry, 1967a)<br />
13 14<br />
Provided on board<br />
...... Metabolic Rate based on<br />
carbon_loxlde output<br />
Comparative techniques for metabolic assessment used during Apollo lunar<br />
surface activity indicated that monitoring of the temperatures at the inlet and<br />
outlet of the liquid cooled undergarment (thermal balance method) was best<br />
suited for estimating energy production. For the Apollo 11 mission, the thermal<br />
balance and oxygen use methods yielded similar data and accurately reflected<br />
the physical activity observed by telemetry, tleart rate data proved the least<br />
reliable method for determining metabolic rates (Berry, 1970).<br />
Average expenditure for each task varied for each crewman, with the average<br />
hourly energy production between 900 and 1200 BTU's. Table 8-11 compares<br />
lunar extravehicular times and metabolic rates for Apollo hmar surface crews.<br />
Conclusions. The techniques used for determining metabolic expenditure<br />
inflight admittedly are gross. Nevertheless, the expenditures calculated by this<br />
technique indicate that the diet provided for missions is more ttlan adequate for<br />
living and working in space for up to 2 weeks. Refined techniques for assessing<br />
metabolic costs during lunar surface activity yield accurate data which provide a<br />
sound basis for life support system and mission plannilrg.<br />
Endocrine and Electrolyte Responses<br />
Extensive biocilemical studies have been a feature of space flight programs.<br />
Data gathered through these studies are essential for determining the etiology of<br />
clinically demonstrable changes. Attention has been focused in areas where<br />
earlier experience has indicated most physiological changes occur, and in areas<br />
where it might be reasonably expected that zero gravity exposure could have<br />
significaI_t impact. Accordingly, attempts have been made to elaborate the
392 Bioastronautics Data Book<br />
Table 8-11<br />
Lunar Extravehicular Activity Times and Metabolic Rates<br />
Average<br />
Launch EVA time, metabolic<br />
Mission Crewman Date rain rate, Btu/hr<br />
Apollo 11 Armstrong 6169 168 777<br />
Apollo 11 Aldrin 168 1118<br />
Apollo 12 Conrad (EVA-l) 11[69 241 925<br />
Apollo 12 Bean (EVA-l} 241 930<br />
Apollo 12 Conrad (EVA-2} 235 840<br />
Apollo 12 Bean (EVA-2) 235 950<br />
Apollo 14 Shepard (EVA-l) 1170 288 750<br />
Apollo 14 Mitchell (EVA-l) 288 900<br />
Apollo 14 Shcpard (EVA-2) 275 900<br />
Apollo 14 Mitchell (EVA-2} 275 1050<br />
Apollo 15 Scott (EVA-I) 6]71 393 1050<br />
Apollo 15 Irwin (EVA-I} 393 1050<br />
Apollo 15 Scott (EVA-2) 432 950<br />
Apollo 15 Irwin (EVA-2) 432 800<br />
Apollo 15 Scott (EVA-3) 290 1000<br />
Apollo 15 Irwin (EVA-3) 290 850<br />
Apollo 16 Young (EVA-l) 4/72 431 800<br />
Apollo 16 Duke (EVA-l) 431 1050<br />
Apollo 16 Young (EVA-2} 443 750<br />
Apollo 16 Duke (EVA-2) 443 850<br />
Apollo 16 Young (EVA-3) 340 850<br />
ApoLlo 16 Duke (EVA-3) 340 900<br />
mechanisms involved in weight loss, demineralization, stress, and cardiovascular<br />
deconditioning. Insight has been gained into several of these phenomena as a<br />
result of analyses of urine and blood samples collected before, during, and after<br />
space flight.<br />
Space Flight Results and Conclusions<br />
Electrolytes. Urine and plasma electrolyte studies have revealed<br />
postfligbt retention of electrolytes. Decreases have been noted in potassium<br />
levels, indicative of decreases in total body potassium, and in urinary sodium and<br />
chloride levels. These changes have paralleled the time course of body weight<br />
changes.<br />
Figure 8-8 shows the results of urinary potassium studies for the Gemini 7<br />
pilot. In flight, potassium excretion appeared depressed, and this depression was<br />
s_till apparent by 24 hours postflight. Similar decreases were found in both serum<br />
and urinary potassium levels for Apollo crewmen. These changes were, in fact,<br />
suggestive of a decrease in total body potassium, an hypothesis that was<br />
supported by K40 evaluations in the Apollo 13 and 14 crews. Total body gamma<br />
spectrometry indicated a significant decrement of total body potassium for<br />
Apollo 13 crewmen compared with preflight values. In Apollo 14 crewmen,<br />
6milar decreases in total body potassium were seen 17 days after recovery versus<br />
the astronauts' preflight values. These decreases were noted when control<br />
subjects showed increased total body potassium levels. This potassium loss is
,.2<br />
,,=<br />
E<br />
3E<br />
i<br />
lOO -<br />
m<br />
50 -<br />
0 n<br />
f<br />
|<br />
!<br />
|<br />
!<br />
m<br />
i<br />
i<br />
m<br />
m<br />
J<br />
i<br />
i<br />
J<br />
PREFLIGHT<br />
Weightlesssness 393<br />
m<br />
i]<br />
I<br />
COLLECTION<br />
< 24 HRS.<br />
PERIOD<br />
i r • i<br />
i --li _ I<br />
i i<br />
i i i .J<br />
INFLIGHT POSTFLIGH'<br />
URINE SAMPLES<br />
Figure 8-8. Urine potassium, Gemini 7 pilot.<br />
presumptive evidence of intracellular water and cation loss, for which there is<br />
other supporting evidence. Decrements in total exchangeable potassium (10 to<br />
15 percent) also were seen in Apollo 15 crewmen when evaluated postflight by<br />
K42. No decrements were noted in Apollo 16 crewmen.<br />
Consistently diminished excrctions of sodium and chloride have also been<br />
observed in the immediate postflight period. Figure8-9 indicates urinary<br />
electrolyte levels for the Command Module Pilot of the Apollo 14 mission. This<br />
figure also shows his pre- and postflight potassium levels. Although some<br />
individual variation i_as been observed, these urinary electrolyte measures are<br />
typical following space flight exposure and clearly indicate efforts on the part of<br />
the body to retain fluid to compensate for inflight fluid volume loss.<br />
300_<br />
250 [] POTASSIUM<br />
4_7 - 85_ f) 73 2(_<br />
l ;11<br />
-27 -18 -5 '1 ÷2 +3<br />
DAYS PREFLIGHT DAYS POSTFLiGHT<br />
Figure 8-9. Urinary electrolyte leve]s pre- as](] postflight<br />
for Apollo 14 Command Module Pilot.<br />
!<br />
l<br />
+6
394 Bioastroanutics Data Book<br />
Endocrine Responses. Endocrine responses have been evaluated principally<br />
t0_e(erminc whetl_ llormones related to body fluid regulation reflect<br />
the observed postflight fluid and electrolyte changes.<br />
Attempts have also been made to evaluate stresses related to space flight by<br />
measuring certain postflight steroid levels. These results, based on very limited<br />
data, appear to indicate that the reentry and recovery periods may be the most<br />
stressful. Infligbt steroid levels are, in contrast, low. Figure 8-10 indicates a<br />
typical response, noted in the Gemini 7 Command Pilot. Apollo astronauts have<br />
exhibited similar responses.<br />
12..b -<br />
-_ 10. 0<br />
E<br />
o 7.5-<br />
5.0<br />
_>-L5<br />
0.0<br />
r-<br />
_!<br />
i ,ll<br />
Preflight I nflight Postflight<br />
Figure 8 10. Urine lT-hydroxycorticosteroids, Gemini 7 Command Pilot.<br />
It is, however, admittedly difficult to evaluate "stress" on the basis of<br />
endocrine assay since many hormones witich are believed to be indicative of<br />
certain stresses are also related to other physiological functions, for example,<br />
vasoconstriction or vasodilation and electrolyte regulation.<br />
Pre- and postflight measures of hormones related to electrolyte and fluid<br />
balance support the hypothesis that readily recoverable weight losses<br />
immediately postfligilt are primarily the result of inflight water loss. Postflight<br />
elevations have been noted for (1) antidiuretic hormone, (2)aldosterone,<br />
(3) plasma angiotensin which indicates renin activity, and (4) catecholamines.<br />
Increased levels of antidiuretic hormone, which regulates water resorption<br />
through the distal renal tubule, and increased aidosterone levels resulting in<br />
resorption of sodium in the proximal tubule are consistent with the electrolyte<br />
retention noted and the rapid weight gain postflight. Plasma angiotensin levels,
Weightlessness 395<br />
an index of renin activity, show significant increases postflight. Since renin<br />
stimulates the adrenal gland to secrete aldosterone upon sensing decreased blood<br />
volume or salt concentration (which is uncertain) in the kidney, the elevations in<br />
aldosterone levels observed postflight are consistent with cardiovascular and<br />
fluid/electrolyte findings.<br />
Aldosterone excretion triggered by exposure to zero gravity may explain<br />
why elevated plasma volume is not noted in longer duration missions but is in<br />
shorter missions. If the high urinary aldosterone excretion is associated with an<br />
increased aldosterone secretion rate, one would anticipate elevated plasma<br />
volume during longer duration missions since aldosterone expands circulating<br />
plasma volume as potassium is diuresed and sodium is retained. If increased<br />
aldosterone secretion occurred after plasma volume had been lost in response to<br />
an initial redistribution of body fluid volumes upon entering the weightless state,<br />
the net result would be a near normal plasma volume (Johnson & Driscoll, 1972,<br />
based on data of Lutwak et al., and Leach). Near normal plasma volumes were<br />
found postflight in the Apollo 14 and 15 crews (they were not measured for<br />
Apollo missions 11, 12, and 13). In fact, these crewmen exhibited plasma<br />
volume levels that were slightly elevated above their preflight mean. Apollo 16<br />
crewmembers, however, averaged plasma volume decreases of 9 percent.<br />
Weight Loss<br />
All hut one U.S. astronaut has lost weight in space. Weights recorded<br />
immediately postflight have ranged from 2 to 14 pounds below preflight levels.<br />
The Apollo 14 Commander alone gained 1 pound during his stay in space.<br />
Because most astronauts have regained about 60 percent of their weight loss<br />
within the first 24 hours after splashdown, it has been presumed that the weight<br />
loss is principally a water loss. Soviet cosmonauts exlfibited similar weight loss<br />
patterns. The Soyuz crews lost 2 to 4 pounds postflight. These body weight<br />
losses were rapidly recoverable in all but the Soyuz 9 (18-day) crew. Because<br />
postflight urinary nitrogen excretion did not increase, it was presumed that<br />
weight loss reflects water loss and not tissue catabolism. After the 18-day flight,<br />
some urinary nitrogen excretion was noted although this was within<br />
physiological limits. This coupled with the slow reattainment of preflight body<br />
weight indicates the possibility of some tissue catabolism (Kakurin, 1971).<br />
Apollo 16 astronauts, like all crews before them, lost weight (the<br />
Commander, 7.5pounds; the Lunar Module Pilot, 5.5pounds; and the<br />
Command Module Pilot, 6.5 pounds). Various indirect measurements made on<br />
the Apollo 16 crew, including estimates of the amount of food and drink taken<br />
and the amount of excreta produced, coupled with weighings on the recovery<br />
ship by scales calibrated with those used before launctring, appear to indicate<br />
that the astronauts' weight losses did not result from a diuresis alone. Further<br />
studies apparently will be needed to clarify all the factors underlyi_tg weight loss<br />
(Berry, 1972).<br />
Weight losses observed postflight for the Apollo 7 through 16 mission<br />
crewmen are shown in table 8-12. The rapidity with which the average weight
396 Bioastroautics Data Book<br />
t-m<br />
t"<br />
O<br />
÷++ ÷÷÷ ÷÷÷<br />
I_1 I i i I I I J I_ J t I<br />
rt- e_ a.<br />
r_ t_ t_ _J<br />
o O o
o<br />
÷ ÷ +<br />
o. o. o.<br />
+ ÷ 4-<br />
o<br />
_. o. m.<br />
o<br />
Weightlessness 397<br />
o. o. o.<br />
+ 4- +<br />
0_0<br />
+ I +<br />
+ I +<br />
ty" _ t_<br />
o<br />
o. o. o.<br />
÷ + ÷<br />
_o.m.<br />
tle _. t_<br />
q_w.<br />
+ + +<br />
t_ Q tl_<br />
÷ + +<br />
tit" n t_
398 Bioastronautics Data Book<br />
loss was regained (and a consistent pattern of retention of electrolytes<br />
postflight) indicates that of the average 6.2 Ib loss, 3.1 lb may be attributed to<br />
water loss. Aitiiough slightly negative water balance has been maintained, the<br />
situation is within manageable bounds.<br />
The Nature of the Adaptive Response to Space<br />
Flight: An Hypothesis<br />
Much information has been gained in American biomedical programs<br />
concerning the effects of space flight on man. A number of consistent findings<br />
have been observed: some imply a possible alteration of the structure of<br />
physiological systenrs while others indicate merely a change in capacity. These<br />
changes, while dealt with as discrete events, undoubtedly are individual dements<br />
in a basic adaptive response of the human organism to the unique stresses of<br />
space. Sufficient information is presently available to begin to piece together at<br />
least a tentative hypothesis concerning the nature of the adaptive process and<br />
the manner in which the various changes may be interrelated.<br />
Table 8-13 is a greatly simplified illustration of the hypothesis now being<br />
developed and shows the major classes of body response during the period of<br />
adaptation. Figure 8-11 presents the same hypothesis in diagrammatic form. In<br />
each case, the part of the hypothesis presented is that intended to describe<br />
factors influencing fluid shifts within the body.<br />
Table 8-13<br />
Overview of Current Hypothesis Concerning<br />
Processes Involved in Man's Adaptation to Zero Gravity<br />
Event<br />
Entry into zero graviW. Redistribution of<br />
circulating blood volume.<br />
Loss of water, sodium, potassium (loss of<br />
body weight ).<br />
Increased sodium. Potassium loss<br />
continues. Cell; acidotic; extracellular<br />
fluid: alkalotic.<br />
Respiratory and renal compensation. Halt<br />
to weight loss trend. 0<br />
Responseof Body<br />
Body attempts to reduce volume. ADH<br />
decreases, aldosterone production<br />
decreases.<br />
Decrease in plasma volume. Aldosterone<br />
produced.<br />
Intracellular exchange of potassium and<br />
hydrogen ions. Decrease in bone density<br />
and muscle mass, possibly including<br />
cardiac muscle.<br />
Stabilizes with new cardiovascular load.<br />
New body fluid and electrolyte balance.
STRESS<br />
STAGE<br />
ADAPTATION<br />
STAGE<br />
ADAPTED<br />
STAGE<br />
Weightlessness 399<br />
WEIGHTLESSNESS<br />
[<br />
REDISTRIBUTION OF TOTAL CIRCULATING<br />
BLOOD VOLUME<br />
ALDOSTERONE ADH DECREASE<br />
DECREASE IGAUER-HENRY REFLEXI<br />
J<br />
"'_--_ DIU R ESIS_._ -_/<br />
l T 1<br />
TOTAL BODY RENAL Na + PLASMA VOLUME<br />
WATER LOSS AND K* LOSS DECREASE<br />
ALDOSTERONE CELLULAR :RED CELL MASS<br />
AND AOH EXCHANGE OF DECREASE-<br />
SECRETION H _ FOR K + IONS DUE TO HYPEBOXiA_<br />
INCREASE<br />
RENAL VENTILATION DECREASE IN<br />
COMPENSATION INCREASES BONE AND<br />
Na + R TAINEO PLASMA MUSCLE MASS<br />
TENDS TO CO 2 DECREASES [ l<br />
WATER LOSS NEW CELLULAR WORK CV DECON-<br />
CEASES FLUID AND CAPACITY DITIONING<br />
WEIGHT ELECTROLYTE DECREASES NEW CV<br />
STABILtZES BALANCE LOAD<br />
Figure 8-11. Diagram of the hypothesized course of adaptation to weightlessness (Adapted<br />
from Leach, Alexander, and Fischer, 1970; used by permission of Academic Press, New<br />
York, copyright 1967 by Academic Press, lne.)<br />
Upon initial entry into weightlessness, an immediate redistribution in the<br />
total circulating blood volume occurs. The body interprets the resultant increase<br />
in right atrial filling as an indication of a need to reduce total fluid volume by<br />
increasing urine output. This event is governed by a decrease in antidiuretic<br />
hormone and a decrease in aldosteronc production. The result is a loss of water,<br />
sodium, and potassium through the kidneys with a resultant loss in total body<br />
weight. The concomitant decrease in plasma volume tends to reverse the initial<br />
aldosterone decrease. At this point, the body is believed to enter a phase of<br />
electrolyte and fluid imbalance in which sodium retention increases while<br />
potassium loss continues. Intracellular fluid and potassium loss results in a<br />
cellular acidosis with a mild (compensated) hypokalemic alkalosis of<br />
extracellular fluids.<br />
In essence, the body's response to lowered total body potassium is an<br />
intracellular exchange of potassium for hydrogen ions. Associated with the<br />
potassium deficit may be a decrease in bone density and muscle mass. Loss of<br />
cellular potassium can include the heart muscle, with resultant increased<br />
irritability and tendency toward disorders of cardiac rhythm. This was very<br />
likely the series of events which led to the cardiac arrhythmias experienced by<br />
the Apollo 15 crew. Postflight decreases of total exchangeable potassium in tiffs<br />
crew offer support of this supposition.<br />
In the final phase of the adaptation loop postulated, hyperacidity of the cell<br />
stimulates the respiratory system to decrease plasma carbon dioxide by
400 Bioastronautics DataBook<br />
increasing ventilatoryrate.Renalcompensation commences astherenaltubules<br />
beginto reabsorbpotassium. The bodyweightnow stabilizesat a new<br />
equilibriumpoint.Thispartof thebody'soveralladaptationprocessnow<br />
becomes complete. Thenewequilibriumestablishes anoptimal totalcirculating<br />
bloodvolumeor "newload"onthecardiovascular systemandanewfluid and<br />
electrolyte balance state. It is reason_le to presume that the new stabilized<br />
eomlition is appropriate for long-term performance under space flight<br />
conditions, provided it is unperturbed. If factors such as workload, thermal<br />
stress, or emotional stress are introduced, the system may be driven beyond the<br />
point of equilibrium: The conceptual model postulated here will be further<br />
tested and amplified as new flight data warrant. Information collected in<br />
conjunction with the Skylab experiments should be valuable in elucidating the<br />
mechanisms of man's response to space flight.<br />
Microbiological Changes<br />
Under Earth's gravitational conditions, airborne particulate matter remains<br />
suspended in inverse proportion to its settling velocity: larger particles (a few to<br />
several hundred micrometers in diameter) settle out rapidly. In the gravity free<br />
environment of the spacecraft, on the other hand, it is presumed that no<br />
sedimentation will occur. As a consequence, a considerable range of particles of<br />
biological interest on earth, that is >0.5g and
Weightlessness 401<br />
unit gravity force is removed, the things that man is accustomed to doing one<br />
way on Earth must be done quite differently in space. Sleeping, eating, and<br />
moving about in zero gravity both inside and outside the spacecraft are all<br />
affected in some measure.<br />
Sleep<br />
It is difficult to isolate weightlessness per se as a factor influencing the<br />
quality o'f sleep. Sleep disturbances have been common during space flight<br />
missions but these appear to be much more profoundly affected by operational<br />
factors than by the weightless element of tile environment. Cyclic noise<br />
disturbances from events such as thruster firings, communications, movement in<br />
the spacecraft, staggered sleep periods, alterations from preflight diurnal cycles,<br />
and the so-called "command pilot s_ndrome" all contributed to sleep<br />
disturbances during the Gemini missions. Similar problems were experienced by<br />
Apollo mission crew members until the time of the Apollo 11 lunar landing<br />
flight, when increased confidence in spacecraft systems permitted scheduling of<br />
simultaneous sleep periods for crew members. This resulted in rest periods which<br />
were close to ideal prior to lunar orbit insertion (figure 8-12). These sleep<br />
periods, described only from the study of telemetered heart and respiration rates<br />
and crew reports, were deemed adequate for medical approval of earlier<br />
extravehicular activity on the lunar surface than was originally planned.<br />
Environmental aspects of the lunar module, however, once again disrupted sleep.<br />
This has been the case for astronauts on missions subsequent to Apollo 11 and<br />
has in some cases necessitated the prescription of sleeping medication.<br />
FLIGHT DAY<br />
8 m<br />
7 -<br />
6 -<br />
5 -<br />
4 -<br />
3 -<br />
2 -<br />
1 -<br />
0 -<br />
1400 1800<br />
NORMAL CAPE KENNEDY<br />
I I<br />
BED TIME<br />
I I<br />
I I<br />
I I<br />
I<br />
I<br />
I<br />
I I<br />
i |<br />
I<br />
I<br />
II<br />
I I I I t I<br />
2200 0200 0600<br />
EASTERN DAYLIGHT TIME<br />
Figure 8-12. Crew sleep periods during Apollo 11 mission.<br />
I<br />
I<br />
i<br />
1000<br />
I<br />
1400
402 Bioastronautics Data Book<br />
Sleeping in the weightless environment is accomphshed by many astronauts<br />
most comfortably if a fetal position is assumed. Consistent reports of backache<br />
among astronauts may well be linked to the tendency to assume the fetal<br />
position. The use of improved sleep restraint systems on future missions may<br />
alleviate this problem.<br />
Mission constraints have thus far precluded the collection of inflight EEG<br />
sleep data, although pre- and postflight baseline data were obtained for the<br />
Apollo 16 crew (Berry, 1972). Sleep experiments scheduled for the Skylab<br />
program will permit the first inflight monitoring of sleep patterns by EEG and<br />
EOG and undoubtedly help to clarify the effects of weightlessness on sleep<br />
(Berry, 1971a; 1972).<br />
Kakurin (1971) reports that after several days of adaptation during the<br />
I8-day Soyuz 9 flight, sleep lasted 7 to 9 hours and "always brought freshness<br />
and good humor." Crewmembers fell asleep rapidly in about the same manner as<br />
on Earth. One crewmember appeared to adapt so well to sleeping in the<br />
weightless condition that he preferred to sleep without being tied into his cot.<br />
Eating in Weightlessness<br />
Space diets have consisted principally of freeze dehydrated food that is<br />
easily reconstituted inflight with both cold and hot water. This diet has been<br />
augmented by the inclusion of thermostabilized meat dishes of high moisture<br />
content as well as drinks and snacks containing dietary potassium supplements.<br />
Initially, these foods were eaten through tubes incorporated into the food<br />
container, but it was later found that eating foods with sufficient moisture could<br />
be easily accomphshcd in zero gravity with a conventional spoon utensil.<br />
Regardless of the diet provided for any given mission, space crews have<br />
indicated in postflight debriefings that hunger occurred less frequently in space<br />
and that food requirements are only about two-thirds of "normal." Based on<br />
these observations, menus have been designed to provide approximately 2300 to<br />
2500 kilocalories per man per day in U.S. missions. Soviet space dietary<br />
allowances are considerably higher; 2800 kcal were provided in the daily diet for<br />
the Soyuz 9 crew members (Kakurin, 1971). These latter diets which initially<br />
comprised principally freeze dehydrated foods have, like American diets, been<br />
supplemented by other types of foods because of the "low rating" given by<br />
cosmonauts to dehydrated food products. With consideration given to individual<br />
tastes, these diets have been reported to satisfy cosmonauts' requirements<br />
"completely" (Kakurin, 1971). Sensations of thirst have been reported to be<br />
slightly reduced in Soviet cosmonauts during flight and increased considerably<br />
postflight.<br />
lntracabin Movement<br />
The absence of gravity has been found to represent a bonus for locomotion<br />
within the spacecraft cabin. Locomotion in zero g appears to require much less<br />
work than in the unit gravity environment. Movement is accomphshed with
Weightlessness 403<br />
minimal effort, frequently in a swimming manner. Acrobatic maneuvers, such as<br />
rolling, tumbling, and spinning, are done without difficulty. An additional<br />
feature of the zero gravity environment, the capability to impart minimal<br />
velocities to objects, also has been used repeatedly by crewmen as an aid in<br />
performing inflight activities.<br />
The ability to move freely through all parts of a space cabin during<br />
weightlessness has implications for general vehicle habitability. Apollo astronauts<br />
have commented that the Command Module, which seemed rather cramped<br />
during ground tests, was more comfortable in flight due to the increase in usable<br />
living and working space. This observation has raised the question of the validity<br />
of volumetric studies which attempt to extrapolate from habitation in other<br />
confined areas such as submarines or low pressure chambers the volume of living<br />
space required for astronauts in long duration missions. Locomotion in three<br />
dimensional space, as opposed to two, appears to be a positive factor in<br />
determining vehicle habitability.<br />
Extravehicular Activities<br />
The first extravehicular activities, performed by cosmonaut Meksei Leonov<br />
in March 1965, and by astronaut Edward White in June 1965, demonstrated that<br />
man is capable of reasonable activity in space while operating without the<br />
protection of a space capsule. These first ventures, while quite short, clearly<br />
were the forerunners of later periods of lunar exploration and of useful<br />
maintenance and equipment assembly operations during longer space missions.<br />
In subsequent EVA attempts during Gemini flights, however, astronauts<br />
experienced considerable difficulty in actually aceomplislfing what had been<br />
considered to be a normal EVA work assignment prior to launch. As matters<br />
stood at that time, the demands of EVA exceeded the capabilities of an<br />
astronaut. It was not until the final flight of the Gemini series that these<br />
difficulties were resolved through intensive study that resulted in partial redesign<br />
of EVA work stations and support equipment. This series of events provided<br />
very dramatic demonstration of the requirement that information concerning<br />
human capabilities be reflected in the design of space equipment. At the root of<br />
the problem was a paucity of useful data concerning the effects of weightlessness<br />
on man's performance capabilities. Subsequent flight experience, however, has<br />
done much to provide the information needed by space system designers.<br />
EVA History. Table8-14 summarizes extravehicular activity in United<br />
States space missions. Problems associated with early EVA were eradicated,<br />
principally through the development of energy saving techniques and work aids<br />
and the opportunity for rehearsal afforded by underwater simulation experience.<br />
Energy Expenditure in Extravehicular Activity. The principal problem with<br />
early EVA flights was, as noted earlier, the exhaustion which was suffered by the<br />
astronaut, at times even before the completion of the assigned tasks. This<br />
exhaustion was due pmlcipally to the unique character of working in the<br />
weightless environment where difficulties are.encountered in producing reactions<br />
to actions once momentum had been imparted and maintaining position in the
404 Bioastronautic.s Data Book<br />
Table 8-14<br />
U.S. Extravehicular Summary Free Space and Lunar Surface<br />
Time of Principal<br />
Mission Exposure Tasks Problems Comments<br />
(hr:min) Accomph_ited<br />
(_¢mini 4 0:36 Dynamics of 25-ft tether<br />
evaluated; hatch lngress<br />
and egress assessed<br />
(_emini 9-A 2:07 AM U* evaluates photo-<br />
grap_y<br />
Gemlrn 10 1:29 Experiment package<br />
retrieved: photography.<br />
CP assisted by EVP in<br />
formaUon flying w ith<br />
Agena vehxc h,<br />
Gemin_ It 2:43 lOO-ft tether attached<br />
bet,_een spacecraft and<br />
Agena vehicle photo-<br />
graphy<br />
Gemini 12 5:30 Restraints and workl_md<br />
assoc, wits phoio£raphy<br />
and equipment use evalu-<br />
ated; experiment package<br />
retripved<br />
Apollo 9 0:37 5ystrm tests<br />
Apollo 15 0:35 12 lnftight EVA pprl,,trn('d<br />
Apollo 16 1:24<br />
ApoLlo 11 5:36<br />
A [×,lk, 12 h, 52<br />
AIn,li_, 14 18:46<br />
Apollo 15 37 i0<br />
Apollo 16 40:28<br />
out ,f Earth orbit<br />
First manned lunar landing;<br />
kuna, Surface<br />
photography, survey, sam-<br />
phn_ ol lunar soil<br />
Metaholic heat output EVA successful although<br />
exceeded cooling capacfty energy required exceeded<br />
of ventilation; control anticipated levels<br />
module<br />
Overheating. exhaustion; EVA terminated due to<br />
attitude maintenance visor fogging and fatigue<br />
diIIicuIL loss of traction,<br />
visor fogging<br />
Grip difficult to main- Eye irritation believed<br />
rain, eye irritation. 50-ft due to use of both 02<br />
umnilical difficult to compressors<br />
control<br />
Demonstrated point landing N,, mabn J,l.dAt m_<br />
capability, sampled more<br />
area. deployed ALSEP,<br />
mvosugated _urv,,y,,r 3<br />
spacecrafL and _utained<br />
ph_,t,,_ raphs c_f candidate<br />
rxph*l ailon_ _ktes.<br />
Ex_,er_.ellt ],a_ k_l_,, dE,ph,y- I ¸ L_st Lr_d3_ L_l_,,,t ,,l<br />
Overheating, exhaustion EVA terminated due to<br />
fatigue<br />
N,me EVA completely success-<br />
ful as a result of under-<br />
water simulation practice<br />
and body restraints<br />
None EVA successfuJ<br />
None EVA successful<br />
N_J major pr_dAen/_ _._*ping _l,it used<br />
M..tah,di_ production<br />
values h '._,.r than l,re-<br />
d:, t,d<br />
,,h_ /,r,,-<br />
First to carry Lunar l,unar su_la_ r _q kload EVA sutl esshll<br />
ffovmg Vetucle: extended overtaxed cre_<br />
cxploration (a rrhythmias)<br />
Mosl comprehensive None EVA successful<br />
san,ldmg<br />
* AMU : Astronaut Maneuvering Unil<br />
h_E,its
Weightlessness 405<br />
absence of traction. Additional problems were imposed by the increased effort<br />
involved in moving in a pressurized space suit (3.5 psi). This created a heat load<br />
in the space suit and unacceptably high carbon dioxide levels.<br />
Reduction of effective work load in the Gemini 12 mission EVA was due, at<br />
least in part, to realistically simulated weightlessness training and, in part, to<br />
improved work aids. Additional energy conservation resulted from the<br />
astronaut's ability to condition himself to relax completely on occasion within<br />
the neutral position of the space suit (Kelly and Coons, 1967). The Gemini 12<br />
astronaut reported that he systematically monitored each muscle group. When a<br />
group of muscles was found to be tense while performing no useful work, he was<br />
able to relax these muscles consciously. All of his movements were slow and<br />
deliberate. When a task could be performed by small movement of the fingers,<br />
he would use only those muscles necessary for this small movement.<br />
Planning for EVA missions in either 0 g or 1/6 g and the development of<br />
equipment for use during these missions has and must continue to take into<br />
account work load. The Lunar Roving Vehicle is one example of equipment<br />
designed for conservation of energy.<br />
Counteracting the Physiological Effects of Weightlessness<br />
Considering the trepidations expressed a decade ago about possible effects of<br />
long term exposure to weightlessness, man has weathered his entry into this new<br />
domain in surprisingly good shape. Not only have most of the predicted<br />
problems been negligible, but certain benefits have been found to be associated<br />
with living and working in zero gravity. However, certain changes in major body<br />
systems have been observed. Space flight results to date tend to substantiate the<br />
belief that these changes are largely adaptational responses to the new<br />
environment. However, one can not be absolutely certain that some of these<br />
changes do not in fact represent the first stages of a gradual deterioration<br />
process. Countermeasures to weightlessness have therefore been and are<br />
continuing to be investigated. Table 8-15, from a survey by Vinograd and<br />
Manganelli (1972), lists approaches which have been explored with mixed<br />
results. _<br />
A limited number of countermeasures to weightlessness effects have been<br />
employed in conjunction with past space missions. Inflight exercise regimes have<br />
been a feature of both U.S. and Soviet space missions. These regimes and their<br />
effects have been discussed in an earlier section of this chapter. Because it was<br />
believed that potassium deficits were responsible for the arrhythmias suffered by<br />
the Apollo 15 crew, dietary countermeasures were employed during the<br />
Apollo 16 mission. A diet high in potassium was provided (105 milliequivalents,<br />
versus a normal 70, in the command module diet, and 135 milliequivalents in the<br />
lunar module diet). Potassium enriched beverages and snack supplements were<br />
*This survey, entitled Literature Summary on Countermeasures, may be consulted for<br />
details on experiments which have been attempted and for efficacy rating. (See References<br />
for full citation)
406 Bioaslronautics Data Book<br />
Exercise<br />
Medication<br />
Diet<br />
LBNP<br />
Table 8 15<br />
Potential Countermeasures to Weightlessness<br />
Gradient positive pressure<br />
G-Suit<br />
Venous occlusion cuffs<br />
Positive pressure breathing<br />
Valsalva maneuver<br />
Bone stress<br />
Double trampoline<br />
(Vinograd & Maganelli, 1972)<br />
Tumbling<br />
Electrical stimulation of muscles<br />
Exercise and LBNP<br />
Exercise and venous occlusion cuffs<br />
Exercise and positive pressure breathing<br />
Exercise and bone stress<br />
Exercise and hypoxia<br />
Venous occlusion cuffs and medication<br />
Venous occlusion cuffs and leotards<br />
Hypoxia, LBNP and exercise<br />
Centrifugation<br />
also stocked. Potassium enriched meals were also consumed for 72 hours prior to<br />
launch to guarantee adequately high potassium levels at launch time. The<br />
provision of a high potassium diet, coupled with better planned work-rest cycles,<br />
proved to be a successful technique for countering the cardiac problems<br />
experienced by the prior crew. Lower body negative pressure was used by the<br />
Salyut crewmen inflight.<br />
Another approach which has been suggested for countering the effects of the<br />
weightless environment is the provision of some system of artificial gravity in<br />
space vehicles. Two approaches have been suggested: rotation of the entire<br />
space vehicle or station and inclusion of an onboard centrifuge.<br />
Table 8-16 shows the rotation radii and angular velocities necessary to<br />
achieve 3 gravity levels currently considered acceptable. The Coriolis force<br />
created is also indicated. A maximum Coriolis force of 20 percent of man's<br />
apparent weight is thought to be the limit which can be obtained without<br />
resulting discomfort. With higher angular velocities than those shown and shorter<br />
radii of rotation, even simple head movements can cause severe Coriolis forces<br />
with the associated discomfort. In addition, with a short radius of rotation, a<br />
gravity gradient (a difference in gravity between head and feet) exists which, if<br />
sufficiently large, can also produce discomfort. The Coriolis forces indicated in<br />
the table are based on a man's moving at a velocity of 3 feet per second.<br />
It should be pointed out that medical and performance data available at the<br />
present time do not support a requirement for artificial gravity systems in<br />
spacecraft. In the view of space crews to the present time, artificial gravity<br />
systems are unnecessary for task performance. Crews have learned to live in a<br />
zero gravity environment and feel very confident in this state. Many have, in<br />
fact, expressed a preference for a zero g environment since the absence of gravity
I<br />
0<br />
°_<br />
e_<br />
Weightlessness 407<br />
r_ t.o<br />
0 _ o_, CO u_<br />
0 _ _ e_ CO<br />
A _<br />
e!<br />
LO<br />
_" _D<br />
0<br />
E<br />
0<br />
r-<br />
EE_<br />
- g
408 Bioastronauties Data Book<br />
increases the effective volume of what would otherwise be rather confined work<br />
spaces. On the other hand, the provision of artificial gravity would undoubtedly<br />
increase the habitability of spacecraft. Eating would become a simple affair, and<br />
locomotion could proceed nearly as it does in the Earth-bound environment.<br />
Everyday activities could be carried out about as easily and simply as they are in<br />
one's own home. Where engineering considerations are concerned, design tasks<br />
would be simplified in that restraint systems and locomotion aids would no<br />
longer be required. On the other hand, the engineering tasks associated with<br />
designing the artificial gravity system itself are formidable and could be costly.<br />
The issue of the need for artificial gravity in spacecraft of the future is no<br />
more clearly resolved among Soviet scientists than it is in the United States.<br />
Valyavski (1969) states that until it becomes clear whether man forms adaptive<br />
mechanisms in the weightless state, technology will continue in the Soviet Union<br />
to attempt to create artificial gravitation. This is a problem which is "much in<br />
the forefront of modern cosmonautics." Members of the Soviet medical<br />
community had indicated to the author that they find no basis for requiring<br />
artificial gravity, but that it is still a question of concern to Soviet space system<br />
designers. _<br />
References<br />
Akulinichev, I. T., et al. Results of physiological investigations on the space ships Vostok 3<br />
and Vostok 4. V. V. Parin (Ed.), Aviation and Space Medicine. NASA TT F-228,<br />
December 1964, National Aeronautics and Space Administration, Washington, D.C.<br />
Bayevskiy, R. M., & Gazcnko, O. G. Reactions of the cardiovascular and pulmonary system<br />
in humans and animals under conditions of weightlessness. Kosaicheskiye isskdovaniya,<br />
1964, 2, 3O7.<br />
Berry, C. A., et al. Man's response to long-duration flight in the Gemini spacecraft. In<br />
Gemini Midprogram Conference. Manned Spacecraft Center, Houston, Texas, 23-25<br />
February 1966. NASA SP-121, 1966, National Aeronautics and Space Administration,<br />
Washington, D.C.<br />
Berry, C. A. Pre-Gemini mcdical predictions versus Gemini flight results. In Gemini<br />
Summary Conference. Symposium presented at the Manned Spacecraft Center, Houston,<br />
Texas. February 102, 1967. NASA SP-138, 1967, National Aeronautics and Space<br />
Administration, Washington, D.C. (a)<br />
Berry, C. A. Space medicine in perspcctive. Journal of the American Medical Association,<br />
1967, 201,86-95. (b)<br />
Berry, C. A. Preliminary clinical report of the medical aspects of Apollo VII and VIII.<br />
Aerospace Medicine, 1969, 40, o45-254. (a)<br />
Berry, C. A. Status report on space medicine in the United States. Aerosapce Medicine,<br />
1969, 40,762-769. (b)<br />
Berry, C. A. Summary of medical experience in the Apollo 7 through 11 manned space<br />
flights. Aerospace Medicine, 1970, 41,500-519.<br />
*Personal communication.
Weightlessness 409<br />
Berry, C. A. Biomedical findings on American astronauts participating in space missions.<br />
Paper presented at the Fourth International Symposium on Basic Environmental<br />
Problems of Man in Space, Yerevan, Armenia, 1-5 October 1971. (a)<br />
Berry, C. A. Medical results of Apollo 14-implications for longer duration space flights.<br />
Paper presented at XXllnd International Astronautical Congress, Brussels, Belgium, 25<br />
September 1971. (b)<br />
Berry, C. A. Effects of weightlessness in man. Paper presented at XVth COSPAR Meeting,<br />
Madrid, Spain, 23 May 1972.<br />
Berry, C. A. Findings on American astronauts bearing on one issue of artificial gravity for<br />
future manned space vehicles. In press.<br />
Biryukov, Ye. N., & Krasnykh, I. G. Change in optical density of bone tissue and calcium<br />
metabolism in the cosmonauts A. G. Nikolayev and V. I. Sevast'yanov. In O. G.<br />
Gazenko and N. N. Gurovskiy (Eds.) Kosmicheskaya Biologiya i Meditsina (Space<br />
Biology and Medicine), Moscow: Meditsina Publishing House, 1970.<br />
Busby, E. Clinical space medicine: A perspective look at medical problems from hazards of<br />
space operations. NASA CR-856, July 1967. Prepared by Lovelace Foundation for<br />
Medical Education and Research for National Aeronautics and Space Administration,<br />
Washington, D.C.<br />
Carson, M. A. Apollo portable life-support system. Proceedings of the Second Conference<br />
on Portable Life-Support Systems. NASA SP302, National Aeronautics and Space<br />
Administration, Washington, D.C., 1972.<br />
Cherepakhin, M. A., & Pervushin, V. I. Space flight effects on the neuromuscular system of<br />
cosmonauts. In O. G. Gazenko and N. N. Gurovskiy (Eds.) Kosmicheskaya Bioiogiya i<br />
Meditsina (Space Biology and Medicine), Moscow: Meditsina Publishing House,1970.<br />
Clark, B., & Graybiel, A. Disorientation: A cause of pilot error. Rev. Med. Aeronautics,<br />
1955, 18, 219. Cited in J. F. Parker, Jr. (Ed.) U.S. Naval Flight Surgeon's Manual.<br />
Washington, D.C.: U.S. Government Printing Office, 1968.<br />
Clark, B., & Stewart, J. D. The relationship between motion sickness experience and<br />
vestibular tests in pilots and nonpilots. Paper presented at Aerospace Medical<br />
Association Annual Scientific Meeting, Bal Harbour, Florida, 8-11 May 1972.<br />
Deitrick, J. E., Whedon, G. D., & Shorr, E. Effects of immobilization upon various<br />
metabolic and physiologic functions of normal men. American Journal of Medicine,<br />
1948, 4, 3-36.<br />
Dietlein, L. F., & Harris, E. Experiment M-5 bioassay of body fluids. In Gemini<br />
Midprogram Conference. Manned Spacecraft Center, Houston, Texas, 23-25 February<br />
1966. NASA SP-121, National Aeronautics and Space Administration, Washington, D.C.<br />
Donaldson, C. L., ct al. The effects of long-term bed rest on mineral metabolism. Paper<br />
presented at Symposium on Hypogravic and Hypodynamic Environments. French Lic,<br />
Indiana, 16-18 June 1969.<br />
Faget, M. A., & Oiling, E. H. Orbital space stations with artificial gravity. Paper presented at<br />
Third Symposium on the Role of the Vestibular Organs in Space Exploration, Pensacola,<br />
Florida, 24 January 1967. NASA SP-152, 1968. National Aeronautics and Space<br />
Administration, Washington, D.C.<br />
Fedorova, T. A., ct al. Some metabolic indices in the cosmonauts Gagarin, Titov,<br />
Nikolayev, and Popovich. In A. T. D. Press, Special lssuc, Space Medicine, 1964, 3(10).<br />
Library of Congress, N64-26357.<br />
Fischer, C. L., Johnson, P. C., & Bcrry, C. A. Red blood cell mass and plasma volume<br />
changes in manned space flight. Journal of The American Medical Assoc&tion 1967,<br />
200,579-583.<br />
Fraser, T. M. The intangibles of habitability during long-duration space missions. Lovelacc<br />
Foundation, Albuquerque, Ncw Mexico. NASA CR-1084, .June 1968. National<br />
Aeronautics and Space Administration, Washington, D.C.
410 Bioastronautics Data Book<br />
Gerathewohl, S. J., & Ward, J. E. Psyehophysiological and medical studies of weightlessness.<br />
In O. Benson, Jr., & H. Strughold (Eds.), Physics and Medicine of the<br />
Atmosphere and Space. New York: John Wiley & Sons, 1960.<br />
Graybiel, A., Miller, E. F., Billingham, J., Waite, R., Berry, C. A., & Dietlein, L.<br />
F. Vestibular experiments in Gemini flights V and VII. Aerospace Medicine, 1967, 38,<br />
360-370.<br />
Haldane, J. S. Respiration. New Haven: Yale University Pre_, 1922.<br />
ltatch, T. T., & Gross, P. Pulmonary deposition and retention of inhaled aerosoles. New<br />
York: Academic Press, 1964.<br />
Hattner, R. S., & MeMillian, D. E. Influence of weightlessness upon the skeleton: A review.<br />
Aerospace Medicine, 1968, 39,849-855.<br />
Heaney, R.P. Radiocalcium metabolism in disuse osteoporosis in man. American Journal of<br />
Medicine, 1962,33, 188.<br />
Johnson, P. C., & Driscoll, B.S. Red cell mass and plasma volume changes found in selected<br />
Apollo missions. Paper presented at Aerospace Medical Association Annual Scientific<br />
Meeting, Bal Harbour, Florida, 8-11 May 1972.<br />
Jones, W. L. The human factors systems program. Office of Advanced Research and<br />
Technology, National Aeronautics and Space Administration. Presented before the<br />
Committee on Science and Astronautics, |louse of Representatives, Washington, D.C.,<br />
1968.<br />
Kalinichenko, V. V., Gornago, V. A., Machinskiy, G. V., et al. Dynamics of orthostatic<br />
stability of cosmonauts after flight aboard the Soyuz-9 spaceship. In O. G. Gazenko and<br />
N. N. Gurovskiy (Eds.) Kosmicheskaya Biologiya i Meditsina (Space Biology and<br />
Medicine), Moscow: Meditsina Publishing House, 1970.<br />
Kakurin, L. 1. Medical research prepared on the flight program of the Soyuz-type<br />
spacecraft. NASA TTF-141026, National Aeronautics and Space Administration,<br />
Washington, D.C., November 1971.<br />
Kakurin, L. 1., et al. The effect of hypokinesia on some indices of work capacity and<br />
respiratory function of man. In A. T. D. Press, Special Issue, Space Medicine, 1964,<br />
3(10), Library of Congress, Washington, D.C.<br />
Kelly, G. F., & Coons, D. O. Medical aspects of extravehicular activity. In R. M. Machell<br />
(Ed.), Summary of Gemini extravehicular activity. NASA SP-149, 1967, National<br />
Aeronautics and Space Administration, Washington, D.C.<br />
Lebedinskiy, A. V., et al. As cited in Petukhov, B. N., Purakhin, Yu. N., Georgiyevskiy, V.<br />
S., et al., 1964. Regulation of erect posture of cosmonauts after an 18-day orbital flight.<br />
In O. G. Gazenko and N. N. Gurovskiy (Eds.) Kosmicheskaya Biologiya i Meditsina<br />
(Space Biology and Medicine), Moscow: Meditsina Publishing House, 1970.<br />
Mack, P. B., & LaChance, P. A. Effects of recumbency and space flight on bone density.<br />
Second Annual Biomedical Research Conference, Houston, Texas, 1966.<br />
Mack, P. B., Vogt, T. B., & LaChance, P. A. Experiment M-6, bone demineralization. In<br />
Gemini Midprogram Conference. Manned Spacecraft Center, Houston, Texas, 23-25<br />
February 1966. NASA SP-121, 1966, National Aeronautics and Space Administration,<br />
Washington, D.C.<br />
Molchanov, N. S., Krupina, T. N., Balandin, V. A., et al. Results of clinical examination of<br />
A. G. Nikolayev and V. I. Sevast'yanov. In O. G. Gazenko and N. N. Gurovskiy (Eds.)<br />
Kosmicheskaya Bioiogiya i Meditsina (Space Biology and Medicine), Moscow: Meditsina<br />
Publishing House, 1970.<br />
National Academy of Sciences, National Research Council. Physiology in the space<br />
environment. Vol. II, Respiration. Report of a conference conducted by the Space<br />
Science Board of the National Academy of Sciences, National Research Council, Woods<br />
Hole, Massachusetts, June-July, 1966. Publication 1485B, Washington, D.C., 1967.
Weightlessness 411<br />
National Academy of Sciences, National Research Council. Infectious disease in manned<br />
space flit_ht. Space Science Board, Washington, D.C., 1970.<br />
Parin, V. V., et al. Some results of a medical-biological experiment on tlw biological satellite<br />
Kosmos 110. In Space Biology and Medicine, Joint Publications Research Service<br />
Report No. 45798, USSR, 1968.<br />
Petukhov, B. N., Purakhin, Yu. N., Gcorgiyevskiy, V. S., et al. Regulation of erect posture<br />
of cosmonauts after an 18-day orbital flight. In O. G. Gazenko and N. N. Gurovskiy<br />
(Eds.) Kosmicheskaya Biologiya i Meditsina (Space Biology and Medicine), Moscow:<br />
Meditsina Publishing itouse, 1970.<br />
Rummel, J. A., Hoffler, G. W., Sawin, C., Wolthuis, R. A., Buderer, M. C., Johnson, R. L., &<br />
Michels, E. L. Cardiopulmonary responds to space flight. Paper presented at Aerospace<br />
Medical As_ciation Annual Scientific Meeting, Bal Harbour, Florida, 8-11 May 1972.<br />
Valyavski, Y. Some compensation reactions during extended weightle_ne_. Paper<br />
presented at the Third International Symposium on the Basic Environmental Problems<br />
of Man in Space, Geneva, Switzerland, 15-19 November 1968. NASA TT-F.12094,<br />
National Aeronautics and Space Administration, Wa_ington, D.C., January 1969.<br />
Vinograd, S. P., & Manganelh, L. A. Literature summary on countermeasures. George<br />
Washington University Medical Center, Washington, D.C., January 1972.<br />
Volynkin, Yu. M., Vasil'yev, P. V. Some results of medical studies conducted during the<br />
flight of the Voskhod. In N. M. Sisakyan (Ed.), The problems of space biology, Vol. VI,<br />
NASA TT F-528, July 1969. National Aeronautics and Space Administration,<br />
Washington, D.C.<br />
Vorob'ycv, Ye. I., et ai. Medical support and principal results of examination of the<br />
Soyuz-9 spaceship crew. In O. G. Gazenko and N. N. Gurovskiy (Eds.)Kosmicheskoya<br />
Bioiogiya i Meditsina (Space Biology arm Medicine), Moscow: Mcditsina Publishing<br />
House, 1970.<br />
Yazdovskiy, V. I., & Denisov, V. G. Flights of space vehicles Vostok 5 and Vostok 6. In the<br />
Ru_ian language, Herald of the Academy of Sciences of the U.S.S.R., 1963, 33(9),<br />
17-22.<br />
Yazdovskiy, V. 1., et al. Sensory-motor coordinatkm in conditions of prolonged<br />
weightle._ness during actual space flight. In A. T. D. Press, Special Issue, Space<br />
Medicine, 1964, 3(10). Library of Congre_% N64-26357.<br />
Yegorov, B. B. Physiological reactions and po_ible means of protection during long tcrm<br />
exposure to weightless conditions. NASA TT F-12095, January 1969, National<br />
Aeronautics and Space Admini_ration, Washington, D.C.<br />
Yuganov, Ye. M. Physiological reactions in weightlessness. In V. V. Parin (Ed.), Aviation<br />
and space medicine. NASA TT F-228, December 1964, National Aeronautics and Space<br />
Administration, Washington, D.C.
412 Bioastroautics Data Book<br />
o_<br />
0<br />
e-<br />
I-<br />
,7<br />
f_<br />
c<br />
.,J<br />
e_<br />
.4<br />
c<br />
E<br />
a_<br />
0<br />
0<br />
><br />
",_ _'_<br />
_ _ o ' '-<br />
- _ _>_<br />
,'E E<br />
o .- - g s_<br />
E ._c .c_ ._ E E E<br />
"" _") (N _ _ .<br />
_. • , _<br />
_ _ _: _<br />
"= _ _ _<br />
E<br />
o<br />
E<br />
e-<br />
_4<br />
x 5._<br />
_. u.. __<br />
C<br />
E E<br />
t'_ ¢')<br />
o _,_ .: .__<br />
o _ ._a_,<br />
.5 >_vr_< -_<br />
• z _ _ _ _ _ _<br />
i _>_ ><br />
e-
• I_O<br />
Z: o _ ' "- '_"<br />
m _ 0 "0<br />
E _ E E<br />
,/, ,/, LO "_"<br />
LO (.0<br />
L9 rid It') _0<br />
< _<br />
.E ._- c _<br />
_ E E E<br />
_' eightlessness 413<br />
°'= - ___<br />
$<br />
_ o<br />
o E_._<br />
. ,,, o E<br />
*" N 0<br />
_ _ 0 0<br />
E E E E EE E EE<br />
0 ¢-1<br />
CO00 ,_" LO<br />
_ _ _ o < oo
414 Bioastronautics Data Book
._ .= o<br />
_eigbt_essnes_<br />
xg _ _ ,, _ _ _._ -.<br />
gt _- "0 _ _ _ _ _ _ 0 _ o _ "0 _<br />
E<br />
f<br />
r-<br />
,_<br />
o%_<br />
C_<br />
o "3<br />
,.,/') o<br />
C_<br />
/<br />
_'.<br />
/<br />
e_<br />
_o ® E<br />
_o_<br />
gg<br />
0
CHAPTER 9<br />
IONIZING RADIATION<br />
by<br />
Shields Warren, M.D.<br />
New England Deaconess Hospital<br />
Boston, Massachusetts<br />
and<br />
Douglas Grahn, Ph.D.<br />
Argonne National Laboratory<br />
Argonne, Illinois<br />
Concern over the effects of exposure to radiation is uniquely a product of<br />
the twentieth century. Within this period, machines capable of producing or<br />
releasing many kinds of radiation particles have been developed. Man also has<br />
taken the first steps into space, a radiation environment altogether different<br />
from that found on Earth. Medical and dental personnel now use radiation<br />
sources as diagnostic and therapeutic tools. It is with respect to space travel,<br />
however, that the most dramatic issues concerning radiation exposure have been<br />
raised. It has been known for some time that the Earth's atmosphere shields man<br />
from higher levels of solar and galactic radiation. Only now is information being<br />
obtained as to the effects of deliberate penetration into these regions of<br />
increased radiation. The findings from these early space missions will aid in<br />
determining the feasibility of long-term space voyages. Also, and perhaps of even<br />
greater importance, these findings will aid in determining the tolerance of man<br />
to the ever-proliferating radiation sources now being encountered on Earth.<br />
The penetrating ionizing space radiations are extremely diverse in the energy<br />
range of both their particulate and their electromagnetic components. The<br />
particulate radiation component includes all subatomic particles such as protons,<br />
neutrons, electrons, atomic nuclei stripped of orbital electrons (the heavy<br />
primaries), mesons, etc. The pi meson is a charged or neutral particle and reacts<br />
to form new mesons with release of energy which in turn form electrons or<br />
positions with release of energy. K-mesons are also present in cosmic radiation.<br />
The electromagnetic portion includes the X-and gamma radiations. The<br />
417
418 Bioastronautics DataBook<br />
radiation energies lie betweem 10.3 and 10 13 million electron volts (MeV). The<br />
identifying term "ionizing" is used because these radiations penetrate matter<br />
and, in their interactions with matter, cause pairs of positive and negative ions to<br />
be formed along the path of the incident particle or photon by loss or gain of an<br />
electron. The less energetic radiations may penetrate only a fraction of a<br />
millimeter, while the more energetic can penetrate many inches of dense<br />
material such as lead. Penetration implies entry to at least 10 microns, which is<br />
slightly beyond the thickness of most cells.<br />
This chapter introduces the reader to the ionizing radiations in space and the<br />
general biological effects of ionizing radiation, but makes no attempt to establish<br />
or recommend standards of operational safety. Similarly, shielding against<br />
radiation, being an operational problem, is not discussed, though the matter is<br />
introduced because of the perturbations produced in any radiation field by any<br />
mass. (See also Radiobiological Factors in Manned Spaceflight, Langham, 1967.)<br />
The space radiations can be broadly defined as falling into one of three<br />
categories: the primary cosmic radiations, the geomagnetically trapped<br />
radiations (Van Allen belts), and the solar flare events. The solar events vary<br />
considerably from one event to the next in the differential energy spectrum and<br />
the intensity of the protons of which they are predominantly composed. The<br />
energy spectrum of solar flares also varies with time. The reader is referred to the<br />
Solar Proton Manual (McDonald, 1963) and Webber (1963) for a more thorough<br />
treatment of these potentially hazardous radiation events.<br />
The profuse and various secondary radiations generated when primary<br />
particles are stopped, and the importance of these secondaries are discussed.<br />
Common terms in radiation are defined and the concept of relative biological<br />
effectiveness (RBE) or the related quality factor (QF) is introduced. A word of<br />
warning here is appropriate. By definition (National Committee on Radiation<br />
Protection Handbook 59,1954), the biologic response to radiation is<br />
standardized to the effects produced by 200 kVp X-rays. Radiations that have<br />
the same effect are said to have an RBE of unity. Radiations with a greater<br />
effect per rad (radiation absorbed dose)-such as neutrons, low energy protons<br />
and alpha particles-are said to have an RBE greater than unity in accordance<br />
with the ratio of doses that produce the same response.<br />
RBE values are shown later, some of which are quite firmly established.<br />
Since they are generally to be applied to occupational radiation safety<br />
considerations, additional safety factors have been built in. Thus, they may be of<br />
only limited value for the evaluation of space radiations. There is also, at<br />
present, some controversy concerning the "best estimate" RBE for protons of<br />
energies equal to or greater than 100MeV. These vary from about<br />
0.6 (Sondhaus, 1962) to 1.6 (Picketing, 1963). The higher figure, derived from<br />
primate studies, may be more like that for man, since the exposure "geometry"<br />
is more typical. The reader is advised, however, not to accept any RBE value as<br />
rigorous.<br />
Attention also is given to the question of tissue depth dose, since a<br />
heterogeneous or heterochromatic radiation flux will not penetrate any mass
IonizingRadiation 419<br />
uniformlyat all depths. In addition,everysolarflareeventwill haveitsown<br />
characteristic depthdosedistribution. In thisregard, it is suggested thatthe<br />
meandosetothebonemarrowbeestimatedwherever possible, andemployed as<br />
abestestimateof thebiologically significant dose.<br />
Tile balanceof the radiationeffectssectionspresenta ratherbroad<br />
delineationof theexpectedhumanresponse to theionizingradiations. The<br />
dataassume thatdepthdosageis nearlyuniformandthatexposureof the<br />
wholebodyhasoccurred.Thesummaryof acuteradiationillnesshasbeen<br />
derivedfroma numberof sources, asindicatedin thelegends; but for the<br />
mostpart, well-documented accidentcases,casestreatedwith therapeutic<br />
radiation,andthe Hiroshima-Nagasaki survivorsform the bulk of existing<br />
experience. Doseestimatesare,therefore,uncertain.Individualbiologic<br />
variationsin responsealso occur.Therefore,indicateddose-response<br />
relationshipsmustbe considered to haveat leasta 20percenterrorof<br />
estimatein eitherdirection.A fieldwhereasyetfigurescannotbeprovided<br />
for the engineer is that of the behavioral aspectsandthe possibilityof<br />
effectsof damageto the centralnervousystemby radiationaloneor<br />
radiationcombinedwith emotional andphysical stress.<br />
All existing experiencesupportsthe assumptionthat man is<br />
comparatively radiosensitive. He hasa lowermedianlethaldose('_450R)<br />
thanobserved in mostrodents(500-750R) but is somewhat moreresistant<br />
than the averagecanine(250400R). Manshowsa longslowcourseof<br />
eventsin the typicalhematopoietic or bonemarrowsyndrome. Injury<br />
developslowly,andreachesa maximumin 3 to 6weeks. Thetestis,highly<br />
sensitiveto radiation, is damagedpromptly,butsincethisinjuryisdoneto<br />
immaturecellsthedamagemaynot appearfor somedaysandif not too<br />
severewill slowlyrecover.Recovery, in general,from the moreacute<br />
manifestations maybe protractedovermanymonthsor evenyears.Some<br />
effortshavebeenmadeto evaluateresidual or long-terminjury,butthese<br />
haveto employmanysimplifyingandthereforeinaccurateassumptions,<br />
becauseof our general inabilityto detectcriticalrecoverymechanisms and<br />
rates.TheERD(equivalent residual dose)concept is presented later,butthc<br />
usershouldnot attempt to employ any derived values for engineering design<br />
criteria. The concept is given more to enable the nonspecialist in radiation<br />
effects to gain better appreciation of the nature of the time-intensity dose<br />
variables in radiation biology. In general, if doses are kept small enough and<br />
sufficient time is allowed for recovery from earlier injury, the radiation<br />
"status" of an individual can be kept in a fairly steady state.<br />
Dose-response estimates for the eyes and skin are largely based on clinically<br />
determined responses to standard radiation sources. The space radiations are<br />
more difficult to evaluate for these effects for several reasons. Ttley include<br />
(a) particles that produce very dense ionization tracks which arc more effective<br />
in inducing lens damage, (b)large numbers of low energy particles that can<br />
produce high surface doses with negligible deep tissue dosage, and (c)the<br />
capability of inducing diverse secondary particulate and bremsstrahlung<br />
radiations that can add significantly to the burden of surface-damaging<br />
ionization.
420 Bioastronautics DataBook<br />
It is not yet possible to present a clear picture of the expected effects of<br />
partial-body exposure. Any degree of partial-body shielding and any protraction<br />
or fractionation of exposure can be advantageous. It is particularly beneficial to<br />
shield the sensitive organs or tissues, such as the gastrointestinal tract, eyes, and<br />
significant portions of the bone marrow. It should be understood that<br />
dose-response estimates of the acute radiation syndrome following partial-body<br />
exposures are impossible to make at this time; but if the major portion of the<br />
main torso is in the exposure field, the response would probably grade toward<br />
the whole-body exposure case.<br />
Lastly, some consideration is given to the general questions of long-term<br />
effects-both for the exposed individual and for subsequent generations. With<br />
the exception of the leukemia incidence estimate, the data are all based on<br />
animal experimentation. Errors of estimate are therefore unknown, and could<br />
certainly involve a factor of 2. Long-term injury is also a population<br />
phenomenon in many respects, and all statements must, therefore, be given in<br />
probability terms. Probability statements for selected individuals are thus not<br />
appropriate and can be extremely misleading.<br />
Basic references that will be found useful are: D. E. Lea, Actions of<br />
Radiations on Living Cells (1955); W. D. Claus, editor, Radiation Biology and<br />
Medicine (1958); A. Hollaender, editor, Radiation Biology (1954); U.S. Atomic<br />
Energy Commission, Proceedings of the Symposium on the Protection Against<br />
Radiation Hazards in Space (1963); United Nations Scientific Committee,<br />
Report on the Effects of Atomic Radiation (1962); United Nations Scientific<br />
Committee, Ionizing Radiation: Levels and Effects (1972).<br />
Basic Units<br />
Radiation Terms and Measures<br />
There are several units in use for describing radiation intensity and human<br />
exposure. These are interrelated as follows (Nuclear Radiation Guide, 1962):<br />
Roentgen. The basic indicator of quantity of radiation is the roentgen unit.<br />
Inasmuch as radiation cannot be measured directly, its magnitude is determined<br />
by the ionization produced by the passage of radiation through a medium. The<br />
roentgen refers to the ionization produced in air by the passage of X- or gamma<br />
radiation, specifically, that amount of radiation required to produce<br />
0.001293 grams of air ions carrying one electrostatic unit of electricity of either<br />
sign.<br />
Rad. The rad (radiation absorbed dose) is the measure of exposure in most<br />
common use. One rad of any type of radiation corresponds to the absorption of<br />
100 ergs per gram of any medium. Because the rad does not specify the medium,<br />
a medium should be stated unless clearly implied. For example, the term<br />
"tissue rad" should be used in the case of exposure of soft human tissue.
Biological Effectiveness<br />
IonizingRadiation 421<br />
The RBE (Relative Biological Effectiveness) expresses the effcctiveness of<br />
a particular type of radiation in producing the same biological response as<br />
X-or gamma radiation having a linear energy transfer (LET) equivalent to<br />
3 kilovolts per micron of water and delivered at the rate of about 10 rads<br />
per minute. For applied radiation protection, QF (quality factor) is the<br />
preferred term under most practical circumstances.<br />
Figure9-1 shows the manner in which the RBE factor is used to<br />
translate an exposure expressed in rads into one expressed in REM's. The<br />
REM (Roentgen Equivalent, Man) is the most accurate unit for expressing<br />
exposure of man. The REM refers to the absorbed dose of any ionizing<br />
radiation which produces the same biological effects in man as those<br />
resulting from the absorption of 1 roentgen of X-rays. As seen in figure 9-1,<br />
each type of radiation must be converted by a specific factor, the RBE, in<br />
order to equate the biological effects.<br />
"ROENTGEN HAD REM<br />
83 ergs/gram dry air. 100 etgs/gr'am _'_ x R}_b: _"_I'_ AppNed t_, man, a[_d<br />
Used in measuring dose any medium _--_ _orrects fur spe( lfi<<br />
from X and gamma ionization of the<br />
radiation nnly. r adiatiun.<br />
Radiation Relative Roentgen<br />
Absorbed Biological Equivalent<br />
Dose Elf el tiveness Man<br />
Figure 9-1. Relationship among principal units used in describing radiation exposure.<br />
Table 9-1 presents RBE factors for a number of types of radiation. The<br />
standard RBE values are based on the most detrimental chronic biological<br />
effect (for example, cataract induction by neutrons) for continuous low<br />
dose exposures that might be met in industrial situations. However, the<br />
RBE for many acute high dose rate exposures may be very much lower.<br />
The RBE for a large acute lethal dose of fast neutrons may be less than<br />
1.0 for man, as against the values of 5 to 10 shown in table 9-1. Also, as a<br />
given particle degrades in tissue, rite RBE will rise as its energy transfer per<br />
micron (LET) rises. At the same time, a hetcrogeneous beam of protons<br />
will have an average RBE that tends to drop with increa_ing depth in tissue<br />
as the lower energy component becomes fully absorbed and the higher<br />
energy component continues its traverse. Figure 9-2 shows instantaneous and<br />
mean RBE's for protons of different energies, corresponding to the<br />
instantaneous linear energy transfer at energy E, and the mean RBE for<br />
dissipation of the entire energy from E down to zero.<br />
Table 9-2 illustrates the manner in which the RBE (QF) value changes as<br />
a result of increasing power of X-rays or electron radiation. The relation<br />
between RBE (QF) and LET in terms of keV/pin water can be employed<br />
for virtually all end points to compen_te for differences in radiation<br />
quality.
422 Bioastronauties Data Book<br />
12<br />
10<br />
0<br />
.1<br />
Table 9-1<br />
RBE Values for Various Types<br />
of Radiation<br />
Type of Radiation RBE<br />
X-rays 1<br />
Gamma rays and bremsstrahlung 1<br />
Beta particles, 1.0 MeV 1<br />
.... 0.1 MeV 1<br />
Neutrons, thermal energy 2.8<br />
" 0.0001 MeV 2.2<br />
" 0.005 MeV 2.4<br />
" 0.02 MeV 5<br />
" 0.5 MeV 10.2<br />
" 1.0 MeV 10.5<br />
" 10.0 MeV 6.4<br />
Protons, greater than 100 MeV 1-2<br />
" 1.0 MeV 8.5<br />
" 0.1 MeV 10<br />
Alpha particles, 5 MeV 15<br />
.... 1 MeV 20<br />
(From Barbiere et al., 1958; U.S. Atomic Energy Commission,<br />
1962; Saenger, 1963.)<br />
KINETIC ENERGY (mev)<br />
2 4<br />
Figure 9-2, lnstaneous and mean RBE's for protons<br />
of various energies. (Schaefer, 1961; Sondhaus & Evans, 1969)<br />
8 10
Ionizing Radiation<br />
Table 9-2<br />
Values of RBE (QF) for Late or Delayed Effects<br />
as a Function of Average LET<br />
LEToo {keV//din Water) RBE (QF)<br />
X-rays and electrons of any LET 1<br />
3.5 or less 1<br />
3.5-7 1 --2<br />
7 -23 2-5<br />
23-53 5-10<br />
53-175 10-20<br />
(National Committee on Radiation Protection and Measurements, 1954)<br />
Equivalent Residual Dose (ERD) is a concept used in estimating what<br />
residual acute radiation injury persists for a period of weeks and months<br />
after an exposure to radiation. Thus a person exposed to radiation on<br />
Monday can be said to have a certain amount of that injury on the next<br />
Monday, something less on the next after that, and so forth. The ERD at<br />
any time, t days, after onset of exposure can be calculated on the basis of<br />
the following assumptions:<br />
1. 10 percent of the injury attributed to the dose is considered to be<br />
irreparable.<br />
day.<br />
2. The body repairs the remaining 90 percent at the rate of 2.5 percent per<br />
3. Recovery is continuous during protracted exposure. The ERD at t days<br />
may be expressed as:<br />
ERD = Do[O.1 + 0.9(1.000-0.025) t-4 ] _ l)f4t [0.1 + 0.9(l.000-O.025)tldt,<br />
where<br />
D o<br />
b<br />
= brief dose in r received during first 4 days,<br />
= protracted daily dose at a constant rate, r/day, received after<br />
the 4th day, and<br />
= time in days after onset of initial exposure.<br />
423
424 Bioastronautics Data Book<br />
Classes and Sources of Ionizing Radiation<br />
The radiation encountered in space, and to a lesser extent on Earth, may be<br />
attributed to three principal sources: geomagnetically trapped radiation, galactic<br />
cosmic radiation, and solar particle radiation. Space radiation levels vary<br />
substantially both with time and with distance from the Earth. These temporal<br />
and spatial fluctuations must be taken into account in the planning of space<br />
missions if radiation exposures are to be held to an acceptable level. Table 9-3<br />
shows the nature and location of electromagnetic and particulate ionizing<br />
radiations found in space. As indicated, most of the various radiations can be<br />
found within each of the three radiation sources noted above. Principal<br />
exceptions are alpha particles and heavy primary nuclei which are not generally<br />
associated with the radiation emanating from solar events.<br />
Table 9-3<br />
Nature and Location of Electromagnetic<br />
and Particulate Ionizing Radiations in Space<br />
Name Nature of Radiation Charge Mass<br />
Photon Electromagnetic 0 0<br />
X-ray Electromagnetic 0 0<br />
Gamma ray Electromagnetic 0 0<br />
Electron Part icl e --e<br />
Positron Part icl e +e<br />
Proton Particle +e 1840 m e<br />
or 1 a-_u*<br />
Neutron Particle 0 1841 mee<br />
Pi meson Particle +,-, 273 m e<br />
or 0<br />
Alpha particle Particle +2e 4 amu<br />
Heavy primary Particle _+3e _>6 amu<br />
nuclei<br />
*ainu = atom mau unit<br />
(Newell & Naugle, 1960; Sondhaus & Evans, 1969; Glasstone, 1958)<br />
The following sections describe the sources of the<br />
radiation of biological significance in space.<br />
Where Found<br />
Radiation belts, solar<br />
radiation (produced by<br />
nuclear reactions and by<br />
stopping electrons), and<br />
everywhere in space<br />
1 me Radiation belt and else-<br />
- where<br />
1 m e Cosmic rays, radiation<br />
-- belt, solar flares<br />
Primary cosmic rays, radi-<br />
ation belt, solar flares<br />
Secondary particles<br />
produced by nuclear<br />
interactions involving<br />
primary particle flux<br />
Cosmic rays, radiation<br />
belt, solar flares<br />
Primary cosmic radiation<br />
(nucleus of helium atom)<br />
Primary cosmic radiation<br />
(nuclei of heavier atoms)<br />
principal ionizing
Primary Radiation<br />
Ionizing Radiation 425<br />
Geomagnetically Trapped Radiation. There are two belts of geomagnetically<br />
trapped radiation around the Earth, as shown in figure 9-3. These belts, known<br />
as the Van Allen belts, are separated by a region of relatively low intensity.<br />
Figure 9-3 shows the relative intensities of both electrons and protons within the<br />
trapped radiation belts. Electrons are shown to the left, protons to the right.<br />
Both, of course, are intermingled and are separated only for clarification of the<br />
values.<br />
E LECTRONS/CM2/SEC<br />
I J I I 1 I<br />
6 5 4 3 2 I O<br />
DISTANCE FROM CENTER OF EARTH (earth radii}<br />
PROTONS/CM2/SEC<br />
I 2 3<br />
Figure 9-3. Representation of the radiations trapped in the Earth's magnetic field,<br />
known as the "Van Allen belts". (Adapted from White et al., 1969)<br />
The Van Alien radiation belts are not entirely symmetrical. In the South<br />
Atlantic Anomaly, extending from about 0 to 60 degrees west longitude and<br />
20 to 50 degrees south latitude, the trapped proton intensity for energies more<br />
than 30 MeV is the equivalent at 100 to 200 miles altitude to that at 800 miles<br />
altitude elsewhere. This is due to a perturbation or asymmetry of the Earth's<br />
geomagnetic field. For trajectories of space vehicles of 30 degrees inclination<br />
from the equator or greater, there will be approximately five traverses through<br />
this anomaly in each day. Experience with earth orbital missions to date<br />
indicates that nearly all of the accumulative radiation exposure has been<br />
attributable to passage through this geomagnetic anomaly.<br />
Table9-4 compares the total radiation exposures for Apollo missions<br />
7 through 14. Most of this exposure, it is believed, took place during the period<br />
while the vehicle was within the Van Alien belts, h is apparent that the Apollo<br />
14 crew received a higher radiation dose than crews on any prior Apollo mission,<br />
487 85F, O - 73 - 28
426 Bioastronautics Data Book<br />
but still a dose of no hazard or biological significance (Berry, 1971). In fact, the<br />
crewmembers on this flight received the largest dose experienced on any manned<br />
mission to that point in time. The Apollo 14trajectory, particularly the<br />
outbound portion, took the spacecraft close to the heart of the trapped<br />
radiation belts. Since the mission occurred at a time of solar minimum, the<br />
cosmic ray flux was relatively higher than for previous missions.<br />
Table 9-4<br />
Radiation Exposure for Apollo 14<br />
Comparisonof Apollo Missions<br />
Rad Rad<br />
Apollo 7 .16 Apollo 11 .18<br />
8 .16 12 .58<br />
9 .20 13 ,24<br />
10 .48 14 1.14<br />
(Berry, 1971)<br />
Apollo 14 Exposure(Rad)<br />
Chest Thigh Ankle<br />
CDR .996 1.095 1.073<br />
CMP 1.126 1.145 1.279<br />
LMP 1.078 1.204 1.248<br />
Galactic Cosmic Radiation. Galactic cosmic radiation, frequently referred to<br />
simply as galactic radiation, originates outside the solar system. This radiation<br />
consists of atomic nuclei which have been completely ionized and accelerated to<br />
very high energies. Protons of 1018 electron-volt energy have been identified<br />
from this source. Protons (hydrogen nuclei) constitute about 85 percent of this<br />
radiation; alpha particles (helium nuclei), about 13 percent; and heavier nuclei<br />
ranging up to fin, the remaining few percent (Jones, 1968).<br />
Cosmic activity in space is reasonably constant. Measures obtained with<br />
deep-probe rockets show little difference in intensity between 1.0and<br />
1.5 astronomical units from the sun. This would indicate that cosmic ray<br />
intensity in tile vicinity of planets such as Venus and Mars is quite similar to that<br />
found near the Earth.<br />
The galactic cosmic radiation received on Earth varies substantially both as a<br />
function of the level of solar events occurring at that time and as a function of<br />
position on the Earth's surface. Figure 94 shows the galactic radiation received<br />
at varying altitudes up to 120 000 feet during periods of minimum and<br />
maximum solar activity. The two curves are based on estimated whole-body dose<br />
to an unshielded man at about 40 degrees north latitude. These curves show<br />
that, whereas the dose rate is essentially negligible at sea level, at higher altitudes
the exposure<br />
found during<br />
Ionizing Radiation 427<br />
during periods of solar minimum is approximately twice that<br />
solar maximum.<br />
!<br />
20 40 60 80 I00 I/0<br />
Altitude. I000 Feet<br />
Figure 94. Altitude prof'desof galactic radiation level<br />
in the atmosphere. (Foelsehe et al., 1969)<br />
As seen in figure 9-5 distance from the equator has a very significant effect<br />
on exposure to galactic radiation at altitudes above 30 000 feet. Highest<br />
exposures are recorded in the polar region. At polar latitudes and at altitudes in<br />
excess of 70 000 feet, radiation levels are more than triple those found at a<br />
latitude of 30 degrees.<br />
Solar Particle Radiation. Solar activity increases in rather regular 11 year<br />
cycles and is characterized by giant eruptions from the surface of the sun,<br />
termed "solar flares." Solar flares develop rapidly and generally last only 30 to<br />
50 minutes, during which time intense radiation activity occurs. Table 9-5 shows<br />
the major solar events occuring during the period from 1956 through 1961. The<br />
peak events of this solar cycle were recorded in 1958 and 1959. This was the<br />
period showing the greatest solar particle radiation reaching the Earth.<br />
The electromagnetic radiation from a solar flare is emitted only during the<br />
visible activity. However, the solar particles continue to arrive near the Earth for<br />
a few hours to several days after the visible activity has ceased. High energy<br />
protons, alpha particles and a few heavy nuclei of Z up to 9 or 10 emitted<br />
during the flare activity constitute the radiation hazard to space travellers<br />
outside of the trapped radiation (Van Allen) belts. Neutrons have not been<br />
detected in the primary solar flare radiation.
428 Bioastronautics Data Book<br />
1.2<br />
oa<br />
O.4<br />
0<br />
0 2O 40 60 80 I00 120<br />
Altitude, I000 Feet<br />
Figure 9-5. Altitude profiles of galactic radiation level<br />
at _lar minimum. (Foelsche el al., 1969)<br />
Table 9-5<br />
Major Solar Cosmic Ray Outbursts<br />
Occurring 1956 - 1961<br />
Solar Flare Data integrated<br />
Skin Dose (rad)<br />
Date Importance >30 MeV > 100 MeV<br />
1956 Feb 23<br />
1957 Jan 20<br />
Aug 29<br />
to 31<br />
1958 Mar 23<br />
Jul 07<br />
Aug 22<br />
Aug 26<br />
1959 May 10<br />
Jul 10<br />
Jul 14<br />
Jut 16<br />
1960 May 04<br />
Nov 12<br />
Nov 15<br />
1961 Jul 18<br />
(Modified from McDonald, 1963)<br />
3+<br />
3+<br />
Uncertain flare,<br />
possibly two events)<br />
t 20<br />
60<br />
15<br />
3+ 50<br />
3+ 80<br />
3 20<br />
3 17<br />
3+ 440<br />
3+ 14_<br />
3+ 177<br />
3+ 125<br />
3+ 16<br />
3÷ 205<br />
3+ 100<br />
3÷ 27<br />
28<br />
10<br />
11<br />
19<br />
33<br />
12<br />
1.2<br />
0.7<br />
1.0<br />
0.15<br />
7.4<br />
0,07<br />
3
Ionizing Radiation 429<br />
Evidence indicates that two classes of protons are produced during flare<br />
activity. The highest energy particles, 200 to 300 MeV, arrive first, within<br />
5to 20minutes after the onset of the optical flare, and consist of<br />
high-velocity particles, about 0.6 times the velocity of light.<br />
After about one-half hour, the second class of protons arrives, the<br />
average energy of which has fallen to below 100 MeV. Maximum intensity is<br />
reached one-half hour to one day after the beginning of the solar<br />
disturbance. The intensity slowly decreases over a period of several days.<br />
The variation with time of the spectral energy distribution and the flux<br />
density (number of particles/cm2) is unpredictable.<br />
During the period of solar activity between 1956and 1962, about<br />
30 flares occurred which would have produced a total tissue dose of more<br />
than one rad (as measured with plastic phantom material placed behind<br />
approximately 0.5 gm/cm2 of aluminum) at 3000 kilometers or greater above<br />
the surface of the Earth. In four events, the potential tissue dose<br />
approached 1000 rads and exceeded 200rads in 13 other flares. With the<br />
thickness of shields on present day spacecraft, the probability of a<br />
crewmember receiving a tissue dose of greater than 100 rads during a<br />
manned 30 day mission appears to be between 5 and 10 percent. However, this<br />
calculation must be tempered by the fact that crewmembers of all manned space<br />
missions to date have received total doses considerably less than this (see<br />
table 94).<br />
The matter of variable solar particle radiation is of great importance for the<br />
selection of launch dates, particularly for long-term space missions. Table 9-6<br />
shows the maximum and minimum doses calculated as a function of mission<br />
duration for the worst and best launch dates during a single period of solar<br />
activity. Fortunately, the selection of dates so far has been quite good since<br />
astronauts have received only nominal radiation exposures.<br />
With the thrust presently available for spacecraft, it is impractical to provide<br />
the extensive shielding which would be required against high-energy protons.<br />
Thin shielding is of little value, inasmuch as protons and other charged particles<br />
give up increasingly more energy as they are slowed. The most intensive zone of<br />
ionization is at the end of their path, where it may be up to several orders of<br />
magnitude greater than at the beginning. The proton does not produce<br />
ionization having about the same LET (linear-energy-transfer) throughout the<br />
irradiated material, as would be produced by X-or gamma rays, but would<br />
produce a LET value a hundred times greater at the end of its path than at the<br />
beginning. The solar electrons encountered in space, as well as most of the<br />
remaining electromagnetic radiations, are of sufficiently low energy that they<br />
should not present a great hazard inside a vehicle, but could be hazardous during<br />
extravehicular activities.<br />
The radiations that are constantly being given off from the sun, between<br />
periods of flare activity, consist of a large number of protons and electrons<br />
of low energy, ranging from a few electron volts for the electrons to<br />
approximately 5 MeV for the protons. The protons do not exist as simple
430 Bioastronautics Data Book<br />
monoenergetic sources. They are found in complex spectra of energies and<br />
intenfities.<br />
Table 9 6<br />
Maximum and Minimum Mission Doses*<br />
for Best and Worst I,aunch Dates During Active Period of Cycle 19<br />
Mission Duration Maximum Dose (rads) Minimum Dose (rads)<br />
4 years 3492 2439<br />
3 years 3229 974<br />
2 years 2781 526<br />
1.5 years 2415 176<br />
1 year 2110 15<br />
9 months 1963 2<br />
6 months 1963 0<br />
3 months 1962 0<br />
1.5 months 1492 0<br />
1 month 1452 0<br />
2 weeks 1452 0<br />
1 week 1452 0<br />
*Surface dose inside 1 g/cm 2 uniform aluminum shielding.<br />
( Langham, 1967)<br />
Secondary Radiations<br />
One of the principal problems in developing effective shielding for the<br />
occupants of space vehicles concerns secondary radiations. Whenever primary<br />
particles strike a spacecraft and its shielding material, secondary radiations<br />
are produced. Figure 9-6 illustrates the fates of particles meeting a manned<br />
vehicle. Electrons and positrons are stopped by the vehicle wall, which then<br />
emits the bremsstrahlung (gamma rays). Protons and heavy ions may hit a<br />
target in the wall, or within the cabin, or may pass right through the<br />
structures. Wherever a target is hit, these particles produce characteristic<br />
showers of secondary particles as shown. Whenew_r a primary particle with<br />
an energy of 300MeV or greater hits a nucleus of target material,<br />
secondary particles and electromagnetic radiations are generated in great<br />
variety, as shown in figure 9-7.<br />
The absorption of radiation in matter involves the transfer of all or some<br />
portion of the incident radiation energy to an electron or nucleus in the absorber<br />
mass. This may lead, as illustrated in figure 9-7 to the production of recoil<br />
protons, neutrons, electrons, X- or gamma radiation, or many other secondary<br />
particles. The space radiations are not qualitatively different from conventional<br />
radiations in this regard, but quantitatively the production of secondaries is<br />
somewhat unique. This is due to the presence in space of particles of unusually
Ionizing Radiation 431<br />
high energies that can generate a cascade of secondary photons and particles.<br />
The exact nature of the secondaries will be a function of the incident particle<br />
and its charge and energy, the density of the absorbing or shielding material and<br />
its thickness, and the proximity of masses of different composition or elemental<br />
form (i.e., laminated shielding, capsule wall, and black boxes).<br />
PROTONS<br />
IEAVY IONS<br />
ELECTRONS<br />
•ASSUMED WALL<br />
0ENSITY : 2 _mlc mz<br />
Figure 9-6. The fates of radiation elements striking a manned spacecraft.<br />
(Modified from Grahn, 1964)<br />
Several studies have been initiated on the shielding problem, and these can<br />
be reviewed in the Proceedings of the Symposium on the Protection against<br />
Radiation Hazards in Space (1963). The biological importance of the problem is<br />
illustrated in figure 9-7 which demonstrates the buildup of secondary radiation<br />
dose in shielding material. In other words, while shielding is certainly an<br />
effective countermeasure, it does modify the quality of the radiation, which<br />
must then be considered the radiation of interest for biological consideration<br />
(Keller, 1962).<br />
The complexity of the secondary radiation and shielding problem is<br />
illustrated further in figures9-8a and 9-8b. These show the differential<br />
effectiveness of aluminum shielding against trapped protons and solar protons.<br />
Even heavy shielding is seen to be inefficient with regard to trapped<br />
protons although fairly effective with regard to solar protons. Still other<br />
shielding problems arise with intracapsular radiation sources such as might<br />
be found with isotopic power units or small reactors.
432 Bioastronautic_ Data Book<br />
"6<br />
0<br />
LEGEND<br />
i0 0<br />
INCIDENT PRIMARY PARTICLE<br />
_\ !"F' :I ? J_ \:%,; ''<br />
iiifo:5"_";°'°''li!_._:_: .....]i_;],_lF :::E°''c i<br />
Figure 9-7. Generation of secondary particles and electromagnetic radiations<br />
SECONDARY<br />
following nuclear collision. (Saylor et al., 1962)<br />
a. TRAPPED PROTONS<br />
lli 1<br />
PROTONS .<br />
SECONDARY NEUTRONS<br />
i0-1. . I . 1<br />
20 40 60 80 100 120<br />
ALUMINUM (gm/cm 2)<br />
ON ABOVE SCALE 20 = 7.4 cm<br />
O<br />
10 2<br />
101<br />
10 o<br />
i<br />
10-1 =<br />
0<br />
Figure 9-8. Effectiveness of aluminum shielding<br />
b. SOLAR PROTONS<br />
20 40 60 80 100<br />
ALUMINUM (gm/cm 2)<br />
ON ABOVE SCALE 20 = 7.4 cm<br />
of varying weight against trapped and solar protons. (Keller, 1962)<br />
120
Ionizing Radiation 433<br />
Whole Body Radiation Effects<br />
There is only limited information available concerning the effects of whole<br />
body radiation on man. Data on Japanese victims of World War II nuclear<br />
explosions constitute one source, although the relationship between exposure and<br />
aftereffects is in this case not a simple matter to interpret. Many other factors, such<br />
as the medical condition of the survivors at the time of exposure plus the<br />
complications of other injuries, make the issue a difficult one. Other data, from<br />
accidents involving radiographic equipment, industrial X-ray machines,<br />
cyclotrons, and nuclear reactors, are easier to interpret but are quite sparse.<br />
In examining the whole body radiation effects, it should be noted that<br />
reliable information has been obtained for doses from 52 to 100 rem. As the<br />
dose increases from 200 to 600 rem, the data from exposed humans decrease<br />
rapidly and must be supplemented by extrapolations based on animal studies.<br />
Nevertheless, the conclusions drawn can be accepted with a reasonable degree of<br />
confidence. Beyond 600 rem, however, observations on man are so sporadic that<br />
the relationship between dose and biological effect must be inferred or<br />
conjectured, almost entirely from observations made on animals exposed to<br />
ionizing radiations (Glasstone, 1962).<br />
Radiation Intensity<br />
Figure 9-9 shows the relationship between median survival time and acute<br />
radiation dose for mice, rats, monkeys, and man. It can be seen that man is<br />
slightly more resistant to radiation effects than the animals until the dose rate<br />
reaches a level where death is a certainty within several days or less.<br />
,,, 10 2 _<br />
I--<br />
_E<br />
10 3<br />
! ! i t LIII<br />
////X///_-<br />
I I I I I Ill[<br />
suaV,VALT,_E<br />
I l I I I Ill.<br />
"/II_YZ_. vs. DOSEAREAFOR _"<br />
.... "_ "_ HEMATOPOIETIC<br />
_"N_ DEATH IN MAN<br />
: _\ :<br />
t Hemotopoietic ! G.I. Tr=ct /Cen ol Ne you<br />
It- Depress;on '_1 "_ Denudation ,e_ System<br />
Disruption<br />
IO 0 I I I I |_,lJ I I I Itlil l I I |1111<br />
102 10 3 104 10 s<br />
DOSE- rod<br />
Figure 9 9. Relationship between median survival time and acute radiaUon dose<br />
for different species. (Langham, 1963)
434 Bioastronautics Data Book<br />
Figure 9-10 shows the probability of death, for man, within a finite period<br />
(60 days) as well as the probability of initial symptomatology (nausea and<br />
vomiting). The relation is plotted for whole body radiation dosage and first<br />
symptoms of death. For exposures in the mid-lethal range and above, nearly all<br />
persons will experience severe nausea and vomiting within 5 hours of the time of<br />
exposure with a mean time of onset of about 2 hours. These probability plots<br />
are estimates based on accumulated experience from Japanese casualties,<br />
accidental exposure to fallout, reactor incidents and clinical experience.<br />
v<br />
t--<br />
LU<br />
{E<br />
O9<br />
O<br />
e_<br />
x<br />
k13<br />
z<br />
O<br />
<<br />
<<br />
70O<br />
600<br />
5O0<br />
400<br />
300<br />
200<br />
100<br />
0<br />
0.1 1 5 10 20 3040506070 80 90 95 99<br />
PROBABILITY (%)<br />
Figure 9-10. Relationship of whole body radiation dose<br />
and first symptoms of death. (Langham, 1967)<br />
Changes in the probability of death as a function of radiation dose level and<br />
dose rate are shown in table 9-7. This table also shows the difference in the dose<br />
level producing a given probability" of death as the time during which the<br />
radiation is received ranges from I day to 1 year.<br />
The short term effects to be expected from acute whole body radiation<br />
are described in table9-8. Dose levels discussed range from lOrads, an<br />
easily survivable one-time event, to 5000 rads, an event in which ensuing<br />
death is certain for all individuals exposed. In examining table 9-8, it is of<br />
interest to note that doses of 100 to 200 rads were common in survivors of<br />
the Hiroshima and Nagasaki nuclear attacks, particularly among persons who<br />
were at some distance from the nuclear explosion (Glasstone, 1962).<br />
99.9
Ionizing Radiation<br />
Table 9-7<br />
Some Conjectured Human Tolerances<br />
OayI Wee I Month I4Months I Year<br />
A. Exposure dose (midline rads), Subcommittee No. 14 (NCRP)<br />
!<br />
LD0/time period 100 100 ] 135 200 250<br />
LD5_ 10/t ime period 165 165 I 200 270<br />
LD50/time period 300 300 340 370<br />
LD0/time period<br />
LD5_10/time period<br />
LDs0/time period<br />
B. Dose* rate (R/rain), Subcommittee No. 14 (NCRP)<br />
0.069<br />
0.115<br />
0.208<br />
0.0099<br />
0.0164<br />
0.0298<br />
• Dose = R in air in phantom midline.<br />
(National Council on Radiation Protection, 1962)<br />
0.0031<br />
0.0046<br />
0.0079<br />
0.0012<br />
0.0016<br />
0.0021<br />
Table 9-8 shows that vomiting is one of the principal reactions to acute<br />
whole body radiation. A more clear definition of the incidence of vomiting<br />
as a function of dose level is shown in figure 9-11. The line represents the<br />
most likely given dose in hundreds of rads following acute exposure and<br />
indicates the 10 percent incidence when the radiation has been protracted<br />
over one day.<br />
An idealized description of the time course of symptomatology of acute<br />
radiation illness following a mid-lethal acute exposure is shown in<br />
figure 9-12. The symptoms shown in this figure are predicated upon a radiation<br />
level of 250 to 500 rad. Of particular interest in figure 9-12 is the period around<br />
10 days following exposure when an individual for a short period may be en-<br />
tirely free of any symptoms of radiation illness.<br />
Rate-Effectiveness Factors<br />
It is apparent that a low radiation close rate, if received over a sufficient<br />
period of time, can have consequences as severe as those following a high dose<br />
rate for a short period of time. Table 9-9 presents rate-effectiveness factors (fr)<br />
which can be used to equate radiation exposures for the production of three<br />
classes of symptomatology: erythema and skin desquamation, prodromal signs,<br />
and hematological depression and lethality. In general, this table shows that<br />
a low dose must be administered for 2 to 3 times as long as that considered<br />
a high dose rate if the same biological effects are to be produced.<br />
435
436 Bioastronaulics Data Book<br />
Table 9 8<br />
Expectcd Short-Term Effects From Acute Whole-Body Radiation<br />
Dose in Rads Probable Effect<br />
10 -- 50<br />
50 -- 100<br />
100 - 200<br />
200 - 350<br />
350 -- 550<br />
550 - 750<br />
1000<br />
5OOO<br />
*Author's change.<br />
(Langham, 1967)<br />
No obvious effect, except, probably, minor blood changes.<br />
Vomiting and nausea for about I day in 5%-10% of exposed<br />
personnel. Fatigue, but no serious disability. Transient reduction in<br />
lymphocytes and neutrophils.<br />
Vomiting and nausea for about 1 day, followed by other symptoms<br />
of radiation sickness in about 25%-50% of personnel. No deaths<br />
anticipated. A reduction of approximately 50% in lymphocytes and<br />
neutrophils will occur.<br />
Vomiting and nausea in nearly all personnel on first day, followed<br />
by other symptoms of radiation sickness, e.g., loss of appetite,<br />
diarrhea, minor hemorrhage. About 20% deaths within 2--6 weeks<br />
after exposure; survivors convalescent for about 3 months, although<br />
many have second wave of symptoms at about 3 weeks. Up to 75%<br />
reduction in all circulating blood elements.<br />
Vomiting and nausea in most personnel on first day, followed by<br />
other symptoms of radiation sickness, e.g., fever, hemorrhage,<br />
diarrhea, emaciation. About 50% deaths within 1 month; survivors<br />
convalescent for about 6 months.<br />
Vomiting and nausea, or at least nausea, in all personnel within<br />
4 hours from exposure, followed by severe symptoms of radiation<br />
sickness, as above. Up to 100% deaths; few survivors convalescent<br />
for about 6 months.<br />
Vomiting and nausea in all personnel within 1-2 hours. All dead<br />
within days.<br />
Incapacitation almost immediately (minutes to hours). All personnel<br />
will be fatalities within 1 week.
99.9<br />
g9<br />
98<br />
_ 95<br />
_ 9o<br />
p-<br />
o<br />
><br />
z<br />
o<br />
z<br />
- 10<br />
5<br />
2<br />
1<br />
0.1 0.1<br />
Ionizing Radiation 437<br />
[ I I I I I I<br />
e/psycholo(Jicol<br />
0.5 1.0<br />
DOSE (hundreds of RADS)<br />
X %,Radiation protracted,<br />
about day--<br />
1 1 I I I 1<br />
5.0 10.0<br />
Figure 9-11. Incidence of vomiting as a function of radiation dose.<br />
999<br />
:E 99<br />
0<br />
k- 98<br />
>og<br />
Z 90<br />
eo<br />
ro<br />
60!<br />
z_ _o<br />
a 40<br />
o.<br />
rc<br />
20<br />
,o<br />
(Langham, 1967)<br />
Yi i<br />
',_,us-I/ I ! ', I<br />
' o': ,Nolli I \ 1<br />
,-T-T--_ 1 t"E'OR_R'0E \ ,<br />
_:=_L" _N F E CT ION -- _'_ I<br />
IT TULCERATION \ [ REOOVERY--<br />
I [ [ ] --L I __ ACCOMPANIED-<br />
I MINOR I I [ [ _ BY FATIGUE;<br />
_ S YMPTOMS_-- f ( .... SENSITiVcTY ---<br />
-- A<br />
vF<br />
.... F<br />
_-i<br />
--_50<br />
1<br />
_----<br />
I/oDEATH RATE<br />
% I0<br />
-_-AND<br />
INFECTIONS<br />
INCREASED<br />
- _ I_l 60-90 DAYS} _t- BLEEDING --<br />
I<br />
3 2..... +---_ 1 _-<br />
0 10 .... i O 20 30 410 50 6'0<br />
TIME FOLLOWING EXPOSURE (days)<br />
i - f -<br />
!<br />
7'0 80 90<br />
Figure 9--12. Changing _mptomatolog)" during acute radiation illness<br />
(From Glasstone, 1962; Saenger, 1963; and Cronkite et al., 1956)
438 Hioastronaulics Data Book<br />
High Dose Rate<br />
Table 9-9<br />
Suggested Dose-Rate or Rate-Effectiveness Factors (fr)<br />
for Early Responses Following Exposu_ to Low-LET Radiations<br />
Duration of exposure for maxi-<br />
mum effectiveness<br />
Low Dose Rate<br />
Duration of exposure for mini-<br />
mum effectiveness<br />
Ratio of total doses to produce<br />
same response level (B/A)<br />
Rate-effectiveness factor (fr)<br />
Erythema<br />
and Skin<br />
Desquamation<br />
1 --2 hr or less<br />
4 --6 days or<br />
longer<br />
1/3<br />
Duration of Exposure<br />
to Produce Same Response Level<br />
Prodromal<br />
Signs<br />
2-4 hr or less<br />
2-4 days or<br />
longer<br />
2.5<br />
1/2.5<br />
Hematological De-<br />
pression and<br />
Lethality<br />
1 -2 days or less<br />
3-4 weeks<br />
(Adapted from National Committee on Radiation Protection and Measurements, 1962;<br />
Langham, 1967)<br />
Ti$glle<br />
Radiation Effects on Specific Body Systems<br />
When radiation particles are "absorbed in human tissue, there is an irradiation<br />
effect as a particle is slowed. Figure 9-13 presents a longitudinal section of the<br />
isodose line field in tissue for the terminal section of a cosmic ray heavy nucleus<br />
of Z = 20 (Ca). In this figure, the section from 280 to 0 micron residual range is<br />
the "thindown" part.<br />
Figure 9-14 shows the calculated dose which might have been received from<br />
protons at various depths in tissue from Inner Van Allen belt and the solar<br />
proton event of 12 May 1959, assuming a spacecraft cabin providing only<br />
2 gm/cm2 of shielding. The greater drop of tissue depth-dose from flare protons<br />
as compared to inner belt protons is a function of the differences in the<br />
integral energy spectra; the greater frequency of higher energy protons in<br />
tile inner belt increases the dose rate in deep tissues. Note the importance<br />
of knowing the integrated energy spectrum of the proton radiation when<br />
considering the critical targcts-i.e., bone marrow, spleen, and intestinal<br />
locations beneath the surface.<br />
1/2
_o 6,<br />
u<br />
E<br />
2<br />
lonizing Radiation 439<br />
_\\\',_ x\\\\_ x",,\\',_ .'\\\\_ .'..\\\_ ._,._-,.-,_\\\\-.,_<br />
o_ • 2\\\ \\\V_ \\\\_ _\\\\ _\\\\ ,\\\\ _\\\\<br />
ne<br />
It.<br />
Ilt<br />
U<br />
Z<br />
t-<br />
.J<br />
C_<br />
,.v<br />
10C<br />
8C<br />
6(;<br />
4C<br />
2O<br />
0<br />
0<br />
200 400 600 800<br />
RESIDUAL RANGE FOR LIVING TISSUE - microns<br />
Figure 9-13. Longitudinal section of isodos¢ line field for terminal section<br />
of cosmic ray nucleus of Z : (Ca). (Schaefer & Golden, 1960)<br />
0 rod<br />
25<br />
00<br />
41000 2_0<br />
Iooo I<br />
250<br />
lO0<br />
25<br />
10 rod<br />
lO0O<br />
DEPTH IN TISSUE - cm<br />
5 10 15 20<br />
• • • • w w | 'w i J i i i i _ i | i !<br />
i! '-'_4 ,<br />
X'l* r '<br />
i'<br />
..= E<br />
_<br />
_<br />
_.<br />
==<br />
_<br />
1<br />
.-_<br />
I<br />
_<br />
,.<br />
_<br />
.E<br />
.;iooor, l<br />
• E • C • : •<br />
_. u .- _ • • a. =. _ 1 000'q_ Inner Van Allen b_h<br />
\, .... I ,._==,oc\ • ,<br />
•<br />
_E 10 --.-=--._Solor Ilore--<br />
_'_:,_N ,4 L-- _ _" .0}I I<br />
_._._SEL T T lOOm,, 1l=,v 1Oily<br />
" I<br />
___._ SOLAR FLARE OF MAY '59<br />
kinetic energy<br />
= |<br />
S I0 15 20<br />
DEPTH IN TISSUE - cm<br />
Figure 9-14. Calculated radiation dose from protons<br />
at various tissue depths - assuming shielding of 2 gm/cm2. (Schaefer, ] 960)
440 Bioastronautics Data Book<br />
Blood System<br />
Radiation exposure produces a number of significant changes in the various<br />
elements of the blood. The extent of these changes is shown dramatically in<br />
figure 9-15 which presents average values of blood elements for five individuals<br />
exposed to estimated doses of 250 to 350rads at the Oak Ridge Criticality<br />
Accident of 16 June 1958. Note that, whereas initial changes are seen in<br />
virtually all blood elements, the full extent o. the damage may not be apparent<br />
until 25 to 40 days following the event. In view of the observed drops in red cell<br />
mass assumably due to oxygen effect, the effect of radiation on hematocrit and<br />
hemoglobin shown in figure 9-15 may be exaggerated.<br />
II<br />
I0<br />
9<br />
,,'n,<br />
}<br />
}. 1 I I I I I<br />
1_, PLATELETS<br />
; ,s q,o3<br />
0 5 I0 15 20 25 _0 35 40 45 50 55 60 65<br />
DAYS<br />
Figure 9-15. Change in blood elements for five individuals exposed to 250 to 350 rads.<br />
(Saenger, 1963)<br />
The response of one individual to a brief whole body exposure of about<br />
130 rads of fission gamma radiation is shown in figure 9-16. The curves in<br />
this figure emphasize the long persistence of radiation injury in man. The<br />
cellular elements of the blood show an early rapid decline in number, but<br />
do not reach a minimum for 4 to 5 weeks. The blood cell count remains at<br />
about 50% of normal for over a year, yet the affected individual, in this<br />
case, expressed no outward signs or symptoms of this injury. The individual<br />
was, undoubtedly, more susceptible to infection and his general response<br />
capability to any additional stress was probably depressed throughout the<br />
period of observation. Although no direct test was made for this individual,<br />
victims of other radiation accidents have complained of a persistent fatigue<br />
for mauy months after exposure.<br />
Figure9-17 shows the limits for receipt of radiation by a human<br />
without clinically detcctablcdamage to the hematopoietic system. Individuals<br />
receiving continuous dose rates indicated on figure9-17 would be expected<br />
PT0<br />
65<br />
6O
Ionizing Radiation 441<br />
to show no overt symptoms relating to injury of blood forming tissues at<br />
the accumulated doses, dose rates, and times shown on the figure.<br />
12,000<br />
_ 10,000<br />
*' 8,000<br />
6,000<br />
0<br />
U<br />
r-, 4,000<br />
0<br />
0<br />
2,0oo<br />
l|||l It till I II111 1 1<br />
I<br />
..... O.ANO O ++ s<br />
illlil]lll<br />
4 8<br />
I<br />
/lllllllli<br />
12<br />
:lllllllll I|IIII Vlllllltlllllt<br />
......... . .....<br />
Illllllll IIIIIII llllllllllllll<br />
16 20 24 28 32 36 6 10 1,4 18<br />
DAYS WEEKS<br />
TIME AFTER EXPOSURE<br />
..--.+%_-<br />
Illllll 0<br />
10 14<br />
MONTHS<br />
Figure 9-16. Blood clcmcnt changes for one individual exposed to 130 rads.<br />
W<br />
_ 300<br />
Ot,_<br />
C3z<br />
r'_ j<br />
_._ _oo<br />
--I I<br />
_a<br />
_a: t00<br />
(Langham, 1963)<br />
400 t I I llIlil I I i llllli I ; I I;llil I ;<br />
25<br />
00001<br />
YEAR<br />
_4 MONTH. c-<br />
x_""-..,,IL.I MONTH<br />
_ I DAY<br />
I I I lluttl I I £ l IIIII I I n litinl i<br />
0.001 0.01 O. I<br />
CONTINUOUS DOSE RATE {RADSIMIN)<br />
Figurc9-17. Continuous radiation exposures at the above level should produce no<br />
injury clinically measurable to the hematopoietic system. (Modified from Langham,<br />
1967)<br />
Radiation injury, by virtue of its effect on specific blood elements, could<br />
make an individual more susceptible to disease. This is shown in figure 9-18<br />
which shows the depression of normal neutrophil count following exposure<br />
to acute radiation. Schematized levels of ncutrophils in the blood are shown<br />
for varying exposures and are related to the times when infections are most<br />
prevalent. Only neutrophils are shown here as the predominant white blood<br />
cell involved in combating acute infections. Other white blood cells<br />
(lymphocytes and monocytes) also would be depressed as a result of<br />
radiation damage.<br />
487-858 O - 73 - 29<br />
12,000<br />
10,000<br />
8,000<br />
6,000<br />
4,000<br />
2, 000<br />
I t
442 Bioastronautics Data Book<br />
¢0<br />
E<br />
I I I I I I I 1 [j_'_ --<br />
0<br />
= 100 NORMAL --4<br />
g<br />
o s0 \ _ ,c_,t,cAuPer,0D_<br />
_- ECI'IONS,//" i<br />
\ _\INF<br />
0 5 10 15 20 25 30 35 40 45 180<br />
TIME AFTER EXPOSURE (days)<br />
Figure 9-18. Sehematized levels of blood neutrophils following different radiation exposures.<br />
(Adapted from Cronkite et al., 1956; Andrews, 1962; and Langham, 1967)<br />
The effect of radiation on platelets formation is shown in figure 9-19.<br />
These curves indicate, for various exposure levels, the observed course of<br />
platelet counts over a 180 day period. Whenever platelet count falls below<br />
40 to 50 percent of normal, bh:eding and oozing from minor wounds and<br />
scrapes is hard to stop and hemorrhage is likely from such radiation-<br />
damaged tissues as the intestine.<br />
11°°<br />
a,.<br />
50<br />
o;<br />
t t I I I I 1 I<br />
NORMAL<br />
\ -I_A[)S- _ 200- 500 RADSJ<br />
.... ....<br />
i J _ i g-- i i I<br />
5 10 15 20 25 30 35 40 45 180<br />
TIME AFTER EXPOSURE (days)<br />
Figure 9-19. Observed course of platelet counts following different radiation exposures.<br />
(Latgham, 1967)
lonizittgRadiation 443<br />
Oneof themostdramaticdemonstrations of theeffectof radiationon<br />
bloodsystemscomesfrom theincrease in casesof leukemiarecorded for<br />
survivors ofthetliroshima nuclear explosion, as shown in figure 9-20. This figure<br />
shows that leukemia in Hiroshima rose from a number of approximately one<br />
case per 100 000 people in 1946 to almost 18 per 100 000 by 1951, but has<br />
decreased in recent years (Ishimaru, 1971). This can be compared with only a<br />
slight increase (about double in 1960) in leukemia incidence for the rest of the<br />
Japanese population.<br />
20,<br />
(2:<br />
-15<br />
nr<br />
ta3<br />
n<br />
O<br />
cr"<br />
t,I<br />
t3-<br />
0'3<br />
Lt3<br />
25 RJmin). Animal data clearly indicate that the response is less at low dose<br />
rates (
444 Bioastronautics Data Book<br />
Since the astronauts are healthy adult males, their susceptibility can be<br />
assumed to be less than that of the general population. The probability of<br />
achieving doses high enough to induce cancer other than leukemia or cancer of<br />
the thyroid in astronauts is slight. With doses of 50 R and above, the probability<br />
of induction of leukemia is on the order of lO'6/rad/year; that for cancer of the<br />
thyroid is in the same range, and that for other cancers is less by at least a factor<br />
of 10 (Brill etal., 1962; United Nations Committee on the Effects of Atomic<br />
Radiation, 1964).<br />
The Skin<br />
Radiation damage to the skin is of interest since this is the initial point of<br />
penetration for the radiation and also since changes are easily assessed. In<br />
general, it is found that higher radiation dose levels are required to produce<br />
demonstrable damage to the skin than is the case for the hematopoietic system.<br />
Table 9-10 shows four levels of damage occurring from acute exposure to X and<br />
gamma radiation. Note that approximately 350 rads must be received before<br />
significant changes begin to appear. In all cases, with the exception of extreme<br />
levels ill excess of 2000 rads, the principal effect is not immediate but appears<br />
instead after an interval of several days to several weeks.<br />
Table 9-10<br />
Acute Radiation Damage to the Skin From<br />
X- and Gamma Rays<br />
Wet dermatitis and<br />
Epilation Erytherna (first blistering (second Ulceration (third<br />
- loss of hair degree burns degree burns) degree burns)<br />
Rare at less<br />
than 200 r<br />
Partial epilation<br />
at 350-450 r<br />
Complete eptlation<br />
in 16-18 days<br />
at > 450 r<br />
Permanent epilation<br />
at > 700 r<br />
Hesponse is dependen!<br />
on energy, dose rate,<br />
area exposed, & corn-<br />
p[exion Of the individual,<br />
Full effect in 1 to 3<br />
weeks after:<br />
200-400 r (400 key)<br />
Response in first hours<br />
at 1000 r<br />
Effect in 1-2<br />
weeks at<br />
> I000 r<br />
Note: 1 r _ 1 radsincethesestatementsarebasedon air doses.<br />
(From Grahn, 1964,adaptedfrom Saenger,1964 & Cronkiteet al., 1956.)<br />
Rapidly progressive<br />
effect at > 2000 r<br />
Table 9-11 shows the dose level of high intensity radiation necessary to<br />
achieve a given probability level for the production of erythema and
Ionizing Radiation 445<br />
desquamation of the skin. Note that with each of the clinical signs it is necessary<br />
to essentially double the dose rate in order to progress from a 10 percent proba-<br />
bility of the symptom appearing to a 90 percent probability level. In either case,<br />
a high dose rate is required in order to produce the given symptoms. Figure 9-21<br />
shows the effect of single and fractionated radiation in producing erythema and<br />
also moist desquamation, either of which would be partially or completely<br />
disabling, particularly in the wearing of a space suit.<br />
Table 9-11<br />
Estimated Absorbed Doses of High-Intensity Reference Radiation<br />
for Production of Erythema and Desquamation of the Skin*<br />
Clinical Sign<br />
Erythema<br />
Desquamation<br />
Absorbed Dose for Probability of Response (rads)**<br />
10% 50%<br />
400 575<br />
1400 2000<br />
9O%<br />
750<br />
2600<br />
*See Early Skin Effects, p. 60, Langham, 1967.<br />
* *Site of interest for dose estimation, 0.1 mm depth; area exposed, 35 - 100 cm 2.<br />
100_ I 1 I I I w<br />
,,,, ,,,,,,1,,,<br />
_jz-<br />
1<br />
I 5<br />
i tj_l<br />
0 50<br />
Single<br />
Dose<br />
NO. OF EQUAL DAILY FRACTIONS<br />
OESOOAMATON<br />
•<br />
• I<br />
Figure 9-21. Effect of single and fractionated radiation<br />
in producing erythema and moist desquamation. (Modified from Langham, 1967)<br />
100
446 Bioastronautics Data Book<br />
Skin effects produced by exposure to electron radiation are indicated in<br />
figure 9-22. Electron radiation is of importance during extravehicular activity,<br />
the wall of the capsule being sufficiently dense for shielding. The space suit<br />
alone provides some protection. However, the abrasive and pressure effects of<br />
the space suit may make the skin more susceptible to radiation injury as is<br />
indicated in the figure (Langham, 1967; U.S. Air Force-National Aeronautics<br />
and Space Administration, 1969).<br />
Ulcerahon<br />
Loss o# Nails<br />
Permonen!<br />
_0o<br />
E pllohon i<br />
I<br />
Flbrosls 1<br />
Ptchqng in<br />
Normal Ski_;<br />
Dry<br />
Desquamat_on<br />
Pam and<br />
S_ftness<br />
Erythema<br />
and Edema<br />
itching _n<br />
Visual System<br />
Inlured Areas<br />
DOSE tN RADS<br />
500 f ,OOO<br />
w T i i _ r<br />
i t<br />
• - ACUTE ONSET' Hours to Doys Sir_le Dose<br />
• - CHRONIC ONSET Greater than 2 Mo_th$ Diwded Doses<br />
5,000 I0,000<br />
r r i ] i<br />
Figure 9-22. Skin effects produced by exposure to electron radiation.<br />
(U.S. Air Force-National Aeronautics and Space Administration, 1969)<br />
Data regarding the effect of ionizing radiation on the visual system<br />
come largely from reactions noted clinically following exposure to standard<br />
radiation sources. These data, as noted earlier, may underestimate the<br />
impact of space radiations for several reasons. First, solar or cosmic ray<br />
particles can produce very dense ionization tracks which would cause greater<br />
lens damage. Second, there are in space large numbers of low energy<br />
particles that can produce high surface damage. Third, there is the matter<br />
of induced secondary particulate and bremsstrahlung radiations that can<br />
augment the damage pattern. Figure 9-23 shows the incidence of lens<br />
opacities in man as a function of dose for X-and for gamma radiation<br />
delivered over a period of 3 weeks or less. This could be considered an<br />
acute exposure. Figure9-24 shows the time-dose relationship for the
Ionizing Radiation 447<br />
production of both cataract and non-cataract changes in the ocular lens for<br />
chronic exposures in which the exposure time is extrapolated for periods as<br />
long as 3 years.<br />
|<br />
tj_<br />
ttJ<br />
F-<br />
U<br />
O_<br />
0<br />
Z<br />
.J<br />
LL<br />
0<br />
UJ<br />
U<br />
Z<br />
a<br />
u<br />
Z<br />
I00<br />
8O<br />
60<br />
40 0<br />
/<br />
z<br />
/<br />
20 /<br />
- /<br />
200 400<br />
/<br />
I I l<br />
600 800<br />
TOTAL DOSE - fads<br />
' , O f<br />
I<br />
1000<br />
t<br />
+L<br />
1200 140O<br />
Figure 9-23. Incidence of lens opacities in man as a function of dose<br />
for X and gamma radiation delivered over three weeks or less. (Merriam & Focht, 1957)<br />
F_ _ --F<br />
I<br />
+---" " --r TT'T_ --<br />
_Z) 4©"<br />
o !<br />
z<br />
- ,oi<br />
°<br />
+<br />
i<br />
:_.._ ---5+, +<br />
BOTH CATARACT ANO NO,CATARACT CASES;<br />
_ L J i ill tll_<br />
Ot D5 IO 5 I0 50<br />
TOTAL EXPOSURE TIME (DAYS)<br />
+J .... I<br />
J<br />
IOO {iyr)500 IOOO<br />
Figure 9-24. Extrapolated relationship for the production<br />
of late indication changes in the ocular lens. (Langham, 1967)<br />
I
448 Bioastronautics Data Book<br />
Reproductive System<br />
The extent to which radiation exposure produces temporary or lasting<br />
damage to the reproductive system is an issue of concern for the planning of<br />
long duration space missions. Table 9-12 presents a summary of observations<br />
concerning the effects of high intensity X-ray exposure on spermatogenesis. In<br />
essence, it appears that at exposures of 15 to 100 rads, the response will<br />
probably be reduced fertility. From 100 to 300 rads, there will probably be<br />
temporary sterility for approximately one year or longer. Over 500 rads, the<br />
individual will probably not survive but, if so, permanent sterility would<br />
probably result.<br />
Table 9-12<br />
Summary of Observations of Effects of ttigh-Intensity Doses<br />
of X-Rays on Spermatogenesis<br />
D ose (fads) Observed Effecton Sperm Count<br />
15 Moderateoligospermia<br />
20 Moderateoligospermia<br />
50 Pronouncedotigospermia<br />
10t3 Markedoligospermi andazoospermia<br />
200 Azoospermia<br />
300 Azoospermia<br />
400 Azoospermia<br />
600 Azoospermia<br />
(From Heller,1966)<br />
There is little information available on the effects of protracted radiation,<br />
but it is probable on the basis of studies in dogs that a dose of 0.5 rem/day will<br />
produce radiation damage within one year. Exposure at an average daily rate of<br />
0.2 rem continued for 2 to 5 years will probably produce some temporary<br />
infertility. However, this would be without effect on libido or potency.<br />
Late Effects of Radiation<br />
It is characteristic of radiation damage that significant effects may not be<br />
evident for long periods of time, frequently years after the event or, as would be<br />
the case with genetic damage, even into subsequent generations. One of the most<br />
important long term features of radiation damage is a shortening of life<br />
expectancy. Figure 9-25 shows the estimated life expectancy of a 20-year old<br />
population exposed to fixed daily doses of whole body radiation, continued<br />
until time of death. Deaths would be from natural causes. While comparisons<br />
have been drawn between the effects of radiation and the normal process of
Ionizing Radiation 449<br />
aging, the analogy is not complete. When radiation is delivered over a long<br />
period, there will be approximately a 1% shortening of tile life spml per 100 fads<br />
of exposure. For short periods of exposure at ratcs above 2 rads per hour, the<br />
life shortening effect will be multiplied by 5 (Storer, 1969).<br />
45<br />
i40!<br />
>.<br />
o<br />
,,, 35<br />
O<br />
,<<br />
Z<br />
o 30<br />
>.ttt<br />
c[l<br />
>" 25<br />
U<br />
Z<br />
I--<br />
U<br />
,,, 20<br />
X<br />
1.1.1<br />
t/.J<br />
u_ 15<br />
__1<br />
\<br />
\<br />
\<br />
lOl<br />
0 0.2 0.4 0.6 0.8 1.0<br />
CONTINUOUS EXPOSURE - tad/day<br />
Figure 9-25. Estimated life expectancy of 20-year old population exposed<br />
to fixed daily doses of whole body radiation. (Adapted from Sachet & Grahn, 1964)<br />
The effect of radiation intensity on life shortening is shown in figure 9-26.<br />
These projections, based on accumulated doses of penetrating ionizing radiation,<br />
show that high intensity radiation is appreciably more damaging than is low<br />
intensity with respect to anticipated life span.<br />
Of a special concern with respect to radiation damage are possible genetic<br />
effects. Figure 9-27 shows the frequency of anticipated mutation for a total<br />
exposure dose delivered at two dose rates. The genctic effect is expressed as the<br />
probability of induction of recessive mutations in the male germ cell, since<br />
dominant lethals have relatively limited clinical significance in this selected<br />
population. Two probabilities are given: (a), for high dose-rate exposure,<br />
25 X 10-8/R/gene; (b), for low dose-rate exposure, 5 X 10⁻⁸/R/gene. Although<br />
these data were obtained from mice, man is expected to respond similarly. If he<br />
has 104 genes per germ cell, then the probability of occurrence of a new<br />
recessive mutation is that shown in the figure. Additional information on<br />
mutation rate estimates is presented in table 9-13. Again, these estimates are<br />
derived from data obtained from the mouse and extrapolated to the human.
450 Bioa_stronautics Data Book<br />
z<br />
Z<br />
u3<br />
rr"<br />
o<br />
--r-<br />
GO<br />
-q<br />
24<br />
22<br />
20<br />
18<br />
16<br />
14] 12 -- !<br />
10<br />
8<br />
6<br />
i I !....<br />
' I<br />
! . i ___<br />
HIGH INTENSITY (950 RADS/DAY<br />
INTERMEDIATE OR<br />
0 1 2 3 4 5 6 7 8<br />
ACCUMULATED DOSE (hundreds of RADS)<br />
Figure 9-26. Eife-shortenil_ effect for low and high intensity radiation.<br />
1.0<br />
0.9<br />
- /<br />
0.8<br />
0.6<br />
z<br />
o 0.7<br />
i,--<br />
0.5<br />
% 04<br />
u_ 0.3<br />
0.2<br />
0.1<br />
-- t._<br />
I I<br />
2OO<br />
I<br />
(Langham, 1967)<br />
I I<br />
I I I<br />
400 600 800 100O<br />
TOTAL DOSE - rods<br />
Figure 9-27. Probability of induction of recessive mutations<br />
in the male germ cell for different radiation exposures. (Russell et al., 1958)
IonizingRadiation 451<br />
Table 9-13<br />
Mutation Rate Estimates for Males<br />
(Derived from tile Mouse)<br />
Germ iell Stage<br />
Mutation Type Mature Immature<br />
Dominant<br />
Lethal<br />
Recessive<br />
Visible<br />
Recessive<br />
Lethal<br />
Recessive<br />
Visible<br />
Recessive<br />
Lethal<br />
A. High dose rate (>25R/min)<br />
1 X lO-3/R/gamete<br />
5 X 10⁻⁷/R/locus *<br />
1 X 10⁻⁴/R/gamete<br />
25 X 10--8/R/locus *<br />
-- 1 X 10--4/R/gamete<br />
B. Low dose rate (< 1 R/min)<br />
No_ applicable<br />
Not applicable<br />
5 X 10--8/R/locus *<br />
2 X 10--5/R/gamete<br />
*Based upon 7 selected recessive visible mutant loci. The range of induced mutations is<br />
estimated to be on the order of 6-40 X 10--5/gamete/R.<br />
(Adapted by Grahn from available data}
452 Bioastronautics Data Book<br />
References<br />
Andrews, G. A. Criticality accidents in Vinca, Yugoslavia, and Oak Ridge, Tennessee.<br />
Journal of the American Medicai Association,1962, 179, 191-197.<br />
Barbiere, R. E., Sweeton, R. F., Sakalosky, G. P., & Klatt, P. E. A radiobiolugy guide.<br />
WAD(: TR 57-118 (I), Wright Air Development Center, Wright-Patterson Air Force Base,<br />
Ohio, June 1958.<br />
Berry, C. A. Medical results of Apollo 14 - implications for longer duration space flights.<br />
Paper presented at XXIlnd International Astronautical Congress. Brussels, Belgium,<br />
September 1971.<br />
BriU, A. B., Tomonaga, M., & Heyssel, R. M. Leukemia in man following exposure to<br />
ionizing radiation, a summary of the findings in Hiroahima and Nagasaki and a<br />
comparison with other human experiences. Annals of Internal Medicine, 1962, 56,<br />
590-609.<br />
Claus, W. D. (Ed.) Radiation biology and medicine. Reading, Mass.: Addison-Wesley<br />
Publishing Company, 1958.<br />
Cronkite, E. P., Bond, V. P., & Dunham, C. L. (Eds.)Some effects of ionizing radiation on<br />
human beings. U.S. Atomic Energy Commission, T1D-5358, Washington, D.C., 1956.<br />
Foelsche, T., Mendell, R., Adams, R. R., & Wilson, J. W. Measured and calculated radiation<br />
levels produced by galactic and solar cosmic rays in SST altitudes and precaution<br />
measures to minimize implications at commercial SST-operafions. RIF-FAUSST<br />
7.3.3.02. NASA Langley Research Center, Hampton, Virginia, 1969.<br />
Glasstone, S. (Ed.) Source book on atomic energy. (2nd ed.) Princeton, New Jersey: D. Van<br />
Nostrand Company, Inc., 1958.<br />
Glasstone, S. (Ed.) The effects of nuclear weapons. Washington, D.C.: U.S. Atomic Energy<br />
Commission, 1962.<br />
Grahn, D. Radiation. In P. Webb (Ed.)Bioastronautics data book. NASA SP-3006.<br />
Washington, D.C.: National Aeronautics and Space Administration, 1964.<br />
Grahn, D. Late effects of external irradiations in animals and the prediction of low-dose<br />
effects. In Biological implications of the nuclear age. Proceedings of symposium held at<br />
Lawrence Radiation Laboratory, Livermore, California, U.S. Atomic Energy<br />
Commission, Division of Technical Information, Symposium Series CONFYo90303,<br />
1969.<br />
Heller, C. G. Radiation damage to the germinal epithelium of man. Work in progress,<br />
reported to the Space Radiation Study Panel, 1966.<br />
Hollaender, A. (Ed.) Radiation biology. Volumes I, II, and I11. New York: McGraw-Hill,<br />
1954.<br />
lshimaru, T., Hoshino, T., lchimaru, M., Okada, H., Tomiyasu, T., Tsuchimoto, T., &<br />
Yamamoto, T. Leukemia in atomic bomb survivors, Hiroshima and Nagasaki, 1 October<br />
1950-30 September 1966. Radiat/on Research, 1971, 45,216-233.<br />
Jones, W. L. Space flight. In U.S. Naval Flight Surgeon's Manual. Washington, D.C.:<br />
Government Printing Office, 1968.<br />
Keller, J.W. Long range NASA shielding requirements. In proceedings of the symposium on<br />
the protection against radiation hazards in space. U.S. Atomic Energy Commission,<br />
TID-7652, Washington, D.C., 1962.<br />
Langham, W. H. Some radiobiological aspects of early manned space flight. Paper presented<br />
at the 4th International Space Science Symposium (COSPAR), Warsaw, Poland, 1963.<br />
Langham, W. H. (Ed.) Radiobioiogical factors in manned space flight. Pub. 1487.<br />
Washington, D.C.: National Academy of Sciences-National Research Council, 1967.<br />
Lea, D.E. Actions of radiations on Living cells. (2rid ed.) Cambridge, England: Cambridge<br />
University Press, 1955.
Ionizing Radiation 453<br />
McDonald, F. B. (Ed.) Solar proton manual. NASA Technical Report R-169. Goddard<br />
Space Flight Center, Greenbelt, Maryland, December 1963.<br />
Mayo, A. M. Human activity in space cabin design. Personal equipment. Douglas<br />
Aircraft Company TP No. 540, Santa Monica, California, 1958.<br />
Merriam, G. R. & Focht, E. F. A clinical study of radiation cataracts and the<br />
relationship to dose. American Journal of Roentgenoiogy and Radiation Therapy,<br />
1957, 77, 759-785.<br />
National Committee on Radiation Protection and Measurements. Exposure to radiation<br />
in an emergency. NCRP Handbook No. 29, National Bureau of Standards, U.S.<br />
Department of Commerce, Washington, D.C., January 1962.<br />
National Committee on Radiation Protection and Measurements. Permissible dose from<br />
external sources of ionizing radiation. NCRP Handbook No. 59, National Bureau of<br />
Standards, U.S. Department of Commerce, Washington, D.C., September 1954.<br />
Newell, H. E., & Naugle, J. E. Radiation environment in space. Science, 1960, 132,<br />
1465-1472.<br />
Pickering, J. E. Biological effects of whole-body proton irradiation. Aerospace<br />
Medicine, 1963, 34, 942-943.<br />
Russell, W. L., Russell, L. B., & Kelly, E. M. Radiation dose rate and mutation<br />
frequency. Science, 1958, 128, 1546-1550.<br />
Sachcr, G. A., & Grahn, D. Survival of mice under duration-of-life exposure to gamma<br />
rays. I. The dosage-survival relation and the lethality function. Journal of the<br />
National Cancer Institute, 1964, 32, 277-321.<br />
Sacnger, E. L. (Ed.) Medical aspects of radiation accidents. Washington, D.C.: U.S.<br />
Atomic Energy Commission, 1963.<br />
Saylor, W. P., Winer, D. E., Eiwen, C. J., & Carriker, A. W. Space radiation guide.<br />
AMRL TDR 62-86, 6570th Aerospace Medical Research Laboratories, Aerospace<br />
Medical Division, Wright-Patterson Air Force Base, Ohio, August 1962.<br />
Schaefer, H. J. Tissue ionization dosages in proton radiation fields in space. Aerospace<br />
Medicine, 1960, 31, 807-816.<br />
Schaefer, H. J. A note on the RBE of proton radiation in space. USN AMC 61-18,<br />
U.S. Naval School of Aviation Medicine, Pensacola, Florida, January 1961.<br />
Sehaeffer, H. J., & Golden, A. Solar influences on the extra-atmospheric radiation field<br />
and their radiobiological implications. In Otis O. Benson, Jr., & Hubertus Strughold<br />
Physics and medicine of the atmosphere and space. New York: John Wiley & Sons,<br />
1960.<br />
Sondhaus, C. A. Biological effects of high energy protons. In Proceedings of lhe<br />
symposium on the protection against radiation hazards in space. TID-7652, U.S.<br />
Atomic Energy Commission, Washington, D.C., 1962.<br />
Sondhans, C. A., & Evans, R. D. Dosimetry of radiation in space flight. In F. H.<br />
Attix, W. C. Roeseh, & E. Tochilin Radiation dosimetry, sources, fields,<br />
measurements and applications. Vol. 111. (2nd ed.) New York & London: Academic<br />
Press, 1969.<br />
Storer, J. B. Late effects: extrapolation to low dose rate exposures. Health Physics,<br />
1969, 17, 3-9.<br />
Report of the United Nations Scientific Committee on the Effects of Atomic<br />
Radiation. General Assembly Official Records: 17th Session, Supplement No. 16<br />
(A/5216), New York, 1962.<br />
Report of the United Nations Scientific Committee on the Effects of Atomic<br />
Radiation. General Assembly Official Records: 19th Session, Supplement No. 14<br />
(A/5814), New York, 1964.
454 Bioastronautics DataBook<br />
United Nations Scientific Committee. Ionizing Radiation: Levels and effects. Effects.<br />
Vol. 2. United Nations Publication No. E72IX18, Annex 8, 1972.<br />
U.S. Air Force-National Aeronautics & Space Administration Ad Hoc Committee on<br />
Electron Therapy. Final Technical Documentary Report. Brooks Air Force Base,<br />
Texas, December ]969.<br />
U.S. Atomic Energy Commission. Proceedings of the symposium on the protection<br />
against radiation hazards in space, Gaflinburg, Tennessee, November 1962. AEC<br />
TID-7652, Book 1: Radiation environment in space; effects of space radiation on<br />
radiosensitive objects; biological effects of space radiation, Washington, D.C.: U.S.<br />
Atomic Energy Commission, 1963.<br />
U.S. Atomic Energy Commission. Proceedings of the symposium on the protection<br />
against radiation hazards in space, Gatlinburg, Tennessee, November 1962. AEC<br />
TID-7652, Book 2: Shielding against space radiations, Washington, D.C,: U.S.<br />
Atomic Energy Commission, 1963.<br />
Watanabe, S. On the incidence of leukemias in Hiroshima during the past fifteen years<br />
from 1946 to 1960. Journal of Radiation Research, 1961, 2(2), 131-140.<br />
Weber, W. R. In An evaluation of the radiation hazard due to solar particle events.<br />
Aerospace Division, Boeing Company, Seattle, Washington, 1963.<br />
White, T. T., Robbins, D. E., & Hardy, A. C. Radiation environment for the<br />
1975-]985 space station program. MSC Document No. MSC-00183, NASA Manned<br />
Spacecraft Center, Houston, Texas, October 1969.
CHAPTER 10<br />
TOXICOLOGY<br />
by<br />
J.D. MacEwen, Ph.D.<br />
SysteMed Corporation<br />
Dayton, Ohio<br />
Rapid advances in the United States manned spacecraft programs have<br />
emphasized the importance of careful environmental control of space cabin<br />
atmospheres. The need for control applies not only to the concentrations of<br />
breathing gases at various cabin pressures but also to the levels of contaminants<br />
present in the environment. A unique aspect of toxicology has been developed in<br />
an attempt to provide the information necessary for the establishment of safe<br />
levels of space cabin contaminants.<br />
Both facilities and techniques have been developed in recent years to explore<br />
the toxicological problems of space flight under simulated flight conditions, with<br />
the exception of weightlessness. These research programs are designed to<br />
establish safe limits for environmental contaminants under continuous exposure<br />
conditions of space flight and to define emergency tolerance limits for accidental<br />
situations. The information derived from these programs unfortunately lags<br />
behind the general advances of the space program and consequently many<br />
atmospheric limits have had to be established by committee action to provide<br />
engineering guidelines. The _lection of limits by any committee is based on<br />
available toxicological information for each material considered. This<br />
information, frequently sparse, has been based on acute exposures of short<br />
duration or, at best, chronic daily exposures simulating industrial working<br />
conditions. The circumstance of the immediate need for contaminant limits for<br />
non-comparable conditions frequently causes selection of limits having<br />
extremely large safety factors for use until better information can be obtained.<br />
Provisional limits for a number of space cabin contaminants, with such safe_ +<br />
factors, have been established for 90 and 1000 day continuous exposures by the<br />
Panel on Air Standards for Manned Space Flight (1968).<br />
A discussion of tile terminology of the units of contaminant concentration is<br />
in order since the conventional units of parts per million (ppm) is applicable<br />
Reviewed by Ralph Wands, M.D., National Academy of Sciences.<br />
455
456 Bioastronautics DataBook<br />
onlyat thenormalatmospheric pressureof 760mmHgexperienced hereon<br />
Earth.NASAhaschosen todefinecontaminant concentrations asmillimolesper<br />
25cubicmeters(mmole/25M3)sincethenumberbeforetheunitisessentially<br />
the_me asfor ppm,whicbis basedonstandardtemperature andpressure<br />
conditions. In additionto otherreasons, theuseof molaritypermitsdirect<br />
interpretation of thestandards in thelightof availablebiochemical knowledge.<br />
Othergroupshaveselected theunit of milligramspercubicmeter(mg/M_)<br />
whichexpresses the concentration in termsof volumeregardless of absolute<br />
pressure. Thelattertermalsoiscomparable withunitsinusebytoxicologists for<br />
setting industrial threshold limits on contaminants. The experimental data<br />
presented in this chapter are given with units of ppm or mg/M 3 wherever<br />
applicable since these are the terms used in the research cited.<br />
Oxygen Toxicity and The Effects of Variations<br />
In Oxygen Partial Pressure on Toxicity<br />
The advent of manned space flight brought about a need for information<br />
concerning the physiological and toxicological response of animals and humans<br />
to prolonged exposure in enriched oxygen environments at reduced pressure.<br />
While considerable information had been obtained concerning the toxicity of<br />
oxygen at atmospheric pressure by Bert (1878), Bean (1953), Comroe and<br />
Dripps (1945), Ohlsson (1947), and Weir et al. (1965) and at hyperbaric<br />
pressures by Bean (1945) and Smith ct al. (1932), little was known concerning<br />
the toxic response of man or other species to oxygen under hypobaric<br />
conditions.<br />
Herlocher et al. (1964) measured the physiological response of men exposed<br />
to essentially pure oxygen at 258 mm Hg pressure (5 psia) for a 30-day period.<br />
Their clinical observations indicated that no significant changes occurred which<br />
were not associated with the prolonged confinement of these men. Robertson et<br />
•M. (1964) described respiratory studies conducted on the human subjects used in<br />
the experiment reported by Herlocher. The most significant result of this study<br />
was that vital capacities decreased on depressurization to 250 mm Hg. The entire<br />
gas supply to the chamber was essentially pure oxygen, which resulted in an<br />
•alveolar pO2 of 177 mm Hg as opposed to the normal alveolar pO2 of<br />
100 mm Hg cited by Dittmer and Grebe (1958). These investigators found that<br />
the vital capacity of the individual test subjects returned to normal immediately<br />
upon repressurization to ambient atmospheric conditions.<br />
Since hematopoietic decreases at increased partial pressures of alveolar<br />
oxygen tension had been previously reported (Helvey et al., 1963, Mammen et<br />
al., 1963, and Morgan et al., 1963), Zalusky et al. (1964) studied the<br />
hematopoietic parameters of the subjects included in the study reported by<br />
tlerlocher et al. (1964). These investigators found that no significant decreases<br />
occ/,rred during a 30-day exposure period with the exception of a slight change<br />
in hematocrit values.<br />
Continuous exposure studies on animals conducted in reduced pressure<br />
chambers at Wright-Patterson Air Force Base showed increased mortality in rats
Toxicology 457<br />
exposed to 100 percent oxygen at 5 psia pressure. McNerney and MacEwen<br />
(1965) reported that the rodent mortality was uniform in all chambers whether<br />
a contaminant was present or not. Ambient air control rats did not exhibit a<br />
similar mortality pattern. Subsequent experiments conducted by MacEwen and<br />
Haun (1966) determined that this was a strain-specific effect of the Wistar rats<br />
used and was not related to reduced pressure-enriched oxygen environments.<br />
The more important finding of those studies was the clearer understanding of<br />
oxygen toxicity at near ambient pressures. The mortality observed at various<br />
absolute oxygen pressures is illustrated in figure lO-1. While dogs and mice<br />
exhibit essentially a similar pattern of oxygen toxicity response, the albino rat is<br />
shown to be much less susceptible to oxygen toxicity than any of the other<br />
three species tested, as had been reported earlier by Smith et al. (1932) and by<br />
Boycott and Oakley (1932). Rhesus monkeys were not as consistent as the other<br />
species in their mortality response but no mortality was seen at total oxygen<br />
pressures below 600 mm Hg.<br />
>-<br />
100<br />
,_ 5c<br />
iel-<br />
O<br />
-- DOGS<br />
--_-- MICE<br />
--_ _ _ ---- RATS<br />
N \<br />
N\<br />
\ -<br />
\ %<br />
, I -._<br />
750 700 650 600<br />
PRESSURE (ram Hg)<br />
Figure lO-l. Oxygen toxicity mortality at varying absolute<br />
near-ambient pressures in experimental animals,<br />
Kistler et a1.(1967) described the pathological picture of oxygen toxicity at<br />
760 mm Hg pO 2 to be one of pulmonary edema with resolution of the edema<br />
resulting in morphometic changes in the air-blood barrier. Death appears to<br />
result from the acute pulmonary edema formed. Dickerson (1964) and Kydd<br />
(1967) have shown that tile lowest oxygen pressure that will produce acute<br />
pulmonary edema in the rat is about 650 mm ttg although rats surviving a<br />
30-day exposure to oxygen at 516mm Hg pressure were found to have<br />
thickening of the walls of small blood vessels of the lungs associated with<br />
pulmonary hypertension. Kydd (1968) showed that precxposure of rats to<br />
518mmitg total oxygen pressure decreased the mortality expected at<br />
487-858 0 - 73 - 30
458 Bioastronautics Data Book<br />
760 mm Hg pO 2. He postulated that this protective effect was due to<br />
development of maximal lymphatic drainage of lung fluids formed at the lower<br />
pressure so that drainage was still in excess of fluid formation even at<br />
760 mm Hg pO2.<br />
Continuous long-term exposures of four animal species to 100 percent<br />
oxygen at 5 psia pressure was reported by Kaplan et al. (1968). This exposure of<br />
dogs, monkeys, mice, and rats, conducted for 8 months, produced no evidence<br />
of systemic oxygen toxicity. Electron microscopy showed changes in the lungs<br />
of these dogs and rats that could be related to the oxygen exposure as reported<br />
by Lewerenz et al. (1967). The change seen was minimal in nature and could not<br />
be associated with any apparent pulmonary functional deficit.<br />
A similar study of continuous exposure of the same animal species to a<br />
mixture of 68 percent oxygen and 32 percent nitrogen at 5 psia was described<br />
by Fairchild (1967). In these studies, verified by a second 8 month continuous<br />
exposure to the same conditions one year later, the only significant and<br />
repeatable finding was the depression of growth of male rats in the test<br />
environment. The prolonged breathing of pure oxygen at near ambient or<br />
hyperbaric pressure has been shown to produce pathologic changes, such as<br />
pulmonary edema, and death. However, none of the controlled laboratory<br />
experiments with animals or humans breathing pure oxygen at reduced pressures<br />
(pO 2 less than 400 mm Hg) has shown any harmful effect.<br />
Effects of Oxygen on the Toxicity of Ozone and<br />
Nitrogen Dioxide<br />
The effect of variation in oxygen partial pressure upon the acute toxicity of<br />
inhaled ozone and nitrogen dioxide has been reported by MacEwen (1966).<br />
One-hundred percent oxygen at 258 mm Hg was shown to be protective against<br />
the acute effects of ozone exposure. Table 10-1 shows the results of a series of<br />
experiments in which animals were exposed continuously to 8.0 mg/M 3 ozone<br />
for a 14-day period. Increased partial pressure of oxygen resulted in reduced<br />
mortality among mice, rats, dogs and monkeys. Differences were also observed<br />
in the lung weight to body weight ratios, shown in table 10-2 for the various test<br />
environments. The intermediate pO 2 of the mixed gas environment resulted in<br />
the highest weight ratio while exposure of monkeys at near ambient pressure<br />
resulted in an essentially normal pattern.<br />
These studies demonstrated differences in time of onset and severity of toxic<br />
responses in animals to 03 and NO2. While a beneficial protective effect of<br />
increased 02 partial pressure against 03 toxicity was shown, it was only<br />
demonstrated up to a pO2 of 260 mm Hg. Higher 02 concentrations may not be<br />
protective,.as shown by Mittler (1958), and in fact, may be synergistic in action.<br />
A protective action of 02 against NO 2 toxicity was not clearly shown,<br />
although increasing pO2 to 260 mm Hg appeared to prolong the life of animals<br />
exposed to lethal concentrations. There was, however, a reduction of mortality<br />
response in both mixed gas and 100 percent 02 reduced pressure (5 psia)<br />
environments compared to ambient pressure conditions.
Toxicology<br />
Table 10-1<br />
Mortality Produced During 14-Day Continuous Exposure<br />
to Ozone - 8.0 m_M 3-<br />
Total pressure (ram Hg)J 700 260<br />
pO 2 (ram Hg) J 140 175<br />
I<br />
I<br />
g:7<br />
Exposure Conditions<br />
Gas supply I Air 68% O 2-<br />
32% N 2 I<br />
Mice<br />
Rats<br />
Guinea pigs<br />
Dogs<br />
Monkeys<br />
260<br />
26O<br />
100% 0 2<br />
Species (No. deaths/No. Controls)<br />
33/40<br />
50/50<br />
8/8<br />
5/5<br />
214<br />
32/40<br />
45/50<br />
9/9<br />
6/8<br />
1/4<br />
33/40<br />
45/50<br />
818<br />
2/8<br />
0/4<br />
Toxicity of Fuels and Oxidizers<br />
720<br />
260<br />
36% 0 2<br />
64% N 2<br />
0/8<br />
0/4<br />
700<br />
260<br />
36% 0 2-<br />
64% N 2<br />
One criterion for the selection of compounds as suitable propellant fuels and<br />
oxidizers is that their combustion exhaust gases consist of low molecular weight<br />
species since the specific impulse (thrust/unit mass of fuel) is an inverse function<br />
of that molecular weight. Therefore compounds selected as fuels must be highly<br />
reactive materials containing elements of low atomic weight. Usually the more<br />
reactive fuels and oxidizers are more reactive with one another than they are<br />
with biological materials. This high reactivity generally results in a high order of<br />
toxicity in the more useful fuels and oxidizers.<br />
Hydrazines<br />
Hydrazine and its mcthylated derivatives meet the criteria for propellant<br />
fuels and are used as such. The Titan II rocket uses a mixture of hydrazine and<br />
unsymmetrical dimethylhydrazine (UDMH) as a fuel while both the Gemini and<br />
Apollo space vehicles use monomothylhydrazine (MMH) in their attitude control<br />
systems.<br />
A comprehensive review of research on the pharmacology and toxicology of<br />
propellant hydrazines by Clark et al. (1968) reports 273 studies on these<br />
compounds. Further studies on MMH toxicity have been reported by Itaun et ai.<br />
(1968) and MacEwen and Vernot (1970).<br />
The acute toxicity of all the proilellant hydrazines manifests itself on the<br />
central nervous system resulting in convulsions and death. Death usually occurs<br />
during or immediately following a severe convulsive seizure. The principal<br />
difference between these compounds in their acute effects is the dose required<br />
16/40<br />
15/50<br />
2/8<br />
0/9<br />
459
460 Bioastronautics Data Book<br />
o _.<br />
o,.. E<br />
0 '-,_ ,.-=<br />
Lrd<br />
OZ<br />
OZ<br />
¢-<br />
_ _ o o<br />
oo o. oq<br />
O0 O0<br />
• , . .<br />
oq ol _
Toxicology 461<br />
to initiate the convulsive action. Jacobson et al. (1955) reported the relative<br />
order of toxicity for hydrazine and its methylatedderivatives as shown in<br />
table 10-3. Similar data were reported by Weir et al. (1964). MMH is<br />
approximately twice as toxic as UDMH and symmetrical dimethylhydrazine<br />
(SDMH) and is at least five times more toxic than hydrazine. In general, there is<br />
a species gradient for the acute toxicity of the propellant hydrazines with rats<br />
and monkeys least susceptible and mice and dogs most susceptible. Since<br />
susceptibility of the various species to these compounds does not show a<br />
consistent pattern based on progression in size, it is impossible to predict where<br />
man falls in this order. Therefore, any use of such toxicity data in establishing<br />
safety standards must utilize the results of the most susceptible species.<br />
Hvdrazine<br />
Compound<br />
Methylhydrazine<br />
uns-Dimethylhydrazine<br />
s-Oimethylhydrazine<br />
Table 10-3<br />
LCs0 Values of Rats and Mice Exposed<br />
Four Hours to Hydrazine Derivatives<br />
Species<br />
Rats<br />
Mice<br />
Rats<br />
Mice<br />
Rats<br />
Mice<br />
Rats<br />
LC50<br />
(ppm) (mg/M 3)<br />
570 750<br />
252 330<br />
74 139<br />
56 105<br />
252 618<br />
172 423<br />
280-400 _*<br />
* Lower limit is not calculable from the data.<br />
** Rough estimate.<br />
(Jacobson et al., 1955)<br />
19/20<br />
Confidence<br />
Limits<br />
(ppm)<br />
71- 78<br />
50 -- 110<br />
219 - 290<br />
150- 194<br />
Slope<br />
7.32<br />
3.79<br />
28.50<br />
4.96<br />
8.65<br />
8.52<br />
S.E. of<br />
Slope<br />
Subacute exposures to monomethylhydrazine have been shown to produce<br />
decreased performance in trained primates at subconvulsive doses by Reynolds<br />
and Back (1966). Similar changes in the learned performance of cats have also<br />
been reported by Sterman et al. (1968). Reynolds and others (1963, 1964)<br />
reported changes in primate learned behavior and discrete avoidance tasks.<br />
Kidney damage has been reported from hydrazine exposure by Weatherby and<br />
Yard (I955) and by Krop (1954). MMH-indueed kidney damage was described<br />
by Pinkerton et al. (1967), George et al. (1968), and Sopher et al. (1968). A<br />
decrease in renal blood flow resulting from hydrazine exposure was also<br />
described by Coe and Korty (1967).<br />
1.8<br />
1.6<br />
7,9<br />
2.2<br />
2.8<br />
1.9
462 Bioastronautics Data Book<br />
Acute cffccts and death from severe propellant hydrazine exposures may be<br />
prevented by rapid therapeutic treatment using barbiturates or barbiturates in<br />
combination as suggested by Azar et al. (1970). Phenobarbital or other<br />
barbiturate preparations will suppress the convulsant seizures and provide<br />
protection through the acute intoxication phase until the propellant hydrazine<br />
has metabolized. It has been shown that pyridoxine, a form of vitamin B, will<br />
prevent fatty liver changes from hydrazine. A method of pyridoxine treatment<br />
has been recommended by Back et al. (1963).<br />
The chronic effects of UDMH exposure have been reported by Rinehart et<br />
al. (1960). They exposed three dogs daily to a 5 ppm UDMH concentration for a<br />
6-month period. The exposed dogs were lethargic throughout the exposure<br />
period and exhibited a mild hemolytic anemia (approximately a 15 percent<br />
depression of hematologic values) which persisted. A similar 3-month exposure<br />
of dogs to 25 ppm UDMH resulted in a more profound hemolytic anemia with<br />
one death. The 6-month exposure of the dogs to 5 ppm UDMII is the basis for<br />
the current threshold limit value (TLV) of 0.5 ppm used for occupational health<br />
conservation as cited in the Documentation of the Threshold Limit Values<br />
(1971).<br />
A recent 6-month chronic toxicity study on MMH (TLV of 0.02 ppm) was<br />
reported by MacEwen and Vernot (1970). This study exposed dogs, rats, mice,<br />
and monkeys to 5 ppm and 2 ppm concentrations on a 6 hour/day, 5 day/week<br />
basis. Definite dose-related responses were shown in mice with 29 percent<br />
mortality at 5 ppm and 17 percent at 2 ppm. Similar dose-related effects were<br />
seen in rats with significant depression of growth rate and increased liver and<br />
kidney organ-to-body weight ratios. Both dogs and monkeys exhibited<br />
methemogiobinemia and Heinz body formation. A moderate hemolytic anemia<br />
was seen in dogs (approximately 15 percent depression of hematologic values)<br />
arid increased red blood cell fragility. Only a marginal hemolytic response was<br />
seen in monkeys. The response seen in these chronic exposures of dogs to MMH<br />
was almost identical with that seen by Rinehart with UDMH. Most important, a<br />
no-effect level was not achieved, which suggests that further consideration<br />
should be given to the safety margin of the industrial TLV values.<br />
Propellant Oxidizers<br />
The oxidizers of most interest in propellant reactions that have been used or<br />
have a high potential for use are oxygen, fluorine, nitrogen trifluoride (NF3) ,<br />
chlorine trifluoride (CIF3) , chlorine pentaflouride (CIFs), oxygen difluoride<br />
(OF2) and the dimer of nitrogen dioxide, nitrogen tetroxide (N204). Since<br />
oxygen toxicity is primarily a function of 02 partial pressure (and total<br />
pressure) creating biological damage only when either too high or low, it will not<br />
be discussed further.<br />
Fluorine. Fluorine and FLOX (a mixture of fluorine and oxygen) have been<br />
used as oxidizers for rocket fuels. The acute toxicity of fluorine in animals has<br />
been described by Stokinger (1949), Eriksen (1945), and Keplinger and Suissa<br />
(1968). ltuman experience with this compound has been reported by Machle<br />
and Evans (1940). Lyon (1962), Rickey (1959), Belles (1965) and Keplinger
Toxicology 463<br />
(1969).The signs of fluorine toxicity below lethal concentrations are irritation<br />
of the eyes, nose and lungs. According to Keplinger, this effect begins at an air<br />
concentration of approximately 25 ppm F 2. When lethal exposure occurs, the<br />
degree of irritation is increased with coughing, wheezing, and severe lacrimation.<br />
Death usually occurs within 12 to 18 hours after severe exposure from<br />
pulmonary congestion. Experimentally, animals that survived any exposure level<br />
for 48 hours went on to recovery.<br />
Repetitive animal exposures to fluorine at sublethal levels have produced<br />
increased fluoride content of the long bones in all species tested. Thus the signs<br />
associated with chronic fluorosis may be expected to occur if toxic levels of<br />
fluoride are built up and released systemically. The industrial TLV is based on<br />
this effect.<br />
Oxygen Difluoride. An important member of the family of fluorine<br />
containing gaseous oxidizers is OF2 which has been reported to be a severe<br />
pulmonary irritant. Rodent exposures to as little as 10 ppm for 10 minutes have<br />
been shown by LaBelle (1945) and Lester and Adams (1965) to cause death.<br />
Death results from asphyxiation subsequent to severe pulmonary edema and<br />
hemorrhage. The odor of OF 2 resembles garlic and is perceptible somewhere<br />
between 0.1 and 0.5 ppm. Since a TLV for this gas has been established at<br />
0.5 ppm, its odor is thought to be a safe warning property. There have been<br />
reports of OF 2 exposure of research chemists at three different industrial plants.<br />
All of these people were sufficiently aware of the hazard of breathing OF 2 and,<br />
when its odor was noticed, they immediately left the exposure area. Each of the<br />
men exposed to OF 2 complained of soreness of the chest which disappeared<br />
within 3 days with no further effects. Their estimated exposure levels were<br />
below 10 ppm in each case.<br />
A human exposure to OF 2 was investigated by MacEwen and Vernot (1969)<br />
who concluded that the man had been briefly subjected to an air concentration<br />
of approximately 1000 ppm. His survival and complete recovery after several<br />
days of severe respiratory distress were inconsistent with the toxicity data<br />
derived from rodent inhalation exposures. Therefore, more comprehensive<br />
studies on OF 2 toxicity were undertaken. These studies reported by MacEwen<br />
and Vernot (1970) showed that dogs and monkeys were less sensitive to the<br />
effects of OF 2 by a factor of 10, having a 1.hour LCs0 * value of 26 ppm as<br />
compared with approximately 2 ppm for rats and mice. If this difference in<br />
toxicity levels is related to the difference in size, then it would help to explain<br />
the survival of the man exposed to 1000 ppm OF2.<br />
Chronic exposures of rodents to 0.1 ppm OF 2 for 5 weeks were conducted<br />
by LaBelle (1945) with no measurable effect.<br />
Chlorine Trifluoride. Chlorine trifluoride (CIF3) is a highly reactive<br />
compound with strong oxidizing properties approaching that of fluorine itself.<br />
This compound, characterized by Grisard et al. (1951), has been successfully<br />
used as a fluorinating agent in numerous reactions which customarily require<br />
elemental fluorine.<br />
*Lethal concentration which kills 50 percent of animals by inhalation route.
464 Bioastronautics Data Book<br />
One of the earliest studies on the toxicity of CIF3 was made by Horn and<br />
Weir (1955). Chronic inhalation studies were made on dogs and rats exposed to<br />
sublethal concentrations of the gas for periods up to 6 months. Acute effects of<br />
CIF3 on rodents have been reported by Dost et al. (1968). The reactivity of<br />
CIF3 is such that it is highly unlikely that it reaches the lung of exposed subjects<br />
unchanged. One of the major breakdown products of this chemical compound in<br />
air is hydrogen fluoride (HF), and their biological effects are identical. CIF 3 is<br />
very irritating to the eyes and nose and, in animals, has been shown to produce<br />
pulmonary edema, hemorrhages, and emphysema, frequently leading to death.<br />
Experiments reported by MacEwen and Vernot (1970) showed essentially no<br />
difference in response between animal species and a reasonable correlation<br />
between LC50 levels for HF and CIF 3 on an equimolar fluorine basis. It is<br />
reasonable, then, that the health and safety limits for CIF 3 are one third those of<br />
flF.<br />
Nitrogen Trifluoride. The acute toxicity of nitrogen trifluoride (NF3) has<br />
been shown by Ruff (1931), Torkelson et al. (1962), Dost et al. (1968), and<br />
Vernot and Haun (1969) to be due to massive formation of methemoglobin,<br />
with death ensuing from the resulting anemia. Death seldom occurs unless the<br />
methemoglobin level exceeds 75 percent, beyond which the oxygen carrying<br />
capacity of the blood is reduced below that required to supply the needs of<br />
body tissues, particularly the brain. Animal experiments conducted by Vernot<br />
and Haun showed that survivors of near-lethal exposures (50 to 75 percent<br />
methemoglobin formed) have a Heinz body type of hemolytic anemia with<br />
destruction of approximately 35 percent of the red blood cells (RBC). In<br />
healthy animals the RBC loss stimulates reticulocyte activity and new cells begin<br />
forming. The time of lowest RBC values occurs ',about 10 days after exposure,<br />
and full recovery to normal RBC levels requires approximately 40 days. There is<br />
little species variation in respon_ to NF3 exposure, as shown in table 10-4, with<br />
the exception of the dog which is more susceptible to lteinz body anemia<br />
regardless of etiology than the others.<br />
Table 10-4<br />
Nitrogen Trifluoride LCs0 Values for Various Species (ppm)<br />
Time(min) Rats Mice Dogs Monkeys<br />
15 26 700 19300 38800 24 000<br />
30 11 700 12 300 20 200 14 100<br />
60 6700 7500 9600 9200<br />
From a toxic hazard point of view, NF3 is probably thc safest of the<br />
fluorinated oxidizers and would be the chemical of choice if other factors, such<br />
as specific impulse, were equal.<br />
Chlorine Pentafluoride. There is very little known about the biological<br />
action of chlorine pentafluoride (CIFs). Dost and his associates (1969) have<br />
studied its effects on plants and fish and report it to be chemically less reactive
Toxicology 465<br />
with air and water vapor than CIF 3. It is also slightly less toxic than CIF 3 to<br />
plants, microorganisms, and fish. The only animal exposure data available,<br />
reported by Weinberg and Goldhamer (1967), is limited both in the variety of<br />
species tested and in the scope of inhalation toxicity studied. From the data<br />
available, it may be estimated that CIF 5 is slightly more toxic to animals than<br />
CIF 3. Necropsy results were similar to those seen from most strong oxidizing<br />
chemicals, marked pulmonary edema and hemorrhage with congestive changes in<br />
other visceral organs. During the subacute exposure of rats to 100 ppm CIF 5 for<br />
15 minutes per day for 6 days, respiratory enzyme activity (glutamic oxaloacetic<br />
transaminase) was absent in the lungs, but all other criteria of physiological<br />
status were normal. Ten-minute exposures to CIF5 of 400 ppm concentration<br />
produced 100 percent mortality, while 200 ppm produced only a partial lethal<br />
response in rats.<br />
Nitrogen Tetroxide. Nitrogen tetroxide is an equilibrium mixture of<br />
nitrogen tetroxide (N204) and nitrogen dioxide (NO2). This equilibrium shifts<br />
toward NO2 at lower pressure and increased temperature, and NO 2 is, therefore,<br />
the more common form to which man is exposed. Health and safety limits for<br />
N204 are one-half what they are for NO 2 since the dimer form is exactly twice<br />
as reactive with biological materials. Nitrogen dioxide can be identified by its<br />
distinct odor in concentrations as low as 5 ppm, its current threshold limit value.<br />
It is mildly irritating to the eyes, nose, and upper respiratory mucosa at<br />
concentrations of lOto 20ppm, and, unfortunately, higher concentrations<br />
cannot be distinguished since no further irritation is experienced until significant<br />
pulmonary injury has been produced.<br />
Concentrations of NO2 above 100 ppm will cause death after a relatively<br />
short exposure. Death results from asphyxia subsequent to massive pulmonary<br />
edema. Exposures to concentrations of NO 2 as low as 40 ppm for periods of<br />
4 to 6 hours have produced death in all common experimental animal species.<br />
NO 2 is probably the most dangerous to man of all irritant gases because it is<br />
so commonly found. Its release in industrial accidents has caused many deaths.<br />
As is often the case in accidental exposures to toxicants, the NO 2 concentrations<br />
producing death in man have never been quantitatively identified but have been<br />
estimated to be slightly in excess of 100 ppm. Experimental evidence of acute<br />
NO2 toxicity in primates and other species suggests, however, that exposure to<br />
50 ppm for 6 to 8 hours might be fatal to man. It is because of the increasing<br />
evidence that NO 2 acute toxicity effects may occur at such low atmospheric<br />
concentrations that the threshold limit value has been reduced several times<br />
since it was first established at 25 ppm, to the current 5 ppm level. A _fety<br />
factor of 10 below the lethal dose level is relatively small, when one considers<br />
that the safety factors used for many other industrial chemicals or contaminants<br />
are greater than 10 below nonlethal effect levels. It should also be noted that<br />
persons with chronic respirator), disease-asthma, chronic bronchitis, and<br />
emphysema-are more adversely affected by NO2 than are healthy individuals.<br />
There are many conflicting reports regarding the effect of NO2 on animals<br />
under conditions of either repeated or continuous exposure. Wagner et al.<br />
(1965) exposed six species of animals 6 hours per day, 5 days per week to three
466 Bioastronautics DataBook<br />
concentrations of NO2 (1,5and25ppm)for18monthswithoutproducingany<br />
demonstrable morphologic changes or significant changes in anyof theusual<br />
indicesof normalphysiological status.Greyet al.(1952),however, reported<br />
emphysema andpneumonitis in ratsexposed4hoursperday,5daysperweek<br />
for6weeksto9to 13ppmNO2.<br />
Theresults of reported continuous NO2 exposures are also conflicting.<br />
Freeman and Haydon (1964) exposed rats to 25 ppm of NO 2 for about<br />
150 days and produced strikingly voluminous lungs, a 50 percent reduction in<br />
growth rate, and eventual death. At 12.5 ppm, these investigators reported an<br />
l l percent mortality after 213 days which was associated with 20 percent<br />
decrement in growth and increased respiration rate in the survivors. Haydon et<br />
al. (1965) reported no mortality or evidence of pulmonary disease or<br />
abnormality in body or lung weight in rats exposed for 16 weeks to 4 ppm,<br />
although the rats sacrificed exhibited the early histopathologic changes<br />
associated with higher concentrations. Rats exposed for 90 weeks to 0.8 ppm<br />
showed only a dight increase in respiration rate. Freeman et al. (1968) reported<br />
continuous 3 ppm NO2 exposures of rats for 2 years produced pulmonary<br />
changes. Terminal and bronchiolar epithelium was affected by a loss of<br />
exfoliative activity, loss of cilia, and the appearance of crystalloid cellular<br />
inclusion bodies. They believed that the morphologic evidence suggested a<br />
reduction of the pulmonary cleansing function of the lungs particularly in the<br />
peripheral regions.<br />
Continuous exposure to 0.5 ppm NO2 for 3 months or longer has been<br />
_lown by Ehrlich and Henry (1968) to significantly increase the susceptibihty of<br />
mice to airborne Klebsiella pneumoniae. Henry et al. (1969) also reported that a<br />
single 2 hour exposure of mice to 3.5 ppm NO 2 either before or after the<br />
inhalation of an aerosol of Klebsiella pneumoniae resulted in significantly<br />
increased mortality.<br />
A significant epidemiologic study of the effects of exposure to NO2 was<br />
reported by Shy et ai. (1970a, b). They found an increased rate of respiratory<br />
illness in families and a reduced forced expiratory pulmonary volume in children<br />
exposed to an average NO 2 concentration ranging from 0.062 to 0.109 ppm.<br />
Conversely, Steadman et al. (1966) exposed animals continuously to five<br />
concentrations of NO 2 ranging approximately from 0.5 ppm to 11.5 ppm for a<br />
period of 90 days. ±Mthough 20 to 50 percent mortality was seen in several<br />
species at the higher concentration, 0.5 and 5 ppm exposures produced no<br />
significant effect on any biological parameters measured (nor were any<br />
morphologic changes attributable to the NO 2 exposure seen). Similar 90 day<br />
continuous exposures of rats, mice, monkeys, and dogs to 5 ppm NO 2 were<br />
reported by MacEwen and Geckler (1968) in which only transient signs of stress<br />
were seen with no significant morphologic or biochemical changes.<br />
Data from chronic human exposure are equally confusing. Patty (1963)<br />
reported that exposures of men to average NO 2 concentrations ranging from<br />
10 to 20 ppm for 18 months produced no ill effects. Vigdortschik et al. (1937),
Toxicology 467<br />
on the other hand, reported symptoms of NO2 toxicity after 5 years of daily<br />
exposures at approximately 2.Sppm. The symptoms included possible<br />
bronchitis and emphysema.<br />
There are numerous other liquid propellant fuels and oxidizers that have<br />
either been used or seriously considered for use that are not discussed in this<br />
chapter. For the convenience of the users of this handbook, some of the physical<br />
and chemical properties of these compounds, along with toxicity data and safety<br />
hmits, are listed in table 10-5, in increasing order of toxicity. Additional<br />
information on the properties and handling procedures for these propellant<br />
chemicals may be found in the report of the JANNAF Hazards Working Group<br />
(1970).<br />
Compound<br />
Nitrogen Trifluoride (NF 3)<br />
Hvdrazine (N2H 4)<br />
Hydrogen Fluoride (HF)<br />
1, 1-Dimethylhydrazine<br />
(UDMH)<br />
Chlorine Pentafluoride<br />
(CIF 5)<br />
Chlorine Trifluoride (CIF 3}<br />
Nitrogen Dioxide<br />
(NO 2 -- N20 4}<br />
Monomethylhydrazine<br />
(MMH)<br />
Fluorine (F 2)<br />
Diborane (B2H 4)<br />
Oxygen Difluoride (OF 2)<br />
Pentaborane (B5H 9)<br />
*Proposed.<br />
** Estimated from partial data.<br />
Table 10-5<br />
Some Physical and Toxic Properties<br />
of Propellant Fuels and Oxidizers<br />
Boiling<br />
Point<br />
(°C)<br />
-129<br />
113.5<br />
19.7<br />
63<br />
-13.1<br />
11.8<br />
21.2<br />
87.5<br />
- 188<br />
-- 93<br />
- 145<br />
6O0<br />
Vapor Pressure<br />
at 80°F<br />
(ram Hg, approx)<br />
104<br />
3790<br />
1375<br />
1158<br />
52<br />
207<br />
Carbon Monoxide<br />
Rat 60 Min<br />
LC50<br />
(ppm)<br />
-- 6700<br />
16 2280<br />
985 1275<br />
1410<br />
468 Bioastronautics Data Book<br />
resulting in oxygen starvation of body tissues. The concentrations of CO that are<br />
dangerous to life are shown in figure 10-2. It is not the lethal effects that are the<br />
basis of the scientific controversy, however, but the level of CO which will<br />
produce impairment of human mental functions. It is generally believed that<br />
subjective symptoms of CO intoxication rarely occur below blood carboxyhemo-<br />
globin (COHb) levels of 20 percent, while acute signs of central nervous system<br />
embarrassment occur at COHb levels greater than 30 percent (Haldane, 1927).<br />
Figure 10-2. Effects of CO on man as a function of concentration and exposure time.<br />
Lightly shaded band shows region of milder effects; heavily shaded band, dangerous or<br />
lethal region. Solid lines indicate exposure limits set by militaw services for aircraft. The<br />
point marked at 0.005% CO (50 ppm) and 480 min is current TLV for 8-hr/day exposure in<br />
industry. (Department of Defense, 1958; ttaldane, 1895; Henderson & Haggard, 1922;<br />
Sayers et al_, 1922)<br />
Reccndy, a number of investigators have suggested that the central nervous<br />
system is impaired at COHb levels as low as 2 to 5 percent. MacFarland et al.<br />
(1944) demonstrated impairment of visual discrimination with COHb levels of<br />
4percent. Trouton and Eysenck (1961) reported decrement in limb<br />
coordination at the same COHb levels. Schulte (1963) reported consistent<br />
impairment in cognitive and psychomotor performance at COHb levels of
Toxicology 469<br />
5 percent with beginning tendencies for disLuption as low as 2 percent COHb,<br />
while Beard and Wertheim (1967) reported a decrement in auditory discrimina-<br />
tion of tone signal duration at estimated COHb levels from 4 to 5 percent.<br />
Contradictory findings have been reported by equally competent scientists.<br />
Clayton et al. (1960) found no association between COHb level and automobile<br />
accidents, although Rockwell and Ray (1967) reported a possible effect of CO<br />
exposure on estimation of distances between following automobiles in fatigued,<br />
CO-exposed drivers with COHb levels of 5 to 10 percent. Mikulka et al. (1969)<br />
reported no observable impairment on a battery of psychomotor performance<br />
tasks in young men with COHb levels up to 12 percent. These findings were<br />
confirmed by Hanks (1970). Stewart et al. (1970) found no untoward effects on<br />
central nervous s2cstem function in sedentary males at COHb levels below<br />
15 percent, while exposures resulting in higher blood COHb levels caused<br />
delayed headaches, changes in visual evoked response, and impairment of manual<br />
coordination.<br />
Current standards for emergency exposures to carbon monoxide are bascd<br />
on air concentrations which will not produce COHb levels greater than<br />
15 percent. When sufficient data are accumulated to settle the controversy on<br />
the possible influence of lower COHb levels, these standards may be lowered. In<br />
order to clarify the relationship between CO atmospheric concentrations and<br />
COHb blood levels, blood saturation rate curves are shown in figure 10-3 for rest<br />
and light work. An increase in work effort decrea_s the time required to reach<br />
the equilibrium level. Both sets of equilibrium curves originate from 0.5 percent<br />
COHb, which is about the normal level resulting from catabolism. An increase in<br />
CO concentration will produce a corresponding increase in CO|tb to a new<br />
equilibrium value that is not additive with the previous level.<br />
Prolonged exposures of experimental animals to CO have shown that<br />
environmental adaptation occurs. Back and Dominguez (1968) and Back (1969)<br />
reported a series of experiments in which monkeys were continuously exposed<br />
to CO for periods up to 105 days to CO concentrations of 50, 200, and<br />
400 ppm. No detectable effect on learned performance was seen in reaction time<br />
to visual and auditory signals or in work output of the monkeys. The failure of<br />
CO to impair these functions in monkeys having COHb levels up to 33 percent<br />
was thought to be due to a concomitant increase in red blood cells and total<br />
hemoglobin, which was shown by Vernot et al. (1970) to occur in other species<br />
as well. The increase of total hemoglobin resulted in sufficient oxygen delivery<br />
to tissues to prevent cellular hypoxia.<br />
While sudden exposures to high atmospheric concentrations of CO may<br />
cause impairment of human ability to perform tasks critical for survival, it is<br />
believed that the slow buildup of CO concentration in a closed environment,<br />
such as a spacecraft, while not desirable, will cause an adaptive increase in<br />
hemoglobin and red blood cells that will permit normal functioning at elevated<br />
COHb levels and, more important, survival.
470 Bioastronautics DataBook<br />
100<br />
SO<br />
i0 _<br />
i<br />
I<br />
_CO UPTAKE-LIGHT ACTIVITY<br />
-- -- -CO UPTAKE-AT REST<br />
1000 PPM<br />
I 2 3 4 5 6 7 8 9 IO<br />
HOURS EXPOSEO<br />
Figure 10-3. Carbon monoxide uptake in man.<br />
(Derived from data of Forbes et al., 1945)<br />
Spacecraft ThreshoM Limit Values<br />
Experimental data for establishing spacecraft continuous exposure limit<br />
values are extremely limited. The continuous exposure of animals to<br />
contaminants is a difficult and expensive task and therefore has been done only<br />
with a few materials. The needs and problems associated with this type of<br />
research has been described by Back et al. (1962) and Thomas (1968). The first<br />
reports of results of continuous prolonged exposures of animals to probable<br />
spacecraft contaminants were given by Sandage (1961a,b) and by House (1964).<br />
Additional studies have been reported by MacEwen and Geckler (1968) and by<br />
Jones et al. (1970).<br />
As a beginning step in establishing spacecraft exposure limit values, the Panel<br />
on Air Standards for Manned Space Flight of the Space Science Board-National<br />
Academy of Sciences proposed provisional limits for a few materials identified as<br />
spacecraft contaminants. The provisional long-term exposure limit values are<br />
shown in table 10-6. The panel decided that U.S. Navy submarine standards were<br />
suitable as guidelines for space mission limits for 90-day exposures but could not
Toxicology 471<br />
be extrapolated for longer missions since interplanetary flight is not easily<br />
aborted, and return to Earth may take weeks or months. A list of chemical<br />
contaminant submarine TLV values is given in table 10-7. For simple alaphatic<br />
hydrocarbons not listed, the 90-day limit is 60 mg/M 3 and for simple aromatic<br />
hydrocarbons other than benzene, it is 10 m,,ffM3. MacEwen and Geckler (1968)<br />
recommended 90-day spacecraft exposure limit values of l ppm for NI)2,<br />
0.01 ppm for ozom_ and 0.5 ppm for carbon tctrachloride.<br />
Table 10-6<br />
Provisional l,imits for Space Cal_in (_ontaminants<br />
n-Butanol<br />
2-Butanone<br />
Air Contaminant<br />
Carbon monoxide<br />
Chloroform<br />
Dichloromethane<br />
Dioxane<br />
Ethyl acetate<br />
Formaldehyde<br />
2-Methylbutanone<br />
Trichloroethylene<br />
1,1,2-Trichloro, 1,2, 2-<br />
trifluoroethane & re-<br />
lated congeners<br />
for 90 and I 1)()() I)ays<br />
Air Limit in PPM<br />
90 1000<br />
Days Days<br />
10 10<br />
20 20<br />
15 15<br />
5 1<br />
25 5<br />
10 2<br />
40 40<br />
0.1 0.1<br />
20 20<br />
10 2<br />
1000 200<br />
(Data from National Academy of Sciences, Space Science<br />
Board, 1968)<br />
Emergency Exposure Limits (EEL)<br />
Provisional emergency limits for spacecraft contaminants were established by<br />
the NAS Panel on Air Standards for Manned Space Flight for five materials as<br />
shown in table 10-8. These limits are intended only as guidelines for a single<br />
exposure which does not reoccur during the flight.<br />
Emergency exposure limits for use in fuel manufacturing, storage, and<br />
handling have been established by the NAS/NRC Committee on Toxicology for<br />
a number of chemicals including some propellant fuels and oxidizers. Some of<br />
these EEL values are shown in table 10-9. EEL values are intended only as<br />
guidelines for selection of engineering criteria for storage limitations. By<br />
definition, an EEL is a limit for an accidental exposure which would normally<br />
not be repeated in a lifetime. It is based on a contaminant dose which is not
472 Bioastronat,ti_ Data Book<br />
expected to produce any irreversible physiologic changes and will permit the<br />
conduct of emergency duties and escape from the environment. EEL's are<br />
closely related to specific circumstances of exposure and should not be used for<br />
different conditions without first verifying their applicability. These values<br />
should never be exceeded since they contain little or no safety factor.<br />
Table 10-7<br />
U.S. Navy Submarine Contaminant Concentration Limits<br />
(ppm)<br />
1 Hr 24 Hr 90 Day ACGIH TLV*<br />
Acetone -- 2000 30 1000<br />
Acetylene - 2500 2500 2500<br />
Ammonia 400 50 25 50<br />
Benzene - 100 1 25<br />
Carbon Monoxide 200 200 25 50<br />
Chlorine - 1 0.1 1<br />
Dichlorodifluoromethane 30 000 20 000 1000 1000<br />
1, 1, 2, 2-Tetrafluoro-<br />
1,2-Dichloroetha ne 30 000 20 000 1000 1000<br />
Ethyl alcohol - 500 100 1000<br />
Hydrogen - 3000 3000 -<br />
Hydrogen Chloride 10 4 1 5<br />
Hydrogen Fluoride 8 1 0.1 3<br />
Methane - 5000 5000 -<br />
Methyl alcohol - 200 10 200<br />
Methyl Chloroform 350 1000 500 200<br />
Monoethanolamine 50 1 0.5 3<br />
Nitrogen Dioxide 10 1 0.5 5<br />
Ozone 1.0 0. I 0.02 0.1<br />
Phosgene 1.0 0.1 0.05 5<br />
Sulfur Dioxide 10 5 1 200<br />
Toluene - 100 - 200<br />
1,1,1 -Trichlorethane 1000 500 200 350<br />
Xylene - 100 -- 100<br />
*American Conference of Governmental Industrial Hygienists, 1966.<br />
Spacecraft Contaminants<br />
The appearance of contaminants in space cabins during flight is caused by<br />
_veral factors, none of which can be completely eliminated. The factors are:<br />
(l) outgassing of cabin construction materials under reduced pressure<br />
conditions, (2)volatile metabolic waste products of the crew, (3)volatile<br />
components of spilled food, and (4)leaks from the environmental or flight
Toxicology 473<br />
control systems. Contaminants found in submarines differ only in the area of<br />
outgassing from construction materials but have additional sources due to the<br />
increased amount of operational machinery. Many of the contaminants found in<br />
manned spacecraft simulation tests were also found in some of the Mercury and<br />
Apollo space flights.<br />
Table 10-8<br />
Provisional Emergency Limits<br />
for Space Cabin Contaminants<br />
Air Contaminant<br />
2-Butanone<br />
Carbonyl fluoride<br />
Ethylene glycol<br />
2-Methylbutanone<br />
1, 1,2-Trichloro, 1,2,<br />
2, 2-trifluoroethane<br />
and related congeners<br />
Air Limit for 60 Min<br />
(ppm} I (rag/M3)<br />
100 294<br />
25 68<br />
1O0 254<br />
1O0 352<br />
30 000 2320<br />
(Data from National Academy of Sciences,Space Science<br />
Board, 1968)<br />
A type of spacecraft contaminant which has received little notice consists of<br />
particulate pollutants which are not easily removed from the air under<br />
conditions of weightlessness. Although a spacecraft cabin is cleaned many times<br />
before use, some dust may remain in inaccessible places and become airborne by<br />
mechanical means during flight. Other sources of particulate contamination are<br />
foodstuffs, abraided flight uniforms, and powdering from painted surfaces.<br />
Particles have been seen by astronauts in flight but information is lacking on<br />
particle size and concentration. Particulate removal is accomplished to a limited<br />
degree in the filter section of tile air handling system. Additional sources of<br />
particulate contamination in future space flights may be found when<br />
regenerative life support systems are placed ill operational spacecraft.<br />
A comprehensive list of contaminants found in space flight to date, in<br />
submarines, and in some of the simulated space flight tests conducted at the<br />
USAF School of Aerospace Medicine is given in table 10-10. This list also<br />
includes the contaminants found ill Sealab II and in the McDonnell Douglas<br />
Corporation_ 60-day manned test of a regenerative life-support system (1968).<br />
This list, although not complete, contains 88 contaminants that were common<br />
to many of the space flights and spacecraft simulator runs and are also found in<br />
cabin material off-gassing studies. Although the presence of these contaminants<br />
has been verified, httle or no information is yet available about the<br />
concentrations present in the spacecraft. Until the contaminant concentrations<br />
can be a_essed, no judgments can be made concerning the toxic hazard of a<br />
space cabin environment.<br />
487-858 O - 73 - 3i
474 Bioastronautics Data Book<br />
Acrolein<br />
Table 10-9<br />
Emergency Exposure Limits of the Committee<br />
on Toxicology NAS/NRC<br />
(ppm)<br />
Compound 10 Min 30 Min<br />
Aluminum fluoride 25 mg/M 3 10 mg/M 3<br />
Aluminum oxide 50 " 25<br />
Ammonia (anhydrous) 500 ppm 300 ppm<br />
Boron trifluoride 10 5<br />
Bromine pentafluoride 3 1.5<br />
Carbon disulfide 200 100<br />
Carbon monoxide<br />
(normal activity) 1500 800<br />
(mental acuity) 1000 500<br />
Chlorine pentafluoride 3 1.5<br />
Chlorine trifluoride 7 3<br />
Diborane 10 5<br />
1, 1-Dimethylhydrazine 100 50<br />
Ethylene oxide 650 400<br />
Fluorine 15 10<br />
Formaldehyde - -<br />
Hydrazine 30 20<br />
Hydrogen chloride 30 20<br />
Hydrogen fluoride 20 10<br />
Hydrogen sulfide 200 100<br />
JP-5 5 mg/I 5 mg/I<br />
Monomethylhydrazine<br />
(MMH) 90 ppm 30 ppm<br />
Nitrogen dioxide 30 20<br />
Nitrogen trif luoride - 100<br />
Oxygen d if luoride 0.5 0.2<br />
Perchloryl fluoride 50 20<br />
Sulfur dioxide 30 20<br />
Sulfuric acid 5 mg/M 3 2 mg/M 3<br />
Tellurium hexafluoride 1 ppm 0.4 ppm<br />
1,1,2-Trichloro-1,2,<br />
2-trifluoroethane<br />
(Refrigerant 1 13)<br />
50 Min<br />
0.2 ppm<br />
7 mg/M 3<br />
15 "<br />
300 ppm<br />
2<br />
0.5<br />
5O<br />
400<br />
20O<br />
0.5<br />
1<br />
2<br />
30<br />
250<br />
5<br />
3<br />
10<br />
10<br />
8<br />
5O<br />
2.5 mg/I<br />
1 5 ppm<br />
10<br />
50<br />
10<br />
10<br />
0.1<br />
1 mg/M 3<br />
0.2 ppm<br />
1500 ppm
Acetaldehyde<br />
Acetic Acid<br />
Acetone<br />
Acetylene<br />
AIIvI Alcohol<br />
Ammonia<br />
Contaminant<br />
Amyl Acetate<br />
Benzene<br />
1-3 B utadiene<br />
n-Butane<br />
2-Butanone<br />
1-Butene<br />
2-Butene cis, trans<br />
n-Butyl Alcohol<br />
iso-Butyl Alcohol<br />
iso-Butylene<br />
Butyraldehyde<br />
Carbon Disulfide<br />
Carbon Monoxide<br />
Chlorobenzene<br />
Chlorofluoroethylene<br />
Chloroform<br />
Chloromethane<br />
Cyclohexane<br />
Cyclopentane<br />
1-2, D ichloroethane<br />
2-2, D imethylbutane<br />
2-3, Dimethylbutane<br />
Dioxene<br />
Ethane<br />
Ethanethiol<br />
Ethyl Acetate<br />
Freon 12<br />
Freon 22<br />
Freon 113<br />
Freon 114<br />
Furan<br />
n-Heptane<br />
n-Hexane<br />
Hexene<br />
Ethyl Alcohol<br />
Ethyl benzene<br />
Ethylene<br />
Ethyl Ether<br />
*See notes at end of table.<br />
Toxicology 475<br />
Table 10 -10<br />
Contaminants Found in Confined Spaces<br />
During Actual or Simulated Space Flights<br />
_urces*<br />
1 2 3 4 5 6 7 8 9 10 11 12 13 14 15 16 17<br />
XX XXXXXXXX X<br />
XXXXXXXXXXXXXXXX<br />
X XX XXX<br />
XXX X X<br />
XXX<br />
X X x<br />
X XX X xxx XXXX<br />
X X x<br />
XXXX X x XXX xx<br />
XX X XXXX xx<br />
X X X X X X<br />
XX X X X<br />
XX X X XX<br />
X X XXX X<br />
XX<br />
X X X X<br />
XXX<br />
X X X<br />
XX XXX<br />
X X<br />
XXX<br />
x X XXX<br />
x XX X<br />
XXXX XXXXX<br />
XX XX<br />
XX XXXXXXX<br />
XXX X XXX<br />
XXXX<br />
XXXXXXXX<br />
XXX<br />
x x X<br />
XXX X XXX xxx<br />
X X X x<br />
X XX X X<br />
X<br />
X<br />
X x X X<br />
XXX XXX X<br />
X x X<br />
XX XXX X<br />
x xXx<br />
X XXX XXX<br />
XXX XXXX xxx<br />
X x<br />
XXXXXXXXXXXXXXXXX<br />
XXX XXX<br />
XX X XXX X X<br />
XX XXXX<br />
X<br />
X<br />
X
476 Bioastronautics Data Book<br />
Contaminant<br />
Ethyl Formate<br />
p-Ethyl Toluene<br />
Formaldehyde<br />
Freon 11<br />
Hydrogen<br />
Hydrogen Fluoride<br />
Hydrogen Sulfide<br />
I ndene<br />
Isoprene<br />
Isopentane<br />
Methane<br />
Methyl Alcohol<br />
2-Methylbutanone-3<br />
Methyl Chloride<br />
Methyl Chloroform<br />
Methyl Cyclopentane<br />
Methylene Chloride<br />
Methyl Cyclohexane<br />
Methyl Ethyl Benzene<br />
Methyl Ethyl Ketone<br />
Methyl Isobutyl Ketone<br />
Methanethiol<br />
2 or 3-Methyl Pentane<br />
Methylsiloxane Polymers<br />
Methyl Thiophene<br />
Nitrogen Oxides<br />
Pentafluoroethane<br />
Pentane<br />
iso-Pentane<br />
iso-Pentene<br />
Perchloroethylene<br />
Propane<br />
Propene<br />
Propionic Acid<br />
n-Propyl Alcohol<br />
iso-Propyl Alcohol<br />
Propylene<br />
Sulfur Dioxide<br />
Toluene<br />
1, 1,1-Trichloroethane<br />
*See notes at end of table.<br />
Table 10-10 (Continued)<br />
Contaminants Found in Confined Spaces<br />
During Actual or Simulated Space Flights<br />
Source*<br />
1 2 3 4 5 6 7 8 9 10 11 12 13 14 15 16 17<br />
X X<br />
X X x<br />
XX<br />
xxxx<br />
x<br />
X<br />
X<br />
X X<br />
X X<br />
X x<br />
X X<br />
X X<br />
x<br />
X<br />
XXX<br />
X<br />
X XXX<br />
X X X<br />
X X<br />
XXXXXXX<br />
X XX<br />
X XXX<br />
XXXXX<br />
XXX<br />
X XXXXX<br />
X<br />
X<br />
X<br />
X<br />
XX X<br />
XXX<br />
XXX<br />
X XXXX<br />
XXX<br />
X XX<br />
x x<br />
XX XXXXX<br />
X X<br />
XXX<br />
X<br />
X<br />
X<br />
XX<br />
x X<br />
xxx<br />
XXXX<br />
X x<br />
xxx<br />
XX<br />
XX XXX<br />
XXXX XXX<br />
xx XXX<br />
X<br />
XXXX X<br />
x<br />
X X X<br />
X X X<br />
X<br />
x X<br />
X X X X<br />
x<br />
X X<br />
x<br />
X<br />
X x<br />
x X<br />
X X X<br />
x<br />
X<br />
X<br />
X x<br />
X x<br />
X X<br />
X X<br />
X X<br />
X X<br />
X<br />
X<br />
X X<br />
X X<br />
X x<br />
x X<br />
X<br />
x<br />
X X<br />
X<br />
X X<br />
X X X X X<br />
X
Contaminant<br />
Toxicology 477<br />
Table 10-10 (Continued)<br />
Contaminants Found in Confined Spaces<br />
During Actual or Simulated Space Flights<br />
SOUFCe*<br />
1 2 3 4 5 6 7 8 9 10 11 12 13 14 15 16 17<br />
Trichloroethylene x x x x x x x x<br />
Trimethyl Pentane x x x<br />
Vinyl Chloride x x x x x x<br />
Xylene x x x x x x x x<br />
*Note: Data originally reported in publication of the National Academy of Sciences' Space<br />
Science Board (1968) from the following sources:<br />
SOURCE LIST<br />
1. Mercury Spacecraft: Saunders (1962), Samonski (1967)<br />
2. Apollo GT-3: Panel on Air Standards for Manned Space Flight (1968)<br />
3. Apollo GT-4: Panel on Air Standards for Manned Space Flight (1968)<br />
4. Apollo GT-5: Panel on Air Standards for Manned Space Flight (1968)<br />
5. Apollo GT-7: Panel on Air Standards for Manned Space Flight (1968)<br />
6. Apollo GT-10: Panel on Air Standards for Manned Space Flight (1968)<br />
7. Apollo GT-12: Panel on Air Standards for Manned Space Flight (1968)<br />
8. SAM-I: Conkle et al. (1967)<br />
9. SAM-II: Conkle (1966)<br />
10. SAM-Ill: Adamsetal.(1966)<br />
11. MESA I: Saunders (1967A), Cotton et al. (1966)<br />
12. MESAII: Cottonetal.(1966)<br />
13. Integrated Life Science Systems Tests: Hodgkiss et al. 11967), Toliver et al. (1966)<br />
14. Offgassing Tests: Hodgson et al. (1966), Pustinger et al. (1966)<br />
15. Submarines: Naval Research Lab Reports<br />
16. SeaLab I1: Saunders (1967B)<br />
17. Life Support System: McDonnell Douglas (1968)<br />
Another possible source of future contaminant generation may be the<br />
thermal reaction products formed by small electrical fires or contaminant<br />
removal systems. One such material was identified in a manned life support test<br />
(MESA I) when 1, 2-dichloroacetylene was found to result from the reaction of<br />
trichloroethylene with lithium hydroxide. The lithium hydroxide is used as a<br />
scrubber for removal of metabolically produced CO 2. The production of<br />
dichloroacetylene caused the experiment to be stopped with resulting loss of<br />
time and money. This contaminant has caused other expensive delays (Saunders<br />
& Williams, 1969) and the circumstances causing its formation should not be<br />
allowed to reoccur. Specifically, trichloroethylene shouM not be introduced into<br />
a spacecraft in any form at any time.<br />
Outgassing studies have been conducted on a large number of spacecraft<br />
construction materials to identify possible coataminants. Animal experiments<br />
also have been conducted to screen the candidate space cabin materials used in
478 Bioastronautics Data Book<br />
the Apollo series. Results of the, screening studies made under reduced<br />
pressure-10Opercent oxygen conditions have shown the outgassed contaminants<br />
of most cabin materials to be nontoxic under the test condition used,<br />
as reported by Culver (1966) and Haun (1967). Of several hundred tested, one<br />
material proved to be toxic when heated. Carboxynitroso rubber, which was<br />
selected as a candidate spacecraft material because it was nonflammable, was<br />
found to decompose at 300°C and to form highly toxic decomposition<br />
products. MacEwen (1968) estimated that the decomposition of 15 grams of<br />
carboxynitroso rubber in an Apollo space cabin would be fatal if inhaled for<br />
2 minutes.<br />
Water Quality Standards for Space Missions<br />
Standards for the quality of potable water aboard spacecraft are as<br />
important as those for air quality. The amount of water needed for drinking and<br />
person'M hygiene is sufficiently great on extended space missions to make storage<br />
prohibitive. Therefore, water used by the crew for personal or cabin hygiene and<br />
body waste water and water produced by spacecraft equipment must be<br />
collected, treated, and reused.<br />
Water quality standards need not be as stringent as those used for municipal<br />
water supplies since the latter are established to protect a broad population,<br />
including young and old, and sick and healthy, for a lifetime, not just a limited<br />
period. However, whereas it is true that spacecraft water will not be<br />
contaminated by soil leachates and industrial pollution, it may contain<br />
concentrated impurities (because of recycling) released by the water treatment<br />
_Tstem and the crew itself.<br />
The requirements for spacecraft water quality standards are based on<br />
aesthetic or physical criteria, trace chemical content, and microbiological<br />
impurities. From the crew viewpoint, the aesthetic criteria may be most<br />
important since unpleasant odors or taste may discourage normal use of the<br />
water which may in turn cause adverse effects on health. The aesthetic standards<br />
recommended by the National Academy of Sciences' Space Science Board<br />
(1967) are listed in table 10-11. Chemical standards are listed in table 10-12.<br />
Table 10-11<br />
Spacecraft Water Quality Standards for Physical Properties<br />
Quality SpacecraftLimit Municipal Limit<br />
Turbidity (Jacksonunits) Not to exceed10 Not to exceed5<br />
Color (platinum -- cobaltunits) Not to exceed15 Not to exceed15<br />
Taste Noneobjectionable -<br />
Odor None objectionable Odor No. 3<br />
Foaming Nonepersistentmore than -<br />
t5sec<br />
(National Academyof Sciences,SpaceScienceBoard,1967; PublicHealthService,1962)
Toxicology<br />
Table 10-12<br />
Spacecraft Water Quality Standards for Chemical Content<br />
(rag/i)<br />
Arsenic<br />
Barium<br />
Boron<br />
Cadmium<br />
Chemical Spacecraft PHS<br />
Limit (Upper Limit)<br />
Chemical Oxygen Demand<br />
(dichromate method)<br />
Chloride<br />
Chromium (hexavalent)<br />
Copper<br />
Fluoride<br />
Lead<br />
Nitrate and nitrite (as nitrogen)<br />
Selenium<br />
Silver<br />
Sulfate<br />
Total sol ids<br />
0.50<br />
2.00<br />
5.00<br />
0.05<br />
100.00<br />
450.00<br />
0.05<br />
3.00<br />
2.00<br />
0.20<br />
10.00<br />
0.05<br />
0.50<br />
250.00<br />
1o0o .o0<br />
0.05<br />
1.00<br />
0.01<br />
250.00<br />
0,20<br />
1.00<br />
1.00<br />
0.05<br />
0.001<br />
0.01<br />
0.05<br />
250.00<br />
(National Academy of Sciences, Space Science Board, 1967; Public<br />
Health Service, 1962)<br />
Recirculation or reuse of bodily and hygienic waste waters requires<br />
consideration of biological contamination. The nature of a water reclamation<br />
system is such that microbiological organisms of body of air origin may find<br />
many suitable physical and nutritional support sources. Although the biological<br />
forms of bacteria, molds, fungi, and viruses would be limited to those with<br />
which the bodies of the crewmembers are familiar, there is ample opportunity<br />
for overgrowth which may overwhelm the normal tolerance to small numbers of<br />
these organisms. Furthermore, biological growths in the water system may add<br />
byproduct toxins or unwanted taste and odor. The recommended standard of<br />
the National Academy of Sciences' Space Science Board (1967) is stated as follows:<br />
Because of the diverse natures and modes of hazard of possible<br />
biological contaminants in water-recovery systems for space use, the<br />
Panel found no justification for the establishment of standards based<br />
on individual types of microorganisms. It was considered that the<br />
goal should be essential sterility and that total counts of aerobic,<br />
facultative and anaerobic organisms would be the best indications of<br />
attainment of this condition. A maximum of 10viable micro-<br />
organisms per milliliter was considered to be a realistic criterion for<br />
"essential sterility."<br />
479
480 Bioastronautics Data Book<br />
It was considered essential, moreover, that this criterion of<br />
e_ential sterility be applied to all parts of the recovery system<br />
beyond the initial phase _paration step and not simply to the<br />
finished product water.<br />
The Panel felt strongly that some positive form of sterilization<br />
was needed at some point in the recovery-storage-delivery system<br />
immediately after phase separation. In addition, it was felt that there<br />
should be provision for periodic heat treatment of the subsequent<br />
portions of the system to forestall hazards of possible bacterial or<br />
fungal growth.<br />
It will be difficult to monitor the quality of the drinking water under actual<br />
space flight conditions. Therefore, any water reclamation system should be<br />
thoroughly use-tested in simulator runs to establish that it meets required<br />
chemical, biological, and physical standards. Some sampling may be feasible<br />
during flight but could by necessity be limited to simple indicator tests of single<br />
ions and simple biological cultures on multipurpose media. Research from the<br />
Apollo program has produced rapid techniques for identifying the presence of<br />
living forms through the reaction of their ATP content with the "fire fly"<br />
enzymes to giw_ a visible signal. This test will not distinguish pathogenic<br />
organisms from nonpathogens but would be applicable to the Space Sciences<br />
Board's recommendation of 10 microorganisms per milliliter without regard to<br />
their identity or pathogenicity.<br />
References<br />
Adams, J. D., Conlde, J. P., Mabson, W. E., Watson, J. T., Wolf, P. H., & Welch, B. E. Study<br />
of man during a 56-day exposure to an oxygen-helium atmosphere at 258 mm Hg total<br />
pressure. II., Major and minor atmospheric components. Aerospace Medicine, 1966, 37,<br />
555.<br />
American Conference of Govermnental Industrial Hygienists. Documentation of the<br />
threshold limit values. (3rd ed.), 1971.<br />
Azar, A., Thomas, A. A., & Shillito, F. H., Pyriodoxine and Phenobarbital as treatment for<br />
acrozine-50 toxicity. Aerospace Medicine, 1970, 41,1.<br />
Back, K. C. Effects of carbon monoxide on the performance of monkeys. In Proceedings of<br />
the 5th Annual Conference on Atmospheric Contamination in Confined Spaces,<br />
AMRL-TR-69-130, Aerospace Medical Research Laboratory, Wright-Patterson AFB,<br />
Ohio, 1969.<br />
Back, K. C., Sandage, C., & Thomas, A. A. Development of space cabin tolerance criteria to<br />
trace contaminants. Aerospace Medicine, 1962, 33, 1438.<br />
Back, K. C., Pinkerton, M. K., & Thomas, A. A., Therapy of acute UDMH intoxication.<br />
Aerospace Medicine, 1963, 34, 1001.<br />
Back, K. C., & Dominguez, A. M., Psychopharmacology of carbon monoxide under ambient<br />
and altitude conditions. AMRL.TR-68-175, Aerospace Medical Research Laboratory,<br />
Wright-Patterson AFB, Ohio, 1968.<br />
Bean, J. W. Effects of oxygen at increased pressure. Physiology Review, 1945, 25, 1-47.<br />
Bean, J. W. Hypophyseal and adrenocortical factors in pulmonary damage induced by<br />
oxygen at atmospheric pressure. Journal of American Physiology, 1953, 172, 169-174.
Toxicology 481<br />
Beard, R. R., & Werthcim, G. A. Behavioral impairment associated with small doses of<br />
carbon monoxide. American Journal of Public ttealth, 1967, 57, 11.<br />
Belles, F. Fluorine handbook. Lewis Research Center, National Aeronautics and Space<br />
Administration, Cleveland, Ohio, 1965.<br />
Bert, P. La Pression Barometric: Recherches de Physiologic Experimental. Paris: G. Masson,<br />
1878.<br />
Boycott, A. F., & Oakley, C. L. Oxygen poisioning in rats, Journal of Pathology and<br />
Bacteriology, 1932, 35,468.<br />
Clark, D. A., Barrington, J. D., Bitter, H. L., Coe, F. L., Medina, M. A., Mcrritt, J. H., &<br />
Scott, W. N. Pharmacology and toxicology of propellant hydrazincs. Review 11-68,<br />
USAF School of Aerospace Medicine, Acrospa_ Medical Division, Brooks AFB, Texas,<br />
1968.<br />
Clayton, G. D., Cook, W. A., & Frederick, W. G. A study of the relationship of street<br />
carbon monoxide concentrations to traffic accidents. Journal of American Industrial<br />
Hygiene Association, 1960, 21,46.<br />
(doe, F. L., & Korty, P. R. The effect of hydrazinc upon renal blood flow. SAM-TR-67-46,<br />
USAF School of Aerospace Medicine, Aerospace Medical Division, Brooks AFB, Texas,<br />
1967.<br />
Comroe, J. lt., Dripps, R. D., & Denting, M. Effects produced in man by inhalation of high<br />
concentrations of oxygen for 24 hours. Journal of the American Medical Association,<br />
1945, 128,710-717.<br />
Conkle, J. P. Contaminant studies in dosed ecological systems at the USAF School of<br />
Aerospace Medicine. In Proceedings of the 2ud Annual Conference on Atmospheric<br />
Contamination in Confined Spaces, AMRL-TR-66-120, Aerospace Medical Research<br />
Laboratory, Wright-Patterson AFB, Ohio, 1966.<br />
Conkle, J. P., Mabson, W. E., Adams, J. D., Zeft, H. J., & Welch, B. E. Detailed study of<br />
contaminant production in a space cabin simulator at 760 mm of mercury. Aerospace<br />
Medicine, 1967, 38,491.<br />
Cotton, J. E., Fosberg, T. M., Monteith, L. E., & Olsen, R. L. An integrated program<br />
approach to the control of space cabin atmospheres. In K. Kammermeyer (Ed.),<br />
Atmosphere in Space Cabins and Closed Enviornments. New York: Appleton-Century<br />
Crofts, 1966.<br />
Cuivcr, B. D. Toxicological sc_ening of space cabin materials. In Proceedings of the 2nd<br />
Annual Conference on Atmospheric Contaminants in Confined Spaces, AMRL-TR-<br />
66-120, Aerospace Medical Re.,_arch l,aboratory, Wright-Patterson AFB, Ohio, 1966<br />
I)epartment of Defense. Military standard procedure for carbon monoxide detection and<br />
control in aircraft. MIL-STD-800, U.S. Government Printing Office, Washington, D.C.,<br />
July 1958.<br />
Dickcrson, K. it. Pathophysiology of pulmonic toxicity in rats exposed to 100 percent<br />
oxygen at reduced pressures. N ADC-ML-6403, Aerospace Medical Research Department,<br />
Naval Air Development Center, Johnsville, Pennsylvania, 1964.<br />
Dittmer, D. S., & Grebe, R. M. Handbook of Respiration. Philadelphia: Saunders, 1958.<br />
Dost, F. N., Recd, D. J., Finch, A., & Wang, C. ll. Metabolism and pharmacology of<br />
inorganic and fluorine containing compounds. AMRL-TR-67-224, Aerospace Medical<br />
Re,arch Laboratory, Wright-Patterson AFB, Ohio, August 1968.<br />
Dost, F. N., Reed, D. J. & Wang, C. tt. Studies on environmental pollution by missile<br />
propellants. AMRL-TR-68-85, Aerospace Medical Research Laboratory, Wright-<br />
Patterson AFB, Ohio, 1969.<br />
Ehrliek, R., & Henry, M. C. Chronic toxicity of nitrogen dioxide. I., Effect on resistance to<br />
hactcriM pneumonia. Archives of Environmental llealth, 1968, 17, 860-865.
482 Bioastronautics DataBook<br />
Eriksen, N. A study of lethal effects of the inhalation of gaseous fluorine (F2) at<br />
concentrations from 100 PPM to 10 000 PPM. Report 435, United States Atomic<br />
Energy Commission, University of Rochester, Rochester, New York, 1945.<br />
Fairchild, E. J., II. Eight-month continuous exposure of animals to an oxygen-nitrogen<br />
atmosphere at 5 psia. In Proceedings of the 3rd Annual Conference on Atmospheric<br />
Contamination in Confined Spaces, AMRL-TR-66-120, Aerospace Medical Research<br />
Laboratory, Wright-Patterson AFB, Ohio, December, 1967.<br />
Forbes, W. H., Sargent, F., & Roughton, F. J. W. The rate of carbon monoxide uptake by<br />
normal men. Journal of American Physiology, 1945, 143, 594.<br />
Freeman, G. & Haydon, G. B. Emphysema after low level exposure to NO 2. American<br />
Medical Association Archives of Environmental Health, 1964, 8, 125.<br />
Freeman, G., Stevens, R. J., Crane, S. C., & Furiosi, N. J. Lesion of the lung in rats<br />
continuously exposed to two parts per million of nitrogen dioxide. American Medical<br />
Association Archives of Endronmental Health, 1968, 17, 181.<br />
George, M., Mautner, W., & Back, K. C. Nephro toxic effects of monomethylhydrazine in<br />
monkeys. AMRL-TR-68-110, Aerospace Medical Research Laboratory, Wright-Patterson<br />
AFB, Ohio 1968.<br />
Grey, E. LeB., MacNamee, J. K., & Goldberg, S. B. Toxicity of NO 2 vapors at very low<br />
levels. American Medical Association Archives of Industrial Hygiene, 1952, 6, 20.<br />
Grisard, J. W., Bernhardt, H. A., & Oliver, G. D. Thermal data, vapor pressure and entropy<br />
of chlorine trifluoride. Journal of the American Chemical Society, 1951, 73, 5725.<br />
Haldane, J. S. The action of carbonic acid on man. Journal of Physiology, 1895, 18,201.<br />
Haldane, J. S. Carbon monoxide as a tissue poison. Journal of Biochemistry, 1927, 21,<br />
1068.<br />
Hanks, T. H. Analysis of human pedormance capabilities as a function of exposure to<br />
carbon monoxide. Presented at the Conference on Biological Effects of Carbon<br />
Monoxide, New York Academy of Sciences, February, 1970.<br />
I-lama, C. C. Toxicological screening of 100 space cabin materials. In Proceedings of the<br />
3rd Annual Conference on Atmospheric Contamination in Confined Spaces,<br />
AMRL-TR-66-120, Aerospace Medical Research Laboratory, Wright-Patterson AFB,<br />
Ohio, December, 1967.<br />
Hama, C. C., MacEwcn, J. D., Vcrnot, E. H., & Egan, G. F. The acute inhalation toxicity of<br />
monomethylhydrazine vapor. AMRL-TR-69-169, Aerospace Medical Research<br />
Laboratory, Wright-Patterson AFB, Ohio, 1968.<br />
Haydon, G. B., Freeman, G., & Furiosi, N. J. Covert pathogenesis of NO 2 induced<br />
emphysema in the rat. American Medical Association Archives of Environmental Health,<br />
1965, 11,776.<br />
Helvery, W. M., Albright, G. A., Benjamin, F. B., Peters, J., Gall, L., & Rand, H. The effects<br />
on man of prolonged exposure to pure oxygen. Aerospace Medicine, 1963, 34,257.<br />
Henderson, Y. & Haggard, H. W. The physiological principles governing ventilation when<br />
the air is contaminated with carbon monoxide. Journal of Industrial and Engineering<br />
Chemistry, 1922, 14, 229.<br />
Henry, M. C., Ehrlich, R., & Blair, W. H. Effect of nitrogen dioxide on squirrel monkeys to<br />
Klebsiella pneumoniae infection. Archives of Environmental Health, 1969, 18, 580-587.<br />
Herlocher, J. E. Quigley, D. G., Behar, V. S., Shaw, E. G., & Welch, B. E. Physiologic<br />
response to increased oxygen partial pressure. I., Clinical observations. Aerospace<br />
Medicine, 1964, 35, 613.<br />
Hodgkiss, W. S., Johns, R. H., & Swinehart, J. S. Environmental testing of contaminant<br />
producing materials from the integrated life support system. Contract No. NASI-4425,<br />
Atlantic Research Corporation, Alexandria, Virginia, 1967.
Toxicology 483<br />
ttodgson, F. N., & Pnstinger, J. V., Jr. Gas-off studies of cabin materials. In Proceedings of<br />
the 2nd Annual Conference on Atmospheric Contamination in Confined Spaces,<br />
AMRL-TR-66-120, Aerospace Medical Research Laboratory, Wright-Patterson AFB,<br />
Ohio, 1966.<br />
Horn, J H., & Weir, R. J. Inhalation toxicology of chlorine trifluoride. American Medical<br />
Association Archives of Industrial Health 1955, 12, 515.<br />
House, W. B. Tolerance criteria for continuous inhalation exposure to toxic materials. III.,<br />
Effects on animals of 90-day exposure to hydrazine, unsymmetrical dimethylhydrazine<br />
(UDMH), deeaboranc and nitrogen dioxide. ASD-TR-61-519 Oil), Aerospace Medical<br />
Research Laboratory, Wright-Patterson AFB, Ohio, 1964.<br />
Jacobson, K. H., Clem, J. H., Wheelwright, H. J., Jr., Rinehardt, W. E., & Mayes, N. The<br />
acute toxicity of the vapors of some methylated hydrazine derivatives. American<br />
Medical Association Archives of Industrial Health, 1955, 12, 609.<br />
JANNAF Hazard Working Group. Chemical rocket/propellant hazards. Volume Ill. Liquid<br />
propellant handling, storage and transportation. Chemical Propulsion Agency,<br />
Information Agency Publication Number 194, 1970.<br />
Jones, R. A., Jenkins, L. V., Jr., Coon, R. A., & Siegal, J. The effects of long-term<br />
continuous inhalation of ozone on experimental animals. Toxicology and Applied<br />
Pharmacology, 1970, 17, 189.<br />
Kaplan, H. P., Thomas, A. A., Back, K. C., & Robinson, F. R. Evaluation of animals<br />
continuously exposed to a 5 psia pure oxygen space cabin atmosphere for eight months.<br />
Aerospace Medicine, 1968, 39, 63.<br />
Keplinger, M. L., & Suissa, L. W. Toxicity of fluorine short-term inhalation. Journal of<br />
American Industrial Hyglenical Association, 1968, 29, 10.<br />
Kcplinger, M. L. Effects from repeated short-term inhalation of fluorine. Toxicology and<br />
Applied Pharnmcology, 1969, 14,192.<br />
Kisfler, G. S., Caldwell, P. R. B., & Wiebel, E. A. Development of fine structural damage to<br />
alveolar and capillary living _lls in oxygen-poisoned rat lungs. Journal of Cellular<br />
Biology, 1967, 32, 605.<br />
Krop, S. Toxicology of hydrazines, a review. American Medical Association Archives of<br />
Industrial ltealth _,1954, 9, 199.<br />
Kydd, G. H. Lung changes resulting from prolonged exposure to 100 percent oxygen at<br />
550 mm Hg. Aerospace Medicine, 1967, 38, 918-923.<br />
Kydd, G. H. Survival of rats exposed to 10 psia oxygen to further exposure at one<br />
atmosphere oxygen. Aerospace Medicine, 1968, 39,739.<br />
Labelle, C. W. Studies on the toxicity of oxygen &fluoride levels of exposure from 10 to<br />
0.1 ppm by volume. Pharmacology Report No.478, Manhattan Project Contract<br />
W-740I eng 49, The Univer_ty of Rochester, January, 1945.<br />
Lester, D. & Adams, W. R. The inhalation toxicity of oxygen difluoride. Journal of<br />
American Industrial Hygienical Association, 1965, 26,562.<br />
Lewerenz, M., Schwinger, G., Weibel, E. R., & Kaplan, H. P. Electron microscopic and<br />
morphometric evaluation of lungs from animals expo_,_ut continuously for eight months<br />
to 5 psia, 100 percent oxygen. In Proceedings of the 3rd Annual Conference on<br />
Atmospheric Contamination in Confined Spaces, AMRL-TR-67-200, Aerospace Medical<br />
Research Laboratories, Wright-Patterson AFB, Ohio, December, 1967.<br />
Lyon, J. S. Observations on personnel working with fluorine at a gaseous diffusion plant.<br />
Journal of Occupational Medicine, 1962, 4,199.<br />
MacEwen, J. D. The acute toxicity of thermal decomposition products of carboxy nitroso<br />
rubber (CNR). In Proceedings of the 4th Annual Conference on Atmospheric<br />
Contamination in Confined Spaces, AMRL-TR-68-175, Wright-Patterson AFB, Ohio,<br />
1968.
484 Bioastronautics Data Book<br />
MacEwen, J. D., & Geekler, R. P. Comparative studies of 90-day continuous exposure to 02,<br />
NO 2 and CC14 at reduced and ambient pressures. AMRL-TR-67-68, Aerospace Medical<br />
Research Laboratory, Wright-Patterson AFB, Ohio, 1968.<br />
MacEwen, J. D., & Haun, C. C. Oxygen toxicity at near ambient pressures. In Proceedings<br />
of the 2ud Annual Conference on Atmospheric Contamination in Confined Spaces,<br />
AMRL-TR-66-120, Aerospace Medical Research Laboratories, Wright-Patterson AFB,<br />
Ohio, December, 1966.<br />
MacEwen, J. D., & Vernot, E. H. Toxic hazards research unit annual technical report.<br />
AMRL-TR-68-133, Aerospace Medical Research Laboratory, Wright-Patterson AFB,<br />
Ohio, October, 1968.<br />
MacEwen, J. D., & Vernot, E. H. Toxic hazards research unit annual report.<br />
AMRL-TR-69-84, Aerospace Medical Research Laboratory, Wright-Patterson AFB,<br />
Ohio, September, 1969.<br />
MacEwen, J. D., & Bernot, E. H. Toxic hazards research unit annual technical report: 1970.<br />
AMRL-TR-70-77, Aerospace Medical Research Laboratory, Wright-Patterson AFB,<br />
Ohio, 1970.<br />
MaeFarland, R. A., Roughton, F. J. W., Halperin, M. H., & Niven, J. L The effects of<br />
carbon monoxide and altitude on visual thresholds. Journal of Aviation Medicine, 1944,<br />
15, 381.<br />
McDonnell Douglas Astronautics Company Report. 60-day manned test of a regenerative<br />
life support system with oxygen and water recovery. NASA-CR-98500, National<br />
Aeronautics and Space Administration, 1968.<br />
MeNerney, J. M., & MacEwen, J. D. Comparative toxicity studies at reduced and ambient<br />
pressures. I., Acute Response. Journal of American Industrial Hygiene, 1965, 26,568.<br />
Machle, W., & Evans, E. E. Exposure to fluorine in industry. Journal oflndustrial Hygiene<br />
and Toxicoioty, 1940,22 213.<br />
Mammen, R. E., Critz, G. T., Dery, D. W., Highly, F. M., & Hendler, E. Effects of<br />
_uential exposure to acceleration and space capsule atmospheric conditions.<br />
Aerospace Medicine, 1963 34,260, (Abstract)<br />
Mikulka, P. J., O'Donnell, R. D., Heinig, P. E., & Theodore, J. The effect of carbon<br />
monoxide on human performance. In Proceedings of the 5th Annual Conference on<br />
Atmospheric Contamination in Confined Spaces, AMRL-TR-69-130, Aerospace Medical<br />
Research Laboratory, Wright-Patterson AFB, Ohio, 1969.<br />
Mittler, S. Toxicity of ozone IV, silicone aerosols and alcohol vapor therapy in ozone<br />
poisoning. Industrial Medicine and Surgery, 1958, 27, 43.<br />
Morgan, T. E., Jr., Cutler, R. G., Shaw, E. G., Ulvedai, F., Hargraves, J. J., Moyer, J. E.,<br />
McKenzie, R. E., & Welch, B. E. Physiologic effects of exposure to increased oxygen<br />
tension at 5 psia. Aerospace Medicine, 1963, 34,720.<br />
National Academy of Sciences. Space Science Board, Panel on Air Standards for Manned<br />
Space Flight. Atmospheric contaminants in spacecraft. Washington, D.C., October,<br />
1968.<br />
National Academy of Sciences. Space Science Board, Panel on Water Quality Standards<br />
Report of the Ad Hoc Panel on Water Quality Standards for Long Duration Manned<br />
Space Missions. Washington, D.C., 1967.<br />
Naval Research Laboratory Reports. The present status of chemical research in atmosphere<br />
purification and control on nuclear-powered submarines. NRL Report 5465, Naval<br />
Research Laboratory, Washington, D.C., 1960, NRL Report5630 (1961); NRL<br />
Report 5814 (1962); NRL Report 6053 (1963); NRL Report6251 (1965); NRL<br />
Report 6491 (1967).<br />
Ohlsson, W. T. L. A study on oxygen toxicity at atmospheric pressure. Acta Mediea<br />
Scandinavica, 1947, 128, Supplement 190.
Toxicology 485<br />
Patty, F. A. Inorganic compounds of oxygen, nitrogen and carbon. In D. W. Fassett and D.<br />
D. Trish (Eds.), Industrial Hygience and Toxicology. Volume II. lnterscience Publishers,<br />
1963.<br />
Pinkerton, M. K., Hagan, E. A., & Back, K. C. Distribution and excretion of<br />
14C-Monomethylhydrazine. Toxicology and Applied Pharmacology, 1967, 10,401.<br />
Public tlealth Service. Drinking water standards. Public ltealth Publications Number 956,<br />
U.S. Department of tlealth, Education and Welfare, Washington, D.C., 1962.<br />
Pustinger, J. V., Jr., Hodgson, F. N., & Ross, W.D. Identification of volatile contaminants<br />
of space cabin materials. AMRL-TR-66-53, Aerospace Medical Research Laboratory,<br />
Wright-Patterson AFB, Ohio, 1966.<br />
Rinehart, W. E., Donati, E., & Greene, E. A. The sub-acute and chronic toxicity of 1,<br />
1-dimethylhydrazine vapor. Journal of American Industrial Hygiene, 1960, 21,207.<br />
Reynolds, H. H., Rohles, F. 11, Fincg, J., Back, K. C., & Thomas, A. A. The effect of<br />
UDMH on learned performance in the Java monkey. Aerospace Medicine, 1963, 34,<br />
920.<br />
Reynolds, H. H., Rohles, F. |1., Prine, J. R., & Back, K. C. The effects of 1,<br />
1-dimethylhydrazinc (UDMIt) on complex avoidance behavior in the Java monkey.<br />
Aerospace Medicine, 1964, 35,377.<br />
Reynolds, tf. tt., & Back, K. C. Effect of injected monomelhylhydrazine on primate<br />
performance. Toxicology and Applied Pharmacology, 1966, 9, 336.<br />
Rickey, R. P. Decontamination of large liquid fluorine spills. United States Air Force Flight<br />
Training Command, Technical Report 59-2l, )959.<br />
Robertson, W. G., ttargravcs, J. J., Herlocher, J. E., & Welch, B. E. Physiologic response to<br />
increased oxygen partial pressure. II., Respiratory studies. Aerospace Medicine, 1964,<br />
35,618.<br />
Rockwell, T. 1I., & Ray, A. M. Subacute carbon monoxide poisoning and driving<br />
performance, a selected review of the literature and discussion. January, 1967. A report<br />
to the National Safety Council.<br />
Ruff, O., Zur Kenntnis der Sticksloff-3-fluoride. Zeitsehrif! fti'r anorganischc und<br />
allgemeine Chemic, 1963, 197, 273.<br />
Samonski, F. 1I., Jr. Technical history of the environmental control system for Project<br />
Mercury. NASA-TN-4126, National Aeronautics and Space Administration, Washir_ton,<br />
D.C., 1967.<br />
Sandagc, C. Tolerance criteria for continuous inhalation exposure to toxic material. 1.,<br />
Effects on animals of 90-day exposure to phenol, CC14 and a mixture of indole, skatole,<br />
H2S and methyl mercaptan. ASD Technical Report, 61-,519 (1), Aerospace Medical<br />
Research I_aboratory, Wri_ht-Patter_n AFB, Ohio, October 1961.<br />
Sandage, C. Tolerance criteria for continuous inhalation exposure to toxic material. II.,<br />
Effects on animals of 90-day exposure to H2S , methyl mercaptan, indole, and a mixture<br />
of HeS; methyl mercaptan, indole and skatole. ASD Technical Report 61-519(11),<br />
Aerospace Medical Research Laboratory, Wright-Patterson AFB, Ohio, December 1961.<br />
Saunders, R. A. Analyses of the spacecraft atmosphere. NRL Report 5816, Naval Re,arch<br />
Laboratory, Washington, D.C., 1962.<br />
Saunders, R. A. A new hazard in closed environmental atmospheres. American Medical<br />
Association Archives on Environmental Health, 1967, 14,380.<br />
Saunders, R. A., Umstead, M. E., Smith, W. D., & Gammon, R. tt. The atmospheric<br />
contaminant pattern of SeaLab II. In Proceedings of the 3rd Annual Conference on<br />
Atmospheric Contamination in Confined Spaces, AMRL-TR-67-200, Aerospace Medical<br />
Research Laboratary, Wright-Patterson AFB, Ohio, 1967.
486 Bioastronautics Data Book<br />
Saunders, R. A., & Williams, F. W. Another incident of dichloracetylene contamination. In<br />
Proceedings of the 5th Annual Conference on Atmospheric Contamination in Confined<br />
Spaces, AMRL-TR-69-130, Aerospace Medical Research Laboratory, Wright-Patterson<br />
AFB, Ohio, 1969.<br />
Sayers, R. R., Meriwether, E. V., & Yant, W. P. Physiological effects of exposure to low<br />
concentrations of carbon monoxide. U.S. Public Health Report 37, 1922.<br />
_hulte, J. H. Effects of mild carbon monoxide intoxication. American Medical Association<br />
Archives of Environmental Health, 1963, 7, 524.<br />
Shy, C. M., Creason, J. P., Pearlman, M. E., McLain, K. E., & Beuson, F. B. The<br />
Chattanooga school children study: effects of community exposure to nitrogen dioxide.<br />
I., Methods, description of pollutant exposure, and results of ventilatory function<br />
testing. Journal of Air Pollution Control Association, August, 1970, 20, 539-545.<br />
Shy, C. M., Creason, J. P., Pearlman, M. E., McLain, K. E., & Benson, F. B. The<br />
Chattanooga school children study: effects of community exposure to nitrogen diozide.<br />
II., inc_dence of acute respiratory illness. Journal of Air Pollution Control Association,<br />
_ptcmber 1970, 20,582-588.<br />
Smith, F. J. C., Helm, J. W., Thompson, R. M., & Drinker, C. K. Body changes and<br />
development of pulmonary resistance in rats living under compressed air conditions.<br />
Journal of Experimental Medicine, 1932, 56, 63.<br />
Sopher, R. L., Esparza, A. R., & Robinson, F. R. The effect of methylhydrazine by<br />
inhalation or injection in dog's kidneys. In Proceedings of the 4th Annual Conference on<br />
Atmospheric Contamination in Confined Spaces, AMRL-TR-68-175, Aerospace Medical<br />
Research Laboratory, Wright-Patterson AFB, Ohio, 1968.<br />
Steadman, B. L., Jones, R. A., Rector, D. E., & Siegel, J. Effects on experimental animals<br />
of long-term continuous inhalation of nitrogen dioxide. Toxicology and Applied<br />
Pharmacology, 1966, 9, 160.<br />
Sterman, M. B., Fairchild, M. D., & VanTwyver, H. E. Subconvulsant effects of<br />
monomethylhydrazine in runway performance in the cat. AMRL-TR-68-183, Aerospace<br />
Medical Research Laboratory, Wright-Patterson AFB, Ohio, 1968.<br />
Stewart, R. D., Peterson, J. E., Baretta, E. D., Bachand, R. T., ltasko, M. J., & Herrmann, A.<br />
A. Experimental human exposure to carbon monoxide. American Medical Association<br />
Archives of Environmental Health, 1970, 21,154.<br />
Stokinger, tl. E. Toxicity following inhalation of fluorine and hydrogen fluorine. In C.<br />
Voegthn and H. C. Hodge (Eds.), The Pharmacology and Toxicology of Uranium.<br />
National Nuclear Energy Series, Volume 6. New York: McGraw-Hill, 1949.<br />
Thomas, A. A. Man's tolerance to trace contaminants. AMRL-TR-67-146, Aerospace<br />
Medical Research Laboratory, Wright-Patterson AFB, Ohio, 1968.<br />
Toliver, W. H., St., & Morris, M. L. Chemical analysis of permanent and organic gases in a<br />
30.day manned experiment. Aerospace Medicine, 1966, 3 7, 233.<br />
Torkelson, T. R., Oyen, F., Sadek, S. E., & Rowe, V. K. Preliminary toxicologic studies on<br />
nitrogen trifluoride. Toxicology and Applied Pharmacology, 1962, 4,770.<br />
Trouton, D., & Eysenck, H. J. The effects of drugs on behavior, in H. J. Eysenck (Ed.),<br />
Handbook of Abnormal Psychology. New York: Basic Books, Inc., 1961.<br />
Vernot, E. It., & Haun, C. C. Acute toxicology and proposed emergency exposure limits of<br />
nitrogen trifluoride. In Proceedings of the 5th Annum Conference on Atmospheric<br />
Contamination in Confined Spaces, AMRL-TR-69-130, Aerospace Medical Research<br />
Laboratory, Wright-Patterson AFB, Ohio, 1969.<br />
Vernot, E. H., Back, K. C., George, M. E., Chikos, P. M., Jr., & MacEwen, J.<br />
D. Hematologic effects of long-term animal exposure to high concentrations of carbon<br />
monoxide. In Proceedings of the Conference on Environmental Toxicology,<br />
AMRL-TR-70-102, Aerospace Medical Research Laboratory, Wright-Patterson AFB,<br />
Ohio, 1970.
Toxicology 487<br />
Vigdortschik, N.A., Andreeva, E. C., Matusscntch, !. Z., Nikulina, M. M., Frumina, L. M., &<br />
Striter, V.A. Symptomatology of chronic poisoning with oxides of nitrogen. Journal of<br />
Industrial Hygiene and Toxicology, 1937, 19,469.<br />
Wagner, W. D., Duncan, B. R., Wright, P. G., & Stokinger, H. E. Experimental study of the<br />
threshold limit of NO 2. American Medical Association Archives of Environmental<br />
Health, 1965, 10,455.<br />
Weatherby, J. H., & Yard, A. S. Observations on the subacute toxicity of hydrazine.<br />
American Medical Association Archives of Industrial Health, 1955, 11,413.<br />
Weinberg, M. S., & Goldhamer, R. E. Pharmacology and metabolism of compound A.<br />
AMRL-TR-66-238, Aerospa_ Medical Research Laboratory, Wright-Patterson AFB,<br />
Ohio, 1967.<br />
Weir, F. W., Memenzo, T. H., Bennett, S., & Meyers, F. H. A study of the mechanisms of<br />
acute effects of hydrazine, UDMH, MMH and SDMH. AMRL-TR-64-26, Aerospace<br />
Medical Research Laboratory, Wright-Patterson AFB, Ohio, 1964.<br />
Weir, F. W., Bath, D. W., Yevich, P., & Oberst, F. W. Study of effects of continuous<br />
inhalation of high concentrations of oxygen at ambient pressure and temperatures.<br />
Aerospace Medicine, 1965, 36, 117.<br />
Zalusky, R., Ulvedal, F., Herlocher, J. E., & Welch, B. E. Physiologic response to increased<br />
oxygen partial pressure. Ill., Hematopoiesis. Aerospace Medicine, 1964, 35,622.
CHAPTER 11<br />
RESPIRATORY SYSTEM<br />
by<br />
Roscoe G. Bartlett, Jr., Ph.D.<br />
International Business Machines Corporation<br />
This chapter presents a treatment of the topic of human respiration<br />
intended primarily for use by persons who are not professionals in the biologic<br />
sciences, It discusses developments in the field where these are relevant to<br />
problems faced by engineers and designers of life support equipment. Essentially<br />
all of the relevant data concerning respiration have been known for some time;<br />
the problem has been one of application, not acquisition of information. There<br />
is a growing appreciation of a gap in effective dialogue between biologists<br />
(including those in medicine) and engineers and physical scientists. This chapter<br />
represents an attempt to present material in a form that should bridge this gap in<br />
the area of respiratory physiology. To the skilled biologist, the presentation will<br />
perhaps appear condescending and to the theoretical engineering scientist the<br />
engineering and physics naive; the presentation is not really meant for either of<br />
these. Rather it is meant for the engineers and designers who must face and solve<br />
the myriad of small and large problems in the development of any man-rated<br />
system.<br />
It is beyond the scope of this book to present a description of the basic<br />
anatomy of the respiratory system, and length constraints also necessitate an<br />
abbreviated treatment of the physiology of respiration, For a better<br />
understanding of the data presented, it is recommended that the reader who is<br />
unfamiliar with these topics consult any one of the following texts for<br />
background material:<br />
Best, C. H., & Taylor, N. B. The physiological basis of medical practice.<br />
(8th ed.) Baltimore: The Williams & Wilkins Company, 1966.<br />
Comroe, J. H., Jr., Forster, R. E.,ll, Dubois, A. B., Briscoe, W. A., &<br />
Carlsen, E. The lung: clinical physiology and pulmonary function tests. (2nd<br />
ed.) Ehicago: Year Book Medical Publishers Inc., 1962.<br />
Ruch, T. C., & Fulton, J. F. (Eds.) Medical physiology and biophysics.<br />
Philadelphia: W. B. Saunders Co., 1960.<br />
487-858 O - 73 - 32<br />
489
4qO Bio_tronautics Data Book<br />
The followiug list of ternrs may 'also be helpful:<br />
Apnea-no breathing activity<br />
Dyspnea-labored breathing, especially if not warranted by physical<br />
exertion<br />
Eucupnea-normal level of body CO 2<br />
Hypercapnea-Higher than normal level of body CO 2<br />
ttyperoentilation-eorrectly, a level of lung ventilation in excess of that<br />
required to maintain CO 2 at eucupnea levels: sometimes incorrectly used to<br />
describe the labored breathing produced by exercise or stress<br />
Hypocapnea-lower than normal level of body CO 2, produces hypereapnea<br />
Minute Volume-volume of air moved in and out of the lungs in one<br />
minute, may be either inhalation or exhalation volumes, which are rarely the<br />
same. The fact is usually ignored when this term is used.<br />
Respiratory Exchange Ratio (R)-CO2/O2 ratio as determined from<br />
inhaled exhaled gas composition comparisons. Will deviate from R. Q. with<br />
hypoventilation ate! hypervcntilation.<br />
Respiratory Quotient (R Q)-CO2/O 2 ratio as a result of tissue metabolism<br />
Respiratory Rate-frequently trued by physicians and physiologists as a<br />
synonym for breathing frequency, used by biochemists to indicate the rate of<br />
tissue metabolism.<br />
General Anatomy of Chest and Lungs<br />
The relations of chest and lungs are shown in figure 11-1, which<br />
schematically shows the grosser features and the position of the heart, which<br />
shares the chest cavity with the lungs. The major divisions of the "respiratory<br />
tree" and a schematic of the micro anatomy are shown in figure 11-2. The<br />
branching and rebranching of the bronchi and bronchioles gives rise to a very<br />
large number of respiratory bronchioles and alveoli. The total surface contact<br />
between alveolar air and lung capillary blood is approximately 100 square meters<br />
(about half a singles tennis court) in the healthy adult male.<br />
Accumulating evidence indicates that microscopic lung structure is<br />
deleteriously affected by a number of pollutants. Since the life _upport engineer<br />
may be called upon to provide respiratory protection and support equipment for<br />
use in environments where the atmosphere cannot be economically cleansed of<br />
pollutants some knowledge of the microscopic anatomy of the lung may be<br />
useful.<br />
Intrathoraeic Pressure<br />
During development of the fetus and during the growth of the child, the<br />
chest cavity enlarges faster than the lung increases in size. Consequently, the<br />
lung pulls away from the chest wall with greater and greater pressure. This<br />
pressure is referred to as the intrapleural pressure or intrathoracic pressure.<br />
Because intrathoracic pressure is applied directly to the heart and major thoracic<br />
blood vessels, changes in intrathoracie pressure have effects on the circulation.
Respiratory System 491<br />
Increased intrathoracicpressurepreventswmousretornto theheart.Cardiac<br />
outputrapidlyfallsreducingbloodpressureandbloodsupplyto thebrain,<br />
and,sinceit hasno abilityto accumulate anoxygendebt,thebrainceases<br />
to functionandunconsciousness ensues. Theengineer amtdesigner of life<br />
supportequipmentnmstbe carefulnot to produceor require chau#_s in<br />
this pressure that compromise the circulation.<br />
PARIETAL PLEURA<br />
VISCERAL<br />
PLEURA<br />
DIAPHRAGM /'<br />
/ \<br />
HEAR]- AND MAJOR<br />
BLOOD VESSELS<br />
i MEOIASTINUM<br />
//<br />
////<br />
,I/' _ RIBCAGE<br />
/ ESOPHAGUS<br />
Figure 11-1. Gross anatomical relations of chest and lungs.<br />
General Function of Respiration<br />
In the majority of people during routine activities, the depth and rate<br />
of breathing movements are regulated for the maintenance of carbon<br />
dioxide in the arterial blood. Oxygen want can be regulating, but only<br />
when the oxygen content of the inspired gases is reduced to nearly half<br />
that in air at sea level. Oxygen partial pressure, except in some unusual<br />
circumstances, should always be high enough so tbat the breathing will be<br />
regulated by the body requirements for CO 2.<br />
The oxygen content of lung air will be determined by the oxygen<br />
content of the inspired gases, the flushing of the hmgs required for CO 2<br />
regulation, and the rate of oxygen uptake by the blood as it pasts through<br />
the lungs.
492 Bioastronautics Data Book<br />
11D 2aO ML<br />
DEAO SPACE<br />
NO EFFECTIVE<br />
GASEXCHANOE<br />
BRONCNU$<br />
BRONCHIOLE<br />
AI R SACS _<br />
ATRIUM<br />
ALVEOLAR DUCT<br />
RESPIRATORY BRONCHIOLES<br />
BRONCHIOLE _<br />
Figure 1 1-2. Micro-anatomical relations of chest and lungs. Terminal bronchiole gives rise<br />
to lO to 20 respiratory bronchiolcs, each of which widens into alveolar ducts with many<br />
hundreds of alveoli. The alveolar duct often has several major partitions, the so-called<br />
alveolar _cs. Intcralveolar scpta are shown extcnding into the sacs; the irregular small spaces<br />
thus fnrmrd are the alveoli.
Respiratory System 493<br />
Respiration<br />
Strictly speaking, respiration refers to the tissue enzyme oxidation<br />
processes that utilize oxygen and produce carbon dioxide. More generally<br />
this term designates the phases of oxygen supply and carbon dioxide<br />
removal. The following annotated outline shows the general subdivisions of<br />
the overall process:<br />
1. Breathing-Movement of chest/lung complex to ventilate the alveoli<br />
2. External respiration-Exchange of gas (0 2 and CO2) between lung<br />
(alveolar) air and blood<br />
3. Internal respiration-Exchange of gas between tissue blood and the<br />
tissue cells<br />
4. True respiration-Ultimate utilization of oxygen by tbe cells with the<br />
coincident release of carbon dioxide.<br />
To the biochemist respiration refers to the enzymatic processes in the<br />
tissues which use oxygen and produce carbon dioxide. Figure 11-3 shows<br />
the general function of the blood in tissue gas supply and removal.<br />
Figure 11-3. Gas exchange between the capillary blood and tissue cells.
494 Bioastronauties DataBook<br />
BreathingMovements<br />
Thevolumeofthelungsisdetermined bythebalance between theelastic recoil<br />
ofthehmgsandtheelasticityof thecheststructureintherestingposition.From<br />
thismidposition appropriate muscular actionwillproduce either an exhalation or<br />
an inhalation. Breathing motion during space flight, as on Earth, is produced by<br />
active inhalation (increasing lung volume above of nfidposition). Subsequent passive<br />
exhalation is produced by tile elastic recoil of the chest/I ung complex releasing<br />
potential energy stored during the active inhalation. Figure 11-4 depicts the<br />
balance of forces establishing nfidposition and the mechanism of passive exhalation<br />
during ,ormal breathing. Any system design or use that requires forced exhalation<br />
(e.g., pressure, breathing in high altitude flying) will produce rapid discomfort and<br />
thtigue. Therefore, low exhalation resistance is required.<br />
C 0= _ - LUNG.......<br />
BALANCE OF FORCES<br />
AT MIDPOSITION<br />
.... CHEST WALL<br />
POTENTIAL ENERGY STORED<br />
DURING INHALATION<br />
Figure I 1--l. Balance of forces at midposition and mechanism of passive exhalation.<br />
Inhalation Movements<br />
The mechanism of inhalation may be an important consideration in support<br />
equipment design because any circunmtance which tends to deform the usual<br />
mechanism will be both limiting and fatiguing.<br />
The expansion of the chest in the lateral diameter is produced by movement of<br />
the lower full ribs (6 to 10). They are bowed downward, and, during inhalation,<br />
move up and out much as the bail on a bucket is raised. The chest is increased in its<br />
anterior/posterior diameter by movement of ribs 2 and 5, which elevate the<br />
sternum. In adults, the ribs have a downward slant from their attachment to the<br />
vertebral column.<br />
7-<br />
/<br />
\<br />
/[
Thechestis increased<br />
diaphragm.<br />
Exhalation Movements<br />
Respiratory System 495<br />
in the head-foot dimension by descent of the<br />
In most breathing activity, exhalation is entirely passive. The relaxation of<br />
the inhalation muscles permits the forces of gravity and stored elastic energy to<br />
return the chest/lung complex to its normal midposition. In weightlessness, only<br />
elastic recoil remains as a passive force for exhalation; but it is adequate. In<br />
active exhalation the ribs move down, decreasing both the anterior/posterior and<br />
lateral dimension of the thorax. This compression is a usual concomittant of<br />
parturition (childbirth), micturition, defecation, and vomiting.<br />
Frequency and Depth Variations<br />
Control of Breathing<br />
To understand the effects on breathing of various conditions of space flight,<br />
it is well to know the basic mechanisms by which the body regulates the rate and<br />
depth of breathing. Normal resting rates may vary from 5 to more than<br />
30 breaths per minute and httle is known about the mechanisms that determine<br />
individual differences. Slower breathing rates are related to greater breathing<br />
depths. This relationship is a very constant one. There is, on the other hand, a<br />
very narrow normal range for alveolar ventilation. The rate and depth of<br />
respiration produces, in the average individual, an alveolar CO2 concentration of<br />
40 mm Hg; thus, deeper breaths accompany slower breathing rates.<br />
To differentiate alveolar ventilation from total lung ventilation the following<br />
terminology is used:<br />
1. Pulmonary ventilation-The total amount of air moved by the breathing<br />
movements<br />
2. Alveolar ventilation-The volume of inspired gas which reaches and<br />
ventilates the alveoli, i.e., total ventilation minus dead space ventilation.<br />
Table 11-1 shows the relations to produce a 6.0 liter per minute alveolar<br />
ventilation with 150 ml dead space.<br />
Table 11-1<br />
Dead Space Alveolar<br />
Breathing Rate Total Ventilation<br />
Ventilation Ventilation<br />
Breaths/rain _ /rnin<br />
/min _/rain<br />
5<br />
10<br />
20<br />
3O<br />
0.75<br />
1.50<br />
3.00<br />
4.50<br />
6.75<br />
7.50<br />
9.00<br />
10.50<br />
6.0<br />
6.0<br />
6.0<br />
6.0
496 Bioastronautics Data Book<br />
When equipment dead space is added to body dead space, the breaths at any<br />
one breathing frequency must be correspondingly deeper. Considerable<br />
difference of opinion exists as to the effects of added dead space. Some<br />
investigators believe that there are compensating mechanisms that tend to keep<br />
CO 2 at tt,e desired level. Others do not. Thus, engineers and designers may have<br />
to decide between added support system complexity and dead space increases. A<br />
brief description of some of the mechanism of breathing control will be<br />
presented so that the dead space effccts car, be better appreciated.<br />
Mechanisms of Breathing Control<br />
Normal rhythnuc breathing is controlled by the requirement to ventilate the<br />
lungs to removc CO 2 as fast as it is produced by metabolic activity. There are,<br />
however, other factors effective in the control of breathing. These arc illustrated<br />
schematically in figure 1 1-5 and described briefly below.<br />
CEB_B_AL COHIt X<br />
:: Y_q ×"_"'_ 1 l'.f /..._/<br />
Figure 11-5. Respiratory" control elements.<br />
Cerebral Cortex Control. Physical exercise results in an immediate increase<br />
in pulmonary ventilation. Impulses originating in the cerebral cortex<br />
stimulate the respiratory center to greater activity, so that breathing is<br />
increased in anticipation of exercise. Breathing is also regulated by the
Respiratory System 497<br />
cerebral cortex to accommodate talking, swimming, etc. Within limits, there<br />
is also a voluntary control of breathing that is cerebral in origin.<br />
Under heavy exercise, maximum pulmonary ventilation can reach 110 to<br />
120 liters per minute, as compared to a resting rate of 6 liters per minute.<br />
In aviation, however, extremes of physical activity are not encountered,<br />
with the metabolic oxygen consumption seldom exceeding 2 to 3 times the<br />
resting rate. On this basis, the provision of oxygen in military aircraft is<br />
based on a pulmonary ventilation rate of 25 liters.<br />
Blood Pressure Effects. Pressoreceptors in the carotid sinus respond to<br />
blood pressure changes with impulses that regulate breathing rate as well as<br />
blood pressure. Increased blood pressure results in a lowercd respiratory rate<br />
and falling blood pressure increases tile rate.<br />
Chemoreceptor Reflexes. The primary receptors for chemical control of<br />
breathing are located within the respiratory system. There are, however,<br />
chemoreceptors adjacent to the aortic and carotid arteries that reflexively<br />
affect breathing regulation. Two reflexes are involved. Increases in the PCO2<br />
and hydrogen ion concentration stimulate breathing to make it faster and<br />
deeper; decreases depress breathing. Falling oxygen/blood tensions (oxygen<br />
want) also stimulate breathing. With a falling oxygen content of inspired air,<br />
the blood is better oxygenated with increased alveolar ventilation. This<br />
mechanism produces hypocapnia at high altitudes without supplemental<br />
oxygen. Under these conditions, the hypoxic drive overrides the usually<br />
precise PCO2 control. The resulting hyperventilation decreases the carbon<br />
dioxide concentration, thereby effecting an increase in oxygen concentration<br />
since water vapor pres,sur, remains constant.<br />
Lung Stretch Receptors. There are three types of stretch receptors in<br />
the lung that are stimulated progressively as the lung is inflated. One set of<br />
receptors increasingly inhibits further inhalation and finally terminates it.<br />
Passive exhalation then follows. When inhalation is deeper and more forceful<br />
than usual, another set excites the inspiratory center of the medulla to<br />
further intensity of inspiration. The response of these receptors is short<br />
lived and inhalation inhibitory receptors come into play, abruptly<br />
terminating inhalation. Lastly, when inhalation is very deep, for example,<br />
during heavy exercise or emotional stress, a third set of receptors produces<br />
a forced, active exhalation.<br />
Reflexes from Muscles and Joints. Increases in breathing activity during<br />
exercise cannot be explained by chemical or blood pressure changes since<br />
arterial blood PCO2 is usually lower and PO2 elevated during exercise<br />
compared to values at rest. A very important factor in increased breathing<br />
activity during exercise is the reflex stimulation from joint and muscle<br />
movement. Even movement of the arm or leg stimulates breathing.
498 Bioastronautics DataBook<br />
Lung Volumes and Capacities<br />
For descriptive convenience the total capacity of the hmg at full<br />
inspiration is divided into several function',d subdivisions. These are defined<br />
below and illustrated in figure 11-6.<br />
r-<br />
g<br />
t_<br />
RESIDUAL VOLUME<br />
EXPIRATORY RESERVE<br />
VOLUME<br />
TIDAL VOLUME<br />
INSPtRATORY<br />
RESERVE<br />
VOLUME<br />
Figure 11-6. Inspiratory capacity and tidal capacity.<br />
The four primary lung volumes which do not overlap are:<br />
i°<br />
1. Tidal Volume (TV)-the volume of gas inspired or expired during<br />
each respiratory cycle.<br />
2. Inspimtory Reserve Volume (IRV)-the maximal volume that can be<br />
forcibly expired following a normal inspiration (from the end-inspiratory<br />
position).<br />
3. Expiratory Reserve Volume (ERV)-the maximum amount of air that<br />
can be forcibly expired following a normal expiration.<br />
4. Residual Volume (RV)-the amount of air remaining in the lungs<br />
following a maximum expiratory effort.<br />
Each of the four following capacities includes two or more of the<br />
primary volumes.<br />
1. Total Lung Capacity (TLC)-the sum of all four of the primary lung<br />
volumes.<br />
2. Inspiratory Capacity (IC)-the maximum volume by which the lung<br />
can be increased by a maximum inspiratory effort from midposition.
Respiratory System 499<br />
3. Vital Capacity (VC)-the maximum amount of air that can be<br />
exhaled from the lungs following a maximum inspiration. It is the sum of<br />
the inspiratory reserve volume, tidal volume, and expiratory reserve volume.<br />
4. Functional Residual Capacity (FRC)-the normal volume at the end<br />
of passive exhalation, i.e., the gas volume which normally remains in the<br />
lung and functions as the residual capacity.<br />
The lung volumes and capacities are frequently determined by use of a<br />
spirometer (a volume displacement device into which the subject breathes).<br />
From this instrument a spirogram (volume change versus time) is obtained.<br />
Significance of Lung Volumes for Equipment Design<br />
Functional Residual Capacity. FRC is important in equipment design for<br />
two principal reasons. First, when a closed-loop breathing system is used,<br />
the total gas volume will be the sum of the gas volumes of the rebreather<br />
loop and FRC and the tidal volume. (The tidal volume will be contained in<br />
either the lungs or the rebreather bellows or will be distributed between<br />
them during inhalatory or exhalatory activity.) This total system gas volume<br />
is important in considerations of inert gas dilution, expansions or<br />
contractions with pressure change, inert gas washout, etc. Secondly, should<br />
the expanding gases exceed tolerable pressures, the designer must assure that<br />
a breathing apparatus will not so impede the flow of these rapidly<br />
expanding gases as to increase lung pressures above these critical levels.<br />
Residual Volume. Because the residual volume is that portion of lung<br />
volume that remains in the hmg after a forced exhalation, to reduce lung<br />
volume below this level will require compression of the chest/lung complex<br />
or an increased trans-lung (intrapleurai pressure to alveolar air pressure)<br />
pressure gradient as the result of reduced external breathing apparatus<br />
pressure acting through the airway. Regardless of the mechanism, lung<br />
collapse (atelectasis), lung blood vessel rupture, pulmonary edema, or any<br />
combination of these three effects may occur. It is therefore, important to<br />
assure that system operation over every possible range of pressure changes<br />
never produces such pressure differentials as to require a lung volume less<br />
than rcsidual volume.<br />
lnspiratory Capacity and lnspiratory Reserve Volume. lnspiratory<br />
capacity represents the maximum volume of air that can be forced into the<br />
lung by ebanges in system volume, without producing overexpansion of the<br />
lungs. The volume of the inspiratory reserve capacity is progressively<br />
reduced during an inhalation, and the remaining volume that can be inhaled<br />
is referred to as the inspiratory reserve volume. Thus, during a breathing<br />
cycle, the permissible increase in lung volume imposed by system pressures<br />
is reduced by the tidal volume. When system pressures are such as to<br />
require a lung volume increase greater than that represented by the<br />
inspiratory capacity (or inspiratory reserve volume, as appropriate), the lungs<br />
are overextended, and lung rupture is possible. It is, therefore, important to
500 Bioastronautics Data Book<br />
assure that system pressure changes will never require an increase in lung<br />
volume above what could be produced by a maximum inhalation.<br />
Tidal Volume. A closed-loop system must have a rebreather belh)ws that<br />
will accommodate the largest expected tidal volume. Such a tidal volume<br />
c_mld, of course, be as large as the vital capaeity. But it might not be<br />
practic',d to provide so large a rebrcather bellows. In such a case a<br />
rebreather bellows of reasonable size should be provided (determined by<br />
expected level of exercise, etc.). In this case increased inhalation volumes<br />
can be provided from oxygen storage and increased exhalation w4umes can<br />
be accommodated by venting through a spring loaded exhalation pressure<br />
safety valve.<br />
7btal Lung Capacity. In an extreme case,, the maximum amount of gas<br />
the lungs ,'ouid contain, which must be considered for total system volume<br />
calculations and accommodation for gas expansion, is the, total lung capacity.<br />
Although such a circunLstance is unlikely, a conservative design must use this<br />
volume as the basis for Ihe design.<br />
Average Lung Capacities, Volumes, and Function Capabilities<br />
for Healthy Adult Males<br />
There is considerable individual variability in lung volumes and<br />
capacities. This variability is some.what decreased if the data art: shown with<br />
size and age relationships. Figures 11-7 through 11-ll presents these data.<br />
().e sl_ould note, however, that because of individual variations, the values<br />
presented must be ttsed oJdy as approxinlations when applied to individuals<br />
or small [4roups of individuals.<br />
FRC(t BTPS) 0 1-0 2-0 30 4'0 50 6 0<br />
T , _p" _,.Z+r 12"[ _4" I _<br />
60-[_ + ; ;+q !_TC r= 4 ; J"<br />
jZ<br />
+z:<br />
._;.,(+ _<br />
:(! 1; N<br />
+.,4q<br />
'.;"FT1<br />
Ag+40 _/"<br />
•<br />
2o+_-_<br />
_/--/'t i/i VP-++,t? /<br />
: f ' i, : ;=<br />
_/, d/+ t_4 t/_/IX+t-+,<br />
-.bx_./+i q<br />
/'! l<br />
±I _,,q<br />
// /<br />
/// /<br />
.s;gt M+.++<br />
"+-/i<br />
i FRC SO061<br />
100 90 80 70 60 50 Wt (kg)<br />
Figure 11-7. Functional residual capacity (FRC) in normal adult males.<br />
(Cotes, 1968)
0<br />
LU<br />
U_<br />
5.0<br />
l.C<br />
=<br />
30 _<br />
2-C<br />
1.5 1.6 1-7<br />
Height Ira)<br />
Figure 11-8. Forced expiratory volume<br />
Respiratory System 501<br />
(Cotes, 1968)<br />
Age(yr)<br />
_-- FE%, °<br />
1-8 1.g<br />
m normal adldt males.<br />
l.S 1.6 1.7 1.8 1.9<br />
Heigmt (ml<br />
Figure 11-9. Total lurrg capacity (TI,C), vital capacity (VC),<br />
and residual volume (RV) in normal adult males. (Cotes, 1968)<br />
TLC
502 Bioastronauties DataBook<br />
FRC<br />
itl<br />
Height<br />
[in)<br />
22®'3°,0525°_°1 I:i '_0 IU<br />
2 20 -<br />
t<br />
7 51 67 [ 6 0<br />
58<br />
2 51<br />
59<br />
7o 6 5<br />
2 81 71 "<br />
271 I<br />
2 91 72 7 O<br />
{<br />
311% t-7.5<br />
3 22 ?6<br />
332 77 ! 80<br />
3_2 78 i<br />
352 79 J_85<br />
RV<br />
MVV F<br />
lWmln}<br />
Age<br />
{() 10 (yrl .RV%<br />
20 }21<br />
| Z3<br />
15 _,0 }25<br />
$ 27<br />
50 }23<br />
20 I "_t<br />
25<br />
ILC ss 087<br />
FRC so 053<br />
RV So O 53<br />
RV% s:_ 6'25<br />
MVV 53 29<br />
FEVI o so 0 52<br />
FVC sD 0 58<br />
rnches<br />
80 _33<br />
220_-" 5'0<br />
200[ t_ 5<br />
180L. 40<br />
isoL -35<br />
FVC 60<br />
(L)<br />
5"5<br />
50<br />
_'5-<br />
I<br />
_20<br />
30 40<br />
:t'°°t_'<br />
-tso[ -2_ ss<br />
]Boi ,s<br />
155 160 155 170 175 180 185 190 195 200 205<br />
Centimeters<br />
Figure It--10. Nomogram relating indices of ventilatory capacity to weight arm height<br />
for normal adult males. (MVV = max voluntary ventilation; FEV 22 = forced expiration<br />
velocity at one second from start of forced exhalation from full lung). (Cotes, 1968)<br />
[!! I .ales<br />
-_ _I--T ! -F -r-<br />
' i I I _ i<br />
6so i ! _ [ i<br />
z'505 16 1.7<br />
Height (m}<br />
30<br />
1'8 1"9<br />
Figure 11-ll. Expiratory peak flow rate ill normal adult males. (Cotes, 1968)<br />
PFR<br />
sD 60
Pressure/Volume Relations<br />
Respiratory System 503<br />
Mechanical Relations<br />
A knowledge of the pressure/volume relationships is important in the<br />
design of life-support equipment. Figure 11-12 presents the relationship in<br />
its simplest form. Maximum inspiratory (at the left of the figure) represents<br />
the negative inspiratory pressure that can be exerted with lung volume<br />
varying from 0 to 100 percent of vital capacity and the maximum inhalation<br />
volume exchange over a range of negative pressures to nearly 100 mm ltg.<br />
For example, with the lung completely emptied, when only residual air<br />
remains (Point 1), a maximum inspiratory effect of approximately 90 mm<br />
Hg can be exerted. Also, if the pressure in an external breathing loop is<br />
90 mm Hgnegative, no inspiratory volume can be moved. In fact, this<br />
negative pressure will empty the lung to this point. If the negative pressure<br />
were greater, i.e., more negative, there would be marked engorgement of the<br />
lung vascular bed with imminent threat of blood vessel rupture.<br />
|00"<br />
100 80 60 40 -20<br />
PULMONARy PRESSURE {ram Hg)<br />
J<br />
/./t<br />
0 20 40 60 80 1O0<br />
{ t I _ "1<br />
Figure 11-12. Pressure/volume relations of chest/lung complex.<br />
With the lung as full as possible (Point2) no additional inspiratory<br />
effort can be exerted. It also can be seen that, if the pressure in the<br />
external breathing loop is the same as lung pressure, a full vital capacity can be<br />
exchanged.<br />
The points establishing the curve labeled maximum expiratory are obtained<br />
in a like manner using exhalation efforts and positive rather than negative<br />
pressures. Thus, at 100 percent vital capacity a maximum exhalation effort can<br />
be made, and at 0 percent, no exhalation effort made. Likewise, with about<br />
100 mm Hg positive pressure the lung is completely filled in spite of a<br />
maximum exhalation effort so that no air can be moved. If more pressure<br />
/<br />
/<br />
i
504 Bioastronautics Data Book<br />
is exerted there is the danger that the lung may be stretched to the rupture<br />
point with tearing of tissue, bleeding, and loss of effective gas exchange<br />
surface.<br />
The reader is cautioned that these curves present average values for<br />
maximum breathing efforts. For any one person danger may exist at much<br />
lesser pressure values. These figures, then, represent extremes that should<br />
never be approached as design points.<br />
Tile maximum pressure/volume loop takes on new meaning if an additional<br />
dimension, the pressure volume relations for the relaxed chest-lung complex, is<br />
included (figure 11o13). The point at which the relaxation pressure curve crosses<br />
the zero pressure line is the midposition; the volume below it is the expiratory<br />
reserve volume, and the volume above it is the inspiratory capacity. The figure<br />
shows that at about 20 mm Hg negative pressure the lung is collapsed to the<br />
residual volume, if there is no competing muscle force. At about 20 mm<br />
Hg positive pressure the lung is completely filled, if there is no competing<br />
exhalation muscle force.<br />
100-<br />
80-<br />
6O<br />
40<br />
20-<br />
-2O<br />
PULMONARY PRESSURE [ram Hg}<br />
Figure ll 13. Pressure/vohme relations of chest/lurtg complex (including relaxion<br />
relations and pressure breathitrg); cross hatched triangle is elastic work of breathing at zero<br />
pressure differential.<br />
Since the pressure/volume loop has the dimensions of work<br />
(AREA : volume x pressure : cm3 x gm/cm2 : gm centimeters), one can also<br />
show diagrammatically the mechanical work done at different brcathing loop<br />
pressures. This is shown in figure 11-13 for zero pressure differential and for<br />
a positive 30 mm Ifg differential.<br />
The n,cchanical work at zero pressure differential is done by the<br />
inspiratory muscles because exhalation is passive. At 30 mm ltgpositive
Respiratory System 505<br />
pressure, the mechanical work is done by the expiratory muscles. The<br />
fatigue effect is even greater than the relative increase in mechanical work<br />
so that such breathing cart be endured only during an emergency.<br />
Pressure breathing is employed in emergency situations in aircraft flight and<br />
might be a desirable fallback capability for some space flight contingencies. The<br />
limit of tidal pressurc/volume loops over a range of negative to positive breathing<br />
loop pressures can be superimposed on figure 11-13. Because there is an<br />
inherent, reflex, muscular counterforce applied to the diffi_rential breathing loop<br />
pressures, the limit cnvelope for the tidal pressure/volume loops deviates from<br />
the relaxation pressure curve. Thus, whenever thc applied pressure is positive,<br />
relaxation of the exhalation muscles does not occur at any phase of the<br />
breathing cycle. The same is true for inspiratory mtrselcs if ncgative pressures are<br />
applied. The position of the curves determining the pressure/volume loops ow_r a<br />
range of breathing loop pressures is shown in figure 11-13.<br />
Breathing Resistance and Mechanical Work of Breathing<br />
Breathing equipment, no matter how well desig||cd, provides some flow<br />
resistance. "Safety pressure" may be employed to remove inhalation resistance,<br />
but then exhalation resistance is correspondingly increased. Increased flow<br />
resistance increases the work of breathing. Mechanical work over a range of<br />
breathing resistance is shown in figure 11-14. The pressure/volume loops shown<br />
were obtained at uniform breathing ratcs of 40 breaths per minute and with<br />
nmximum or near maximum effort.<br />
Note that at low resistance (50 nun ll20 pressure to produce I00 liters per<br />
minute flow) the area, aml therefore mechanical work, is small. As pressures are<br />
increased (125 and 225 mm llg), the volume moved is not appreciably lessened,<br />
but the pn_ssures exerted are much highcr so that the mechanical work done is<br />
greater. With still higher pressures (675 mm), the work lessens because the<br />
respirator" |uusclcs cannot exert higher pressures. Thus the volume decrea_cs<br />
because breathing in all cases is at 40 brcatt_s iwr trdnute. As far as work<br />
output is eonccrned, there is an optimal loading of the breathing<br />
mcchanism. This is shown in the figure 11-15. The oxygen cost of breathing<br />
through these resistances was relatively flat across the range of hreathing<br />
resistances.<br />
With mechanical work done and tile coincident oxyget, cost, one can<br />
calculate the efficiency. These relations are shown i_ figure 11-16.<br />
Oxygen consumption for the suhjeets in the study illustrat
5t J6 Bioastronautics Data Book
Respirator, Systt m<br />
INSPIRATORY WORK EXPIRATORY WORK<br />
_ i I I II I 1 l ! I I _ i 11 II T I I | ] I<br />
4o _<br />
30 1<br />
2_<br />
5 AIRWAY RESISTANCE (mmHzO/IOOL MIN FLOW) -<br />
O<br />
TO K)O 200 .]1OO 500 TOO 50 TO _ 200 _30 500 ;'OQ<br />
Figure 11-15. Mechanical breathing work output with maximum breathing effort at several<br />
airway resistance levels. Symbols represent different subjects. (Reprinted from Journal of<br />
Applied Physiology, 1958, 13(2 ), 194-204)<br />
2690 =-<br />
ZZO0<br />
1800<br />
t400<br />
IOOO<br />
600<br />
200<br />
4,- •<br />
t I I I ] I 1Fig. 6 I 1 ¢ I i i<br />
.-- _<br />
SE I I I I I I I I 1 l I _S[<br />
50 70 90 _OO 200 500 400 600 7OO<br />
AIRWAY RESISTANCE (mmHzO/IOOLMIN FLOW1<br />
Figure 11-16. Breathing efficiency with maximum breathing effort at several airway<br />
resistence levels. (Reprinted from Journal of Applied Physiology, 1958, 13(2), 194-204)<br />
;<br />
507
508<br />
Velocity/Volume Loop<br />
Bioastronautics Data Book<br />
If breath velocity is plotted against breath volume, and if inspiratory<br />
volumes are equal, a closed loop is generated. When maximum inspiratory and<br />
expiratory efforts are exerted, a closed loop is formed. For adult males the<br />
velocity/volume (V/V) loop has the form presented in figure 11-17. This contour<br />
is markedly changed with respiratory diseases and aging. The figure also shows<br />
lung volumes and capacities usually ob_ined from a spirogram by superimposing<br />
the resting V/V loop on the maximum V/V loop 0.<br />
I<br />
I<br />
INSPIRATORY CAPACITY<br />
INSPIRATORY__,,.._<br />
RESERVE<br />
r''_''J<br />
TIDAL'<br />
RESERVE<br />
I<br />
I VOLUME I<br />
I I<br />
I I<br />
t I<br />
I...---VITAL CAPACITY ----_-I<br />
Figure 11-17. Maximum velocity/volume (_r/y) loop.<br />
Became time elements can be determined, it is feasible to use the<br />
maximum _?/V loop for obtaining any of the frequently used timed vital<br />
capacities of forced expiratory volumes, as they may be called. Figure 11-18<br />
illustrates the technique for full inspiratory and expiratory efforts.<br />
The _r/V loop can be determined during space flight by use of a<br />
pneumotachograph and appropriate transducers (figure11-19). These are<br />
lightweight and can be integrated into the life-support equipment. Became<br />
the pneumotachograph produces only a velocity signal, the coincident<br />
volume values are obtained by integration under the velocity trace. This is<br />
conveniently done by using an onboard or ground-based computer.<br />
Gas Density, Airway Resistance, and Flow Rates<br />
The reduced pressures during space flight produce a reduced gas density.<br />
If helium were used as the inert gas in a two-gas atmosphere, there would be an<br />
i
Respiratory System 509<br />
additional reduction in gas density. Reduced gas density results in lesser airway<br />
resistance for a given flow rate. Airway resistance is also determined by gas<br />
viscosity and gas density; but over wide ranges of density differences, viscosity<br />
effects will be small. If increased airway resistance slows the transit time of gas<br />
f_om the alveoli to the mouth, a measure of the lag between alveolar pressure<br />
production and resultant air flow at the mouth will reflect relative resistance to<br />
_r flow,<br />
v<br />
>-<br />
I-"<br />
O<br />
.ll<br />
tsJ<br />
><br />
I file,<br />
For Expirolion EVGT -<br />
VOLUME (V)<br />
V 2 ,5 z<br />
A 20.75<br />
For Inspirotion IVCT V 5z<br />
:" A : 34.15<br />
XPi RATION<br />
}1l/tee<br />
: I 20 sec.<br />
- O. 73 sec.<br />
Figure l 1-18. Use of the maximum _r/V loop for calculating inspiratory vital capacity<br />
time (IVCT) and expiratory vital capacity time (EVCT).<br />
INSPIRATION<br />
FORCED FORCED FORCED<br />
EXPIRATION INSPIRATORY EXPIRATORY<br />
NORMAL FROM VITAL VITAL NORMAL<br />
BF(E_THS MIOPOS/TtON CAPACITY CAPACITY BREATHS<br />
V<br />
./k./ z,,oF o,,<br />
Figure 11-19. Construction of "V[V loop from pneumatogram.
510 Bioastronautics Data Book<br />
To understand the effects on the astronaut of engineering expediencies that<br />
may compromise the exchange of gases between alveolar air and capillary blood,<br />
it is helpful to note the partial pressures of gases in this exchange (table 11-2).<br />
The only active process in the exchange is transportation (the circulation of the<br />
blood and the ventilation of the lungs). There is no secretory process. The gases<br />
move along concentration gradients as seen in the table.<br />
Inspired air<br />
Expired air<br />
Alveolar air<br />
Arterial blood<br />
Venous blood<br />
Tissues<br />
Table 11-2<br />
Partial Pressure and Gas Exchange Breathing Air at Sea l,evel<br />
02<br />
158<br />
116<br />
100<br />
100<br />
40<br />
30 or<br />
less<br />
CO 2<br />
32<br />
40<br />
40<br />
46<br />
0.3<br />
50 or<br />
more<br />
Gas Partial Pressure<br />
A study of this table raises three questions that should be answered :<br />
N 2<br />
596<br />
565<br />
573<br />
573<br />
573<br />
573<br />
H20<br />
47<br />
47<br />
47<br />
47<br />
47<br />
5.7<br />
Total<br />
l. Why is the alveolar/venous blood gradient so much larger for O 2 than for<br />
CO 2 ? Although 02 is a smaller molecule than CO2, and therefore diffuses faster,<br />
CO 2 is approximately 30 times more soluble in body tissues than k_ 02. There-<br />
fore, the effective diffusability is approximately 20 times greater for CO2 than<br />
02, and a concentration gradient for CO2 of 6 mm Hgresults in a more<br />
complete equilibration than does a concentration gradient of 60 mm ttg for 02.<br />
This general relationship is important in design. Oxygen supply to the tissues is<br />
much more sensitive to derangement than is CO 2 removal, thus the necessity for<br />
assuring equipment and physiological 02 supply adequacy.<br />
2. Why is nitrogen partial pressure lower in lung air and blood than in<br />
inspired air? Actually if gas composition is calculated on a dry basis, percentage<br />
of nitrogen is higher in alveolar air (and blood) than in inspired air. This is<br />
because more oxygen is picked up by the blood than CO 2 released. This reflects<br />
metabolic activity in the tissues when varying combinations of fat, carbohydrate,<br />
and proteins are burned producing ratios of CO 2 production to O 2 consumption<br />
(called Respiratory Quotient (RQ) in the tissues or Respiratory Exchange Ratio<br />
(R) for exhaled air).<br />
3. Why is total gas pressure, including water vapor pressure, less in venous<br />
blood and tissue than in arterial blood and respiratory gases? As is apparent from<br />
the gas partial pressure table 11-2 this difference reflects the difference in partial<br />
p_ssure for oxygen uptake by the tissues (60 mm Hg for venous blood) atul<br />
carbon dioxide increase as a result of CO 2 release by tissue metabolic activity<br />
760<br />
760<br />
760<br />
760<br />
706<br />
700
Respiratory System 511<br />
(6 mm llg for venous tdood). Implicit in this comparison is tile observation that<br />
for binding of a given quantity of gas there must be a much larger change in 02<br />
partial pressure than in CO2 partial pressure. This reflects the very large binding<br />
(or buffering) capacity of blood and other body fluids for (]02. Indeed, as<br />
discu_ed later in this section, hypoventilation and hyperventi/ation can move<br />
enormous quantities of CO 2 in and out of body storage, respectively. The lower<br />
total partial pressure of dissolved gases in venous blood and tissue assures tilat<br />
gas injected into the body or leaked from the lung by rupture will bc quickly<br />
absorbed by the blood. Thus, then: arc no permanent gas pockets in any tissue in<br />
the body.<br />
Oxygen Dissociation Curve of Hemoglobin<br />
The requirements for maintaining oxygen partial pressure at specified levels<br />
is better understood if the mechanism of oxygen transport is understood.<br />
Almost all of the oxygen transported by the blood is carried by the hemoglobin.<br />
0temoglobin carries approximately 19 ml per 100 ml of blood. At usual 02<br />
tensions only about 0.3 ml per 100 ml of blood is carried in the dissolved<br />
state.) The relation between 02 partial pressure and hemoglobin saturation<br />
with oxygen is usually described as the oxygen dissociation curve of<br />
hemoglobin and is presented as a curvc on PO2-percent saturation<br />
coordinates. The general shape of the curve is shown in figure 11-20.<br />
p- <<br />
oz<br />
100<br />
9O.-<br />
80-<br />
7O<br />
6O<br />
5O<br />
40<br />
3O<br />
20-<br />
I0<br />
I | I I 1 1 | I 1 "1<br />
I0 20 30 40 50 60 70 80 90 100<br />
TENSION OF 02 Imm Hg)<br />
Figure 22-20. Oxygen dissociation curve of hemoglobin.<br />
The shape of this curve has great significance. Note that above 50 mm<br />
Hg PO2, there is little increase in hemoglobin carrying capacity for oxygen.<br />
Therefore a lowered alveolar PO2 concentration will not materially reduce<br />
the 02 available for tissue use as long as the partial pressure remains above<br />
50mm Hg. However, at the tissue level where the PO2 is kept low by
512 Bioastronautics DataBook<br />
metabolicactivity,thehemoglobinwill holdlittle oxygen.Thismeansthat<br />
largeamountsof oxygenare reducedfor tissueuse.Table11-2shows<br />
averagevaluesof 02 concentrations in alveolarair,arterialblood,venous<br />
blood, and tissues.Figu_11-21 indicatesthe usual conditionsof<br />
hemoglobin _turationin thelungsanddesaturation at thetissuelevel.Note<br />
the markedlyincreasedamountsof 02 releasedto thetissueswith high<br />
metabolic ratesthat mayreducethetissuePO2levelto nearzero.<br />
100-<br />
70- i<br />
60-<br />
50-<br />
30-<br />
20-<br />
10-<br />
g ..........<br />
O-- I 1 I I 1 I ! t ! I<br />
I0 20 310 40 50 60 70 80 90 I00<br />
i<br />
I<br />
0 2 CONCENTP, AT_ONS AT TISSUE LEVEL<br />
Fimtrc l 1-21. Oxygen dissociation curve of hemoglobin and the facilitation<br />
of 0 2 uptake and relea_,<br />
An additional facility further increases the efficiency of oxygen supply<br />
to the tissues: the oxygen dissociation curve of hemoglobin is not fixed but<br />
is different at the tissue Icvcl as compared to lung blood. The extent of<br />
this shift is shown in figure 11-22. Examination indicates the great efficacy<br />
of this shifting of the curve: hemoglobin/oxygen association is much<br />
facilitated in the lung blood and hemoglobin/oxygen dissociation is much<br />
enhanced at the tissue level. For instance, at 25 mm Hg 02 tension and<br />
with the curve at the far left position, the hemoglobin would be 62 percent<br />
satt,rated, but with the curve at the extreme right position the hemoglobin<br />
is only 35percent _turated. Thus an additional 27percent of total<br />
_turation volume of 02 is released to the tissues.<br />
To conw'rt the percent of saturation to the actual quantity of 02<br />
carried hy hemoglobin, multiply the grams of hemoglobin per 100 ml of<br />
blood by 1.34, which is the milliliters of 02 that will combine with one
Respiratory System 513<br />
gram of hemoglobin. Because normal aduh maic blood contains about<br />
15 grams of hemoglobin, each 100 ml of blood will carry about 20 ml of 02<br />
(called 20 ml percent, i.e., perccnt by volume). But, bccausc of venous<br />
admixture (some, blood in the lungs is not adequately exposed to ventilated<br />
alw:oli), the hemoglobin of mixed arterial hlood is only about 95 to 97 pcr(_cnt<br />
saturated. The curves above show the percent of saturation platcauing at lifts<br />
hwel. llighcr 02 (e.g. 100 percent at sea level) will not m,ch increase thc pcr_mt<br />
saturation. More 02 is carried in simple solution. But for space cabin pressures,<br />
ewm 100 perccnt 02 will not much incrcas_ this carrying capacity hccaus,' 02<br />
_4ution in blood is small.<br />
Z<br />
©<br />
i-<br />
n-<br />
I-<br />
100 -<br />
90 CURVE IN<br />
60-<br />
/ / cunvE ,N<br />
/<br />
50 -- / TISSUE BLOOD<br />
4O<br />
3O<br />
2o -1<br />
]o J<br />
., i i<br />
1 I t I 1 1 1 I I I<br />
10 20 30 40 50 60 70 80 90 100<br />
TENSION OF 0 2 (mmHg)<br />
Figure 11 22, Oxygen dissocialion curve of hemoglobin shill<br />
and lung blood as compar_'d 1o lissuc blood.<br />
The conditions of blood in the hmgs (as compared to those of ti_uc blood)<br />
that causc thc curve to hc shifted to the left arc:<br />
1. Lower tcmpcratur(_<br />
2. Lower pll<br />
3. I,ower ionic con(:cntrati()_,<br />
4. l,owcr PCO 2.<br />
Opposite c(mditi(ms exist at thc tissue level and cause the curve t() be shifted to<br />
the righl.
514 Bioastronautics Data Book<br />
Denitrogenation<br />
Saturation, Tissue Types, and Nitrogen Elimination. Ambient air contains<br />
approximately 79 percent physiologicaUy inert gases of which nearly all<br />
(78 percent) is nitrogen. The body is saturated with nitrogen when breathing<br />
air. When lung nitrogen is removed by flushing with oxygen, the nitrogen<br />
that is dissolved in the body tissues moves along concentration gradients to<br />
the lungs where it is in turn flushed out. If the decrease in lung partial<br />
pressure is too precipitous, the dissolved gases are expanded and collect in<br />
body tissues and structures to produce a variety of symptoms. This<br />
syndrome has many names, such as bends, chokes, decompression sickness,<br />
and caissons disease, which are based on the more conspicuous complaints.<br />
To determine the likelihood of decompression sickness resulting from<br />
inadvertent decompression, one must know: (1) the extent of<br />
denitrogenation at the time of decompression and (2)the absolute level of<br />
inhaled nitrogen immediately preceding the decompression. Continued<br />
exposure to an inhalation mixture containing nitrogen at a low partial<br />
pressure, e.g., 35 mm Hg, will produce a relative denitrogenation with<br />
ultimatc equilibrium at this level rather than at 0 mm HgN 2 partial<br />
prcssure, which would obtain if deuitrogenation were accomplished by<br />
inhalation of lO0percent oxygen (or a mixture of gases containing no<br />
nitrogen). At sea level, breathing air, the body is equilibrated with nitrogen<br />
solution at a partial pressure of approximately 670 mm Hg. Therefore, when<br />
oxygen is breathed, nitrogen elimination proceeds with the initial gradient<br />
for nitrogen movement being approxinrately 670 mm Hg. If, instead of<br />
denitrogenation with 0 mm Hg N 2 pressure, a mixture containing 35 mm<br />
ltg N2 partial pressure is inhaled, the initial driving force for nitrogen<br />
elimination will be a pressure gradient of approximately 635 mm Hg. Such a<br />
small reduction in the total gradient would not meaningfully slow the rate<br />
of nitrogenation, particularly since N2 elimination is generally perfusion<br />
(i.e., blood flow) limited rather than diffusion (i.e., gas diffusion) limited.<br />
Even small changes in lung perfusion rate would affect the rate of nitrogen<br />
elimination much more than would the small difference in driving force.<br />
The other consideration is the absolute pressure of nitrogen in the inhaled<br />
mixture immediately preceding the decompression. If alveolar PN2 is high in the<br />
few minutes before decompression, the probability of bends, or another mani-<br />
festation of decompression sickness, will be determined largely by the long term<br />
alveolar PN2 levels rather than the short-term effects. This is true for two reasons.<br />
First, the high levels of PN2 inhaled for a short time will affect N 2 solution<br />
primarily only in the lowest tissue component, and the nitrogen from this component<br />
will be released very quickly on decompression. Second, bends manifestation<br />
is believed to be largely restricted to the higher tissue components with<br />
long half-times for clearing. Because it takes many hours to clear this tissue (see<br />
table 11-3) and because even the highest PN2 levels expected will not materially<br />
slow the nitrogen elimination from these tissues, short-term exposure to the<br />
higher PN 2 levels should have little effect on bends production.
Respiratory System<br />
Table l I - 3<br />
Tissue Types for Nitrogen Clearance<br />
Tissue Component Tissue Types<br />
515<br />
Time for Removal of Half<br />
Previous Level (Approximate)<br />
I Lungs<br />
1.5 min<br />
Circulatory system<br />
II<br />
III<br />
IV<br />
Viscera<br />
Muscle<br />
Fascia<br />
Skin<br />
Adipose tissue<br />
Bone<br />
8 min<br />
30 min<br />
150 min<br />
(There is evidence for even longer half-time tissues,<br />
perhaps in excess of 940 rain)<br />
The importance in bends production of nitrogen dissolved in the tissues with<br />
long clearance half-times is further suggestcd by the following compari_n. Even<br />
though long-term exposure to an altitude of 4700 feet theoretically removes<br />
only about 15 percent of dissolved nitrogen and one hour of denitrogenation<br />
removes about 60 percent of dissolved nitrogen, still the protection provided<br />
against bends production is about equal.<br />
This discussion has been related to decompression sickness only and not to<br />
hypoxia. It is clear that inhalation of essentially 100 percent 02 during<br />
decompression above 35 000 feet is required and this will not be less efficacious<br />
if predecompression PN2 levels have been 70 mm Hg rather than 35 mm ttg.<br />
Breathing Equipment Design and Nitrogen Elimination. Because nitrogen<br />
solution in body tissues (at pressures of 1 or 2 atm and lower) is directly<br />
proportional to lung concentration, the relative amount of nitrogen contained in<br />
lung air at saturation equilibrium, as compared to that dissolved in the body<br />
tissues, is constant over this pressure range with varying nitrogen percentages in<br />
the respired gases. Therefore, we can consider elimination of nitrogen after<br />
equilibrium, at sea level, and breathing air and then extrapolate to indicate<br />
elimination relations h)r other conditions.<br />
At sea level breathing air, the lungs contain about 2 liters of nitrogen (at<br />
midposition FRC). The total dis_lved nitrogen in the body is not much more<br />
than l liter. If closed-loop breathing equipment is employed and if<br />
denitrogenation is desired, then the nitrogen must be removed from the hmgs<br />
and from the tissues.<br />
Nitrogen elimination from the lungs is quite rapid. Considering N 2<br />
elimination from the tissues, it is apparent from the curve in figure 11-23 that<br />
N 2 elimination from the lungs has essentially asymptoted at about 1.5 minutes.
516 Bioastronautics Data Book<br />
If one considers N 2 elimination as a function of number of breaths, rather than<br />
on a time basis, a theoretical elimination curve can be constructed<br />
(figure 11-24). It is apparent from this curve that lung N 2 elimination is about<br />
90 percent complete in 15 breaths.<br />
I I ' I'l'l'lVl_f<br />
' CHIFFLY PULMONARY NITROGEN<br />
15<br />
I ' [ ' I ''It /1_ . i . ' '''''t '1'1 ' I • l'l'|rl t I<br />
itAS&L CONDiTiONS NORMAt. BREATHING<br />
TISSUE<br />
,/<br />
NITROGEN<br />
J<br />
, ? 8,° _ , 6 8,0 ,o ,o 6o86,oo 2_o ,oo<br />
_.__E_,l,l, tl, _ I , I,I,I,I,I_I I . I , ,I,I ,Iii i , I ,l,hl , I<br />
z<br />
2.5<br />
2.0<br />
a: 1.5<br />
,.J<br />
05<br />
TIME IN MINUTES<br />
Figure 11-23. Accumulated nitrogen elimination.<br />
N 2 REMAINING IN LUNGS AFTER EACH OF 20 BREATHS<br />
ASSUMPTIONS FRC " 25 LITERS<br />
ALVEOLAR VENTILATION = 04 LITERS<br />
IGNORE -- 02 UPTAKE<br />
-- CO2RE LEASE<br />
-- N 2 RELEASE FROM BLOOD<br />
1 I I I I I I I 1 I I I I I 1 I 1<br />
'I 2 3 4 5 6 7 8 9 10 11 12 13 14 15 16 17<br />
BREATHS<br />
Figure l 1-24. N 2 remaining in lungs after each of 20 breaths.<br />
i I I<br />
18 19 20
Respiratory System 517<br />
The importance of these observations to respiratory support equipment<br />
design relates to the requirement for nitrogen purging from closed-loop systems.<br />
It is clear that the purging must be rapid at first to clear the lungs and then<br />
slower over a protracted time to keep equipment PN2 levels low enough to<br />
permit relatiwdy unimpeded nitrogen elimination from the tissues without<br />
extravagant usc of gas for flushing.<br />
Ventilation, Perfusion, Dead Space, and Shunts<br />
In the normal adult male at rest there is an alveolar ventilation of about<br />
5 liters per minute amt a cardiac output (perfusion) of about 5 liters per minute.<br />
Thus, the ventilation/perfusion ratio for the lung as a whole is approximately<br />
unity. However, ventilation and perfusion are not evenly distributed, so that<br />
some alveoli/capillary units are relatively over ventilated (under perfused) while<br />
others are over perfused (under ventilated) (see figure 11-25). In addition, some<br />
of the inhaled air r)ever reaches the alveolar surface, so that it does not take part<br />
in gaseous exchange. Thus the total lung complex may be subdivided into the<br />
following functional compartments so far as gas exchange is concerned:<br />
1. Air in the lung and air conducting passages<br />
2. Ventilated and non-perfused alveoli<br />
3. Perfused and non-ventilated alveoli<br />
4. All variations between 2 and 3, including those with balanced ventilation/perfusion<br />
ratios.<br />
04<br />
10<br />
30<br />
_) .............................................. i ANATO_,_}CAL SHUNT<br />
............................................ !<br />
0'_ [ _'_;[ NTJI ATED<br />
l _ En_US aDml* rt,_r<br />
LLJN[_r n PE F_ I,l_F D:<br />
At '_ OL I<br />
At VEtJLAR<br />
t_t ACJ SPACL<br />
ANATOMICAL<br />
C:Z::]:ZZZ ..........<br />
Figure 11-25. Range of ventilation/perfusion ratios.<br />
pHYSIOL OGICAI<br />
SHUNT}NG<br />
PHYSIOt OG_CAL<br />
DFAD SPAC_
518 Bioastronautics Data Book<br />
The relations shown in figure 11-25 are discussed in the order of the lowest<br />
to the highest ratios of ventilation to perfusion.<br />
Anatomical Shunt. Some blood passes from artery to vein in the lung<br />
without ever going through a capillary bed. The effect is the same as that which<br />
occurs with perfused but non-ventilated alveoli. Anatomical shunting, then, is<br />
the sum of actual blood shunting and effective shunting when some alveoli are<br />
collapsed or plugged and not ventilated at all.<br />
Venous Admixture. Other alveoli are relatively under ventilated, so that the<br />
blood perfusing them is only partly replenished with oxygen and has only a<br />
portion of the CO 2 that was picked up in the tissues. This blood is only partly<br />
arteriolized and to a lesser or greater extent remains venous blood. The effect of<br />
this on the mixed arteriolized blood leaving the lungs is referred to as venous<br />
admixture. In the normal lung it is small, reducing potential 02 carrying<br />
capacity from about 20 to about 19 volumes percent and reducing hemoglobin<br />
saturation with oxygen from the potential of 100 percent to 95 to 97 percent.<br />
Normally Ventilated and Perfused Alveoli. In the normal lung most of the<br />
alveoli fall into this category. Because of the shape of the oxygen dissociative<br />
curve of hemoglobin, the hemoglobin is essentially 100 percent saturated over<br />
the range of ventilation/perfusion ratios shown in the central hatched area in<br />
figure 11-25. In some diseased states, a much smaller percentage of the alveoli<br />
will fall in this range.<br />
Alveolar Dead Space. Still other alveoli are relatively underperfused. The<br />
blood that passes through these capillary beds reaches complete equihbrium with<br />
the air. Because the reduced blood flow could have been redistributed to fewer<br />
alveoli to produce normal ventilation/perfusion ratios, the effect is as if some<br />
alveoh were adequately perfused and others not perfused at all. These<br />
non-perfused alveoh constitute alveolar dead space. The effective alveolar dead<br />
space is the same whether the inadequate perfusion is evenly distributed or<br />
selectively distributed to some alveoli, with other aiveoli completely nonperfused.<br />
Alveolar dead space may be very large in some disease states.<br />
Anatomical Dead Space. If alveoli had no perfusion, the ventilation/perfusion<br />
would be zero. The inspired gas that remains in the anatomical<br />
dead space (the air conducting pas_ges) is equivalent to this. In the normal adult<br />
male the anatomical dead space is approximately 160 ml; the alveolar dead space<br />
is very small with quiet breathing but increases with increased breathing effort.<br />
Physiological Dead ,Space. The combination of anatomical and alveolar dead<br />
space is called the physiological dead space. It is the effective dead space. To this<br />
space must be added equipment dead space if a mask or hehnet is worn. Thus it<br />
can be. seen that added anatomical dead space is the equivalent of added alveolar<br />
dead space. Many individuals have markedly increased alveolar dead space in<br />
certain diseases (e.g., emphysema). If the disease process is arrested, the patient<br />
adapts to the increased dead space, as long as it is not too large, with no great<br />
adverse effects. What, then, of added equipment dead space? Perhaps, if it is not<br />
too large, an astronaut would accept it and adapt to it with no noticeable effect.
Respiratory System 519<br />
Butwhatistoolarge?Certainlyafewhundredmilliliterswouldnotappear to<br />
be.It shouldbecautionedthatthereisnoagreement onthispoint.But,the<br />
abovelogicisintendedto guidetheengineer anddesigner in hisasse_sment of<br />
thevaryingopinions.<br />
O2/CO 2 Diagram and the Alveolar Equations<br />
02/C02 Diagram. The O2/CO2 diagrams for oxygen breathing are relatively<br />
simple. Because the alveolar and expired points fall on a straight line, it is easy to<br />
determine the effects of hypoventilation and hyperventilation. If the alveolar<br />
concentration of one gas and the total ambient pressure are known, the alveolar<br />
concentration of the other can be easily calculated. The formula is<br />
PCO 2 + PO 2 + PH20 = PAMBIENT<br />
Figure I1-26 shows these relations at sea level and scveral altitudes.<br />
Pco2<br />
8oo<br />
6oo<br />
400<br />
200<br />
"_.°oo .........<br />
• . ALVEOLAR POINT<br />
\ ",,_ -,,,, % _" \:<br />
200 400 600 800<br />
PO 2<br />
Figure 11-26. O2/CO 2 diagram breathing pure 02.<br />
With usual breathing the breath is warmed to body temperature and<br />
completely saturated so that PIt20 is 47 mm Hg. This is independent of ambient<br />
pressure. And since the body, also independent of ambient pressure, strives to<br />
maintain alveolar PCO2 at 40 mm Hg, these two gases (CO2 and H20) exert a<br />
combined pressure of 87 mm Hg. Thus, at high altitude, even breathing<br />
100 percent oxygen, the lungs will not contain adequate oxygen to saturate the<br />
blood. In the event, as shown in figure 11-27, the body compromises the PCO2
520 Bioastronautics Data Book<br />
stability as the low 0 2 (hypoxia) creates a strong rcspiratory drive through<br />
reflexes from the chemo receptors. This compromise makes more oxygen<br />
available at the expense of a stable CO2, and the pll is elevated with the<br />
untoward effects of this acid base balance derangement.<br />
o_<br />
7O<br />
6O<br />
5O<br />
40<br />
3O<br />
20<br />
I0<br />
0<br />
-)02(%) 95<br />
5_-- " ' / m<br />
0 50 60 70 80 90 lOO 11Q 120 130 t40 150<br />
P02 (mmHg)<br />
Figure 11-27. O2/CO2 diagram breathing air.<br />
When air is breathed the alveolar gas concentrations are not so simply<br />
related. As shown in figure 11-27, there is a family of curves, specific<br />
relationships being determined by the Respiratory Exchange Ratio.<br />
Tile basic diagram is represented by thc grid of curw;d lines and relates the<br />
tensions of 0 2 and ('0 2 to the hemoglobin saturation and the total content of<br />
carbon dioxide ill tile blood. It is constructed from the dissociation curves for<br />
oxygen and carbon dioxide in a subject with a normal hemoglobin concentration<br />
and may be used to predict any two of the variables when the other two are<br />
known.<br />
Superimposed on the basic diagram are two sets of co-ordinates and a curved<br />
line. The co-ordinates for the respiratory exchange ratio (R)radiate from a<br />
point (I) which describes the inspired [,,as (in this case air). The co-ordinates for<br />
the alveolar ventilation in the units/min per 100 nd/min of oxygen uptake are<br />
represented by sets of parallel lines of which that for infinite ventilation is also<br />
that for an R value of infinity. The curved distribution line illustrates the<br />
combinations of oxygen and carbon dioxide tension which may occur for<br />
different ventilation-perfusion ratios in one particular subject: the distribution<br />
line is defined at its lower end by the composition of the inspired gas<br />
('VA/Q =_) and at its upper end by that of the mixed vcnotrs blood (VA/Q : o_.<br />
The dashed lines converge on a point on the distribution line where the VA/Q
Respiratory System 521<br />
ratio is 1"2. For an alveolus having this ratio of wmtilation to perfusion the<br />
alveolar venflation may be expected to be 2-0 l/lOOml, the respiratory<br />
exchange ratio os 0'9 and the tensions of oxygen and carbon dioxide arc<br />
respectively 104 and 39 mm llg. The corresponding values for the oxygen<br />
saturation and the total content of carbon dioxide may also be read off the<br />
diagram.<br />
Alveolar Equations. In space flight with two gas atmospheres and reduced<br />
total pressures, neither air nor oxygen will be breathed. It will, therefore, be of<br />
frequent iuterest to the enginecr and. designer to determine alveolar gas<br />
concentrations under various conditions. At times it will be inconvenient to<br />
measure all of the gaseous constituents. A set of equations called the alveolar<br />
equations has been developed that permits the calculations of some variables if<br />
others are known. The equations are derived as follows:<br />
- Velocity<br />
General Symbols<br />
V - Gas volume per unit time<br />
P Gas pre_ure or partial pressure<br />
F - Fractional concentration in dry<br />
gas phase<br />
R - Respiratory exchange<br />
ratio CO2]O 2<br />
Two assumptions must be made:<br />
Symbols for (,as Phase<br />
I - Inspired gas<br />
E - Expired gas<br />
A - Alveolar gas<br />
13 - Barometric<br />
1. There is no gas exchange in the dead space; therefore, all gas exchange is<br />
through the alveolar membran_.<br />
2. The inspired volume, of nitrogen is equal to the expired volume (therefore<br />
the equations do not apply during denitrogenation or renitrogenation).<br />
VIFIN2 = '_EFEN2 (l)<br />
Because inspired and expired total volumes are not the same (except when<br />
R = 1), one must be expressed in tertrt_ of the other.<br />
Similarly for CO 2 release<br />
487-858 0 - 73 - 34<br />
"_I = VE FEN2<br />
FIN 2<br />
VCO 2 = '¢EFEco 2 - V1FIco 2<br />
(2)
522 Bioastronautics Data Book<br />
and substituting from equation (1)<br />
Similarly for 02 uptake<br />
VC() 2 -- "_EFEco 2 - /_ E FIN2------- FEN 2._]<br />
F1CO 2<br />
VCO 2 = VE tEco2<br />
Substituting from equation (1)<br />
VO 2 = VIFIo2 - VEFEo2<br />
FEN2_<br />
VO 2 = /_ E FIN2-------" FEN2_]<br />
F102 VEFEo2<br />
F FEN2 2/<br />
VO 2 = VE Io2 F-_N2- - FE 0<br />
Since R = VCO2/VO 2 = Respiratory exchange ratio<br />
Substituting equations (3) and (4)<br />
R __<br />
FEN 2<br />
FEco 2 - FIco 2 FIN2<br />
FEN 2<br />
FI02 FIN2 FEo2<br />
(3)<br />
(4)
FEN2andFIN2<br />
P can be substituted for F since<br />
Respiratory System<br />
canbe eliminated by substituting<br />
FEN2 = 1 - FE02 - FEco 2 and<br />
FIN2 = 1 - FIo2(when FIco 2 is negligible)<br />
Px<br />
Fx PB-47 x = O2,CO2,N 2<br />
With these substitutions one can solve for<br />
PAc02, PAo2 and R<br />
(Pll20 = 47mm Hg at body temperature)<br />
On the other hand, it is incumbent upon the engineer and designer to assure<br />
that an individual will not be exposed to levels of oxygen much increased over<br />
sea-level concentrations. The effect of oxygen in increased partial pressures<br />
(hyperoxia) is tissue poisoning. The effect is especially pronounced'in the lungs,<br />
and breathing an atmosphere composed primarily of oxygen for a day may result<br />
in death. When the PO2 is raised to three atmospheres or more, the effects on<br />
the central nervous system are so sudden that lung edema seldom is the critical<br />
problem. The subject may collapse or experience convulsions which may<br />
precipatate death. These considerations obviously limit the therapeutic uses of<br />
oxygen and c',dl for care in the design of respiratory support equipment and<br />
facilities.<br />
Factors Relevant to Respiratory Support Equipment Design<br />
Temperature, Humidity, and Respiratory Water Loss<br />
Humidity, Temperature, and Comfort. The humidity standards for air<br />
conditioning have been set at approximately 50 percent Relative Ilumidity<br />
(RH), a level which subjective data indicate to be generally comfortable for the<br />
523
524 Bioastronautics Data Book<br />
entire body. Respiratory system comfort, however, demands considerably higher<br />
humidity levels (viz. speakers in climate-controlled auditoriums who must take<br />
frequent drinks of water to maintain respiratory system comfort).<br />
At very high whole-body environmental temperatures, low humidity is<br />
comfortable because of the cooling effect produced by evaporation of water<br />
from the mucous membranes, in spite of the discomfort occasioned by drying of<br />
these membranes. The discomfort associated with breathing dry oxygen is well<br />
known among aviators. If tile temperature of the inspired gases can be kept low<br />
enough, the respiratory system experiences (within limits) greater comfort at<br />
higher humidity. Because the gases are always essentially 100 percent saturated<br />
by the time they reach the lungs, _turation of the inspired gases is of little<br />
importance to the welfare of the mucous tissues deep in the respiratory system.<br />
Humidity and Engineering Considerations for Respiratory Support<br />
Equipment Design. Expired breath is at body temperature, i.e., 37°C, and<br />
essentially saturated. Because it is desirable to maintain the temperature of the<br />
inspired gases considerably below this, there is a condensation of moisture in<br />
respiratory equipment from the expired breath as it is cooled. High humidity<br />
level has at least two implications for engineering consideration. First, wet<br />
surfaces are more susceptible to all types of corrosion, particularly when bathed<br />
in an atmosphere of essentially pure oxygen. Also, the higher the level of<br />
humidity the greater the tendency for valves or flow orifices to freeze.<br />
From an engineering viewpoint then, it is desirable to keep the humidity as<br />
low as possible. This consideration has resulted in the requirement for the<br />
maintenance of essentially dry oxygen derived from compressed or liquid<br />
oxygen. Because of the great cooling occasioned by the expansion of these gases,<br />
even a small amount of moisture would result in the freezing of the valves and<br />
orifices.<br />
The optimum level of humidity must be determined by a resolution of the<br />
opposing physiological and engineering considerations. Freezing and corrosion<br />
problems may well dictate that relative humidities be kept below levels that<br />
might be optimally desirable from a physiological viewpoint. It is therefore<br />
recommended that no arbitrary upper or lower levels of humidity be specified<br />
for breattfing support equipment, but that the final level of humidity be<br />
determined by the temperature of the inspired gas, which relates to comfort, and<br />
by the engineering requirements to limit corrosion and freezing. To require<br />
specific levels of humidity without regard to the several parameters which will<br />
ultimately dictate the level of humidity is to place artificial constraints on the<br />
engineering design, and this may produce an undue complication in the final<br />
system implementation.<br />
Standardization of Gas Volumes for Temperature and Humidity. Gas<br />
volumes are usually measured at the ambient temperature and pressure of the<br />
recording instruments and variable relative humidities. Because these<br />
conditions are not constant from one test to another, the volumes need to<br />
be converted to some standard form for interpretation or comparison with<br />
other data.
The conversion usually employed is the following:<br />
Respiratory System 525<br />
• Volumes which relate to uptakes or evolution of gas by the body are<br />
converted to standard conditions, i.e., 760 mm Hg and 0 ° C<br />
• Other gas volumes are reported saturated and at body temperature and<br />
ambient pressure.<br />
These notations are usually abbreviated:<br />
• ATP Ambient Temperature, Pressure, and humidity<br />
• ATPS Ambient Temperature and Pressure and Saturated with water<br />
va por<br />
• STPD Standard Temperature and Pressure and Dry, i.e., 0°C,760 mmHg<br />
• BTPS Body Temperature and Pressure and Saturated with water vapor.<br />
The relationship between them can be expressed:<br />
273<br />
_x<br />
VSTPD = VATP × 273 + t<br />
Pb - PH20<br />
760<br />
310 Pb - PH20<br />
VBTPS : VAT P X ×<br />
273 + t Pb - 47<br />
With these equations one can convert from one set of notations to another. The<br />
use of table 11-4 makes the process simpler.<br />
Respiratory Water Loss. Respiratory water loss can be calculated for any<br />
given condition if minute volume of pulmonary ventilation, inspired gas<br />
temperature, and the relative humidity of inspired gases are known. For usual<br />
minute volumes, one can assume near saturation of the inspired gases at body<br />
temperature.<br />
Energy Cost of Breathing<br />
Whenever respiratory-protective equipment is used, the work of breathing<br />
increases. This increase may be expressed in three ways, the first two<br />
quantitative and the last one qualitative:<br />
1. The Physical Work of Breathing. This can be expressed as foot-pounds<br />
per minute or, more commonly (using the pressure-volume loops), as<br />
gram-centimeters per breath or per minute.
526 Bioastronautics Data Book<br />
Table 1 1-4<br />
Factors for Conversion of Volumes from ATPS to STPI) and BTPS<br />
Ambient<br />
Temperature<br />
° C<br />
14<br />
15<br />
16<br />
17<br />
18<br />
19<br />
20<br />
21<br />
22<br />
23<br />
24<br />
25<br />
26<br />
27<br />
28<br />
29<br />
30<br />
31<br />
32<br />
33<br />
34<br />
35<br />
36<br />
37<br />
38<br />
39<br />
40<br />
Aqueous Vapor<br />
Pressure (mmH 9)<br />
at Saturation<br />
12.0<br />
12.8<br />
13.6<br />
14.5<br />
15.5<br />
16.5<br />
17.5<br />
18.7<br />
19.8<br />
21.1<br />
22.4<br />
23.8<br />
25.2<br />
26.7<br />
28.3<br />
30.0<br />
31.8<br />
33.7<br />
35.7<br />
37.7<br />
39.9<br />
42.2<br />
44.6<br />
47.1<br />
49.7<br />
52.4<br />
55.3<br />
STPD<br />
0.936<br />
0.932<br />
0.928<br />
0.924<br />
0.920<br />
0.916<br />
0.911<br />
0.906<br />
0.902<br />
0.897<br />
0.893<br />
0.888<br />
O.883<br />
0.878<br />
0.874<br />
0.869<br />
0.864<br />
0.859<br />
0.853<br />
0.848<br />
0.843<br />
0.838<br />
0.832<br />
0.826<br />
0.821<br />
0.816<br />
0.810<br />
Factor to Convert to:<br />
BTPS<br />
1.133<br />
1.128<br />
1.123<br />
1.118<br />
1.113<br />
1.1 08<br />
1.102<br />
1.096<br />
1.091<br />
1.085<br />
1.080<br />
1.075<br />
1.069<br />
1.063<br />
1.057<br />
1.051<br />
1.045<br />
1 .O39<br />
1.032<br />
1.026<br />
1.020<br />
1.014<br />
1.007<br />
1.000<br />
0.994<br />
0.987<br />
0.980
Respiratory System 527<br />
2. The Physiological Work of Breathing. This is the energy cost of<br />
breathing. With an appropriate apparatus it is easy to measure. It is the real cost<br />
of breathing and is easily related to respiratory gas storage requirements.<br />
3. Fatigue Effects. Increased breathing work loads of identical increased<br />
energy costs can produce vastly different fatigue effects. ¢Ls an example, pressure<br />
breathing produces fatigue effects out of all proportion to the relative increase in<br />
energy cost.<br />
The simplest way of determining the energy cost of breathing is to determine<br />
the increased oxygen consumed coincident with the increased breathing activity.<br />
Figure 11-28 shows the typical effects of increased ventilation. The scatter<br />
diagram shows the relation of pulmonary minute volume to minute oxygen<br />
consumption with increased external respiratory dead space in a single subject.<br />
Both parameters were plotted as increases over resting values. The curve was<br />
visually fitted to the points. Points in the areas marked A, B, C, and D were<br />
determined with 2780 cc, 2280 cc, 1780 cc, and 780 cc externally added dead<br />
space, respectively. Extrapolation into lower left quadrant permits an estimate<br />
of the energy cost of breathing at resting ventilation volumes. It can be seen<br />
further that total cost of moving a given volume of air may be determined from<br />
the curve by adding 6 cc to a value indicated on the ordinate. The triangle and<br />
star represent the average of 10 tests on each of 2 additional subjects. To obtain<br />
an estimate of the calorie cost, assume an R value and multiply by the<br />
appropriate calorie equivalent. If R is 0.825, the calorie equivalent of a liter of<br />
oxygen is 4.825. Note the estimate of the oxygen cost of resting ventilation<br />
(0.5 ml 02 per liter w_ntilation, which is in agreement with the generally cited<br />
figure).<br />
,eo,eo , , , , , , / :""_'_" "!A '<br />
,,o _f.,,<br />
, s<br />
i20 -<br />
BO -0 i e,<br />
/ /<br />
Is r<br />
z<br />
•o - 8<br />
o"<br />
Io ""_ , -<br />
20- "E _II"<br />
0 O,,_<br />
I<br />
L_ LITERS PULMONARY MINUTE VOLUME<br />
[ 1 I I I I | I<br />
IO 20 30 40 SO SO TO IO<br />
Figure I1-28. Oxygen cost of increased ventilation produced by breathing through four<br />
different added dead spaces. (Reprinted from Journal of Applied Physiology, 1957, 11(1),<br />
84-86)
528 Bioastronautics DataBook<br />
Thedatafor the abovecurvewereobtainedusinga breathingrateof<br />
26breathsperminute.Minutevolumes approaching 80litersperminuterequire<br />
vet3,largetidalvolumes. Figure11-29showstheoxygencostofbreathingovera<br />
rangeof breathingfrequencies usingonlythedatafor the moreefficient<br />
breathing, i.e.,thelowestoxygencostforagivenminutevolumeofventilation.<br />
Thereis goodreasonto believethat thebodywill inherentlychoosethe<br />
optimumcombination of rateanddepthof breathing for a_vencircumstancc.<br />
This curve should, therefore, be reliable, for design purposes.<br />
2200<br />
20O0<br />
I BOO<br />
_600<br />
1400<br />
_200<br />
_000<br />
8OO<br />
6OO<br />
2OO<br />
Z<br />
O<br />
I 1 I I<br />
Z •<br />
0<br />
Z<br />
w •<br />
g o<br />
0 _ l 1 I 1 I J<br />
20 40 60 80 I00 120 140 160 180<br />
A PULMONARY VENTILATION (LITFRS/MIN)<br />
Figure 11 29. Relation of increased pulmonary ventilation and 0,2 cost of inereas_<br />
ventilation for "efficient" breathing. Curve was visually fitt_xt to poinl_. (Reprinted from<br />
Journal of Applied Ph_ siology, 1958, 12(3), 413-_24)<br />
Because even w'ry hard work rarely increases ventilation abow_ 120liters per<br />
minute, the energy cost of breathing is a very small portion of the total<br />
energy cost of work. At 120liters, it is just over 300 ml 02 pcr minute. A<br />
work load to produce such a large increase in pulmonary ventilation will<br />
produce a total oxygen consumption of well over 4 liters per nfinute. Thtt_,<br />
the oxv_r_'n cost of breathing is less than 8 percent of the total cost of the<br />
work. Because the relationship is not linear, the percentage of energy cost is<br />
much lower at lower work loads. Table 11-5 shows this relationship for a<br />
single subject. It should be noted that there may be considerable variability<br />
among individuals. The table illustrates the point that any increased<br />
breathing work load that can be easily tolerated will not result in<br />
meanin/,fful increases in oxygen consumption.
Respiratory System<br />
Table 11-5<br />
Oxygen Cost of Breathing as Related to Total<br />
Oxygen Cost of Exercise<br />
Total 02 Cost of Exercise 02 Cost of Ventilation 02 Costof Ventilation<br />
(I/rain) (ml/min) (%/rainof Total 0 2 Cost)<br />
Rest0.30<br />
1.17<br />
1.60<br />
2.38<br />
5.37<br />
6<br />
24<br />
36<br />
58<br />
430<br />
Some Physiologic Parameters Relevant<br />
to Respiratory Support Equipment Design<br />
Because breathing is regulated (under all normal circumstances) to maintain a<br />
constant arterial blood PCO2, the amount of oxygen in the respired gas mixture (so<br />
long as it is above 120 or so mm Hg), has little effect on the amount of oxygen<br />
removed by the blood or on the pulmonary minute volume. Even I00 percent oxygen<br />
at sea level, therefore, does not reduce the breathing. Ordinarily about 25 liters<br />
of air are moved in and out of the lungs for each liter of oxygen removed. This is<br />
called the Oxygen Ventilation Equivalent.<br />
Because only, about 4 percent of the respired volume is removed by the lung<br />
blood, a closed-loop breathing support system, when the exhaled breath is purged<br />
of CO2 and rebreathed, will represent a considerable economy compared to conventional<br />
open-loop systems. Table 11-6 shows these relationships with engineering<br />
implications. It should be noted, however, that the comparison shown does not<br />
represent the real tradeoff. A closed system must also remove CO2 and provide an<br />
exhalation volume accumulation. The table shows only the stored gas requirements.<br />
Average astronaut activity requires about 2 ib of oxygen per day. In table 11-6<br />
this falls above midway' between rest and light work. There may, however, be short<br />
bouts of physical exertion with markedly increased metabolic activity. This is more<br />
likely to occur with extravehicular activity when the a_tronaut is being supported<br />
2.0<br />
2.1<br />
2.25<br />
by portable breathing gear. (See also chapter 18, B:ork, tteat and Oxygen Cost.)<br />
Physiological and Engineering Considerations of CO2 Levels in Respiratory<br />
Protective'and Support Equipment Design<br />
Long-Term PC02 Effects. Long-term CO2 effects are defined here as those effects<br />
that might be produced by exposure to elevated PC02 tensions over a maximum<br />
15-hour period. In considering the effects of altered PC 02 levels on the body,<br />
it might be worthwhile to note that in certain disease processes the body' PCO2 is<br />
considerably elevated and the body seems to adapt without noticeable deterioration<br />
in the performance of the individual. Similarly, persons living at high altitudes<br />
have a significant decrease in alveolar and arterial PCO2 without any measurable<br />
detrimental effects on general performance levels.<br />
2.3<br />
8.0<br />
529
530 Bioastronautics Data Book<br />
0<br />
0<br />
©<br />
_D<br />
0<br />
_D<br />
o<br />
rj_
Respiratory System 531<br />
In a number of studies animals and humans have been exposed for prolonged<br />
periods to various levels of elevated carbon dioxide. Although elevated levels<br />
produced noticeable physiological changes, particularly in the renal activity<br />
necessary for elimination of the buffered acid, no studies have defined any<br />
debilitating or compromising effects of modest increases (i.e., up to 3% at sea<br />
level) in CO2 on performance. The reader interested in a detailed treatment of<br />
this topic should consult:<br />
Greenbaum, L, & Hoff, E. (Eds). A bibliographic source book of<br />
compressed air diving and submarine medicine, Vol 3. Office of Naval<br />
Research & Bureau of Medicine, Department of Navy, Washington, D.C.,<br />
1966.<br />
Comroe, J. Physiology of respiration. Yearbook Medical Publisher, 1966.<br />
C02 Levels in Rebreather Systems. It would seem desirable to maintain<br />
PCO2 at as low a level as practicable because we ordinarily inspire an atmosphere<br />
in which PCO2 is a small fraction of one percent. However, considerable studies<br />
and operational experience haw_ indicated that there are no subjective or<br />
performance effects when PCO2 is allowed to increase to as much as 22 mm<br />
Hg partial pre_ure. It is therefore recommended that for rebreather systems,<br />
PCO2 be kept as low as practicable in terms of engineering requirements.<br />
However, if the engineering penalty necessary to keep PCO2 at 8 mm Hg or<br />
below is exorbitant as compared with that required to maintain PCO2 with no<br />
excursions going above 22 mm Hg, it is then suggested that these higher levels<br />
should be allowed.<br />
A study report from the U.S. Naval School of Aviation Medicine (1962)<br />
indicates that for the full pre_ure suit helmet or the partial pressure suit hehnet<br />
with the conventional face seal, CO 2 levels run between 1-1/2 and 3 percent at<br />
sea level (i.e., up to 22 mm Hg partial pressure). Subsequent studies by the Air<br />
Force and NASA have indicated similar lew_ls of carbon dioxide in helmets of<br />
space suits and full or partial pressure suits with no detrimental effect on the<br />
wearers.
CHAPTER 12<br />
THE VESTIBULAR SYSTEM<br />
by<br />
Ashton Graybiel, M.D.<br />
Naval Aerospace Medical Center<br />
The material presented here represents an attempt to provide the reader with<br />
some comprehension of the role that the vestibular system may play in manned<br />
space missions involving rotation of a portion of the space vehicle. The<br />
"vestibular problem" is one item to be considered, along with others, in reaching<br />
a compromise that determines vehicle design criteria. Among the interested<br />
parties are (1) specialists knowledgeable in regard to the other human element<br />
problems; (2) engineers who must ensure inertial stability of the vehicle, taking<br />
into account "cost"; (3) astronauts who must assume partial responsibility not<br />
only in self-prevention of vestibular side effects but also, along with<br />
astroscientists, participate as subjects or observers in validation experiments;<br />
(4) biomedical personnel in charge of long-range and specific-mission plans; and<br />
(5) investigators conducting ground-based supporting experimentation. The<br />
operational objective of concern is the prevention of vestibular side effects,<br />
which encompasses the selection process, adaptation, education and experience,<br />
and the use of various countermeasures, including drugs. The greater the<br />
understanding of the events and processes underlying the side effects, the better<br />
this operational objective will be achieved.<br />
A systematic review of the vestibular system is complicated by the many<br />
gaps in knowledge resulting from the fact that the vestibular system only<br />
recently has come under intensive study. In areas where information is available,<br />
it is mostly of a descriptive nature. For these reasons, the vestibular system will<br />
be discussed first in general terms, where the issues are quite clear, before<br />
proceeding to more specific features, where our understanding may not be as<br />
precise.<br />
In primitive fish the "ear," containing acoustic and nonacoustic sensory<br />
organs, developed in association with the hindbrain. The organ of hearing long<br />
Opinions or conclusions contained in this chapter are those of the author and do not neces-<br />
sarily reflect the views or endorsement of the U.S. Navy<br />
Reviewed by G. Melvill Jones, M.D., MeGill University, Montreal, Canada.<br />
533
534 Bioastronautics Data Book<br />
remained in a rudimentary state, and the evolutionary development of the<br />
acoustic system had to await the expansion of the primitive forebrain in higher<br />
vertebrates. In striking contrast, the nonacoustic portion of the car, containing<br />
otolitil organs and semicircular canals, developed early because these organs of<br />
equilibrium were essential. With the appearance of the cerebellum, an outgrowth<br />
of the hindbrain, the basic componcntry of the vestibular system was complete.<br />
Thus, as we view the phylogenetic scale from fish to mall, the essential structure<br />
and the cardinal purpose of the vestibular system remain unchanged.<br />
The otoliths and canals are uniquely designed to sense linear and angular<br />
accelerations; to convert this energy into neural impulses; and, mainly through<br />
influencing motor behavior, to aid in orientation to the upright and in<br />
eye-head-body coordination. Because the sensory inputs from the vestibular<br />
organs are destined mainly for lower portions of the central nervous system, we<br />
are not familiar, through personal experience, with the functions they subserve,<br />
as in the case of vision or hearing. Indeed, not until the turn of the century was<br />
it generally recognized that the organs of equilibrium comprise a portion of the<br />
labyrinth of the inner ear.<br />
Under natural stimulus conditions, the behavioral responses to which the<br />
vestibular system contributes are characterized by automaticity, reliability, and<br />
egality among members of a species or subspecies. There is little if any awareness<br />
of vestibular influences when man is engaged in natural activities, implying that<br />
the incredibly complex integrative mechanisms intercalated between sensory<br />
input and motor output have been effected in eiegant fashion. This "silent<br />
elegance" is of such importance to the organism that it could only have evolved<br />
through natural selection and survival of the fittest. A backward look at our<br />
evolutionary development is enormously important in appreciating both the<br />
harmony that characterizes functions subserved by the vestibular organs under<br />
mitural physiological conditions and the inherent limitations in making rapid<br />
adjustments to abnormal patterns of accelerative stimuli under artificial<br />
conditions.<br />
Long before man was aware that he had organs of equilibrium, he learned to<br />
extend his natural powers of locomotion by various means. In these motion<br />
environments, he was exposed to abnormal patterns of accelerations to which he<br />
could not quickly adapt, and motion sickness resulted. Prior to the "discovery"<br />
of the vestibular organs, reports dealing with the etiology and treatment of<br />
motion sickness were of little or no value. Subsequently, the major advances<br />
were made in the light of the role of the vestibular organs and the institution of<br />
studies under laboratory conditions.<br />
Only recently has there been a concerted attempt to study the vestibular<br />
system in a comprehensive manner, greatly aided by the new techniques of<br />
morphologists, neurophysiologists, psychophysiologists, and others. While most<br />
investigations of structure necessarily must be conducted on animals, many<br />
behavioral studies are easier to carry out on man than animal and have the<br />
unrivaled advantage of using the definitive experimental subject.
TheVestibular System 535<br />
Almost all experiments on man depend on using an unnatural stimulus that<br />
elicits a response that is always unnatural and usually abnormal. This is done in<br />
order to manipulate and measure the stimulus to canal or otolith or both, and to<br />
evoke specific measurable responses. Most responses imply that the vestibular<br />
system is disturbed and that these disturbances fall into two categories,<br />
depending on whether they are system-bound or not. System-bound responses<br />
include abnormal eye motions, "sensations," and eye-head-body incoordination,<br />
and have characteristics of reflex disturbances. Non-system-bound responses<br />
include the symptomatology of motion sickness and do not have the<br />
characteristics of reflex disturbances.<br />
The advantages that the investigator gains by eliciting abnormal responses are<br />
offset generally by some amount as a result of the departures from natural<br />
stimulus conditions. These handicaps include individual differences in<br />
susceptibility to a disturbing stimulus and individual differences in the rate of<br />
acquisition and decay of adaptation effects. All of these individual differences<br />
are more prominent in dealing with motion sickness than with reflex<br />
disturbances.<br />
With regard to useful servation, the importance of the vestibular organs to<br />
man's performance is far less than in marine forms of life which must remain<br />
upright when free-swimming, in birds that fly, and even in subhuman primates.<br />
In man there seems to be a disparity between the great potentialities of the<br />
vestibular system he inherited and its useful servation. This disparity disappears,<br />
however, when we come to consider reflex disturbances and motion sickness<br />
which may, as a result of exposure to a physically harmless stimuli, create<br />
turmoil throughout the body.<br />
In research bearing on the design of a rotating space vehicle, laboratory<br />
studies have indicated that vestibular side effects tend to increase as a log<br />
function of angular velocity (generating cross-coupled angular accelerations) and<br />
that other physiological side effects are the result of short radius and high<br />
angular velocities. Thus, it seems that an effective design approach will involve<br />
assigning relative weighting factors to the cross-coupled angular acceleration,<br />
Coriolis accelerations, and subgravity level (short radius effects would not be<br />
involved if the other conditions were satisfied). Observations in space flight and<br />
parabolic flight, however, indicate that persons change in their susceptibility to<br />
motion sickness in weightlessness, complicating the "vestibular problem." An<br />
important missing bit of information concerns the change in susceptibility as a<br />
function of subgravity level, an issue presently under study. Inasmuch as nearly<br />
all of our information on the vestibular system has been obtained under<br />
laboratory conditions, the extrapolation to space flight conditions must be made<br />
with appropriate reservations.<br />
The End Organs<br />
Among the organs of special sense that are stimulated by physical means, the<br />
vestibular organs are unique in that, under physiological conditions, they are<br />
stimulated exclusively by the gravitoinertial force environment; the semicircular
536 Bioastronautics Data Book<br />
canals (largely if not entirely gravity independent) respond to angular or<br />
cross-coupled angular accelerations and the otolith organs to gravity and to<br />
linear or Coriolis accelerations. Man has no control over a gravitoinertial force<br />
comparable to that of blocking a visual stimulus by closing the eyes in a lighted<br />
room or blocking the entry of sound waves to the cochlea. The only control man<br />
has is that of manipulation, for example, tile nullification of gravity in orbital<br />
flight or control over the generation of impulse accelerations.<br />
The paired vestibular end organs are situated in hollowed-out channels in the<br />
petrous portion of the temporal bone (figure 12-1) (Anson, Harper, and Winch,<br />
1968). Within the bony labyrinth, the membranous labyrinth is surrounded by<br />
perilymph and filled with endolymph. Thus the sensory, receptor mechanisms are<br />
protected from the effects of superimposed body weight by the bony labyrinth<br />
and, by virtue of the contained fluids, from the effects of accelerations except<br />
for displacements due to differences in specific weight among fluid and solid<br />
tissues and displacement due to inertial lag in fluid-filled ducts which resemble a<br />
torus. This "protection" is illustrated by the findings on animal subjects exposed<br />
to high peak- and sustained-linear acceleration. In tablc 12-1 are shown some<br />
findings on squirrel monkeys tested at a wide range of linear accelerations<br />
immediately after exposure to sustained accelerations. At levels below<br />
60G (Igarashi and Nagaba, 1968), none demonstrated abnormal eye motions and<br />
only a few manifested slight ataxia. Moreover, none sustained any damage to the<br />
vestibular organs, as revealed by histologic study of the _oss and fine structure.<br />
At levels of 60G and above fragmentation appeared in the otolithic zone.<br />
t_£N6t_ANOUS_N_F/q:<br />
Fig_tre 12-1. Reconstruction of meml)ranous labyrinth and related anatomy.<br />
(Anson, Harper, & Winch, 1968)
g-Level<br />
0..,..,,,.<br />
30 .........<br />
40 .........<br />
50 .........<br />
60 .........<br />
75 .........<br />
80 .........<br />
100 ........<br />
125 ........<br />
150 ........<br />
175 ........<br />
200 ........<br />
200 p .......<br />
250 p ......<br />
300 p ......<br />
350 p ......<br />
400 p ......<br />
45O p ......<br />
500 p ......<br />
The Veslibular System<br />
Tahle 12- !<br />
Gross Ataxia and Spontaneous Eye Movement Immediately<br />
After Exposure to lligh-lntensity Acceleration Stimuli<br />
Number Ataxia Spontaneous<br />
of Eye<br />
Animals Floor Bar Movement<br />
_ _ _<br />
3 ± ± --<br />
2 + -- --<br />
3 + + --<br />
4 4-+ _H- --<br />
2 + + --<br />
1 • -- _+<br />
3 ++ _ _+<br />
3 ++ -H- +<br />
6 _ _ +<br />
4 -H-+ -H- +<br />
6 -H-+ -H- +<br />
1 + _- +<br />
I -- + +<br />
3 ++ +4+ +<br />
3 -H- +-_ 4+<br />
4 -H- +++ ±<br />
I _ _ 4-+<br />
[p, peak-gexposure;+++, severe;++, moderate;+, slight; -,+questionable; --, negative].<br />
The Otolith Apparatus<br />
The four otolith organs appear as thickened portions, termed macular plates,<br />
on the inner walls of the paired utricle and saccule (figure 12-2). Taken together,<br />
these four curved macular plates occupy, without overlap, a significant portion<br />
of a sphere. A cross section of the saceular macula of a squirrel monkey, which is<br />
similar to that in man, is shown in figure 12-3, and a sketch of the zonal<br />
structure is shown in figure 12-4 (Igarashi, 1966).<br />
The otolithic membrane contains otoconia (figure 12-5) (Lindeman, Ades, and<br />
West, 1970), concretions of calcium carbonate with a specific weight of about<br />
2.71, embedded in a gelatinous material. This membrane is the only tissue within<br />
the bony labyrinth that differs much from the specific gravity of the lymph fluids.<br />
The otolith membrane rests on the cupular membrane into which protrude the<br />
hair-like projections of the sensory cells. It is the movement of the otolithic<br />
membrane relative to these sensory "hairs," or cilia, that constitutes the effective<br />
stimulus to the organ (tlgure 12-6) (Lindeman, Ades, and West, 1970).<br />
487-85U O - 73 - 35<br />
537
538 Bioastronautics Data Book<br />
_,ANTERtOR<br />
II<br />
(VERTICAL)<br />
LATERAL OR HORIZONTAL // i\<br />
':"'_'"_-tt.. '"_":" It /'\ VESTIBULAR NERVE<br />
=
1/,, ii / li<br />
The Vestibular System 539<br />
15-20/_<br />
10-15_<br />
5-8_,<br />
25_<br />
ENDOLYWPH "_<br />
OTOLITHIC ZONE<br />
CUPULAR ZONE<br />
SUBCUPULAR ZONE<br />
HAIR CELL<br />
SUPPORTING CELLS<br />
I00.= CONNECTIVE TISSUE<br />
BONY TISSUE<br />
Figure 12-4. Schematic of zonal structure of macula sacculi in squirrel monkey.<br />
(lgarashi, 1966)<br />
Figure 12-5. Scanning micrograph showing statoconia from macula utricuh in cat.<br />
(Lindeman, Ades, & West, 1970)
540 Bioastronautics Data Book<br />
Figure 12_. Bundles of sensory hairs at periphery of macula utriculi in chinchilla.<br />
(Lindeman, Ades, & West, 1970)<br />
The sketch in figure 12-7 was drawn from electronmicrographs of the sensory<br />
epithelium of the utricular macula of the squirrel monkey (Spoendlin, 1966). Two<br />
types of hair cells, each with two types of cilia, are depicted. Each cell has 60 to<br />
70 stercocilia and one kinocilium laid out in strict geometrical arrangement. It is<br />
considered likely that the kinocilium plays the major role in the energy transfer. In<br />
different regions of the macula, kinocilia are polarized in different directions<br />
(figure 12-8); hence, a shearing force in one plane will result in kinocilia moving ill<br />
different directions with reference to the kinociliar pole (Spoendlin, 1965).<br />
The "power train," constituting the cilia-otolith mechanism, is initiated by the<br />
acceleration of gravity and by impulse linear accelerations so directed as to cause a<br />
shearing displacement between the otolithic membrane and the membrane<br />
supporting the hair cells. The result is mechanical deformation of the cilia<br />
(kinociliutn) which, in turn, causes chemical changes affecting the generation of<br />
bioelectricity (nerve action potentials). After a suprathreshold stimulus, the resting<br />
spike discharge is altered in its temporal and spatial patterning, constituting the<br />
propagated discharge which, traveling along nerve fibers to the central nervous<br />
system, is the way in which otolith sensory inputs affect behavior. Most receptor<br />
cells have a resting discharge but some do not. An example of typical responses is<br />
"shown in figure 12-9 (Wersiill and Lundquist, 1966); i.e., deviation toward or<br />
away from the kinociliar pole has opposite effects. In some cells stimulation may<br />
result in abolition of the resting discharge.
Tile Vestibular System 541<br />
Figure 12-7. Schematic drawing of an area from a vestibular sensory epithelium, with<br />
haireell of type I (HC I) and type II (HC lI). Typical arrangement of the stereocilia (St) and<br />
kinoeilia (KC), modified kinoeilia (kc) with their basal bodies and roots (b) in the<br />
supporting cells (S) and (B) in the hair cells, Nerve fibres (N), Nerve-chalice (NC) and Nerve<br />
endings (NE), Synaptie structures (Sy), Golgimemhranes (G), Multivesieular bodies (V),<br />
and endoplasmie retieulum (E). Reticular membrane (RM) Mierovilli (MV). (From<br />
Spoendlin, 1966, p. 41)<br />
LATERAL _'. /__<br />
POSTERIOR_ MeOIA_"<br />
Figure 12-8. Schematic representation of polarization pattern of sensory ceils in macula<br />
u_iculi of guinea pig. Arrows indicate direction of polarization showing fanlike spread from<br />
one side of macula up to line beyond which polarization is reversed. Kinocilia on either side<br />
of dividing line face each other. (Spoendlin, 1965)<br />
)Ill
542 BioastronautiCs Data Book<br />
RESTING STATE TOWARDS J AWAY FROM<br />
(c, ((i a!.i, e<br />
i I I I I I I I I I llllllllllllllllllllllllllllllllJ<br />
I I J , J<br />
RESTING ACTIVITY STIMULATION INHIBITION<br />
( DEPOLARIZATION } HYPERPOLARIZATION<br />
Figure 12-9. Electrical discharge rate of hair cells as function of displacement<br />
of the sensory hairs. (From Wer_Ml& Ltmdquist, 1966)<br />
The Semicircular Canals<br />
The orientation of the six semicircular canals with reference to the head is<br />
shown in figure 12-10. It will be noted that, although the three canals on one side<br />
lie approximately in mutually perpendicular planes, only the horizontal canals lie<br />
close to one of the coordinate planes of the skull, the superior and posterior canals<br />
deviating by 45 degrees from the sagittal and frontal planes. Thus, rotary motions<br />
in the horizontal plane, generating impulse angular accelerations, would stimulate<br />
the horizontal pair of canals, although not maximally. Rotation in the sagittal and<br />
frontal planes would generate angular accelerations in planes almost 45 degrees<br />
from the planes of vertical (superior and posterior) canals. The operational significance<br />
is seen when the canals are stimulated in a pilot during pitch, roll, and yaw of<br />
the aircraft (Clark and Stewart, 1962; Hixson, Niven, and Correia, 1966).<br />
The so-called "semicircular" canals form a complete circuit by virtue of their<br />
connections with the utricle (figure 12-1). One extremity of each canal is dilated to<br />
form the ampulla, which contains the sensory receptors. A cross section of the<br />
ampulla of a horizontal canal of the squirrel monkey is shown under low magnification<br />
in figure 12-11 (lgarashi, 1966). The crista is a transverse ridge of tissue<br />
covered with the sensory epithelium containing sensory cells whose cilia extend<br />
into the cupula. This structure completes a fluid-tight gate across the ampulla,<br />
hinged at the crista and free to move back and forth in response to movements of<br />
the endolymph. This constitutes the so-called cupula-endolymph system. Clock-<br />
wise rotation about an axis at right angles to the plane shown in figure 12-11 would<br />
result in an inertial lag of the endolymph in the torus-like canal, causing the cupula<br />
to be displaced counterclockwise. The fine structure of the sensory epithelium is<br />
provided with hair cells similar to those of the macula. The kinocilia in the hair cells
TheVestibular System 543<br />
areuniformlypolarized; in thehorizontal canalstheyaretowardtheutricle<br />
(utricularpole)andinthevertical canals towardtheopposite pole.<br />
Figure 12-10. Orientation of semicircular canals (enlarged) as viewed in skull from above.<br />
It is apparent that the power train involved in the transformation of angular<br />
acceleration forces to electrical energy in the semicircular canals is quite<br />
different from the corresponding mechanisms in the otolith organs. In the first<br />
place, the acceleration of gravity, which plays the major role under natural<br />
stimulus conditions in the cilio-otolith system, may be neglected. The cupulaendolymph<br />
system, responding to impulse angular accelerations in the plane of<br />
the canal, has been likened to a fluid-filled torus, with the cupula responding to<br />
movements of the endolymph in the manner of a spring-mass system with<br />
viscous damping, ltead motions under natural conditions generate a high angular<br />
acceleration with the onset of rotation, transient in character, followed by a very<br />
brief period of rotation approaching constant velocity, and ending with another<br />
transient acceleration of opposite sign. The duration of angular accelerations is<br />
usually measured in fractions of a second and, inasmuch as the areas under the<br />
curves depicting acceleration and deceleration are the same, the cupular<br />
deflection is immediately restored to, or almost to, its natural resting place.<br />
In sharp contrast to the otolith organs, the variations in G-loading<br />
encountered in space flight may be neglected in dealing with the stimulus<br />
to the canals. In the absence of angular or Coriolis accelerations (cross-coupled<br />
angular accelerations) there is no accelerativc stimulus present. The resting discharge<br />
presumably is of chemical origin.
544 Bioastronautics DataBook<br />
Figure12-11.Viewofcrista-eupula system of horizontal canal from squirrel monkey.<br />
(lgarashi, 1966)<br />
Central Nervous System Connections<br />
This section summarizes the exceedingly complex vestibular reflex<br />
mechanism, and points out some of the important functional neuroanatomical<br />
relations. Figure 12-12, indicating the principal nervous pathways (Rasmussen,<br />
1952), and figure 12-13 (Graybiei, 1969), indicating some additional features,<br />
will serve as visual aids.<br />
Afferent impulses from sensory receptors in the canals and otolith organs are<br />
propagated along first-order neurons that terminate in the vestibular nuclear<br />
complex, cerebellum, reticular formation, and, according to one authority at<br />
least (Camis, 1930), some primary fibers reach the motor nuclei of the<br />
extraocular muscles, although not verified in a more recent investigation<br />
(Carpenter, 1960). These terminations are sites of origin for monosynaptic<br />
vestibular pathways and receiving sites for reciprocal or outside influences. The<br />
widespread distribution of these neuronal chains and networks, along with the<br />
less well-known efferent fibers terminating in the receptor cells of the canals and<br />
otolith organs, constitutes the reflex vestibular system.<br />
The vestibular nuclear complex is the chief center, both with regard to<br />
anatomical organization and functional control of the vestibular system. The<br />
vestibular nuclei have important reciprocal linkages with the cerebellum and
TheVesIibular Sysiem 545<br />
reticularformation; theysendoutmajorprojections thatascend, descend, and<br />
crosstheneuraxis; theycontainsitesfor intcrconnection withother_nsory<br />
systemsandotherneuralmechanisms coordinating reflexactivity(Fredrickson<br />
andSchwarz, 1970;Gernandt, 1967,1968;Ito, 1970;Nybcrg-ttansen, 1970;<br />
Pompciano, 1970;Snyder andLowy,1970;Wilson,1970)<br />
Figure12-12.Vestibular orequilibratory system. (Rasmus,_cn, A.T.,ThePrincipal Nervous<br />
Pathways. Copyright 1952byMacMillan Company andusedwiththeirpermission)<br />
hi addition to well-defined vestibular pathways, there is evidence that<br />
vestibular activity reaches areas to which specific tracts have not yet been<br />
identified. Representation in the cerebral cortex of the brain has been<br />
established using the evoked potential method (Mickle and Adcs, 1953, 1954;<br />
Spiegel et al., 1970). Connections between the vestibular system and visceral<br />
nervous system have been demonstrated, using elcctrophysiological methods<br />
upon animal subjects (Megirian and Manning, 1967; Tang and Gernandt, 1969)<br />
and behavioral indicators for man exposed to unusual periodic accelerations.<br />
The vestibular system, almost entirely concerned with the control of<br />
movement, is subject to strong modulating influences. Specific control over
546 Bioastronautics Data Book<br />
_ferent impulses may be in the nature of gating mechanisms subserved by<br />
efferent vestibular fibers (Gacek, 1960, 1968; Smith and Rasmussen, 1968). The<br />
cerebellum, which contributes greatly to the finc control of movement, exercises<br />
a strong tonic inhibitory control over vestibular reflexes. Cortical influences also<br />
are inhibitory, as are those having their origin in the reticular formation.<br />
EFF<br />
CORTEX<br />
,_ HYPOTHALAMUS<br />
CEREBELLUM _ _'/ _'_ STIM--_DRINKING<br />
VESTIBULAR<br />
FIBERS VESTIBULAR<br />
NUCLEI<br />
VESTIBULOSPINAL<br />
I _ ,_:. ST M-#SWEATING _ VASOMOTOR<br />
',*; .,"_MR I _S_-,V,T,ON" ,CTVT_<br />
I t [<br />
L_i Sr,M--',ER,STALS,S<br />
Z I Ascending (/P_ N'_ I _.J SOMNOLENCE<br />
_A/i ,MLF .J<br />
'_ _ NUCLEUS In<br />
_"1"-_ E.ETICCE.TE_<br />
AREA OSTRE..<br />
C.EMOCEPTIVE TRIGGER ZONE<br />
I I -'-OESC. MLF<br />
_4F'_ R ETICULOS PINAL<br />
Figure 12-13. Depicting possible (abnormal) irradiation of vestibular activity (dotted lines)<br />
following slxong Coriolis acceleration; first order refers to effects. NF = fastigial nucleus;<br />
U = uvula; N = nodulus; F = flaeculus; EOMN = extraoeular motor nuclei; MLF = medial<br />
longitudinal fasciculus; RF =reticular formation; PVN=paraventricular nucleus;<br />
SN = supraoptic nucleus; Ant. H. =anterior hypothatamic area; DMN =dorsomedial<br />
hypothalamic nucleus; VMN= ventromedial hypothalamic nucleus; Post. N. = posterior<br />
nucleus; L.H.A. = lateral hypothalamic area; M.N. = medial nucleus.<br />
The extensive connections of the vestibular system with the motor<br />
nuclei of the extraocular muscles deserve special attention. Stimulation of a<br />
branch of the vestibular nerve supplying a single canal in the eat may result<br />
in conjugate deviation of the eyes (Fluur, 1959). Such a movement,<br />
involving agonists and antagonists, implies that messages with highly specific<br />
physiological "meanings" are sent to the extraocular motor nuclei. The close<br />
relation between the vestibular system, on the one hand, and vision and<br />
control over eye motions, on the other, has a firm foundation in the<br />
underlying neuroanatomical relations.<br />
Extensive connections, some of them monosynaptic (Wilson, 1970), also<br />
exist between some of the vestibular nuclei and the spinal cord, particularly<br />
to those portions controlling movement of the head and trunk. These<br />
underlying neuroanatomical relationships provide the foundation for the
TheVestibular System 547<br />
powerfulcontrol exertedby the vestibular system upon coordinatcd<br />
movements of eyes, head, and trunk.<br />
The reciprocal influences between canalicular and otolithic inputs and the<br />
integration between right and left vestibular inputs are of great importance, and<br />
some of the anatomical pathways and sites of interaction have been identified<br />
and studied in detail. With regard to the advantages of having paired organs, the<br />
benefits must lie in synergism effected in the central nervous system, inasmuch<br />
as loss or even damage to one labyrinth results not only in loss of servation but<br />
also in severe vestibular disturbances. These disturbances, that may be severe in<br />
man, would be fatal in many animals and stand in sharp contrast to the little or<br />
no disturbance following unilateral loss of visual or auditory function. Inasmuch<br />
as vestibular influences do not reach the neocortex to any great extent, the<br />
possibility of right-left differences based on learning would be negligible, a<br />
matter of practical significance.<br />
Static and Dynamic Characteristics<br />
There is an important body of information dealing with the class of<br />
phenomena under this heading, much of recent date. This information is widely<br />
scattered in scientific journals, ranging through publications devoted to the<br />
medical, psychological, engineering, and even mathematical sciences. A relatively<br />
large amount of this information is in the nature of "facts," but a very<br />
important amount repre_nts attempts to fi_rmulate theories based on thesc facts<br />
and, insofar as possible, express them in the form of nomographs or in<br />
mathematical notation. There are reasons why this is difficult even for the<br />
simplest of all input-output responses; i.e,, those duc to stimulation of the<br />
horizontal pair of horizontal canals. The basic difficulty is that this cannot be<br />
done based on information obtained under natural stimulus conditions ('although<br />
Nashncr's sophisticated experiments, mentioned in the next section, approach<br />
near-normal stimulus conditions). As soon as one departs from natural stimulus<br />
conditions he is usuMly dealing with perturbed responses, representing instability<br />
of the canalicular system, that may implicate the otolithic system; in any event,<br />
there is an attempt to restore stability through the adaptation process.<br />
If one attempts to extend the scope of his lheory to include the vertical pairs<br />
of canals by using facts obtained by exposure to angular accelerations in the<br />
_gittal and frontal planes of tbe head (body), which is eommoldy done, none of<br />
the canals lie in these planes; indeed, tht'y are 45 degrees from tiffs "ideal."<br />
Central nervous system processing somehow compensates for this anatomical<br />
state of affairs, but the underlying mechanisms have not been fully _'lucidated.<br />
Much less information is avail',dd_" with regard to the otolitbie system, and<br />
ht_re one must contend with nonvcstibular somatosensory receptors that<br />
constitute, in effect, a second system. It is further complicated by the eonstant<br />
stimulus due to bwavity. Finally when all systems are operating and interacting<br />
under abnormal stimulus conditions, the input-output relations arc difficult to<br />
stabilize, and the question of relevance is raised. Insofar as tbcy simulate an<br />
operational situation they have relevancy, but extrapolation to natural stimulus<br />
conduction must be done with caution.
548 Bioastronautics Data Book<br />
Natural Stimulus Conditions<br />
Under natural stimulus conditions the semicircular canals are stimulated<br />
only as a result of angular accelerations with reference to the skull. Under these<br />
conditions, a person does not perceive a true sensation of rotation or visual<br />
illusions or manifest nystagmus, all of which are used as indicators under many<br />
cxperimental conditions. Positional nystagmus observed in some normal persons<br />
is an exception. The canals furnish information with regard to angular velocity<br />
and displacement, and some investigators are of the opinion that they furnish<br />
information at two or three higher derivatives than angular velocity. Head<br />
motions under natural conditions generate a high angular acceleration with the<br />
onset of rotation, transient in character, followed by a very brief period of<br />
rotation approaching constant velocity, and ending with another transient<br />
acceleration of opposite sign. Although the acceleration and deceleration<br />
magnitude may be different, the time-integral of angular acceleration at the<br />
onset and offset are equal (area under the curves). Thus under most natural<br />
conditions the end organ is thought to respond as an integrating accelerometer.<br />
The otolith organs pose an interesting question that would seem to be of<br />
more than academic interest; namely, whether they always act as accelerometers.<br />
This relates to the fact that even if tile head is "fixed" in the gravitational field,<br />
the receptors are stimulated, giving rise to a tonic input over and above the<br />
resting discharge. There is general agreement that if the head is rotated in the<br />
gravitational field in such a manner as to cause relative motion between otolithic<br />
and cupular membranes, this constitutes an effective stimulus, in addition to<br />
whatever suprathreshold tangential accelerations are generated. In the head-fixed<br />
situation, the question arises whether receptor elements continually fire<br />
(respond) due to the weight or pressure of the otoconia, or whether the fixation<br />
is sufficiently imperfect, as in the case of the eye, to stimulate receptor elements<br />
as a result of fine or imperceptible motions of the head relative to the direction<br />
of gravity.<br />
There are a number of stimulus conditions which meet or nearly meet the<br />
criterion of natural terrestrial conditions, as will be discussed later.<br />
Unnatural Stimulus Conditions<br />
This section is devoted mainly to experimental findings in subgravity states,<br />
which are of operational and theoretical interest. The central feature in all of the<br />
findings pertains to the role of the otolith system. Additional information is<br />
presented in a later section dealing with unnatural stimuli in "Vestibular<br />
Servation in Man" as well as in Appendix A, which contains a summary of<br />
vestibular modeling efforts.<br />
Ocular Counterrolling. Ocular torsion may be defined as the involuntary<br />
conjugate rolling movement of the eyes around their lines of sight in the<br />
direction opposite to the leftward or rightward tilted position of the head (and<br />
body) with respect to the gravitional upright. The measurements are made by<br />
comparing the position of a metal frame, to which the subject is thoroughly<br />
secured (head secured by individually fitted dental appliance), and the relative
The Vestibular System 549<br />
position of the uncovercd eye from colored photographs made in thc upright<br />
and tilt positions. The amount of the roll is measured in degrees of arc. Findings<br />
on a large number of subjects are shown in figure 12-26, presented in the section<br />
on functional tests.<br />
One experiment dealt with the problem of response decline as function of<br />
length of exposure. The findings, figure 12-14, indicate fluctuations in the<br />
amount of roll but no significant decline ovcr a period of about 8 hours (Miller<br />
& Graybicl, 1970 c). These findings bear on the qucstion raised above regarding<br />
the nature of the stimulus responsible for the tonic output. In figure 12-15<br />
(Miller, Graybiel & Kellogg, 1966) thc amount of roll as a function of G-loading<br />
is compared in seven normal and six labyrinthine-defective (L-D) subjects; the<br />
decline manifested in the L-D subjects may have been due to residual otolithic<br />
function. In figure 12-16 is shown a log plot with extensions into the<br />
supragravity range bascd on data from other experiments (Miller & Graybiel,<br />
1965). It is scen that thc S-shaped curve becomes linear at around 0.6 G, i.e.,<br />
proportional to the log of the stimulus; the upper limit to this logarithmicity has<br />
not been dctermined.<br />
rc<br />
<<br />
ld_<br />
o<br />
¢,o<br />
tit<br />
z<br />
_9<br />
z<br />
.J<br />
..d<br />
o<br />
rr<br />
tit<br />
Z<br />
O<br />
÷ 7O0<br />
+600<br />
+ 500<br />
+ 400<br />
+ 300<br />
+ 200<br />
+ IO0<br />
+3OO<br />
+200<br />
0<br />
+ I00<br />
-I00<br />
0<br />
NORMAL SUBJECTS<br />
--HO ---HA<br />
/ ...... LA ..... ST<br />
/ _k//"_ //\<br />
/ \ _ AVER.<br />
t. \<br />
\ _ /_, \ / / //<br />
LABYRINTHINE-- OEFECT/VE SUBJECTS<br />
--GR - HA<br />
• MY ---LA<br />
I I I I I I I I<br />
0 I 2 :3 4 5 6 7 8<br />
TIME {HOURS)<br />
Figure 12-14. Counterrolling manifested by normal and labyrinthine-defective<br />
subjects during 8-hr period of sustained flit.
550 Bioastronautics Data Book<br />
tlc<br />
¢[<br />
Z<br />
z<br />
.J<br />
t-<br />
Z<br />
0<br />
co<br />
0<br />
_OG<br />
..... 112 G<br />
.... IG<br />
60'<br />
NORMAL SUBJECTS<br />
q<br />
%<br />
L-D SUBJECTS<br />
TILT IN DEGREES<br />
Figure 12-15. Counterrolling as a function of magnitude of gravitational force (zero g,<br />
1/2 g, 1 g) and body position with respect to direction of force in normal and labyrinthinedefective<br />
subjects. (Miller, Graybiel, & Kellogg, 1966)<br />
_a<br />
,s!<br />
14_<br />
08<br />
06<br />
04<br />
02<br />
i<br />
O0<br />
- . _0° 25"/'/'//'/<br />
12 I0 08 06 04 02. O0 02. 04<br />
LOG_o G<br />
Figure 12-16. Relative otolith activity (mean counterrolling response of 3 subjects)<br />
as a function of logarithm of gravitational stimulus. (Miller & 6raybiel, 1965)<br />
,."<br />
/'
The Vestibular System 551<br />
Oculogravic Illusion. When a person is subjected to a change in direction of<br />
the gravitoinertial vertical with reference to himself, this is rightly interpreted as<br />
body tilt away from the upright, and the visual framework tends to tilt<br />
concordantly. The latter has been termed the oculogravic illusion (Graybiel,<br />
1952). It is mainly dependent on the integrity of the otolith system, although<br />
nonvestibular proprioceptors may contribute to its perception. When a person<br />
views an objectively vertical luminous line in the dark, it will appear to tilt when<br />
the direction of the resultant force vector has inclined about 1.5 degrees from<br />
the Earth vertical. The observer's estimates of the tilt correspond closely to the<br />
change in direction of the resultant vector up to about 30 degrees, but beyond<br />
this the subject increasingly overestimates the angular change. In figure 12-17 are<br />
shown estimates made of the illusion by normal and L-D subjects under dry and<br />
head-out water immersion conditions on a human centrifuge (Graybiel et al.,<br />
1968a). There was greater individual variation in the settings made by the L-D<br />
compared to the normal subjects, but the contribution of (mainly) nonotolith<br />
gravireceptors under dry conditions in the case of the L-D subjects is evident.<br />
Water immersion simulated to some extent the weigi_tless condition with regard<br />
to nonotolith but not to otolith receptors.<br />
v<br />
_3<br />
Z<br />
O<br />
U<br />
O<br />
3=<br />
Lt_<br />
Z<br />
O<br />
><br />
W<br />
0<br />
4O<br />
LD'$ (N=4)<br />
/°<br />
_r// • ---* /<br />
Woler II_l I t_@,RS)=" • /<br />
W0tet(BTI I_) .- -/ /=<br />
// //<br />
/<br />
_0 / /<br />
u) d'<br />
laJ 20 ."<br />
/ / ,Q<br />
IO '<br />
O _0 20 30<br />
CHANGEtN GRAVITOINERTIALHORIZONTALIN DEGREES<br />
Figure 12-17. Comparison between mean settings of a target line to the horizonlal of<br />
extrapersonal space made by normal and labyrinthine-defective subjects under wet and dry<br />
(air) conditions. BT = bathing trunks; RS = rubber suit; I, II = series of trials. (Graybiel et<br />
al., 1968a)<br />
In figure 12-18 are shown the settings made by normal subjects during<br />
prolonged exposure on a human centrifuge (Clark & Graybiel, 1963a). The body<br />
was restrained and the head fixed by means of a fiberglas helmet. As in the case<br />
of ocular counterrolling, there was little or no decay in the magnitude of the<br />
illusion during periods measured in hour.
552 Bioastronautics DataBook<br />
/<br />
<<br />
TIME ($1:C.) IN DARKNI:_<br />
Figure 12-18. Change in perception of horizontal following prolonged exposure<br />
to a visual framework. (Experimenter offset the line.) (Clark & Graybiel, 1963a)<br />
Up to this point the illustrations of the oculogravic illusion suggest that<br />
it falls into the near-normal type of vestibular response, but in some<br />
circumstances this is not the case. One is when the strength of the stimulus<br />
is increased while the subject is riding in a lighted circular room at the end<br />
of the arm of the centrifuge. Everything in the fieht of vision appears to<br />
tilt 90degrees to the Earth vertical. Visual cues to the Earth vertical are<br />
literally overpowered by the strength of the stimulus to the otoliths,<br />
receptors, and other gavireceptors.<br />
A and E Phenomena. Wade (1968) has recently reviewed the literature<br />
dealing with visual orientation to the upright, and how it is influenced by<br />
l_)dy position with reference to the gravitational vertical, and has analyzed<br />
ttne contributory role of posturai mechanisms in terms of the otolith, neck,<br />
and trunk systems, lu brief, it is readily demonstrated that when man is<br />
upright, orientation of a visual target to the gravitational vertical and<br />
horizontal, in the absence of visual cues to the upright, is accurate and that<br />
with rightward or leftward tilt, a bias appears first in a gradual displacement<br />
of the visual vertical to the opposite side of the gravitational vertical, the<br />
Miiller (1916) or E effect; after tilting through 65 degrees the bias reverses<br />
and eventually is displaced toward the _me side, the Aubert (1861) ()r A<br />
effect.<br />
The curves in Figure 12-19 A and B demonstrate differences between<br />
normal and L-I) subjects, respectively, in perceiving the A and E effects,
TheVestibular System 553<br />
whichclearlypointto a contributoryinfluenceof the otolith apparatus.<br />
Someevidencethat thisbiasis lostin weightlessness wasdemonstrated in<br />
GeminiflightsV andVII (Graybielet al., 1967),suggesting its dependence<br />
underterrestrial conditionson otolithicandnonotolithicgravireceptors.<br />
Inversion Illusion. In space flight the inversion illusion has been<br />
experienced by some cosmonauts on making the transition into<br />
weightlessness (Billingham, 1966; Yuganov et al., 1966). Its probable<br />
dependence on physiological deafferentation of the otolith receptors is<br />
suggested by the observation in parabolic flight that some normal subjects<br />
but none of the L-D subjects experienced the illusion (Graybiel & Kellogg,<br />
1967).<br />
Nystagmus. Caloric nystagmus has been elicited in parabolic flight<br />
missions (Kellogg & Graybiel, 1967). With eyes open, nystagmus was<br />
manifested during pushover and pullup but not during the weightless phase.<br />
An experiment was repeated (Graybiel et al., 1970a) using a similar<br />
procedure except that the subject's eyes were closed. Figure 12-20 illustrates<br />
typical findings. Note that in the first two parabolas, nystagmus (velocity of<br />
the slow phase) declines but is present; that, in the third parabola, the<br />
primary _ves way to a secondary nystagmus in the weightless phase; and<br />
that during the pullout, primary nystagmus reappears. In the last three<br />
parabolas only secondary nystagmus is seen. The modulating influences of<br />
changing strength of the caloric stimulus and changing G4oadings on the<br />
otolith receptors are apparent. Under laboratory conditions secondary<br />
nystagmus did not appear.<br />
Motion Sickness. In a later ruction, the problem of motion sickness<br />
experienced in orbital flight and in the weightless phase of parabolic flight<br />
is discussed. Symptoms are elicited as a consequence of head motions<br />
generating angular accelerations that stimulate the canals, despite the fact<br />
that these stimuli are normal The tonic afferent impulse from the otolith<br />
receptors is absent in weightlessness; hence, the normal integration in the<br />
(combined) vestibular system has been altered. Thus the basic cause is<br />
physiological deafferentation of the otolith receptors, yet the events<br />
triggering the abnormal response are natural head motions.<br />
Not easily explained are the great individual differences in susceptibility<br />
to motion sickness in weightlessness, resulting not only from normal<br />
stimulation of the canals but also from cross-coupled angular accelerations<br />
that would result from head motion in a rotating vehicle. It would appear<br />
that some persons have unusually low and some unusually high<br />
susceptibility. Thus, the subgravity level is a parameter that must be taken into<br />
account as well as the angular velocity. The curves describing susceptibility to<br />
motion sickness as a function of subgravity level can be determined from experiments<br />
in parabohc flight but require validation under actual space flight stimulus<br />
conditions. The American experience with regard to motion sickness in space missions<br />
has recently been reviewed in detail (Berry & Dietlein, 1970).<br />
487_858 O - 73 - 36
554<br />
cJ,o o to ,e _ 0<br />
Bioastronautics Data Book<br />
7VINOZIEIOH 7_IJ._33NIO£1A¥).I_ 3H1 _lO NOI£_N(73Nt £N3EIVddV"<br />
..J<br />
==v<br />
,.,w<br />
.=.<br />
_c9<br />
;x
G FORCE<br />
1<br />
The Vestibular System 555<br />
0['_---j'_ :-- -T--- _--_ .... f---_- - --<br />
MINUTES 2 3<br />
_,_, ,ol _ "i;,,_<br />
PARABOLIC FLIGHT<br />
AU LE FT EAR 14 5/40 SEC IRRIGATION<br />
Figure 12-20. Effect of varying g values during parabolic flight on caloric induced<br />
nystagmus. Caloric nystalcntts is reduced, then suppressed, and, finally, reversed in repeated<br />
periods of weightlessness, while calorie nystagmus is increased during periods of g values<br />
above 1.0.<br />
Under Natural Stimulus Conditions<br />
Vestibular Servation In Man<br />
Astonishingly little is known concerning the normal functions of the<br />
vestibular system in man under natural conditions. The canals and otoliths serve<br />
mainly as "participants" in motor functions, and it is exceedingly difficult to<br />
elucidate their contributory roles. A classical experimental approach to this<br />
question involves the use of human or animal subjects with bilateral loss of<br />
canalicular and otolithic functions. Experiments on animals alone, however, will<br />
never suffice, because the findings are not directly applicable to man. The<br />
identification of human subjects with bilateral loss of vestibnlar functions has<br />
been accomplished by screening groups of deaf persons, but experimentation on<br />
subjects identified in this way is complicated by the great differences between<br />
persons who hear and those who do not. Moreover, in all such subjects not only<br />
is there the need to make sure that the pathologic changes are quiescent and that<br />
adaptive changes are complete following any loss of function, but also there is<br />
the need to take into account the unmeasurable factor of "compensatory<br />
adjustments." Despite these limitations, the best information we have has been<br />
derived from a comparison of performance of persons with and without<br />
vestibular defects.<br />
Clinieal Studies. Under ordinary present-day living conditions, severe losses<br />
of vestibular function have gone undetected. This is dramatically illustrated by<br />
the rare cases in which there has been loss of vestibular function early in life but<br />
]
556<br />
Bioastronautics DataBook<br />
retentionof hearing(Graybielet al., 1970b).Twosuchpersons, discovered<br />
fortuitously, revealed thatneitherthey,theirfamilies, northeirphysicians was<br />
awareof theloss.Despitethefactthatlossof functionwasreadilyrevealed in<br />
our laboratory, this takes little away from the fact that they met not only the<br />
ordinary demands of present day living but also were proficient above the<br />
average in a variety of sports. When apprised of their loss, it was brought out<br />
that they had experienced difficulties under circumstances in which visual cues<br />
were inadequate and, po_ibly, in eye-head-body coordination when visual cues<br />
were adequate.<br />
Laboratory Studies. Although a variety of behavioral tests has been<br />
proposed to demonstrate the effects of loss of vestibular function, only a few<br />
well-controlled systematic investigations have been conducted.<br />
The postural equilibrium test battery. These tests have a limitation in<br />
file sense that many systems m addit_ vestibular reflexes are challenged,<br />
but a great advantage is that they test natural behavioral mechanisms. Findings<br />
in the case of subjects with partial loss of vestibular function (Graybiel & Miller,<br />
1970a) suggest that postural equilibrium is more dependent upon canalicular<br />
than on otolithic function. A u_ful test battery, described elsewhere in detail<br />
(Graybiel & Fregly, 1966), comprising six individual items, requires the subject<br />
to stand or walk in the stringent position of body erect, arms folded against<br />
chcst, wearing shoes with flat heels and leather soles. The below-listed test items<br />
constitute this battery :<br />
Slmrpened Romberg (SR): Stand on floor, eyes closed, feet in<br />
Ileel-to-toc position. Maximum score 240.<br />
Walk eyes open (E/O): Walk heel-to-toe, eyes open, on %-inch<br />
wide rail. Maximum score 15.<br />
Stand eyes open (E/O): Stand heel-to-toe, eyes open, on ¾-inch<br />
rail. Maximum score 180.<br />
Stand on leg eyes closed (SOLEC): First right leg (SOLEC-R),<br />
then left leg.(SOLEC-L). Maximum score 150.<br />
Walk a straight line heel-to-toe on floor (WALEC).<br />
Maximum score zero.<br />
The scores are normalized in percentile equivalents. Some comparative scores are<br />
shown in table 12-2. Scores below the 6th percentile are regarded as abnormal,<br />
and above the 40th, in the typical normal range. In general, improvement in<br />
scores suggests normality, and its absence, abnormality.<br />
Nashner (1970) has just published the results of a sophisticated study on<br />
postural sway under near-normal baseline conditions. Based on available<br />
information, he developed a general postural control model that, in turn, was<br />
used in devising a series of experiments dealing with postural sway resulting from<br />
rotation about the ankle. The experimental findings were combined with the
t.,<br />
C_<br />
5"<br />
QJ<br />
E--<br />
<<br />
E<br />
.=_<br />
e"<br />
.z<br />
o<br />
The Vestibular System 557<br />
6<br />
If<br />
11<br />
Z .. Z<br />
.=.1 .-<br />
, .J<br />
_g7<br />
6_<br />
ga"<br />
°g<br />
tl _1 II<br />
_ z _"
558 Bioastronautics Data Book<br />
general model to develop specific models for the sensory-motor interfaces. Three<br />
normal subjects and one L-D subject participated. The latter was 20 years of age<br />
and had compen_tcd "to the extent possible" following bilateral transection of<br />
the VIIIth nerve, 2 years prior to testing. Four types of tests were conducted:<br />
l. Reflex response gains. In normal subjects the average gain of the stretch<br />
reflex response induced by small rotations was about one-third that necessary.<br />
tot postural stability. In the L-D subject with eyes open the gains were larger<br />
than in the normals but below those necessary fi_r postural stability; with eyes<br />
closed the average gain increased markedly, and, for extensor muscles, resulted<br />
in "rigid" postl,ral stability.<br />
2. Induced sway: thresholds for perception with eyes open. Threshold<br />
values in terms of response time and body angle are shown in figure 12-21<br />
(Nashner, 1970).<br />
z<br />
oo<br />
_o.s<br />
i<br />
lg<br />
I-<br />
_.75<br />
c3<br />
I<br />
v_<br />
0.50<br />
0<br />
_0<br />
0<br />
o<br />
I IIO l I L<br />
ZD<br />
INDUCEO SWAY RATE (DEGREESfsECONO)<br />
%0<br />
0 0<br />
8<br />
0 VESTIBULAR<br />
DEFECTIVE<br />
SUBJECT<br />
-- /MODEL OF<br />
_, NOR/_A L<br />
.SUBJECTS<br />
t l l i t<br />
hO 2.0<br />
INDOCED SWAY RATE • j_DEGREE_'ECOND_ /_<br />
Figure 12-2I. Response threshold to induced sway motion<br />
of vestibular defective subject. (Nashner, 1970)<br />
3. Continuous recording of postural response and body angle motion. With<br />
eyes open the "control strategy." is the same for the L-D subject and normal<br />
controls, but in making corrections for transient disturbances (higher center
1'heVestibular System 559<br />
commands), performance wasbetterforthenormals thantheL-Dsubjects. With<br />
eyesclosedthestrategyremains thesamefornormal subjects (periodsof reflex<br />
stabilityandtransientdisturbances), butchanges for theL-Dsubject in that<br />
reflexstabilitygiveswaytocontinuous oscillation.<br />
4. Frequency spectraof bodyanglemotions. Comparative valuesareshown<br />
in figure12-22AandB(Nashner, 1970).<br />
(a)<br />
(b)<br />
g<br />
OOI<br />
VESTIBULAR<br />
• OEFECT_VE<br />
SUBJECT<br />
AVERAGE FOR<br />
001 Ot 10<br />
BODY SWAY FREQUENCY IHz)<br />
SUBJECT<br />
!\. ......<br />
k SUBJECTS<br />
- rk<br />
==<br />
00_ 01 IO<br />
BOOY SWAY FREOUENCY [Hz)<br />
Figure 12-22. Fourier coefficients of body sway motion for vestibular defective subject<br />
standing on rigid, flat surface-A: with eyes open; B: with eyes dosed. (Nashner, 1970)<br />
In summary, the normal subject regulates posture with a combination of highfrequency<br />
(canal and somatosensory receptors) stabilization and low-frequency<br />
(otolith and optic receptors) stabilization; with eyes closed he still has otoliths<br />
functioning. The L-D subject with eyes closed is without low-frequency stabilization,<br />
resulting in a "rigid" stability.
56O Bioa_lronaulics Data Book<br />
Perception of postural vertical. Perception of tile postural vertic',d was<br />
compared in normal and L-D subjects (eyes closed) immediately after right or<br />
left displacement of 30 degrees from the upright in a series of 30 trials. The<br />
findings in figure 12-23 (Clark & Graybiel, 1963b) show that although the<br />
normal subjects exhibited smaller average errors than the L-D subjects, tile<br />
differences between these groups were not statistically significant. Moreover, tile<br />
improvement with practice was about the same for both groups.<br />
i 11 _k_ _= 9 NORMAL MEN<br />
• TILTED RIBHT ,II, TILTED LEFT<br />
-- m -- m=lO MEN WITH VESTIBULAR DEFECTS<br />
>_,<br />
4 %<br />
_) OTILTED RIGHT OTILTEO LEFT<br />
k _'OATA AFTER SOLLEY {195G)<br />
- \\ o ............. -_._---.-,<br />
|. "-'- ° ° "o "-<br />
i "'" oo .=0<br />
• • • IP<br />
I<br />
• I • I | p • J . t . J * 1 • J . 1 • I . I • I . 1 . l . J<br />
O 2 4 6 8 IO I? 14 16 18 20 22 24 26 28 30<br />
TRIALS (SETTtI_S TO VERTtCA-)<br />
Figure 12-23. Errors in setting to postural vertical. (Clark & Graybiel, 1963b. Copyright<br />
1963 by the American Psychological Association and reprinted with their permission)<br />
In another study the same subjects were tested under four conditions of tilt<br />
and two conditions of delay before setting themselves to the upright. The<br />
findings in table 12-3 (Clark & Graybiel, 1964) indicate the somewhat greater<br />
average errors in the L-D compared with normal subjects and suggest that the<br />
error in setting is a function of both the degree of tilt and length of delay.<br />
Delay<br />
in<br />
Setting<br />
0<br />
2 rain<br />
Table 12-3<br />
:_verage Errors in l)cgrecs in Setting to the Postural Vertical<br />
Normal Subjects<br />
(S = 9)<br />
Tilt<br />
10 ° 20 ° 30 ° 40 °<br />
1.2 1.5 2.0 1.9<br />
2.2 3.5 3.8 4.2<br />
o<br />
Labyrithine Defective Subjects<br />
(S = 10)<br />
Tilt<br />
10 ° 20 ° 30 ° 40 °<br />
2.4 2.7 3.0 3.3<br />
3.4 6.1 6.5 6.8
The Vestibular System 56i<br />
Taken together, these findings emphasize that the vestibular contribution to<br />
nonvisual perception of the upright was relatively small under the conditions of<br />
the experiment. These findings are in accord with those of Schock (1960) who<br />
demonstrated large decrements in the ability of normal subjects to set a<br />
luminous rod, in darkness, to the vertical or horizontal when under water,<br />
compared with settings made out of water.<br />
Tentative Conclusions Based on a Review of Clinical and Laboratory<br />
Studies.<br />
1. In young persons with normal hearing, severe losses of vestibular function<br />
have gone undetected under ordinary living conditions. Handicaps can be<br />
demonstrated, however, under challenging situations, especially in the absence of<br />
visual cues.<br />
2. Loss of otolithic function is well tolerated, inasmuch as nonotolithic<br />
proprioception subserves quite adequately some of the same functions.<br />
3. Loss of canalicular function is less well tolerated than loss of otolithic<br />
function, partly because it subserves more important and unique functions.<br />
Under Unnatural Stimulus Conditions<br />
The schema in figure 12-24 represents an attempt to identify important<br />
elements determining input-output relations in which the vestibular organs play<br />
either the essential or a contributory role. The main chain of events involves:<br />
(1) the accelerative stimuli; (2) the cili-otolith and cupula-endolymph systems;<br />
(3) the sensory inputs to the canalicular and otolithic systems; (4) their<br />
integration to form the vestibular system; (5) interactions of vestibular and<br />
nonvestibular systems, notably the visual system; (6) normal and abnormal<br />
system-bound responses; and (7) non-system-bound responses that involve not<br />
only a facultative linkage but also nonvestibular servation systems. Listed in the<br />
figure are: (1) a categorization of etiologic factors resulting in normal and<br />
abnormal sensory, inputs, (2) an attempt to illustrate typical sensory input<br />
activity patterns, and (3) a hsting of important secondary etiologic factors<br />
affecting su_eptibility to reflex vestibular disturbances and motion sickness.<br />
Not shown in the figure are the many important events and proces_s involved in<br />
the acquisition and decay of adaptation effects. Exposure to unnatural<br />
accelerations may stimulate canals, otoliths, or both. The extremely important<br />
contribution made by head motions in otherwise stress-free motion<br />
environments needs cmphasis. In a rotating environment the cross-coupled<br />
angular accelerations constitute an ever-changing bizarre stimulus pattern for the<br />
canals that do not vary significantly with changes in radius. The otolith organs<br />
are stimulated by Coriolis accelerations which are affectcd by change in radius,<br />
but their "positive" contribution, i.e., abnormal sensory input pattern, must be<br />
small, inasmuch as susceptibility to motion sickness does not seem to vary<br />
within radii ranging from 0 to 19 feet in a rotating environment. Stated<br />
differently, any otolith contribution to a disturbance in otolith-canal integration<br />
would appear to be independent of a disturbance in the otolithic system caused<br />
by the vectorial sum of radial, gravitational, and Coriolis accelerations.
562 Bioastronautics Data Book<br />
', L............ === .........<br />
I ,t l<br />
"SECONDARY INFLUENCES VIA ApF'ROPRIATE PATHWAYS [<br />
1 "_°=":_ ............. q I_l ]_z:z:_l , t I /<br />
.,.=o.=_:.,., , L.LoZ0oLJ i':o.:: ...... :...........I<br />
! _,, I ..??',_.II ,.i5_1.2. I t ,............ _4 I<br />
;"3 • 2"22'_L;2"... _:_'_," I-I-1 I .... 7" II ........ "°;..... I_<br />
_ ............ '_'_t-................ 1 I<br />
i--I ,=:,-,=.1-.il ............................<br />
I,<br />
.......................<br />
-1 7- := :::::....... --_.2 ..................<br />
A_O,.,.F ,h.,.¢,. E_.,.O_,., ,.,o,.<br />
Figure 12-24. Conceptual framework showing important elements and their interactions<br />
undedying system-bound vestibular disturbances and non-system-bound disturbances<br />
( motion sickness).<br />
In weightlessness the tonic* sensory output of the otolith organs due to<br />
gravity is abolished, thus altering the sensory input to the otolithic system.<br />
The semicircular canals, however, are stimulated by angular accelerations<br />
generated by head (body) motions that differ little if at all from those<br />
generated by making similar head motions under terrestrial conditions. The<br />
loss in stability in the (combined) vestibular systems would appear to be<br />
due to normal canalicular inputs encountering an otolithic input consisting<br />
only of the spontaneous discharge. The resulting disturbance is sufficient to<br />
elicit symptoms of motion sickness in some persons but not in others.<br />
Many unnatural patterns of accelerative stimuli clicit only abnormal<br />
system-bound responses; i.e., do not evoke the symptomatology of motion<br />
sickness. In general, they have the characteristics of reflex phenomena and<br />
vary greatly in their departurc from normal stimulus conditions. Adaptation<br />
may not be manifested under near-normal or under certain abnormal<br />
_timulus conditions. If adaptation occurs during continual exposure, it is an<br />
indication that the response was elicited as a consequence of insufficient<br />
adaptive capacity to cope (immediately) with the stressful stimuli.<br />
*For the purpose of clarity, a distinction is made between a spontaneous discharge and one<br />
resulting from stimulation which, in the case of the otolith organs, may be either tonic or<br />
periodic or both.
The Vestibular System 563<br />
Many reflex vestibular disturbances have the following characteristics in<br />
common: (1) short latencies, (2) maximal response to the initial stimulus,<br />
(3) possible modulation by secondary influences, (4) little or no evidence of<br />
temporal perseveration based on sensory input (some exceptions here),<br />
(5) variable time course of adaptation, and (6) possible need for readjustment<br />
on change to the initial or a different gravitoinertial force environment.<br />
In the case of stimulus patterns that have the potential for precipitating<br />
motion sickness, these symptoms may be avoided, e.g., by short exposure,<br />
making it possible to elicit reflex vestibular disturbances as "isolated" vestibular<br />
responses. Much of what follows under the etiology of motion sickness applies<br />
to stimuli in this category.<br />
The typical overt symptoms of motion sickness are well known, and<br />
systematic studies reveal that they have the following characteristics: (1) delay<br />
in appearance of symptoms aftcr the onset of the stressful stimuli, (2) gradual<br />
or rapid increase in severity of symptoms, (3) modulation by secondary<br />
influences, (4) perseveration after sudden cessation of stimuli, and (5) response<br />
decline indicating recovery. Further abstractions reveal: (1) great individual<br />
differences in susceptibility and in the acquisition and decay of adaptation,<br />
(2) transfer of adaptation effects, (3) learning, and (4) conditioning.<br />
The appearance of symptoms always indicates that the adaptative capacity<br />
of the person has been exceeded. Indeed, even prior to the appearance of overt<br />
responses it can be demonstrated that the individual's susceptibility has risen.<br />
Moreover, the order of appearance of symptoms is affected by the strength of<br />
the stressful stimuli and length of exposure.<br />
Under all stimulus conditions, secondary etiologic influences, categorized in<br />
figure 12-24, are present, tending either to raise or lower susceptibility. Vision<br />
plays an important role. A pilot, for example, free of symptoms in the cockpit,<br />
may experience motion sickness in the navigator's closed compartment. Mild<br />
symptoms of motion sickness have disappeared under the influence of<br />
experimenter directed tasks that may have preempted central nervous system<br />
pathways used by irradiating vestibular influences. Covert factors may come into<br />
play. Covert factors include defects, disease, and functional disturbances that<br />
either are not diagnosed or wrongly considered unimportant. Examples are<br />
personality defects, which render a person unwilling or unable to cope with<br />
functional disorders of vestibular origin, prodromal stages of disease, and<br />
undiagnosed vestibular disease or functional disorder.<br />
Little is known concerning the precise nature of the facultative linkage. The<br />
fact that irradiating vestibular activity is demonstrably open to modulating<br />
influences points to the use of common pathways in the brain-stem reticular<br />
formation. This common meeting ground between somatic and visceral systems<br />
is essential not only for coordination at the reflex level but also to provide for<br />
some voluntary control over otherwise autonomic responses. What makes the<br />
vestibular linkage unusual (but not unique) is the readiness with which vestibular<br />
activity may get "out of bounds" and elicit the widespread responses that<br />
include the typical symptoms of motion sickness. The sometimes long delay
564 Bioastronautics DataBook<br />
betweentheonset of stimulation and appearance of motion sickness suggests<br />
that a chemical linkage also may be involved.<br />
Recovery during continual exposure to stress is complicated. At some point<br />
in time, the tendency toward restoration of homeostasis in nonvcstibular<br />
systems exceeds the influences having a contrary tendency. At another point in<br />
time, nonvestibular systems are freed from vestibular influences (adaptation in<br />
the vestibular system and disappearance of any neurohormones released). Then<br />
restoration takes place spontaneously through homeostatic events and processes,<br />
not only in the systems responsible for first-order cffects but in all systems<br />
involved in higher order effects and complications. Curves depicting the time<br />
course of adaptation in the vestibular system, the disappearance of vestibular<br />
influences, and the restoration in the nonvestibular systems tend to overlap and<br />
have not been clearly defined. Thus the engagement and disengagement between<br />
the vestibular and nonvestibular systems is difficult to follow but an interesting<br />
object of study.<br />
Investigations dealing with reflex vestibular disturbances and motion sickness<br />
in man may be directed to the solution of an operational problem, or to the<br />
accumulation of facts, the synthesis of which would be applicable to any<br />
operational problem.<br />
Individual Assessment<br />
The distinction among functional, provocative, and simulation tests is useful<br />
although somewhat arbitrary. Only simulation tests will be discussed in detail,<br />
partly because some of the material is not readily accessible elsewhere but<br />
mainly because they comprise the most important kinds of tests in the<br />
assessment of astronauts.<br />
Functional Tests. There is evidence that functional test scores within the<br />
normal range have no value in predicting individual differences in susceptibility<br />
to reflex vestibular disturbances and motion sickne_ (Khilov, 1969a, b; Miller &<br />
Graybiel, 1970a). They are valuable nevertheless from the clinical standpoint (to<br />
nile out overt and, if possible, cryptic defect or disease) and from the standpoint<br />
of making comparative measurements, the astronaut serving as his own control.<br />
The reliability of most vestibular tests is not high compared with vision or<br />
hearing tests; hence, the need or desirability for repeated measurements on<br />
astronauts serving as experimental subjects. Functional tests should be used not<br />
only in the selection of aviators and astronauts but also in the selection of<br />
subjects used in vestibular experimentation.<br />
Clinicians have described test batteries (Aschan, Bergstedt, & Stahle, 1956;<br />
Henriksson et al., 1966; Jongkees, 1967; McNally, 1969; NcNally & Stuart,<br />
1942; Spector, 1967) to which reference might be made for details, but nearly<br />
all batteries include tests for spontaneous and positional nystagmus, a modified<br />
ttallpike test, and some clinicians use a visual tracking "pendulum test." The<br />
latter is not widely used, hence will be described briefly. Eye motions are<br />
recorded while the subject "tracks" an oscillating target. The displacement and<br />
frequency of the pendulum device can be varied. Normal persons begin to have
TheVestibular System 565<br />
difficulty in tracking the target with displacements greater than 20 degrees and a<br />
frequency greater than 0.8 Hz (oscillation time : 1.2 sec), and this is declared by<br />
the appearance of saccadic perturbation in the record. The testing procedure can<br />
be exploited by using one eye for fixation. Some typical results are shown in<br />
figure 12-25.<br />
7<br />
Ay,,AAm<br />
Figure 12-25. Eye movements recorded during pendulum test.<br />
Semicircular Canals. Thermal stimulation consists of delivering a jet of<br />
water of known temperature against the ear drum at a predetermined rate and<br />
volume. The subject's head is positioned so that the horizontal pair of canals are<br />
vertical. Differences in specific weight of endolymph at body temperature and<br />
that portion of the canal influenced by the irrigating water causes a displacement<br />
of the cupula. The thermal stimulus to one ear is grossly abnormal because of<br />
the disturbance created in the delicate right-left synergistic mechanisms<br />
underlying normal canalicular function. The great advantage is that each<br />
horizontal canal can be stimulated individually (vertical canals also can be<br />
stimulated). The nystagmic response may be observed, but nystagmographic<br />
recordings are recommended for reasons of objectivity and better opportunity<br />
for analysis.<br />
With the well-known Hallpike test (Fitzgerald & Hallpike, 1942), irrigating<br />
temperatures of 30 degrees and 44 degrees C are used, which may induce nausea<br />
in highly susceptible persons. It has the great advantage of determining what is<br />
termed right-left labyrinthine and directional preponderance. We have used the<br />
threshold caloric test (McLeod & Meek, 1962). It has advantages for screening<br />
purposes and comparative measurements, a person serving as his own control,<br />
and the vestibular disturbance is brief and recovery quick. Irrigating<br />
temperatures just below body temperature usually suffice, but if not, stepwise
566 I:lioastronautics Data Book<br />
decreases are made until a response is obtained. If irrigating temperatures below<br />
35 degrees C are required to elicit a response, some abnormality should be<br />
suspected.<br />
Angular Acceleration Thresholds. Rotating devices have been fabricated<br />
that profile' noi on--_l_a__'siological character, albeit unusual, but<br />
may have excellent performance characteristics, including preprogramming. The<br />
most sensitive indicator is the oculo_ral illusion, but "sen_tions" and<br />
nystagmus are also used routinely.<br />
The oculo_'ral illusion is a form of apparent motion that has its genesis in<br />
the cupula-endolymph mechanism and may be viewed under many diffcrcnt<br />
circumstances (Graybiel & ttupp, 1946). in measuring "thresholds," favorable<br />
e_mditions include a dimly lighted three-dintensional target viewed in darkness<br />
a,d fixed with respect to the subject. The expected apparent motion is in the<br />
direction of acceleration. In a recent report by Clark and Stewart (1969), the<br />
mean threshold for the perception of the oculogyrai illusion in 32 normal<br />
subjects was found to be 0.l l°fsec 2 when they were exposed to rotation in the<br />
vertical axis for 10 seconds.<br />
Tests of Otolith Function. Ocular counterrolling, described above, has<br />
the adva,tage of not disturbing the vestibular system; hence, it qualifies as a test<br />
conducted under near-normal stimulus conditions. The values obtained with<br />
different degrees of rightward and leftward tilt describe curves that can be<br />
examined for left-right symmetry. The "index" (one-half the sum of the<br />
maximal left and right roll) values obtained in a group of 550 presumably<br />
normal persons and 10 L-D subjects are shown in figure 12-6 (Miller, 1970).<br />
The rare i,stances when values fall below 120 seconds of arc are unexplained.<br />
40!<br />
3_j<br />
25<br />
Z 20<br />
5<br />
I0<br />
5<br />
0<br />
LJ<br />
.D_STR_BL_ON OF CS'JNTE_ROLL NG IND_<br />
AMONG NORM_i _NE_ L A_._HINE<br />
PF _ _CTIvE SUBJ_::TS<br />
i I S _Jbec_ :- _:rO l<br />
1i _ 6C; 9C 120 _50 180 210 240 270 300 330 _50 39(3 420 qsO 480 5K) 546' 5,_© 6r_O 630 660 690<br />
COHP_TERRULL ING IrJDEX {MINUTES OF ARC_<br />
Figure 12-26. I) ist ribut' loll O f counterrollin_ index among normal and labyrinthinedefective<br />
subjects. (Miller, 1970; reprintcd by permission of Pergamon Press, Oxford)<br />
There art' a variety of other tests available, but none recommended as a<br />
substitute h_r ocular counterrolling; _metimes a second test is desirable it'<br />
facilities f_r counterrolling are not available. _'_mong the other tests arc': (1) the<br />
L<br />
L F_
The Vestibular System 567<br />
oculo_avie illusion test described above, (2) the elicitation of compensatory<br />
eye motions by exposing a person to horizontal oscillations on a horizontal<br />
swing or other device, (3) the elicitation of nystagmus in a device that rotates a<br />
person about an axis other than the Earth vertical or revolves a person in a<br />
counterrotating capsule or room that exposes him to a rotating linear<br />
acceleration vector.<br />
As part of our routine, we always include audiometry and the postural<br />
equilibrium test battery.<br />
Provocative Tests. Provocative tests serve the important purpose of<br />
evaluating a person's susceptability to reflex vestibular disturbances and to<br />
motion sickness and may, in addition, measure his ability to cope with such<br />
disturbances either with or without the aid of countermeasures, including the<br />
use of drugs. Factors of etiologic significance in addition to the gravitoinertial<br />
force environment, may be introduced to simulate more completely the<br />
anticipated operational conditions or to explore their role in affecting an<br />
individual's susceptibility to novel circumstances. The distinctions between<br />
provocative and simulation tests involve primarily their duration and,<br />
secondarily, their specificity in terms of the global exposure conditions; thus,<br />
the predictive value of provocative tests is less than that of simulation tests. The<br />
validity of the findings, as in the case of functional tests, is compromised if the<br />
person tested either is suffering from active disease involving the vestibular<br />
systems or, indeed, has not compensated completely following permanent injury<br />
that is no longer active.<br />
In conducting and interpreting the results of provocative tests, difficulties<br />
are encountered and precautions must be taken, which are not unrelated.<br />
Difficulties have their origin in: (1) the individual differences in susceptibility<br />
with regard to a given test; (2) intraindividual differences in susceptibility, when<br />
exposed in different gravitoinertial force environments; (3) preternaturally high<br />
susceptibility if insufficient time has not elapsed between exposures; (4) the<br />
fact that adaptation occurs as an inevitable consequence of every test, with<br />
much individual variation in the rate of acquisition and of loss of adaptation;<br />
and (5) the difficulty in expressing the results in absolute values. Great<br />
advantage would occur from the use of normalized scores and standardization of<br />
techniques.<br />
Some advantages of provocative tests include: (l) the low "cost" in terms of<br />
time and equipment that makes a "test battery" feasible, (2) individual testiltg,<br />
and (3) their use in studying vestibular mechanisms and in evaluating countermeasures.<br />
A large number of provocative tests are in use, but brevity dictates limiting<br />
what follows to the description of a few representative tests relevant to space<br />
flight operations.<br />
The Dial Test. A standardized test has been devised for determining<br />
susceptibility to motion sickness in the slow rotation room (SRR), and this came<br />
to be known as the "dial test." The stressful Coriolis accelerations are generated
568 Bioastronautic,_ l)alaI',ook<br />
by simultaneous rotationsof roomandsubject.Fiw,dialsaresoplacedin<br />
relationto thesubject that,tosethem'cdlenumber_meachdial,hcisrequired<br />
to movehisheadandtrunktofiw'differentextremepositions, whichmaximizes<br />
therotationof theheadoutof the plane of the room's rotation. A "sequence"<br />
consists in setting the fiw' dials in accordance with a tape recording, one every<br />
6 seconds, followed by a rest period of 6 seconds. The subject, usually with eyes<br />
open, continues the task until either a definite endpoint is reached, usually<br />
Mill (severe malaise) (tablc 12-4) ((,raybiel et al., 1968b), or (usually) until<br />
20 sequences or 100 settings have been made. If the original rate of rotation,<br />
say, 7.5 rpm, is too stressful, the velocity is redrced, or if too weak, the velocity<br />
is increased. With few exceptions, normal persons reach the endpoint at some<br />
velocity between 5 rpm and 20 rpm. Thc rcsults are scored in terms of angular<br />
velocity, number of head motions, and level of symptom (e.g., 10rpm,<br />
78, M 111, respectively).<br />
The Cot|oils Sickness Sure tpfi_bility Index. This represents a modification<br />
of the dial test, but a rotating St|lie or Litter-chair is used, the subject<br />
making standardized head motions ususally with eyes closed (Miller & Graybiel,<br />
1970b). Higher angular velocities than those in the SRR are required to reach<br />
the same endpoint. A noteworthy feature of this test is the method of scoring,<br />
which yields a single value, the "index," enabling the investigator to make<br />
comparisons within and among subjects.<br />
Off-Vertical Rotation Test. In contrast to the two tests just described,<br />
which mainly "disturb" the canalicular system, a rotating linear acceleration<br />
vector mainly stre_es the otolithic system. The off-vertical rotation (OVR) test<br />
is one of many and may be scored in "duration," which has some but not all of<br />
the advantages of an index. The device consists of a rotating chair (figure 12-27)<br />
(GraybieI and Miller,1970b) mounted on a platform tt_at can be tilted either by<br />
a hand crank or by an electric motor, and the degree of tilt read from a large<br />
protractor. The subject's head, held rigidly against the hcadrcst by adjustable<br />
straps across his forehead, is maintained precisely ovcr the center of rotation,<br />
with smooth rotation ensured by proper counterbalancing. The rotation,<br />
pro_ammed on a time axis, involves periods of acceleration at 0.5°/sec 2 for<br />
30 seconds, followed by periods of constant velocity for 6 minutes, until either<br />
the endpoint is reached or 6 minutes completed at 25 rpm, the cut-off point. In<br />
effect, this program represents unit incrcases _t' 2.5 rpm _very 6.5 minutes after<br />
the initial step. Tile cndpoint can be expresse, d in terms of elapsed time at<br />
terminal velocity, as total elapsed time at terminal vclocity, or as total elapsed<br />
time, which serves as an index of susceptibility to motion sickness. With each<br />
revolution of the OVR device, the subject continually changes position with<br />
respect to the gravitational upright. Thus, receptors in the paired maeulae of<br />
utricle and sacculc and nonvestibularproprioeeptors are continually exposed to<br />
an unusual stinn.lus pattcrn. The findings in a group of healthy men, the great<br />
majority attached to a naval air station, are shown in figure 12-28 (Graybicl and<br />
Miller, 1970b). All but twelve men reached the predetermined endpoint (5111 A)<br />
at a lO-degree tilt; all but five of thc remainder reached it only when the angle of<br />
tilt was increased to 20 degrees. Thus, the scores ranked 95 subjects in<br />
terms of their susceptibility to this unusual gravitoinertial force environment<br />
and demonstrated that five were highly insusceptible.
_d<br />
0<br />
0<br />
<<br />
r_<br />
o<br />
=<br />
0<br />
o<br />
e_<br />
o<br />
D _<br />
£.__<br />
c o<br />
"N' O<br />
o.<br />
E _<br />
0 c<br />
o-<br />
487-858 0 - 73 - 37<br />
: _._<br />
o<br />
"o<br />
o<br />
The Vestibular System 569<br />
t-, I<br />
2_<br />
c<br />
•"x.I --<br />
"_ u o<br />
k5 &_.<br />
..go ._<br />
tt_<br />
_ _ _'_<br />
_ o<br />
c --<br />
}<br />
.'2_ "_<br />
v ,o<br />
t.k /xl<br />
y_=<br />
II<br />
"0 0<br />
E<br />
II<br />
v<br />
E<br />
o<br />
II<br />
+<br />
E<br />
0<br />
K E<br />
O"<br />
m<br />
t-<br />
O<br />
"0<br />
"0<br />
<<br />
II<br />
(2
570 Bioastronautics Data Book<br />
2O<br />
z %0<br />
Figure 12-27. Off-vertical rotating chair device. Slide mechanisms<br />
for positioning subject now shown. (Graybiei & Miller, 1970b)<br />
r__<br />
I 30 SECOND PERIOD OF ACCE LE RATION<br />
[--_JlO ° TILT (0"5°/IQec2 _<br />
20 ° TILT<br />
Figure 12-28. Susceptibility index in subjects exposed to off-vertical rotation according<br />
N=IQO<br />
to programmed stress indicated on abscissa. (Graybiel & Miller, 1970b)<br />
I
The Vestibular System 571<br />
Figures 12-29 and 12-30 are plots comparing susceptibilty to motion<br />
sickness with scores obtained in testing, respectively, the function of the<br />
semicircular canals and otolith organs (Graybiel and Miller, 1970b). Although it<br />
appears that significant relationships were not found between functional test<br />
scores and susceptibility to motion sickness, it is worth adding that when<br />
extreme values are compared, susceptibility was higher in subjects with low<br />
rather than high oculogyral illusion threshold test values, and susceptibility was<br />
lower in subjects with high rather than low values for the counterrolling index.<br />
Simulation Tests Some of the problems posed in attempting to prcdict<br />
susceptibility to vestibular side effects under the novel conditions in a rotating<br />
space base are pointed out in figure 12-31. The slow rotation room (SRR),<br />
which can be used to simulate the angular velocity, is a completely enclosed<br />
space and provides for prolonged exposures and sudden transitions between the<br />
rotating and nonrotating state. The SRR fails to simulate space-base conditions<br />
in such notable aspects as weightlessness, subgravity levels, man's orientation<br />
when upright with regard to the axis of rotation, and the Coriolis forces while<br />
walking and handling objects. Stated differently, the SRR provides a very useful<br />
simulation device for the important study of the effects of cross-coupled angular<br />
accelerations, except for the fractional subgravity levels and man's orientation<br />
with respect to the axis of rotation. The SRR is useful in demonstrating the<br />
qualitative aspects of the role of the vestibular organs in postural equilibrium<br />
hnd in walking, but nonvestibular factors play a greater role. The necessary use<br />
of small rotating devices poses limitations in terms of visual reference, length of<br />
exposure, and postural equilibrium. Parabolic flight offers the opportunity to<br />
study the effects of weightlessness and fractional subgravity levels for brief<br />
periods. Orbital flights prior to the establishment of a space base offer the<br />
opportunity to use small or even fairly large rotating devices for validation of<br />
ground-based experimental findings and the advantages of prolonged exposure to<br />
study adaptation effects.<br />
It is convenient, although somewhat arbitrary, to distinguish between<br />
experiments designed to elicit responses that have their genesis mainly in the<br />
vestibular system and those designed to prevent such responses by means of<br />
stepwise incremental increases in the stressful stimuli.<br />
The studies now to be reported for elicitation of vestibular side effects, were<br />
selected for their operational relevance and were conducted for the most part<br />
either in the SRR or in parabolic flight.<br />
Slow Rotation Room. A series of experimcnts was carried out in the<br />
SRR to determine if there were differences in susceptibility to vestibular side<br />
effects dependent upon man's orientation to the axis of rotation and if the<br />
acquisition of adaptation effects acquired in one orientation mode transferred to<br />
the other. A unique feature of this experiment was the provision for subjects to<br />
walk on the "wall" of the circular SRR and carry out their tasks while<br />
horizontal with respect to the Earth vertical (Graybiel et al., 1968c). This was<br />
made possible by the use of air-bearing supports and custom-fitted articulated<br />
fiberglass molds. Four subjects participated in two different experiments<br />
involving adaptation to the stimulus conditions with the room rotating at 4 rpm
572 Bioastronautics Data Book<br />
z<br />
_o<br />
¢D<br />
J<br />
>-<br />
65<br />
OVR- TIME (MINUTES). MFIA £NDPOINT<br />
Figure 12-30. Comparison of motion sickness susceptibility with scores<br />
on test of otolith function (counterrolling index). (Graybiel & Miller, 1970b)
The Vestibular System 573<br />
for a period of either 4 or 5 days. One pair of subjects initially in the horizontal<br />
mode was changed to the vertical mode near the middle of the perrotation<br />
period when symptoms of motion sickness had disappeared; in the second<br />
experiment they began in the vertical mode. The order was reversed for the<br />
second pair. When in the horizontal mode, the subjects spent approximately<br />
6hours a day in the airbearing device, 6to 10minutes upright, and the<br />
remainder of the time recumbent on a bunk. The findings, summarized in<br />
figure 12-32, indicate that there is no significant difference in susceptibility in<br />
the two modes and that transfer of adaptation is excellent. On cessation of<br />
rotation only mild symptoms of motion sickness were manifested. A by-product<br />
of the experiment was the demonstration of important differences between<br />
motion sickness and postural disequilibrium during adaptation to the rotating<br />
environment and subsequent return to the stationary one. In the start-horizontal<br />
mode, adaptation ensuring freedom from symptoms of motion sickness on<br />
change to the vertical mode did not prevent ataxia. In the start-vertical mode,<br />
the adaptation resulted in a great decrease in ataxia; this adaptation persevcrated<br />
throughout the finish-horizontal mode and as long as 36 hours afterward. This<br />
implied that the dynamic processes underlying postural homeostasis involved<br />
muscular activities largely rendered static when subjects were in the horizontal<br />
mode.<br />
• -0 RT ANGLE TO<br />
AXIS ROTATION<br />
0.0<br />
CHAIR R01<br />
CW_TAI*OI_ Ri<br />
_C<br />
G - LOADING<br />
PAR_.LLEL TO<br />
AXIS ROTATION<br />
PREDPCTION OF<br />
SUSCEPTIBILITY TO VESTIBt.A.AR SlOE EFFECTS<br />
WITH PROLONGED EXP(_JRE SPACE MISSION<br />
ION EYES OPENICLOSEO<br />
ION_EH_EAO MOTIONS/GIEN ACTMTtES<br />
BRIEF EX POSURE/ PROCONGEO<br />
TIME COURSE ADAPT/LOSS ADAPT,<br />
STIMULATE :<br />
I MAINLY ,SEMICIRCULAR CANALS<br />
I. tC 3 BOTH SIM/ULTANEOUSLY<br />
HEAD MOTIONS 2 MAINLY ONLY OTOLITH ORGANS<br />
_ROT CHAIR: _-COL,iBLED ANG. ACC.<br />
1.0 2.0<br />
Figure 12-31. Prediction of susceptibility to motion sickness<br />
with prolonged exposure space mission.<br />
In the light of the experiment just described, earlier studies involving<br />
prolonged exposures in the SRR were reviewed, particularly from the standpoint<br />
of manifestations of motion sickness on cessation of rotation. The experiment in<br />
which four subjects were exposed at 10 rpm over a period of 12 days was
574 Bioastronautics Data Book<br />
notable in this regard (Graybiel et al., 1965). Despite the fact that severe<br />
symptoms were experienced, especially in the first half of the perrotation<br />
period, manifestations of motion sickness on cessation of rotation were trivial or<br />
absent.<br />
.......<br />
[;TART<br />
"l<br />
ROTATION<br />
C_A_G_ m_<br />
a<br />
STOP<br />
¢-<br />
-O_ZO_AL _00_ (_VEnTICAL _OOE<br />
I<br />
S_CKN_U<br />
....I:f 14<br />
I<br />
i ..........<br />
• iI SLIGHT<br />
_ALAiSE * o C_ .....<br />
S_v_t i<br />
_ALA_S_ i<br />
S_C_T •<br />
.A_AbS_ •<br />
i i:., I ........<br />
• I "i I 'o<br />
ol .... J _............ _.. ..................... _,........ ._._ _ _<br />
• ATAXIA F_C;ORE TIME IN _RS<br />
• LEVEL OF SRR SICKNE_<br />
Figure 12-32. Appropriate mean changes in level of symptoms of motion sickness and<br />
in postural disequilibrium in 4 young healthy subjects exposed to continual rotation at<br />
4 rpm.<br />
Adaptive Capacity Tests• These tests measure individual differences in<br />
the rate of acquisition and decay of adaptation in a rotating environment. They<br />
qualify as simulation tests, and measure at once susceptibility to reflex vestibular<br />
disturbances and motion sickness and ability to adapt and to retain adaptation<br />
effects. Repeated exposures are required to measure retention of adaptation<br />
effects, and the best schedule is yet to be determined. These tests have various<br />
options open (Reason & Graybiei, 1969; 1970a, b), but all rely on exposure to<br />
stepwise increases in the stressful accelerations.<br />
The findings in one test of this sort are summarized with the aid of<br />
table 12-5 (Reason & Graybiel, 1970a). Ten young subjects executed controlled<br />
head (and body) motions at each of ten 1-rpm increases in velocity of the slow<br />
rotation room. Eight discrete head motions at 2-second intervals comprised a<br />
sequence, and 4 seconds elapsed between sequences• At the end of each head<br />
motion the subject responded with a yes or no; yes indicated that he<br />
experienced one or more reflex vestibular disturbances or symptoms of motion<br />
sickness. The adaptation criterion was a negative response during three<br />
sequences, at which point the angular velocity of the SRR was increased by<br />
1 rpm. The number of head movement sequences required at different step<br />
increases of the subjects are shown in table 12-5. The individual differences in<br />
performance were great. Four of the ten subjects experienced motion sickness<br />
and dropped out; one at 5 rpm, two at 6 rpm, and one at 10 rpm. One subject<br />
ATAXIA
The Vestibular System 575<br />
required only nine sequences (72 head motions) to reach 10 rpm, and these were<br />
made at velocities below 3 rpm. At the other extreme, one subject required<br />
390sequences (3120head motions) to achieve the adaptation criterion at<br />
10 rpm.<br />
Table 12-5<br />
Number of Movement Sequences Prior<br />
to Achieving Adaptation Criterion at Each rpm*<br />
Subject 1 2 3 4 5 6 7 8 9 10 rpm<br />
RE 0 1 2 9 10 20 33 64 94 157<br />
TA 0 2 3 2 3 9 10 5 8 8<br />
HA 1 2 4 4 7 11 18 34 48 22<br />
JE 5 4 0 0 0 0 0 0 0 0<br />
HU 0 1 2 1 1 2 4 5 6 6<br />
DI 0 0 0 2 2 2 2 3 3 4<br />
HE 0 0 0 0 0 0 3 15 31 T**(45)<br />
JA 0 0 1 12 6 T(23)<br />
SY 8 7 1 1 1 T(10)<br />
WE 23 44 33 22 T(225)<br />
*This value represents the total number of movement sequences executed at each rpm less<br />
the three movement sequences, eliciting negative sensation, which constituted the<br />
adaptation criterion.<br />
**T indicates that rotation was terminated without achieving the adaptation criterion. The<br />
figures in parentheses show the number of sequences completed prior to termination.<br />
This type of procedure stands somewhere between brief susceptibility tests<br />
and incremental adaptation tests designed to prevent reflex vestibular<br />
disturbances and motion sickness. Tests of adaptive capacity, however, are the<br />
best available for revealing individual differences in ability to cope with<br />
operational stimulus conditions.<br />
Parabolic Flight. Studies dealing with the susceptibility to motion<br />
sickness in the weightless phase of parabolic flight have been mainly of two<br />
types (Miller, et al., 1969). In one kind, subjects were restrained in their seats<br />
and required to make standardized head motions during the weightless phase<br />
only. The findings are summarized in figure 12-33 and demonstrate that, among<br />
the twelve subjects tested in this manner, six were asymptomatic. Five of the<br />
remaining six experienced symptoms only when making head motions; the last<br />
subject demonstrated increased susceptibility when making head motions as<br />
compared to the head restraint (control) condition. These findings are<br />
concordant with those of Russian investigators utilizing parabolic flights<br />
(Kas'yan et al., 1965) and with the findings on astronauts (Berry &
576 Bioastronautics Data Book<br />
Dietlein, 1970) and cosmonauts (Yuganov et al., 1966) who experienced motion<br />
sickness in orbital flight.<br />
_I<br />
Z4<br />
2O<br />
i<br />
AS<br />
AU FO $¢ SM WA<br />
SUBJECT<br />
] l'llOd Slolmm_'y AS Asynlplomatic<br />
M IfA- ModerCl|e M_41itll<br />
Heod _,clively Move(l MI_- $lvl, tl Mc_ile<br />
Figure 12-33. Effect among 6 susceptible subjects of active head movements relative to<br />
restrained condition upon sickness susceptibility measured in terms of number of<br />
parabolas required to provoke severe malaise. (Miller et al., 1969)<br />
The second kind of experiment involved the use of a rotating chair device,<br />
with subjects required to make standardized head motions similar to those used<br />
in the dial test but with eyes blindfolded. Each subject served as his own control,<br />
and comparisons were made between susceptibility under terrestrial conditions<br />
and during parabolic flight, using similar periods of rotation and nonrotation.<br />
The findings summarized in figure 12-34 (Miller, et al., 1969) indicate that some<br />
subjects experienced a significant increase in susceptibility aloft while others<br />
manifested a decrease. When subjects were ranked in terms of their susceptibility<br />
under terrestrial conditions, the higher the susceptibility, the greater the<br />
likelihood that there would be an increase aloft, although there were exceptions<br />
to this generality.<br />
The following studies were aimed at defining techniques and procedures for<br />
the prevention of vestibular side effects.<br />
Incremental Adaptation Tests. Programming the acquisition of<br />
adaptation effects is good only in the sense that it is the best means to an end.<br />
Although there are a number of factors and trade-offs involved, the basic
The Vestibular System 577<br />
operation consists of establishing new integrative patterns in the nervous system<br />
in response to changes in stimulus conditions. One object is to confront the<br />
nervous system with the largest change in stimuli possible, short of eliciting<br />
unwanted responses. In the absence of any response, there is no guide as to<br />
whether the nervous system is being fully tasked; i.e., operating at high<br />
efficiency. In practice, however, there are, ofttimes, responses in the nature of<br />
delicate indicators. If these indicators are not present spontaneously, they may<br />
be evoked with caution, and the degree of provocation required serves as a<br />
monitoring guide. However, only persons with experience in this kind of testing<br />
can safely task the nervous system to the limit without risk. The smaller the<br />
experience, the greater the margin of safety required.<br />
20<br />
I0<br />
0<br />
i_z Au it _t= _ |c _ ,m cat i i x_ •<br />
MOTION SICKNESS SUSCEPTIBILITY<br />
o I • IQ og • Ig<br />
Figure 12-34. Comparison of Coriolis (motion) sickness susceptibility of 15 subjects<br />
measured in weightlessness and under terrestrial conditions. O* = no symptoms, except<br />
in subject HA who experienced moderate malaise (MIIA) on only his first test at O g;<br />
Mill = severe malaise. (Miller et al., 1969)<br />
A brief review of early experiments representing attempts at incremental<br />
adaptation to a given terminal velocity in the SRR is worthwhile, partly to<br />
indicate the problems involved and partly to draw abstractions from the<br />
findings.<br />
Three attempts to prevent motion sickness by step increases to a terminal<br />
velocity of 10 rpm were unsuccessful; two involved three incremental steps over<br />
a period of approximately three days, and the third a series of 40 incremental
578 Bioastronautics Data Book<br />
steps over a period of 40 hours. In the next attempt (Graybiel, Deane, &<br />
Colehour, 1969) overt motion sickness symptoms, with the exception of<br />
drowsiness, on exposure to otherwise intolerable accelerations were prevented<br />
solely by means of nine stepwise increases in rotational speeds over a period of<br />
16days to a terminal velocity of 10rpm. The stress profile and the<br />
symptomatology are summarized in figure 12-35. The four subjects had a busy<br />
schedule, and experimenter-paced head motions were required only for brief<br />
periods in connection with provocative tests. On cessation of rotation, ataxia<br />
was the most prominent and lasting complaint, and symptoms of motion<br />
sickness were either absent or of small significance. The on-board experimenter<br />
who was quite susceptible to SRR sickness spent his "nights" at home. He<br />
gradually adapted however, and could make the sudden transitions between the<br />
rotating and nonrotating states "without malaise or motion sickness", lie did<br />
require about 30 minutes to adjust to the change. Important implications<br />
include: (1) the feasibility of adapting to 10 rpm, although the "cost" in time<br />
was high; (2) the remarkable freedom from symptoms of motion sickness on<br />
cessation of rotation, implying that efferent vestibular activity may have played<br />
an important role; and (3) the feasibility of making sudden transition between<br />
0 and 10 rpm on a daily basis.<br />
o<br />
10<br />
9<br />
8<br />
6<br />
s<br />
!3L<br />
YR<br />
DU<br />
BR<br />
HO<br />
, ]<br />
1 'i<br />
I 2 3 4 5 6 7 8 9 1011t21314 15 1617 1819 20 2122 23 24 25 26 27 28 29 30 3132 33<br />
O_T OF AOTAT*O_ CE_TK_ OF ROTATION<br />
08(1(I iB.loxcc_s lon_ _ou_<br />
TIME IN DAYS<br />
Figm'e 12-35. Stress profile and symptomato|ogy in exposing 4 healthy subjects<br />
to stepwise increases in rotational speed to a terminal velocity of 10 rpm.<br />
An attempt then was made to effect symptomatic incremental adaptation in<br />
an experiment in which the three subjects were required to execute experimenter-paced<br />
head-body motions (front, back, left, right). The actual time spent<br />
making 1000 head motions was a little over half an hour. In figure 12-36<br />
(Graybiel & Wood, 1969) are shown the stress profile, the number of head<br />
motions made at each step, each up-down counting as one motion, and the level<br />
I
TheVestibular System 579<br />
of symptoms experienced by the subjects. One subject, TA, was quite<br />
susceptible, becoming very drowsy at 2 rpm, experiencing epigastric discomfort<br />
at 5 rpm, and minimizing or refraining from making head motions at the higher<br />
rpm. The two remaining subjects experienced mild symptoms at terminal<br />
velocity, which became more severe on cessation of rotation. TA resorted to the<br />
use of an antimotion sickness drug. Noteworthy features were: (1) the inability<br />
of TA to keep up with the schedule, (2) the appearance of symptoms resulting<br />
from inadequate adaptation in the remaining two subjects, and (3) the increase<br />
in symptoms experienced by all subjects on cessation of rotation.<br />
t 'L,<br />
.... _ r t \_<br />
I_<br />
_ _ rl<br />
M_<br />
i I _ _ d I<br />
.<br />
.<br />
.<br />
.<br />
.<br />
.<br />
.<br />
.<br />
.<br />
.<br />
.<br />
.<br />
.<br />
.<br />
.<br />
ir \ /<br />
_ _ _ _<br />
i I I<br />
/ i<br />
II<br />
I<br />
_ _ _<br />
. _ _ _ .<br />
TIME OF OAY<br />
Figure 12-36 Stressprofilein the SRR and manifcstions of motion sickness<br />
in 3 healthy subjeet_exposedto rotation for over 2 days (Graybiel & Wood, t969)<br />
In figure 12-37 (Graybiel & Wood, 1969) are shown the findings in a similar<br />
test, except that more head motions were made at the higher angular velocities.<br />
Symptoms of motion sickness were trivial except in subject RO who experienced<br />
very mild symptoms at 8 rpm and 9 rpm and on cessation of rotation. Except<br />
for ataxia, which was aggravated by head motions, complaints were minimal on<br />
cessation of rotation. These findings confirmed inferences drawn from the earlier<br />
studies and demonstrated that the time required to effect adaptation can be<br />
greatly shortened through control over head motions as well as angular velocity<br />
and by setting up an adaptation schedule. It should also be pointed out that the<br />
problems encountered were greater at relatively high velocities compared with<br />
relatively low ones and that, except in one instance, problems were not<br />
experienced if the unit increase was 1 rpm.<br />
The above findings stimulated intensive studies centering on: (1) the best<br />
manner to execute a discrete head-body motion, (2) the spacing between<br />
head motions, (3) the size of unit increases in velocity, (4) the number of<br />
head motions as a function of 1-rpm increases in angular velocity, and<br />
(5) the individual differences in rate of acquisition and decay of adaptation<br />
effects mentioned above.<br />
.<br />
.<br />
.<br />
.<br />
.<br />
"
580 Bioastronautics Data Book<br />
J,.t_ i<br />
_'l,! i<br />
o_ L<br />
TIME OF DAY<br />
Figure 12-37. Stress profile in SRR and manifestations of motion sickness in 3 healthy<br />
subject_ exposed to rotation for about 2 days. The large number of head motions<br />
accounted for rapid adaptation. (Graybid & Wood, 1969)<br />
The findings in an experiment to be reported (Reason & Graybiel, 1970b) can<br />
be briefly summarized with the aid of figure 12-38. Three subjects participated,<br />
and the adaptation schedule was the same for all subjects; the procedure was<br />
essentially the same as that described above in connection with table 12-5. On<br />
Day 1, while rotating counterclockwise, subjects executed 40 head movement<br />
sequences at 2 rpm, 50 at 3 rpm, 70 at 4, rpm, 90 at 5 rpm, and 110 at 6 rpm. The<br />
subjects, while rotating, then were shifted to highly stressful generalized activities<br />
in an attempt to evoke motion sickness. Their performance indicated that the head<br />
motions had produced a substantial degree of protection both wit[l respect to<br />
reflex vestibular disturbances and motion sickness. On Day 2 the subjects executed<br />
130 head movement sequences at 7 rpm, 150 at 8 rpm, 180 at 9 rDm , and 80 at<br />
10 rpm. The subjects were again transferred to generalized activities and their<br />
performance was similar to that on Day 1. On the morning of Day 3 after 120 head<br />
movement sequences at 10 rpm, the room was brought to a stop, and the subjects<br />
executed the same head motions as during rotation. There were no symptoms of<br />
motion sickness, and all reflex effects quickly disappeared.<br />
In figure 12-39 are shown findings obtained on the same three subjects when<br />
they executed an incremental adaptation test before and after participating in the<br />
3-day experiment just described. This test is also identical with the incremental<br />
adaptatior t test described in connection with table 12-5. The noteworthy findings<br />
are: (l) the small number of affirmative responses 6 hours after the 3-day experi-<br />
ment ended; (2) weekly exposures led to increasingly better performance; and<br />
(3) when the subjects were rotated in the opposite direction (clockwise), their<br />
performance was far better than on the first pre-experimental test, indicating<br />
transfer of adaptation effects acquired during counterclockwise rotation. Again<br />
the findings support the conclusion that sudden transfers between the rotating and<br />
nonrotating environments are not only feasible in the SRR, but also that the<br />
adaptation effects may not decay rapidly and with weekly practice may not only<br />
be retained but improved.
The Vestibular System 581<br />
STRESSOR 200<br />
STRESSOR<br />
ACTIVITY<br />
t°l Ac-r,vTY too__9._r-r---<br />
I 150 I<br />
ANGULAR BI l--(3or.__.j_ ,, _<br />
IRPM)<br />
,t o rr• ',<br />
21 _ DAY I DAy IT lt_Y POST- RUN<br />
F i "]_ HEAD MOTIONS<br />
200 400 600 800 I000<br />
NUMBER OF SEQUENCES<br />
( I SEQ = B HEAD MOTIONS)<br />
Figure 12-38. Stimulus profile for a 3-day adaptation schedule on SRR.<br />
40<br />
150<br />
ioo<br />
PRE-AND POST- TESTS ASSOCIATED WITH 3-DAY ADAPTATION SCHEDULE (N=3}<br />
CCW CCW CCW I<br />
I<br />
i<br />
i<br />
!<br />
CCW I CCW<br />
I<br />
CCW CW<br />
PRE-TEST POST-TEST POST-TEST POST-TEST POST:TEST I:=OST-_ POST-TEST<br />
PER R ( (6 HOURS) 11 WEEK) ( 2 WEEKS) (3 WEEKS) 15 WEEKS) 17 WEEKS)<br />
POSl<br />
Figure 12-39. Pre- and post-tests associated with 3-day adaptation schedule<br />
for 3 subjects on SRR.<br />
Postural Disequilibrium. Nonvestibular factors are of greater importance<br />
than vestibular factors in connection with postural stability while standing or walk-<br />
ing in a rotating environment, and this problem is considered along with others in<br />
Appendix B. Not considered, however, is the acquisition of adaptation effects<br />
(along with skill) readily demonstrable in the SRR.<br />
The ataxia manifested in the rotating room resembles that experienced aboard<br />
ship, and it is possible to demonstrate the contributing role of the vestibular organs<br />
by comparing the responses of normal and of labyrinthine defective (L-D) subjects<br />
(figure 12-40 A, B). With the onset of rotation, both normal and L-D subjects experience<br />
difficulty in walking, which is maximal initially and becomes progressively<br />
less over a period of days, after which there is little further change. This may be
582 Bioastronautics Data Book<br />
shown by a test for postural disequilibrium designed to reveal small differences<br />
between the normal and L-D subjects in a stationary environment. One significant<br />
difference between the normal and L-D subjects is that the former, on sudden<br />
movement of the head, is more disturbed in his postural equilibrium than is the L-D<br />
subject. On cessation of rotation, both normal and L-D subjects manifest ataxia on<br />
walking. The sensations differ from those experienced on disembarking after a sea<br />
voyage in that the subjects report that they feel unstable on a stable platform,<br />
whereas after a voyage the platform seems to be unstable too. Again, the normal<br />
subject on quickly rotating the head, experiences disequilibrium and may expe-<br />
rience dizziness; these are not experienced by the L-D subject.<br />
1<br />
---<br />
"///7 ,<br />
I!/<br />
STARTED ROTATION ST(_ED<br />
/ Wl -" --<br />
I I I I I l 1 I I I I / I 1 1 I<br />
-I I 2 3 4 5 6 7 8 9 I0 II 12 +1 4"2 4"3<br />
DAY<br />
(b)<br />
$<br />
ItGTATION<br />
(a)<br />
iIE ' ,<br />
T_<br />
Figure 12-40. A: Heel-to-toe walking scores for four normal subjects; B: Individual<br />
teat performance of 4 L-D subjects on a 3-inch wide rail along time axis of rotation.<br />
(Fregly & Kenned}', 1965)
The Vestibular System 583<br />
DrDL__. The dial test has also been used on the SRR in the<br />
evaluation of antimotion sickness drugs; a summary of the findings is shown<br />
in figure I2-41 (Wood & Graybiel 1970a). It was found that only those<br />
drugs with a parasympatholytic or sympathomimetic action and some of the<br />
antihistamines were notably effective under the stimulus conditions.<br />
Recently it was demonstrated (Wood & Graybiel, 1970b) that a combina-<br />
tion of promethazine 25 mg with d-amphetamine 10 mg had the same range<br />
of effectiveness as that found for scopolamine 0.6 mg plus d-amphetamine<br />
10 mg and that the substitution of ephedrine 50 mg for the amphetamine,<br />
while slightly less effective, was the best combination in terms of freedom<br />
from side effects. The drowsiness (sophite) syndrome and nausea and<br />
vomiting require different therapy. Coffee or its alkaloids have long been<br />
used to increase alertness, and the amphetamines should be reserved for<br />
"contingences." Once the nausea syndrome is well established, which should<br />
be a rarity, drugs taken by mouth may either remain in the stomach or be<br />
regurgitated. The combination of preventing head motions and the injection<br />
of an antimotion sickness remedy should suffice. The most effective<br />
measure would involve the use of a soporific or an antimotion sickness drug<br />
in an amount to ensure sleep.<br />
Figure 12-41. Effectiveness of anfimolion sickness drugs in preventing SRR sickness in<br />
60 subjects exposed on 500 occasions in rotating environment, using Dial Test. (Wood<br />
& GraybieI, 1970a)
584 Bioastronautics Data Book<br />
Early Guidelines in the Prevention of Vestibular<br />
Side Effects on Space Missions Involving<br />
The Generation of Artificial Gravity<br />
The limitations in simulating such novel stimulus conditions as those<br />
involved in making sudden transitions between rotating and nonrotating portions<br />
of a space base force an extension of ground-based studies to include validating<br />
observations and experiments conducted aloft. The astronaut necessarily plays<br />
the key role in this integration. In the role of subject he can serve as his own<br />
control in validating studies; in the role of onboard experimenter he is essential<br />
in conducting experiments and making observations aloft; in the role of<br />
astronaut he has responsibilities in connection with the prevention of vestibular<br />
side effects during the mission. As indicated earlier, prevention involves taking<br />
charge rather than responding to events, and this will require close cooperation<br />
between the astronaut in the space base and the biomedical representatives in<br />
the ground-based control center during the period of adjustment.<br />
Ground-based activities involving the astronaut center around the<br />
individualization of the problem in preventing vestibular side effects and the<br />
astronaut's somewhat complementary role as subject and onboard experimenter.<br />
Major elements include selection (or secondary selection), instruction, preflight<br />
adaptation, monitoring his progress during the mission, and postflight<br />
assessment. The astroscientist, who does not double as an astronaut, presents<br />
somewhat different considerations, tle would not be under the same time-load<br />
stress as the astronaut prior to launch, and presumably there would be little<br />
restriction in terms of participation in prelaunch assessment, indoctrination, and<br />
adaptation. Inasmuch as his tasks aloft would not include items critical for life<br />
support, rapid adjustment to stimulus conditions would not be a necessity,<br />
which in turn would permit greater freedom in the selection process.<br />
The lines of direction of the ground-based experimental program would be<br />
determined in large part by the findings obtained under space flight conditions.<br />
Until that time, all guidelines are tentative in nature. A brief status report serves<br />
to point up gaps in our knowledge.<br />
In order to keep the discussion within manageable limits it will be assumed<br />
that the rotating portion of the space base will have a radius of about 80 feet<br />
and that its maximal angular velocity will be 4 rpm. The problem posed by<br />
postural instability will not be discussed inasmuch as nonvestibular factors are of<br />
chief importance in this case. Only the worst-case situation will be considered;<br />
namely, initial transition into weightlessness, subsequent (initial), transition to<br />
rotation at 4 rpm with one-third fractional G loading, and sudden transitions<br />
between the rotating and nonrotating portions of the space base.<br />
Transition Into Weightlessness<br />
Information presently available indicates that it is possible by means of<br />
selection procedures not only to distinguish among astronauts and astroscientists<br />
who are or are not susceptible to vestibular side effects in weightlessness, but
The Vestibular System 585<br />
also to rank those who are, according to their degree of susceptibility. In other<br />
words, rarely, if ever, should one be surprised by unexpected responses from<br />
astronauts making their initial transition into weightlessness and seldom<br />
surprised even in the ease of astroscientists.<br />
Transition Into The Rotating Environment<br />
The principal unknown element of this novel experience concerns the effect<br />
of the fractional G load. This information will soon be available, but until then a<br />
conservative approach would serve to avoid the selection of persons who are<br />
susceptible to motion sickness in weightlessness. Present findings indicate that,<br />
with few exceptions, persons who are relatively insusceptible to motion sickness<br />
in weightlessness are in the group that is relatively insusceptible to motion<br />
sickness in the SRR. Consequently, persons with high adaptive capacity in the<br />
SRR and low susceptibility to motion sickness in weightlessness should not have<br />
a problem in making a sudden transition to 4 rpm in a space base if prelaunch<br />
adaptation has been carried out. This does not obviate the necessity for small<br />
rotating devices to permit incremental adaptation in case of need.<br />
Sudden Transitions Between Rotation and Weightlessness<br />
Here too we are dealing with novel stimulus conditions, and again it would<br />
be helpful to know the shape of the curves depicting susceptibility to vestibular<br />
side effects as a function of subgravity levels. The evidence available strongly<br />
indicates that it is possible to rank persons with regard to their acquisition and<br />
retention of adaptation to 4 rpm in the SRR and that persons fully adapted can<br />
make the transition between the stationary and rotating environments without<br />
experiencing either motion sickness or reflex vestibular effects, except insofar as<br />
they contribute to ataxia. What is not known is the extent to which adaptation<br />
effects acquired in the SRR would transfer to the space base condition. Again<br />
this points to the necessity of making provision for incremental adaptation in<br />
case of need. In weightlessness, incremental adaptation is more difficult to<br />
program than in a rotating environment, unless there are means for substituting<br />
passive for active motions.<br />
Frequent transitions (measured in days) are necessary to preserve adaptation<br />
to both rotating and nonrotating environments under terrestrial conditions, and<br />
this would be a reasonable expectation under space base conditions.<br />
487-858 O - 73 - 38
586 Bioastronautics Data Book<br />
References<br />
Anson, B. J., Harper, D. B., & Winch, T. G. The vestibular and cochlear aqueducts:<br />
Developmental and adult anatomy of their contents and parietes. In Third symposium<br />
on the role of the vestibular organs in space exploration. NASA SP-152. Washington,<br />
D.C.: U.S. Government Printing Office, 1968. Pp. 125-146.<br />
Aschan, G., Bergstedt, M., & Stable, J. Nystagmography. Recording of nystagmus in clinical<br />
neuro-otological examination. Acta otodaryngologica, Stockholm, 1956, Supplement<br />
129.<br />
Aubert, H. Eine sehcinbare bedeutende Drehung yon Objekten bei Neigung des Kopfes nach<br />
rechts oder links. Archiv fu'r pathologische Anatomie und Phy#ioiogie, 1861, 20,<br />
381-393.<br />
Berry, C. A., & Dietlein, L. F. Findings on astronauts bearing on the problem of artificial<br />
gravity. Presented at the Fifth symposium on the role of the vestibular organs in space<br />
exploration, Pensacola, Florida, August 19-21, 1970.<br />
Billingham, J. Russian experience of problems in vestibular physiology related to the space<br />
environment. In Second symposium on the role of the vestibular organs in space<br />
exploration. NASA SP-115. Washington, D.C.: U.S. Government Printing Office, 1966.<br />
Pp. 5-11.<br />
Camis, M. The physiology of the vestibular apparatus. Oxford, England: Clarendon Press,<br />
1930.<br />
Carpenter, M. B. Experimental anatomical-physiological studies of the vestibular nerve and<br />
cerebellar connections. In G. L. Rasmussen and W. F. Windle (Eds.) Neural mechanisms<br />
of the auditory and vestibular systems. Springfield, II1.: Charles C. Thomas, 1960. Pp.<br />
297-323.<br />
Clark, B., & Graybiel, A. Contributing factors in the perception of the oculogravie illusion.<br />
American Journal of Psychology, 1963a, 76, 18-27.<br />
Clark, B., & Graybiel, A. Perception of the pcetural vertical in normals and subjects with<br />
labyrinthine defects. Journal of Experimental Psychology, 1963b, 65,490-494.<br />
Clark, B., & Graybiel, A. Perception of the postural vertical following prolonged bodily lilt<br />
in normals and subjects with labyrinthine defects. Aeta otoJaryngologica, Stockholm,<br />
1964, 58, 143-148.<br />
Clark, B., & Stewart, J. D. Perception of angular acceleration about the yaw axis of a flight<br />
simulator. Aerospace Medicine, 1962, 33, 1426-1432.<br />
Clark, B., & Stewart, J. D. Effects of angular acceleration on man: Thresholds for the<br />
perception of rotation and the oculogyra] illusion. Aerospace Medicine, 1969, 40,<br />
952-956.<br />
Fitzgerald, G., & HaUpike, C. S. Studies in human vestibular function. 1. Observations on<br />
the directional preponderance ("nystagmusbereitschaft") of caloric nystagmus resulting<br />
from cerebral ie_ong Brain, 1942, 65, 115-137.<br />
Fluur, E. Influences of semicircular ducts on extraocular muscles. Acta oto-laryngologica,<br />
Stockholm, 1959, Supplement 149.<br />
Fredrickson, J. M., & Schwarz, D. Multisensory influence upon single units in the vestibular<br />
nucleus. In Fourth symposium on the role of the vestibular organs in space exploration.<br />
NASA SP-187. Washington, D.C.: U.S. Government Printing Office, 1970. Pp. 203-208.<br />
Frcgly, A. R., & Kennedy, R. S. Comparative effects of prolonged rotation at 10 rpm on<br />
postural equilibrium in vestibular normal and vestibular defective human subjects.<br />
Aerospace Medicine, 1965, 36, 1160-1167.<br />
Gacek, R. R. Efferent component of the vestibular nerve. In G. L. Rasmussen and W. F.<br />
Windle (Eds.) Neural mechanisms of the auditory and vestibular systems. Springfield,<br />
Ill.: Charles C. Thomas, 1960. Pp. 276-284.
TheVestibular System 587<br />
Gacek, R. R. Anatomical evidence for an efferent vestibular pathway. In Third symposium<br />
on the role of the vestibular organs in space exploration. NASA SP.152. Washing-<br />
ton, D.C.: U.S. Government Printing Office, 1968. Pp. 203-211.<br />
Geruandt, B. E. Vestibular influence upon spinal reflex activity. In A. V. S. de Reuck & J.<br />
Knight (Eds.) Myotatic, kinerthetic and vestibular mechanisms. London: Churchill,<br />
1967. Pp. 170-183.<br />
Gernandt, B. E. Interaction between extraocular myotatie and ascending vestibular<br />
activities. Experimental Neurology, 1968, 20, 120-134.<br />
Graybiel, A. Oculogravic illusion. Archives ofOphthelmolosy , 1952, 48, 605-615.<br />
Graybiel, A. Structural elements in the concept of motion sickness. Aerospace Medicine,<br />
1969, 40, 351-367.<br />
Graybid, A., & Fregty, A. R. A new quantitative ataxia test battery. Acta oto-laryngologica,<br />
Stockholm, 1966, 61,292-312.<br />
Graybiei, A., & Hupp, D. I. The oculogyral illusion: A form of apparent motion which may<br />
be observed following stimulation of the semicircular canals. Journal of Aviation<br />
Medicine, 1946, 17, 3-27.<br />
Graybiel, A., & Kellogg, R. S. The inversion illusion in parabolic flight: Its probable<br />
dependence on otolith function. Aerospace Medicine, 1967, 38, 1099-1103.<br />
Graybiel, A. & Miller, E. F., II. The otolith organs as a primary etiological factor in motion<br />
sickness: With a note on "off-vertical" rotation. In Fourth symposium on the role of the<br />
vestibular organs in space exploration. NASA SP-187. Washington, D.C.: U.S. Printing<br />
Office, 1970a. Pp. 53-64.<br />
Graybiei, A., & Miller, E. F., II Off-vertical rotation: A convenient precise means of<br />
exposing the passive human subject to a rotating linear acceleration vector. Aerospace<br />
Medicine, 1970 b, 41,407-410.<br />
Graybie|, A., & Wood, C. D. Rapid vestibular adaptation in a rotating environment by means<br />
of controlled head movements. Aerospace Medicine, 1969, 40,638-643.<br />
Graybiel, A., Deane, F. R., & Colehour, J. K. Prevention of overt motion sickness by<br />
incremental exposure to otherwise highly stressful Coriolis accelerations. Aerospace<br />
Medicine, 1969, 40, 142-148.<br />
Graybiei, A., Kennedy, R. S., Knoblock, E. C., Guedry, F. E., Jr., Mertz, W., McLeod, M. E.,<br />
Colehour, J. K., Miller, E. F. II, & Fregly, A. R. The effects of exposure to a rotating<br />
environment (10 rpm) on four aviators for a period of twelve days. Aerospace Medicine,<br />
1965, 36,733-754.<br />
Graybiel, A., Miller, E. F., II, Billingham, J., Waite, R., Berry, C. A., & Dietlein, L. F. Vestibular<br />
experiments in Gemini flights V and VII. Aerospace Medicine, 1967, 38, 360-370.<br />
Graybie|, A., Miller, E. F., II, Newsom, B. D.,& Kennedy, R. S. The effect of water immersion<br />
on perception of the oculogravic itlusion in normal and labyrinthine-defective subjects.<br />
Acta oto-laryngologica, Stockholm, 1968a, 65, 599-610<br />
Graybiel, A., Wood, C. D., Miller, E. F., II, & Cramer, D. B. Diagnostic criteria for grading<br />
the severity of acute motion sickness. Aerospace Medicine, 1968b, 39, 453-455.<br />
Graybiel, A., Thompson, A. B., Deane, F. R., Fregly, A. R., & Colehour, J. K. Transfer of<br />
habituation of motion sickness on change in body position between vertical and<br />
horizontal in a rotating environment. Aerospace Medicine, 1968c, 39, 950-962.<br />
Graybiel, A., O'Donneil, R. D., Smith, J. J., & Sansing, J. C. Nystagmic responses in subjects<br />
with eyes closed during parabolic flight. NAMRL Report. Naval Aerospace Medical<br />
Research Laboratory, Pensacola, Fla., 1970a, in preparation.<br />
Graybiel, A., Smith, C. R., Guedry, F. E., Jr., Miller, E. F., II, Fregly, A. R., & Cramer, D.<br />
B. Idiopathic progressive vestibular degeneration in a young man: Loss of vestibular<br />
servation not a basis for detection. Annals of Otolosy , Rhinology and Laryngology,<br />
1972, 81,165-168.
588 Bioastronautics Data Book<br />
Henriksson, N. G., Lundgren, A., Lundgren, K., & Nilsson, A. New techniques of vestibular<br />
examination. I. Analysis of eye-movements for oto-neurological diagnosis. Ciba<br />
Foundation, 1966.<br />
Hixson, W. C., Niven, J. I., & Correia, M. J. Kinematics nomenclature for physiological<br />
accderations with special reference to vestibular applications. Monograph 14. Naval<br />
Aerospace Medical Institute, Pensacola, Florida, 1966. Pp. 47-53.<br />
Igarashi, M. Dimensional study of the vestibular end organ apparatus. In Second symposium<br />
on the role of the vestibular organs in space exploration. NASA SP-115. Washington,<br />
D.C.: U.S. Government Printing Office, 1966. Pp. 47-53.<br />
Igarashi, M., & Nagaba, M. Vestibular end-organ damage in squirrel monkeys after exposure<br />
to intensive linear acceleration. In Third symposium on the role of the vestibular organs<br />
in space exploration. NASA SP-152. Washington, D.C.: U.S. Government Printing<br />
Office, 1968. Pp. 63-81.<br />
Ito, M. The cerebellovestibular interaction in cat's vestibular nuclei neurons. In Fourth<br />
symposium on the role of the vestibular organs in space exploration. NASA SP-187.<br />
Washington, D.C.: U.S. Government Printing Office, 1970. Pp. 183-199.<br />
Jongkees, L. B. W. The examination of the vestibular organ. Progress in Brain Research,<br />
1967, 23,155-168.<br />
Kas'yan, I. I., Kolosov, I. A., Lebedev, V. I., & Yurov, B. N. Reaction of cosmonauts during<br />
parabolic flight in aircraft, lzv. Akad. Nauk SSSR, Series B., No. 2, Mar-April 1965.<br />
(Translation.)<br />
Kellogg, R. S., & Graybiel, A. Lack of response to thermal stimulation of the semicircular<br />
canals in the weightless phase of parabolic flight. Aerospace Medicine, 1967, 38,<br />
487-490.<br />
Khilov, K. L. Function of the vestibular analyzer in space flights. Archives of<br />
Otolaryngology, 1969a, 90,152-160.<br />
Khilov, K. L. (The function of the equilibrium organ and motion sickness.) Leningrad:<br />
lzdatel'stvo Meditsina, 1969b, 280 pp.<br />
Lindeman, H. H., Ades, tt. W., & West, R. W. Scanning electron microscopy of the vestibular<br />
end organs. Presented at the Fifth symposium on the role of the vestibular organs in<br />
space exploration, Pensacola, Florida, August 19-21, 1970.<br />
MeLeod, M. E., & Meek, J. C. A threshold caloric test: Results in normal subjects.<br />
NSAM-834. Naval School of Aviation Medicine, Pensacola, Fla., 1962.<br />
McNally, W. J. An evaluation of vestibular testing. Archives of Otolaryngology, 1969, 89,<br />
57-63.<br />
NcN',dly, W. J., & Stuart, E. A. Physiology of the labyrinth reviewed in relation to<br />
seasickness and other forms of motion sickness. War Medicine, 1942, 2, 683-771.<br />
Megirian, D., & Manning, J. W. Input-output relations of the vestibular system. Archives<br />
italiennes de biologic, 1967, 105, 15-30.<br />
Mickle, W. A., & Ades, H. W. Spread of evoked cortical potentials..l_,srnal of<br />
Neurophysiology, 1953, 16,608-633.<br />
Mickle, W. A., & Ades, H. W. Rostral projection pathway of the vestibular system. American<br />
Journal of Physiology, 1954, 176,243-252.<br />
Miller, E. F., 11 Evaluation of otolith organ function by means of ocular counterrollitig<br />
measurements. In J. Stable (Ed.) Vestibular function on earth and in space. Oxford,<br />
England: Pergamon Press, 1970. Pp. 97-107.<br />
Miller, E. F., il & Grayhiel, A. Otolith function as measured by ocular counterrolling. In<br />
The role of the vestibular organs in the exploration of space. NASA SP-77. Washington,<br />
D.C.: U.S. Government Printing Office, 1965. Pp. 121-130.
The Vestibular System 589<br />
Miller, E. F., II, & Grayb/el, A. The semicircular canals as a primary etiological factor in<br />
motion sickness. In Fourth symposium on the role of the uestibular organs in space<br />
exploration. NASA SP-187. Washington, D.C.: U.S. Government Printing Office, 1970a.<br />
Pp. 69-82.<br />
Miller, E. F., II, & Graybiei, A. A provocative test for grading susceptibility to motion<br />
dckness yielding a single numerical score. Acta oto4oryngoiogim, Stockholm 1970b,<br />
Supplement (in press).<br />
Miller, E. F., II, & Graybiel, A. Ocular counterrolling measured during eight hours of<br />
sustained body tilt. NAMRL-II54. Naval Aerospace Medical Research Laboratory,<br />
Pensacola, Florida, 1972, (in preparation).<br />
lWaller, E. F., H, Grayhiel, A., & Kellogg, R. S. Otolith organ activity within Earth standard,<br />
one-half standard, and zero gravity environments. Aerospace Medicine, 1966, 37,<br />
399-405.<br />
Miller, E. F., II, Graybiel, A., Kellogg, R. S., & O_Donnell, R. D. Motion sickness<br />
s_ceptibillty under weightless and hypergravity conditions generated by parabolic<br />
flight. Aeroapace Medicine, 1969, 40, 862-868.<br />
Miiller, G. E. _er das Aubertsehe Ph_nomen. Zeit_chrift fffr Sinnesphysiologie, 1916, 49<br />
(Part II), 109-244.<br />
Nashner, L. M. Sensory feedback in human posture control. MVT-70-30. Man-Vehicle<br />
Laboratory, Massachusetts Institute of Technology, Cambridge, Mass., 1970.<br />
Nyberg-Hansen, R. Anatomical aspects on the functional organization ol the vesfibulospinal<br />
projection, with special reference to the sites of termination. In Fourth symposium on<br />
the role of the vestibular organs in space exploration. NASA SP-187. Washington, D.C.:<br />
U.S. Government Printing Office, 1970. Pp. 167-180.<br />
Pompeiano, O. Interaction between vestibular and nonvesfibular sensory inputs. In Fourth<br />
symposium on the role of the vestibular organs in space exploration. NASA SP-187.<br />
Washington, D.C.: U.S. Government Printing Office, 1970. Pp. 209-235.<br />
Rasmttssen, A. T. The principal nervous pathways. (4th ed.) New York: The MacMillan<br />
Co., 1952.<br />
Reason, J. T., & Graybiel, A. An attempt to measl,:_ the degree of adaptation produced by<br />
differing amounts of Coriolis vestibular stimulation in the slow rotation room.<br />
NAMI-1084. Naval Aerospace Medical Institute, Pensacola, Florida, 1969.<br />
Reason, J. T., & Graybiel, A. Progressive adaptation to Coriolis accelerations associated with<br />
1-rpm increments in the velocity of the slow rotation room. Aerospace Medicine, 1970a,<br />
41,73-79.<br />
Reason, J. T., & Graybiel, A. The effectiveness of a three-day adaptation schedule to<br />
prevent motion sickness in a slowly rotating device. NAMRL Report. Naval Aerospace<br />
Medical Research Laboratory, Pensacola, Florida, 1970b (in press).<br />
Schock, G. J. D. Perception of the horizontal and vertical in simulated subgravity<br />
conditions. U.S. Armed Forces Medical Journal, 1960, ] 1,786-793.<br />
Smith, C., & Rasmussen, G. L. Nerve endings in the maculae and cristae of the chinchilla<br />
vestibule, with a special reference to the efferents. In Th/rd symposium on the role of<br />
the vestibular organs in space exploration. NASA SP-152. Washington, D.C.:<br />
U.S. Government Printing Office, 1968. Pp. 183-200.<br />
Snyder R. S., & Lowy, K. Evoked potentials and microelectrical analysis of sensory activity<br />
within the cerebellum. In Fourth symposium on the role of the ves,ousar organs in<br />
space exploration. NASA SP-187. Washington, D.C.: U.S. Government Printing Office,<br />
1970. Pp. 245-257.<br />
Solly, C. M. Reduction of error with practice in perception of the postural vertical. Journal<br />
of Experimental Psychology, 1956, 52,328-333.<br />
Spector, M. (ed.)D/zz/ness and vert/go. New York: Grune and Stratton, 1967.
590 Bioastronautics Data Book<br />
Spiegel, E. A., Szekely, E. G., Moffett, H., & Egyed, J. Cortical projection of labyrinthine<br />
impulses: Study of averaged evoked responses. In Fourth symposium on the role of the<br />
ve._tibular organs in space exploration. NASA SP187. Washington, D.C.: U.S. Govern-<br />
ment Printing Office, 1970. Pp. 259-268.<br />
Spoendlin, H. H. Ultrastructural studies of the labyrinth in squirrel monkeys. In The role of<br />
the vestibular organs in the exploration of space. NASA SP-77. Washington, D.C.:<br />
U.S. Government Printing Office, 1965. Pp. 7-21.<br />
Spocndlin, H. H. UIbras_ueture of the vestibular sense organs. In R. J. Wolfson (Ed.) The<br />
vestibular system and its diseases. Philadelphia, Umversity of Pennsylvania Press, 1966.<br />
Pp. 39-68.<br />
Wer_a II, J., & Lundquist, P..G. Morphological polarization of the meehanorcceptors of the<br />
vestibular and acoustic systems. In Second symposium in the role of the vestibular<br />
organs in space exploration. NASA SP-115. Washington, D.C.: U.S. Government Printing<br />
Office, 1966. Pp. 57-71.<br />
Wilson, V. J. Vestibular and somatic inputs to cells of the lateral and medial vestibular<br />
nuclei of the cat. In Fourth symposium on the role of the vestibular organs in space<br />
exploration. NASA ._P-187. Washington, D.C.: U,S. Government Printing Office, 1970.<br />
Pp. 145-156<br />
Wood, C. D., & Graybiel, A. A theory of motion sickness based on pharmacological<br />
reactions. Clinicai PharmacoloBy and Therapeutics, 1970a, II, 621-629.<br />
Wood, C. D., & Graybiel, A. Evaluation of antimotion sickness drugs: A new effective<br />
remedy revealed. Aerospace Medicine, 1970b, 41,932-933.<br />
Yuganov, E. M., Gorshkov, A. I., Kasian, I. I., Brianov, L I., Kolosov, I. A., Kopanev, V. I.,<br />
Lebedev, V. l., Papov, N. I., & Solodovnik, F. A. Vestibular reactions of cosmonauts<br />
during the flight in the "Voskhod" spaceship. Aerospace Medicine, 1966, 37, 691-694.
The Vestibular System<br />
APPENDI X A<br />
Vestibular Models*<br />
The input-output relationships for the vestibular system relating linear and<br />
angular acceleration and gravitational forces to eye movements, perceived<br />
orientation, postural reflexes and control commands are shown schematically in<br />
figure A-1 (Young, 1969). Models have been developed for semicircular canal<br />
and otolith function, and to a limited extent for their interactions on the basis<br />
of behavioral experiments. Typically, subjects are rotated through known<br />
angular velocity patterns, and the resulting eye movements (usually angular<br />
velocity of slow phase nystagmus) or subjective sensation of velocity and<br />
perceived orientation with respect to the apparent vertical are monitored. A<br />
control engineering model for subjective sensation and slow phase nystagrnus<br />
velocity for rotation about a vertical axis is shown in the adaptation model for<br />
horizontal semicircular canals given in figure A-2 (Young & Oman, 1969). The<br />
torsion pendulum canal dynamics represents the second-order equation<br />
describing semicircular canal action summarized by van Egmond, Groen, &<br />
Jongkees (1949). The differential equation relating angular deviation of the<br />
cupula to angular acceleration normal to the plane of the canal is given by:<br />
where<br />
0 = moment of inertia of the endolymph<br />
7r = moment of friction at unit angular velocity of the endolymph<br />
with respect to the skull<br />
A = stiffness, or torque moment per unit angular deflection of the<br />
cupula<br />
= angular deviation of the endolymph with respect to the skull<br />
a = component of angular acceleration of the skull, with respect to<br />
inertial space, normal to the plane of the semicircular canal.<br />
In Laplace transfer notation the cupula deflection is related to the angular<br />
acceleration by the relationship:<br />
_(s) _ 1<br />
a(S) s2 + pr/0)s + (a/0)<br />
*The material in this section was kindly furnished by Professor L. R. Young, Massachusetts<br />
Institute of Technology.<br />
591
592 Bioastronautics Data Book<br />
Figure A-1. Framework for systems analysis of vestibular function.<br />
(Young, 1969)<br />
Tot s_n Pendulum<br />
Cenlro_ Nentou$ System<br />
Q}sec De_d Subtech ve<br />
Time _elay Go,n<br />
N?stc)gm_$ f20 seC _,.S deg/$e:<br />
Gain Adoplohon Threshold<br />
_s *- O_Oe3)<br />
" l Ve_o¢_I_<br />
Lon(_ Teem<br />
Threshold<br />
s ¢ O. of Ve_octt_<br />
30 sec<br />
Artopta'_or_ L5 _eg/$eC<br />
Figure A-2. Model for subjective sensation and slow phase nystagmus velocity<br />
for rotation about a vertical axis. (Young & Oman, 1969)<br />
If the roots of the denominator are real and widely separated, i.e., the system<br />
overdamped and A/_r < 71"/0,the equation may be approximated as<br />
where<br />
_ ]<br />
a(s) (S+a)(S+b)<br />
a --_--A (0.04 - 0.02 rad/sec)<br />
Threshold
and<br />
[a nominal<br />
The Vestibular System 593<br />
= 0.1 rad/sec for lateral canals,<br />
0.14 rad/sec for posterior and superior canals]<br />
corresponding to the long time constant of the cupula<br />
return phase<br />
b = -_" (4 - 300 rad/sec)<br />
[bnomina i = lOrad/sec]<br />
corresponding to the short time constant.of the system<br />
The existence of a nystagmus reversal following an impulse of acceleration and<br />
the reduction in nystagmus and sensation during sustained constant angular<br />
acceleration led to inclusion of central adaptation blocks for both nystagmus<br />
and sensation of angular velocity. The response of this model to an acceleration<br />
impulse (velocity step) of 1.0 deg/sec is shown in figure A-3 (Young & Oman,<br />
1969). Notice the apparently shorter time constant for subjective angular<br />
velocity than for nystagmus slow phase velocity as has been observed in<br />
cupulometry. The model response to a step of constant acceleration is shown to<br />
agree with experimental data in figure A-4 (Young & Oman, 1969). Latency to<br />
detection of low-level constant angular accelerations is shown in figure A-5<br />
(Young & Oman, 1969). Finally, the semicircular canal model can be used to<br />
predict nystagmus and subjective sensation responses to sinusoidal stimuli. For<br />
nystagmus, the concept of "cumulative" eye position is used, derived by<br />
eliminating all fast phases and piecing together the slow phase nystagmus as in<br />
figure A-6 (Young, 1969). The resulting frequency response for nystagmus is<br />
shown in figure A-7 (Young & Oman, 1969). It is seen that over a wide range of<br />
frequencies (within 0.1 rad/sec-lO rad/sec), the eye angular velocity tends to<br />
compensate for head angular velocity with relatively little phase lag or phase<br />
lead, but with a gain significantly less than 1. The complementary frequency<br />
response for subjective sensation of velocity is shown in figure A-8 (Young &<br />
Oman, 1969). The break frequencies are noted in terms of "ra (adaptation time<br />
constant) and A/_'.<br />
The nonlinear model for otolith function relates specific force (gravity minus<br />
linear acceleration) to perceived linear acceleration or tilt, as shown in figure A-9<br />
(Young, 1969). The step response of this model shows a rapid rise, an overshoot,<br />
and decay of the resting level to about 40 percent of the peak response with a<br />
time constant of approximately 5 seconds. The model frequency response is<br />
shown in figure A-10 (Young, 1969). It is supported by data on sensation of<br />
linear velocity during sinusoidal horizontal acceleration and by the phase angle<br />
of dynamic counterrolling during continuous rotations. The model can be<br />
interpreted as perceived velocity with respect to actual velocity, or perceived tilt<br />
with respect to actual tilt. Figure A-11 (Young, 1969) shows the latency to<br />
perception of constant linear acceleration as a function of acceleration level. The
594 Bioastronautics Data Book<br />
model assumes an absolute threshold of approximately 0.005g's for<br />
gravitionertial force in the plane of the utricular otolith. Figure A-11 is for<br />
horizontal acceleration with the head upright which places the latency at<br />
0.01 g's.<br />
i _ero_i_,_ \ . c.p,.,o Dot,.cti_<br />
0 Velocity<br />
f I I I I I I I I I I l I I I 1 I l I<br />
0 4 8 12 16 20 24 =)8 32 3.6<br />
Time (sac}<br />
| I I I<br />
Figure A-3. Velocity step response of MIT semicircular canal linearized model<br />
to 1.0 deg/sec velocity step. (Young & Oman, 1969)<br />
I I I I I I 1<br />
...._X..._ X • Subjective [xperimentoI Ooto<br />
.o //_ 202218 f<br />
_ _.,,...._Aver°gefor I0 Subjects<br />
Jill<br />
44 48<br />
'"I-- / _<br />
I0 o o 0 o<br />
8 o o o<br />
_:1-/_./ o._,o._.o,..,,,o_..<br />
oo,o..,oo., ,o,° so_,,°,, v.,oo,,, ,,,,,,_.o,o,<br />
g/<br />
,o<br />
,<br />
_o<br />
,<br />
,o<br />
,<br />
,o<br />
,<br />
,o<br />
,<br />
,o<br />
,<br />
,o<br />
TIME {in Se,condll)<br />
Figure A-4. Comparison of adaptation model for vestibular response with Guedry and<br />
Lauver (1961) experiments for an angtflar acceleration step (1.5 deg/see2). (Yotmg & Ornan,<br />
19691<br />
8O
I00<br />
60<br />
40<br />
30<br />
20<br />
TheVestibular System 595<br />
.,olO<br />
a x Data from Clark and Stewart_<br />
6 _ x a reModel prediction :.<br />
I,=<br />
3<br />
_9i.o<br />
.6<br />
A<br />
3<br />
.2<br />
1/ I I Illlil J f IJJClll '1 I I ill,F___<br />
a Experimental data from -<br />
a Meiry, with one standard<br />
_x ° deviation<br />
I:l<br />
g<br />
_o,= =xo q.,_.........,_......,_<br />
I , I , _,t,[ [ I J I IlJl( I I I II1,,<br />
.2 .4 .6 1.0 2 4 6 810 20 40 70<br />
.Angular Acceleration deg/sec z<br />
Fig_e A-5. Adaptation model for subjective response latency<br />
to constant angular acceleration. (Young & Oman, 1969)<br />
VESTIBULAR NYSTAGMUS<br />
EYE POSITION J<br />
Figure A-6. Vestibular nystagmus and "cumulative" eye position (f= 0.5 Hz). Note<br />
correspondence of slow phase vestibular nystagmus and "cumulative" eye position.<br />
(Meiry, 1965)<br />
LEFT<br />
LEFT
596 Bioastronautics Data Book<br />
°7f ' ' ' '<br />
+4c -_<br />
I • E_perimet_tal Phase Angle _dh _'I<br />
Ol'_ Stondard Dewot_on from Melry H965j<br />
-40-- I K • Ka_z /lgfiTI<br />
-a0 I 1 1 i<br />
0.01 O. I I. O I 0 I00<br />
FREQUENCY i_ Radlon$ ISec<br />
Figure A-7. Frequency response of compensatory eye movements for linearized model:<br />
eye velocity/input velocity = 10.5sZ/(s + -25) (s+.0625) (s+.008). (Young & Oman, 1969)<br />
0<br />
Q:<br />
-fo<br />
-2o<br />
-3c<br />
E' -40<br />
O.Ofcp$ O.fcps<br />
_ '<br />
_ / Subjeclive Angulor Velocity<br />
/<br />
Inout AnguIor Velocity<br />
--#<br />
"_ +180 --<br />
<<br />
24.0e "0-_ 12<br />
( a+ 25)(s +0625 }(s +033)<br />
I " Phose _oto from KOlZ _9671 _qlh<br />
0_ Stondord Deviation<br />
lOpS lOops<br />
I 1 l I_ l l I _IIII I I [ I I I<br />
OOf O.I 1.0 I0 IO0<br />
FREOUENCY { Rodlons pet Second)<br />
Figure A-8. Frequency response of adaptation model for subjective sensation.<br />
(Young & Oman, 1969}<br />
_ECHAN_CAL MOOEL<br />
OF OTOLITH<br />
ACCELE_OMETER<br />
SPE CJF IC I _'5<br />
r_RCE )S_C_gHS ÷ _,S_<br />
OTOC_T_<br />
d<br />
DISPLACE _EN?<br />
w _ T _ACULA<br />
MECHANICAL<br />
THRESHOLD<br />
NEURAL<br />
P_OCE$S_NG<br />
1 )d AND d TERMS)<br />
, I<br />
Figure A-9. Revised nonlinear otolith model. (Young, 1969)
The Vestibular System 597<br />
i i i , i i r I , _ i , i i , , _ T _ [ , [ I I I<br />
II A (CCW| I COUNTIERROLLING<br />
• G(CW) I {KELLOGG)<br />
20 (3 G (CCW) j<br />
,o J j t\,<br />
" 30 o VELOCITY<br />
• PERCEIVEO LINEAR<br />
0- II • * I STD D_VIATION<br />
-50<br />
- 70<br />
L I _ i ,zLi . _ , r 'Ill , , I , ii<br />
O.I i-O<br />
FREQUENCY (RAD/SEC)<br />
Figure A-10. Perceived velocity frequency respome. (Young, 1969)<br />
7<br />
6<br />
I I l 1 I 1 I 1<br />
15<br />
(S + O 19)(S 4-1 5)<br />
I EXPT. DATA ( -+ I STD. DEVIATION)<br />
--OTOLITH MODEL (MECH. ONLY)<br />
I I I I I I I I 1<br />
0 "01 '02 "03:04 05 "06 "07 -08 :09<br />
ACCELERATION (9)<br />
Figure A-11. Time for perception of constant linear acceleration-model and experiment.<br />
(Young, 1969)<br />
Cross-coupling between linear and angular sensors has al.so been a subject of<br />
input-output modeling. A preliminary structure of this cross-coupling is shown<br />
in figure A-12 (Young, 1969) in which linear acceleration affects nystagmus
598 Bioastronautics Data Book<br />
both through modification of semicircular canal nystagmus and through "L<br />
nystagmus" based on otolith stimulation. Numerous examples of "barbeque<br />
spit" nystagmus have been observed, both by constant angular velocity rotation<br />
about a longitudinal horizontal axis and by counterrotating a subject on a<br />
centrifuge. In each case the "steady state" angular acceleration at the<br />
semicircular canals is zero, and yet a co_rsistent nystagrnus pattern persists. The<br />
nystagmus contains both a bias (steady level) component and a sinusoidal<br />
component with period equal to that of the rotation. The sensitivity of this bias<br />
mid sinusoidal component (as well as the predication of Steer's "roller pump"<br />
model) is shown in figure A-13 (Young, 1969).<br />
UAGNIrUDE,<br />
D_AT40N O r<br />
S,OW P-aS(<br />
Figure A- 12. Preliminary structure-model of influence of linear acceleration on nystagmus.<br />
(Young, 1969)<br />
g<br />
3o<br />
2o .<br />
o'- to-<br />
30<br />
2Or<br />
_" bO<br />
t<br />
D<br />
o<br />
%t<br />
(3 I 2<br />
STEER<br />
GUE(3RY<br />
BENSON<br />
------ M(3DEL PREDiC_O_J<br />
o<br />
1oi I_ { _<br />
• STEER<br />
U] GUEDRY<br />
0 BENSON<br />
3 4 5 6 7 8 9 IO 20 30<br />
RPM<br />
(o) Magnitude of Bias<br />
o o<br />
[J<br />
o<br />
0 i.?i L_J__L_Z I ] J 1 M I I<br />
0 I 2 3 4 5 6 7 8 9 I0 20 30 40<br />
RPM<br />
(b) Magnitude of Sinusoidol Component<br />
Figure A-J3. Summary of available data of normalized bias an(:[ sinusoldal amplitude<br />
of vestibular nystagmu_ fromrotationin a ]-_ field (I,-nystagmus). (Young, ]969)<br />
4O
The Vestibular System 599<br />
An overall summary diagram of the vestibular model is given in figure A-14<br />
(Young, 1969).<br />
VELOCITY TO THE ,_KULL *<br />
f,l--o)<br />
SPECIFIC<br />
RESPECT TO<br />
FORCE ON THE SKULL<br />
CANAL OYN_d,J_CS' SYNER_'_C ~ 4 DKG/SIEC THRfSHOLD<br />
. ..... - + 7. . CNS DELAY 3O SEC -2 OEG/.T,_C<br />
OTOLJ TH D YM._,E4;CS<br />
fL _,_ I-- 1"5 F_ NELWqAL LEAO<br />
f - - TH_'_OL D EQUIVALEN<br />
' 1<br />
_ .............. IT L-_ ""o3i_' C C'U_T ERFCOLLI NG AP"G L E<br />
on $o¢R hml conlt_t (_b)l¢li_) of 7 _c<br />
; _ .................... quoelrlmmi _r. ..... of O_4r/I<br />
Figure A-14. Summary diagram. Biocybernetic model of vestibular system.<br />
(Young, 1969)<br />
References<br />
Beuson, A.S. Modification of per-and post.rotational responses by the concomitant linear<br />
acceleration. In Second symposium on the role of the vestibular organs in space<br />
exploration. NASA SP-115. Washington ,D.C.: U.S. Government Printing Office, 1966.<br />
Pp. 199-211.<br />
Oark, B., & Stewart, J.D. Perception of angular acceleration about the yaw axis of a flight<br />
simulator. Aerospace Medicine, 1962, 33, 1426-1432.<br />
Guedry, F.E. Influence of linear and angular acceleration on nystagmns. In Second<br />
symposium on the role of the vestibular organs in space exploration. NASA SP-115.<br />
Washington, D.C.: U.S. Government Printing Officer, 1966. Pp. 185-196.<br />
Guedry, F.E., & Lauver, L.S. Vestibular reactions during prolonged constant angular<br />
acceleration. ]ourna/ofAptdied Phys/o/ogy, 1961, 16,215-220.<br />
Hixson, W.C., & Niven, J. I. Frequency response of the human semicircular canals. I1.<br />
Nystagmus phase shift as a measure of nonlinearities. NSAM-830. Naval School of<br />
Aviation Medicine, Pensacola, Fla., 1962.<br />
Katz, G.B. Perception of rotation-Nystagmus and subjective response at low frequency<br />
stimulation. S.M. Thesis. Massachusetts Institute of Technology, Cambridge, Mass.,<br />
1967.<br />
Meiry, J.L. The vestibular system and human dynamic space orientation. T-65-1.<br />
Massachusetts Institute of Technology, Cambridge, Mass., 1965.<br />
Steer, R.W., Jr. The influence of angular and linear acceleration and thermal stimulation on<br />
the human semicircular canal. MVT-67-3. Massachusetts Institute of Technology,<br />
Cambridge, Mass., 1967.
600 Bioastronautics Data Book<br />
Steer, R.W., Jr. Response of semicircular canals to constant rotation in a linear acceleration<br />
field. In Fourth symposium on the role of the vestibular organs in apace exploration.<br />
NASA SP-187. Washington, D.C.: U.S. Government Printing Office, 1966. Pp. 353-360.<br />
van Egmond, A.AJ., Groen, JJ., & Yongkees, L.W.B. The mechanics of the semi-circular<br />
canal. Journal of Physiology,London, 1949, 110, 1-17.<br />
Young, L.R. The current status of vestibular models. Automatica, 1969, 5, 369-383.<br />
Young, L.R., & Oman, C.M., Model for vestibular adaptation to horizontal rotation.<br />
Aerospace Medicine, 1969, 40, 1076-1080.
The Vestibular System<br />
APPENDIX B<br />
Design Criteria for Rotating Space Vehicles ¢<br />
Mathematical expressions for the unique static and dynamic characteristics<br />
(and associated derivatives) in rotating environments are listed in table B-1.<br />
Certain aspects of man's performances are influenced by these characteristics.<br />
They are as follows:<br />
Self-locomotion, either walking or climbing, and material handling are, of<br />
course elements of gross motor performance; other gross motor performances of<br />
concern are force and torque applications. Fine motor performance involves<br />
dexterity and eye-hand coordination involving head motions. Postural balance<br />
may be influenced by reduced gravity and the Coriolis forces acting due to body<br />
motions necessary in the act of balancing or moving. Transition from artificial<br />
gravity to zero gravity and return, as may be required in space base operations,<br />
can possibly degrade performance because of developed adaptations to either<br />
condition. Passive radial locomotion, as with an elevator on a space base, may be<br />
influenced by the Coriolis forces involved, dependent on the rate of elevator<br />
movement. In addition, the potential rapid onset of g when increasing radius<br />
could have an acute influence on orthosatic tolerance as any rapid onset of g<br />
might. Work-rest cycles involve the time lines of general and specific<br />
performance and the energies involved for performance, and could influence the<br />
extent of work and rest periods.<br />
The remainder of this material involves the considered influence of the<br />
unique characteristics of artificial gravity on specific elements of performance. A<br />
number of criteria have been suggested that relate to these characteristics and<br />
the potential influence on performance (table B-2). These criteria are used to draw<br />
boundaries on plots of the two independent variables of artificial gravity, radius<br />
and rate of rotation, and thus depict areas of these variables where acceptable<br />
performance may be expected. It must be remembered that these boundaries are<br />
currently based on judgment, as little data exist. It is necessary, therefore, to verify<br />
the validity of the criteria and to establish appropriate magnitudes for them. The<br />
criteria (table B-2) relate to the gravity level, Coriolis forces, gravity gradient, and<br />
cross-coupled angular accelerations. The gravity-level criteria are bounded by 1 g<br />
and 0.1 g while moving in the vehicle. There is clearly no need to exceed 1 g and<br />
0.1 g is considered a minimum value for adequate traction. The Coriolis forces relate<br />
to human or object motion tangentially and radially and with the annoying<br />
factor that objects do not fall where expected. The gravity gradient criteria relate<br />
to changes of weight of objects when their radical position is changed, to the gradients<br />
along the body, and to variations of hydrostatic pressure along tbe body<br />
relative to that on Earth. The cross-coupling angular acceleration criteria relate to<br />
the rotation of objects and to the rotation of the human head in the rotating<br />
environment.<br />
**Thematerial under this heading was kindly furnished by Mr. R. W. Stone, Jr., NASA Langley<br />
Research Center.<br />
487-858 0 - 73 - 39<br />
601
602 Bioastronautics Data Book<br />
g level<br />
g gradient<br />
g ratios<br />
Table B-I<br />
Mathematical Expressions of the Characteristics of Artificial Gravity<br />
Object weight change<br />
Characteristic<br />
Gravity variations along body<br />
Coriolis acceleration (radial)<br />
Coriolis accelerat ion (tangential)<br />
Angular cross coupling<br />
acg = rcg 6.) 2<br />
Mathematical Expression<br />
dacg/d r = 6Jv2 = acg/rcg<br />
alia 2 =rllr 2<br />
AW/W = (r 1 -r2)/r 2<br />
h ((Dv2) = (h/r)acg<br />
_-Y-_.r ((..,312 + 2601 r,_v+ 6Jv2)<br />
_" = 2_((.01 + OJv) +r_ 1<br />
(_h x = ('_h_- EO.___v(G'lh 8 sin 8<br />
+ C_hqs_o_0 ,in _ )<br />
_hv = Who"_%(% _ co,o co,<br />
- C_h_ ) ,in 9 )<br />
('_hz = COh • I_/ + __ ('Ov ( COhe cose co, _,<br />
+ LOh_COS _ sin 1],//<br />
Hydrostatic pressure variation PH, = P/2 (r2 -- r2) EOv2<br />
Distance objects fall from expected position d = r F (_rF2 -- r12/r| - tan--1<br />
(_/r 1))
Tangential movement<br />
Radial movement<br />
Dropped objects<br />
The Vestibular System<br />
Table B-2<br />
Potential Criteria for Artificial Gravity<br />
Gravity Level<br />
32.2>r_ + 2r% % + r%2> 3.22<br />
Coriolis Forces<br />
(1 + C1 rb0v2 > rEO12 -4:.2r(.O 10.) v + r(X)v2_(1-C1)rb)v2<br />
2r/,%
604 Bioastronautics Data Book<br />
Figure B-1 is a graphic representation of the influence of these characteristics<br />
on man moving within a rotating spacecraft. There is radical movement toward<br />
and away from the center of rotation with the tangential components of Coriolis<br />
forces acting. There is tangential movement with and against the direction of<br />
rotation with alterations in the radial forces (weight) shown. Axial motion<br />
causes no Coriolis forces except for those created by lateral movement of limbs<br />
or lateral body sway. The least influence of the characteristics of artificial<br />
gravity on human mobility probably occurs during axial motion.<br />
q)V MAN'S<br />
CTION OF ROTATION<br />
EOTATIONAL<br />
AXIAL VELOCITY<br />
"G<br />
RADIAL CORIOLIS ACCELERATION<br />
); TANGENTIAL CORtOLIS ACCELERATION<br />
mV VEHICLE ANGULAR<br />
VELOCITY<br />
O ARTIFICIAL GRAVITY<br />
ACCELERATION<br />
r_ I MAN_3 TANGENTIAL<br />
VELOCITY<br />
MAN'S RADIAL VELOCITY<br />
Figure B-1. Graphical representation of influence of artificial gravity on self-mobility.<br />
Figure B-2 shows four boundaries expected to influence walking on the<br />
floors of rotating vehicles. The 1 g limit is one below which, when walking<br />
at 3 ft/sec, the body will never exceed 1 g. Below the leg weight boundary,<br />
the feet, when walking at 3 ft/sec, will not exceed 1 g. Above the 0.1 g<br />
traction limit, traction is expected to be adequate. The fourth boundary,<br />
AW/W, often referred to as the ratio of Coriolis force to artificial weight, is<br />
one above which, when walking 3 ft/sec, the change in weight due to the<br />
relative motion will not exceed 0.5 of the artificial weight. Also shown in<br />
this figure are data for walking in simulated artificial gravity at nominal<br />
values of artificial gravity of 1/6g, 0.2g, 0.3 g, and 0.5 g. While walking<br />
against the rotation at 1/6 g, lraction became difficult which tends to verify the<br />
traction boundary. At 0.5 g, while walking with the rotation, subjects complain<br />
of leg heaviness, indicating that the boundary for leg heaviness may be somewhat<br />
high. Walking at 0.3 g seems to be the most amenable g of those studied. The<br />
AW/W boundary has not essentially been established at 0.5. It should be noted<br />
that these data were obtained for curved floors having a constant value of radius.<br />
Flat floors, depending on the radius, can impose difficulties not indicated<br />
on this figure.
E<br />
Q.<br />
12<br />
I0<br />
8<br />
4<br />
The Vestibular System 605<br />
(;<br />
k. LOCOMOTION RATE = 3 FT/SEC<br />
i_-_-_- _.... !<br />
" ' j ./--1 g LIMIT<br />
","_---b"rr,,_ LIMIT<br />
":'/>A_rn'rrm-,.,_ /-.t g TRACTION<br />
_--.o-- .,,_//_<br />
I I t ,I i i i<br />
20 443 60 80 I00 120 140 160<br />
RADIUS, FT<br />
Figure B-2. Rate of rotation and radium boundaries for acceptable tangential<br />
self-locomotion in artificial gravity. Boundaries are for speed of locomotion of 3 ft/sec.<br />
Figure B-3 shows two boundaries for radial motion of the astronaut, as when<br />
climbing toward or away from the center of rotation, one for which the Coriolis<br />
forces due to 2 ft/sec radial motion does not exceed 0.30 the artificial weight,<br />
and the other where it does not exceed 0.30 the Earth weight. There are no data<br />
to support either criteria or the magnitude of 0.30. As these are forces not<br />
supported by the legs, the boundary that relates to Earth weight may have<br />
significance. Clearly, studies to establish proper values are needed.<br />
16<br />
14<br />
!2<br />
iO<br />
ill, rprn 8<br />
6<br />
4<br />
2<br />
ol<br />
: C@_IO LIS FORCE<br />
LEVEL 0 3C'<br />
L _ L _ L L I<br />
20 40 60 80 100 _2© q40 16Q<br />
R_ID_U$, FT<br />
Figure B-3. Rate of rotation and radius boundaries for acceptable sclf-locomolion<br />
in artificial gTavity. Boundaries are for a speed of locomotion of 2 ft/sec.<br />
/'
606 Bioastronautics Data Book<br />
Figure B4 shows boundaries for material handling. Three boundaries are<br />
shown: one for tangential movement above which the change in weight due to<br />
4 ft/sec of motion will not exceed 0.25 of the artificial weight; a second for<br />
radial motion where the tangential Coriolis forces do not exceed 0.25 of the<br />
artificial weight; beyond the third boundary, the weight of an object when raised<br />
6 feet does not decrease below 0.50 of its original artificial weight. A fourth<br />
possible boundary is not shown but would relate to the rotation of an object out<br />
of the plane of rotation. It has been assumed that a torque caused by angular<br />
cross-coupling probably can be 0.50 of the applied torque. Rate of vehicle<br />
rotation for this value could be rather large, greater than 10 rpm. Research to<br />
establish the validity of any of these criteria and proper magnitudes for them are<br />
required.<br />
14-<br />
12-<br />
I0- ___.__<br />
WT. RATIO • 0.50<br />
6 RADIAL FORCE<br />
TANGENTIAL _ RATIO • 0.25<br />
CORIOLI$ FORCE/_<br />
4; RATIO= 0.25 --/ '/,,_.<br />
20 40 60 80 I00 120 140 160<br />
RADIUS, FT<br />
Figure B-4. Rateof rotationandradiusboundariesfor acceptablematerialhandling<br />
in artificial gravity. Boundariesare for speedof materialmovementof 4 ft/sec.<br />
Figure B-5 relates to boundaries for postural balance. The first is a static<br />
boundary or neutral stability, beyond which the vestibular mechanism would<br />
sense falling before an unbalance angle for a stationary man would be exceeded.<br />
It is felt that this is not a significant boundary for normal man. Two dynamic<br />
boundaries are shown, one for the vertical motions and the other for lateral<br />
motions present when walking. In both instances, these could have more critical<br />
influence when walking axially as the unusual Coriolis accelerations would act in<br />
a lateral direction about which man is least stable. When man is walking<br />
tangentially, the accelerations act in the saggital plane. It is assumed that these<br />
Coriolis accelerations should not exceed 0.25 of the artificial weight.<br />
Figure B-6 is a plot that relates angular head motions and vehicle rate of<br />
rotation. The stimulus that causes disturbances in a rotating environment is the<br />
cross-coupling that exists between these two angular velocities. The product of<br />
these two values gives the maximum stimulus from cross-coupled angular
The Vestibular System 607<br />
acceleration. Shown on this figure are curves of constant values of this<br />
cross-coupling, ranging from 0.5 to 4,.0 rad/sec2. Based on current experience, a<br />
value of this cross-coupling of 2.0tad/see2 ( deg/sec 2) seems to be a<br />
conservative tolerance criterion. A range of rapid head motions possible for man<br />
is from 2.5 to 3.5 rad/sec ( 140 deg/sec to 200 deg/sec). Vehicle rpm<br />
boundaries of 4 (a conservative value), 6 (a nominally acceptable value), and<br />
10 (a tolerable value) are shown. Generally, of course, adaptation is required to<br />
attain continued exposure to such rotation.<br />
_a, rgm<br />
4<br />
't<br />
0<br />
0<br />
---STATIC<br />
BOUNDARY<br />
_)_))_._t_OYNAMtC _OUNDARy/--DYNAMIC BOUNDARY<br />
__?RT ICAL MOTION<br />
20 40 60 80 I O0 120 140 t 60<br />
RADIUS, FT<br />
Figure B-5. Rate of rotation versus radius boundaries<br />
for acceptable postural balance in artificial gravity.<br />
'°F// \<br />
BOOY ANGULAR (Ice<br />
MOVI[ MENTS, RAD/SF.CI<br />
RAD/SEC _ 4<br />
0 2 _1 6 .8 1.O 12<br />
RAD/$EC<br />
I i I<br />
_ ' . ° ,0 ,',<br />
VEHICLE RATE OF ROTATK_WN, RP"<br />
Figure B-6. Possible criteria for acceptability of cross-coupled angular accelerations<br />
in vehides with artitifial gravity.<br />
Figure B-? is a compilation of all the previous boundaries shown,<br />
superimposed on plots of artificial gravity. The area encompassed by all
608 Bioastronautics DataBook<br />
boundaries shows a minimum radius between 50 and 55 feet. The material<br />
handling boundaries are the critical elements. These boundaries are, of<br />
course, not well established and must be validated numerically and for<br />
analytical form by experiments. If these are not valid, a much smaller<br />
radius may be possible. It must be noted, of course, that al: other<br />
boundaries require similar verification. The Coriolis force to artificial gravity<br />
ratio ( W/W), which is plotted as 0.5on this figure, has often been<br />
considered to have a maximum desirable value of 0.25. Such a value would<br />
impose a radius of the order of 50 feet, as has been noted previously.<br />
12 I " WALKINGBOUNDARIES(FIG B2)<br />
I CLIMBINGBOUNDARIES{FIGB,_<br />
POSTURALBALANCEB(::X._DARIE.S (FIG. 5)<br />
_jt ......... MATERIALHANDLINGBOUNOARIES[FIG4)<br />
I C , .,_l NOMINAL HEAD MOTIONBOUNDARY(RG. B6)<br />
_'_% -- ARTIFICIAL-GRAVITYLEVELS<br />
"_4 "-'----- -I<br />
0 20 40 60 80 I00 120 140 160<br />
RADIUS, (r), FT<br />
Figure B-7. Compilation of boundaries for acceptable human performance<br />
in artificial gravity.<br />
Figure B-8 is a log plot based on the material in Figure B-?.<br />
_s 2 2_ _ 3s 4 4s s _ i e 9 , ?_ _ 2_ 3 }5 _ 4s _ 6 _ 8 ID<br />
45 /'<br />
nl _s I 2S a _s 4 4rS 5 G _ s _ 1 15 2 2_ ] as , is _ 6 7 s<br />
CENTRIPETAL ACCELERATION IN "g"<br />
Figure B--8. Log plot of material in figure B-7. (Co.'tear of D. B. Crier)
a<br />
{X<br />
r<br />
62<br />
W<br />
AW<br />
g<br />
h<br />
X<br />
Y<br />
0,_,_<br />
PHs<br />
d<br />
Subscripts<br />
cg<br />
V<br />
1 and 2<br />
1<br />
hx, hy, hz<br />
h0, h_, h<br />
F<br />
CC<br />
The Vestibular System<br />
SYMBOLS<br />
acceleration, feet per second squared<br />
angular acceleration, rad/sec<br />
radius, feet<br />
rate of rotation, radians per second<br />
artificial weight, pounds<br />
change in artificial weight due<br />
velocity, pounds<br />
acceleration of Earth's gravity<br />
distance or height along body, feet<br />
instantaneous radial distance, feet<br />
instantaneous tangential distance, feet<br />
Ealer angles, radians<br />
hydrostatic pressure pounds per square foot<br />
tangential distance, feet<br />
center of gravity<br />
vehicle<br />
radial positions<br />
incremental<br />
head or object relative to inertial space<br />
head or object relative to vehicle axis<br />
floor<br />
cross coupling<br />
to radius change or relative<br />
Dot represents the first derivation with respect to time<br />
Double dot represents the second derivation with respect to<br />
time<br />
609
CHAPTER13<br />
VISION<br />
by<br />
John H. Taylor, Ph.D.<br />
University of California<br />
San Diego<br />
The extreme importance of the human visual system in ordinary life is<br />
obvious, and the necessity for an intact functional visual apparatus in the<br />
performance of ever more critical tasks when man and machine must<br />
interact has become increasingly evident. Man is no longer a mere passenger<br />
aboard a space vehicle-he is an active element in the system, able to<br />
perform intricate tasks, to make scientific observations, to exercise<br />
judgment, and to modify the coursc of a mission. The most important<br />
sensory input which he requires for nearly all such activity is visual, and it<br />
is therefore imperative that every phase of operation in space be considered<br />
in regard to the optimization, maintenance, and protection of man's vision.<br />
This chapter presents some of the facts of human vision which are<br />
believed to be important in present and projected space activities. Even<br />
though it is limited to the case of normal or superior visual capabilities, as<br />
may be assumed to pertain to the astronaut group, the information is<br />
necessarily sketchy. For this reason, and because new data are always<br />
becoming available, it is to be hoped that the reader will seek<br />
supplementary information in the current literature.<br />
Units and Definitions<br />
The quantitative description of the visual process requires a set of<br />
meaningful units, and because of the nonlinearity of the eye as receiver,<br />
these units differ from the units of physics in that they reflect the<br />
propertie_ of the underlying physiological and psychophysical mechanisms of<br />
vision. Radiant energy in the band of electromagnetic wavelengths between<br />
about 380 and 750 nanometers is capable o! stimulating the eye, and that<br />
Reviewed by John Lott Brown, Ph.D., University of Rochester.<br />
611
612 Rioastronautics Data Book<br />
which does so is called light. While the measurement of radiant energy in<br />
general is called radiometry, the measurement of light is called photometry,<br />
and photometric units are based upon the potential of light for stimulating<br />
vision. An adequate discussion of the relationship between radiometric and<br />
photometric concepts and quantities is beyond the scope of this chapter,<br />
and the reader should consult one or more of the available contemporary<br />
references 0galsh, 1958; Kaufman, 1966; Meyer-Arendt, 1968). Some of the<br />
units most frequently used are shown in table 13-1. The function which<br />
relates radiometric quantities to their photometric counterparts is called the<br />
luminous efficiency curve, and is shown in figure 13-1. This curve is, in<br />
fact, the spectral sensitivity function for the eye at high energy levels, and<br />
the photometric units which depend upon it are rigorously appropriate only<br />
to the case of daylight vision. It will be seen later that the maximum of<br />
the curve is shifted toward the shorter wavelengths as light levels drop, and<br />
that for night vision the peak has moved from its daylight position at<br />
555 nanometers (nm) down to 505 nm. There have been efforts to establish<br />
photometric units wMch apply to the low-level case (scotopic, as opposed<br />
to photopic vision), but for most purposes the units based on the data of<br />
figure 13-1 continue to be used. A notable exception occurs in the<br />
treatment of colored stimuli at low levels, where the correction is absolutely<br />
mandatory.<br />
Most of the data provided in this chapter are expressed in terms either<br />
of luminance or of a kind of ratio of luminances called contrast. Luminance<br />
is the photometric term corresponding to radiance, and refers to the<br />
amount of visible light coming from an extended surface which is<br />
illuminated or self-luminous. In the former (much more usual) case it is the<br />
product of the illuminance falling on the surface and the luminous<br />
reflectance of the surface, and will generally be dependent on the lighting<br />
and viewing geometries. There are many units of luminance which have<br />
been used from lime to time, and the present trend is to reduce their<br />
number to a single unit in the M.K.S. system; the candela per square meter<br />
(cd-m-2). or nit. But almost none of the data of vision are reported in<br />
terms of nits, and it is safe to say that almost none of the engineers who<br />
deal with light are yet able to visualize a luminance of, say, 10 ed.m-2. By<br />
far the most used and most familiar units of luminance, at least in<br />
English-speaking countries, are the foot-lambert (ft-L) and the millilambert<br />
(mL). These two quantities are close enough in magnitude (1 ft-L =<br />
1.076 mL) so that they may be considered equal in most engineering<br />
applications, and these axe the units which will be used here.<br />
Interconversions between some of the more common luminance units and<br />
illuminance may be accomplished by use of the values in tables 13-2 and<br />
13-3. Other units and concepts will be defined as needed in the text.<br />
Concept of the Threshold<br />
The quantitative description of visual performance is usually made in<br />
terms of that useful construct called the threshold. Simply put, the<br />
threshold is some value of stimulus magnitude, or interstimulus difference,
I<br />
OC<br />
0<br />
Vision 613<br />
°___<br />
t- C ¢" _<br />
_ > .<br />
00000_<br />
CCCC_C<br />
._._._.g._.__._-_<br />
__Z_<br />
E<br />
x<br />
"6<br />
E<br />
>:<br />
0<br />
E<br />
1<br />
A<br />
II<br />
f-<br />
2 co<br />
'10<br />
o _ _<br />
u >- c o .c_<br />
_ _ _ _<br />
_ #. g.__ _ _<br />
(o<br />
o<br />
.--<br />
_:____ .n-<br />
n- n- n- nr n- _ ¢n<br />
0 u<br />
.=<br />
1<br />
et<br />
113<br />
E<br />
o<br />
LL
614 Bioastronautics Data Book<br />
to which an observer responds with some selected probability. The general<br />
case is suggested by figure 13-2. As the magnitude of the stimulus is<br />
increased from low values where seeing never occurs to high values where<br />
seeing is essentially certain, the curve of point probabilities rises in an ogival<br />
fashion. Since the inflection of the curve (which is commonly believed to<br />
be a normal Gaussian integral) occurs at a probability level of 0.50, this<br />
value is usually selected for reasons of statistical precision, and the value of<br />
stimulus magnitude which elicits the response 50 percent of the time is<br />
called the threshold.<br />
>-<br />
L_<br />
Z<br />
t,u<br />
klJ<br />
t--<br />
<<br />
-J<br />
1.0<br />
0.9<br />
0.8<br />
0.7<br />
0,6<br />
0.5<br />
0.4<br />
0.3<br />
0.2<br />
0.1<br />
400<br />
I<br />
450 500 550 600 650<br />
WAVELENGTH (nm}<br />
Figure 13-1. Spectral sensitivity of the human eye for daylight conditions.<br />
In most engineering applications, of course, one is concerned with<br />
performance levels other than 50 percent--usually with such probabilities as<br />
0.95 or 0.99 or even higher. Conversion to probabilities other than 0.50 can<br />
be made with confidence in some cases; the degree of risk depends heavily<br />
upon the manner in which the basic data were collected. Useful<br />
approximations can be made, for example, in the data for contrast<br />
discrimination and visual acuity, where doubling the value of threshold at<br />
P = 0.5 yields magnitudes where P is close to 1.0.<br />
Vtsib_ty<br />
The term visibility has been used in a number of ways; by<br />
meteorologists in evaluating seeing conditions in the atmosphere, by airframe<br />
7OO
O<br />
O<br />
E<br />
E<br />
A<br />
¢q<br />
.c<br />
'8<br />
Psi<br />
¢sl<br />
z_<br />
.8<br />
A e_<br />
.8<br />
A<br />
e-<br />
E<br />
"8<br />
.= t<br />
/<br />
Vision 615<br />
("3<br />
CO<br />
, ° • .<br />
g. . q . -. _.<br />
O O O O '_- O O<br />
tO<br />
tO<br />
tO ,,-- 0_ _"<br />
O P4 _'-<br />
d o _ o e_ e_<br />
tO<br />
tO<br />
o o o e_ o o<br />
0<br />
_3<br />
r_<br />
"0<br />
.c
616 Bioastronautics Data Book<br />
designers to describe a pilot's field of view, and others. Used in its more<br />
technical sense, visibility refers to the total process of seeing and thus reflects<br />
the interaction between man's visual apparatus and his physical environment.<br />
The description of visibility, therefore, requires data which relate to the<br />
properties of the visual stimulus (usually an object seen against a background,<br />
illuminated in a specific way), the optical transmission properties of the path of<br />
sight (whether it be air, or water, or through an intervening element such as a<br />
window or an optical device), and to the visual performance capabilities of the<br />
observer. A general treatment of the topic may be found in the papers by<br />
Duntley et al. (1964). By and large the solution of problems of visibility of<br />
greatest interest has been laborious and slow. Recent developments by the<br />
University of California's Visibility Laboratory are leading to the use of<br />
high-speed computers which are able to cope with the tremendous numbers of<br />
interactions between the dozen or more variables which must be taken into<br />
account.<br />
Table 13-3<br />
Conversion Factors for Units of Illuminance<br />
Number of<br />
Multiplied by. _" _" Foot-candles<br />
Equals Number_<br />
of [<br />
\.<br />
Foot-candles<br />
1<br />
Im/m 2 (lux)*<br />
Phot<br />
Milliphot<br />
*The symbol for lux is Ix.<br />
100<br />
s<br />
z<br />
o<br />
tu<br />
75<br />
LU<br />
I--<br />
UJ<br />
E3<br />
u. 50<br />
O<br />
>-<br />
I--<br />
"5<br />
_ 25<br />
<<br />
o<br />
¢v<br />
a.<br />
0<br />
r<br />
10.764<br />
0.001o8<br />
1.076<br />
/<br />
Im/m 2 (lux)*<br />
0.0929<br />
1<br />
0.0001<br />
0.1<br />
VISUAL ANGLE - minutes<br />
Phot<br />
929<br />
10000<br />
1<br />
1000<br />
f<br />
Milliphot<br />
10<br />
0.929<br />
0.001<br />
0 .2 .4 .6 .8 1.0 1.2 1.4 1.6<br />
Figure 13-2. General case of a response curve used to define "threshold." (From the<br />
Human factors in air transport design by R. A. McFarland. Copyright 1946 by The<br />
McGraw-Hill Book Company. Used by their permission)<br />
1
Vision 617<br />
The Visual Environment<br />
Earthbound man's visual environment has been determined by the quantity<br />
and quality of natural and artificial illuminations available to him, and by the<br />
reflectance characteristics of materials present in his world. His visual system has<br />
evolved in such a way that he enjoys useful vision over a range of more than<br />
ten million to one in natural illumination, by means of a relatively narrow band<br />
of wavelengths in the electromagnetic spectrum. The great range of luminances<br />
over which the human visual system can function is shown in table 134.<br />
Natural illumination reachingthe Earth's surface depends upon solar altitude,<br />
lunar altitude and phase angle, and cloud cover. An extensive study by Brown<br />
(1952) is summarized in figure 13-3. The original reference should be consulted for<br />
large scale plots relating to different latitudes and declinations, which show illumination<br />
as a function of local apparent time. A more conveniently-sized and readily<br />
obtainable version of Brown's charts may be found in Biberman et al. (1966).<br />
The inherent luminance of objects in the visual field depends upon the intensity<br />
of the illumination and the reflectance of the objects, each having<br />
directional properties. Contrast between object and background will be governed<br />
by the same quantities in the case of palpable backgrounds, or by background<br />
luminance alone in the case of objects of fixed luminance seen against the sky.<br />
The optical properties of objects and backgrounds have been discussed in detail<br />
by Gordon (1964), and the reflectance of many natural terrains has been<br />
measured by Krinov (1947). The range of luminances in average outdoor scenes<br />
on Earth is about 160:1, although extremes of 27:1 and 760:1 were noted by<br />
Jones and Condit (1941). In the special case of self-luminous or specularly<br />
reflectant objects being included in the field of view, these ratios can become<br />
very much higher.<br />
In space the visual environment will differ significantly from that on Earth.In<br />
flight, and on the surface of celestial bodies without atmospheres, natural<br />
illumination will come from the sun, planets, stars, planetary satellites, galactic<br />
light, and the zodiacal light. The lunar surface normal to the sun's rays receives (as<br />
does the top of the Earth's atmosphere) about 12 700 foot-candles (ft-c) of solar<br />
illumination. But in the absence of atmospheric scattering, this highly directional<br />
light will produce extremely high contrasts between lunar features in sunlight and<br />
those in shadow. The lunar visual environment has been discussed by Taylor<br />
(1967), and some of the photometric properties of the moon's surface, measured<br />
during the Surveyor program, have been described by Rennilson et al. (1968).<br />
Owing to the absence of atmospheric scattering and the generally low reflectance<br />
of lunar surface materials, it may be expected that the range of luminances on the<br />
moon may extend from about 1000 ft-L for sunlit rock down to about 10-6 ft-L<br />
for areas in shadow. During lunar night, when both sun and Earth are below the<br />
local horizon, the only illumination will come from the space background elements<br />
noted above. Thus, in the absence of twilight, airglow and aurorae, illumination<br />
in the lunar night will fall considerably below the minimum value shown in<br />
figure 13-3 for Earth night, and is estimated to be 10 -6 ft-c. Average luminance<br />
of the nighttime lunar landscape can therefore fall below 10-Tft-L, a level at<br />
which the human eye performs as if the luminance were zero.<br />
487-858 O - 73 - 40
618 Bioastronauties Data Book<br />
1 x 10 9<br />
Luminance<br />
in mL<br />
7 XlO _<br />
4,4 X 10 8<br />
1 = 10 8 8 X 10 7<br />
l • 10 7<br />
lt10 6 --<br />
I • IO $ --<br />
1.58 XlO 4<br />
9 4x,0_3<br />
1 • 104 6.4 X 10 "l<br />
4.3 X 10 3<br />
2.9 x 10³<br />
2X10³ '<br />
1.2 X 10 3<br />
I • 10 3 O.li X 10 2<br />
_X 102<br />
X 102<br />
5X 10²<br />
2.4X 10²<br />
I • 102 1.1 X 10²<br />
2 X 101<br />
1.6 X 101<br />
1 x 10 1 XI01<br />
7X l00<br />
1 • l00 8 X l 0" I<br />
1 a 10 "1 --<br />
I • I0 "2<br />
|slO "3<br />
2 X l0 "2<br />
7.5 X 10 -3<br />
I X lO -3<br />
Table 134<br />
Range of Luminance for Visual Performance<br />
Object Notes<br />
Sun Viewed from outside earth's atmosphere<br />
Sun Viewed from the earth<br />
A-Bomb Fireball 4 miles from point of detona-<br />
Venus<br />
Earth<br />
Mercury<br />
Earth<br />
Jupiter<br />
Sky<br />
Moon<br />
Salul*ll<br />
Mars<br />
Moon<br />
Sky<br />
Uranu_l<br />
Neptune<br />
White paper in good<br />
reading light<br />
Movie screen(indoors)<br />
TV screen<br />
Pluto<br />
Snow inlight of full mooc<br />
Lower limit for useful<br />
color vision<br />
Earth<br />
Upper limit for nii[ht vision<br />
tlon of an 800 KT weapon.<br />
Assume albedo (r) of 0.59 viewed from<br />
outside atmosphere<br />
Viewed from spece with cloud cover(r=0.8)<br />
Viewed from outside atmo6phere(r=0,0601<br />
Viewed in January from outside atmosphere,<br />
no clouds (r • 0.39)<br />
Viewed from outside atmosphere (r, 0.58)<br />
Average sky on clear dey<br />
Full moon viewed from outside of<br />
atmosphere (r = 0,073)<br />
Viewed from outside atmosphe re ( r * 0.63)<br />
Viewed from outside atmosphere {r = O15)<br />
Full moon viewed from earth<br />
Average sky on cloudy day<br />
Viewed from outsidethe earth(r = 0.63)<br />
Viewed from outside atmosphere (r= 0.73)<br />
Viewed from outside the atmosphere<br />
Viewed from outside atmosphere with<br />
full moon
I ,,, 10 .4<br />
1 x 10 .5<br />
5 • 10 .6<br />
4 • 10 "6<br />
3 • 10 .6<br />
2 • 10 .6<br />
1 x 10 .6<br />
Vision<br />
Table 13-4 (Continued)<br />
Range of Luminance for Visual Performance<br />
3 X 10 "5 Earth<br />
I X 10 -5 Absolute threshold for dark<br />
adapted human eye. lower<br />
limit for night vision<br />
1 XIO "5 Sky<br />
l X 10 "6 Space background<br />
Viewed from outside atmosphere at<br />
night with airglow, starlight, and<br />
zodiacal light providing illumination<br />
Moonless night sky viewed from earth<br />
Background luminance formed by star-<br />
light, zodiacal and galactic light.<br />
_0°40o-30o+20o 100 00 10 ° 20 ° 30 ° 40 ° 50 ° riO° 70 ° 80 ° 90 °<br />
10,0040 10,000<br />
1.000 1,000<br />
Between these extreme values of sunlit lunar day and Earthle_ lunar night,<br />
illumination on the moon is due to light from the Earth. The maximum value occurs<br />
with the full Earth at the zenith, which will provide approximately 10 h-c--with<br />
minor variations caused by rotation and differences in cloud cover As Earth's phase<br />
angle increases from zero (full) to 180 ° (dark), illumination levels will drop in<br />
conformity with the curve shown in figure 13-4 which refers to the case of the<br />
Earth at the zenith.<br />
619
620 Bioastronautics Data Book<br />
E<br />
u<br />
+<br />
? o<br />
>-<br />
F-<br />
z<br />
z<br />
-r<br />
re<br />
1.6<br />
1.,5<br />
1.4<br />
1.3<br />
1.2<br />
1.1<br />
1.0<br />
.9<br />
.8<br />
.7<br />
.6<br />
+5<br />
.4<br />
.3<br />
.2<br />
.1<br />
0<br />
1SO 120<br />
l l l I I<br />
60 0 60 120 180<br />
EARTH PHASE (de, g)<br />
J _ I I 1 1 1 l l<br />
14 12 10 8 6 4 2 0 2 4 6 8 10 12 14<br />
I<br />
DAYS BEFORE FULL EARTH<br />
I -'- DAYS AFTER FULL EARTH<br />
Figure 13-4. Earthshine intensity on the moon as a function of Earth phase.<br />
(Jones, 1967; taken from Koval, 1964)<br />
Variations in illumination due to altitude of the Earth in the lunar sky may be<br />
expected to follow the cosine law of illumination very closely. A more detailed<br />
consideration of the lunar visual environment is given by Jones (1967) and by<br />
Kuiper (1954). The report of Shoemaker et al. (1967) indicates that there are<br />
only minor local color differences to be found in the lunar surface materials, at<br />
least for the local Surveyor regions. Earthshine is somewhat variable in color, but<br />
is predominantly bluish.<br />
Farther out in space, in interplanetary travel and planetary surface<br />
exploration, the visual environment will be determined by distance from the sun,<br />
the properties of planetary atmospheres, the presence of natural satellites, and<br />
the character of the planetary materials. Solar illumination will vary with the<br />
square of the distance, so that average values may be summarized (for the<br />
normal plane) as indicated in table 13-5.<br />
The values in the table refer to illumination at the top of the planet's<br />
atmosphere, if present, and vary with distance from the sun. Conditions within<br />
and beneath the atmospheres will depend upon the characteristics of the<br />
planetary aerosols. At present only scant data exist; the cloud cover enshrouding<br />
Venus, as well as Jupiter and Saturn, precludes measurement except by remote
Vision 621<br />
probes. Koval (1964) has summarized the data for Mars, and considers both its<br />
atmosphere and the properties of the Martian surface with its observed seasonal<br />
variations.<br />
Table 13-5<br />
Illumination Levels in Space<br />
MeanSolarIllumination<br />
Planet (Foot-Candles)<br />
Mercury 84 600<br />
Venus 24 400<br />
Earth 12 700<br />
Mars 5430<br />
Jupiter 470<br />
Saturn 138<br />
Uranus 34<br />
Pluto 8<br />
The directional luminous reflectances of some selected terrain backgrounds<br />
are g_ven in table 13-6. These values not only exemplify the range of luminances,<br />
but also their variation with angles of both illumination and path of sight. After<br />
correction for transmission losses along appropriate paths of sight, these values<br />
may be used in predicting visibility for such activities as reentry (e.g., for the<br />
Apollo landmark problem), and the evaluation of Earth resources from earth<br />
orbit and other sorts of visual reconnaissance.<br />
Structure of the Visual System<br />
The principal parts of the human eye are shown in figure 13-5 and<br />
figure 13-6. Figure 13-5 shows some of the muscles that move the eyeball in its<br />
orbit. The superior rectus muscle elevates the front of the eyeball; the lateral<br />
rectus muscle pulls the eye to the right (outward). Inferior and medial rectus<br />
muscles, not seen in this drawing, balance or oppose these movements. The<br />
superior muscle, passing through a pulley, and the opposing inferior oblique,<br />
rotate the eyeball, also moving the front surface up or down and laterally. These<br />
movements allow the visual image to be consistently aligned on the retina when<br />
the head is moved or tilted. Inside the eyeball, the lining of the major cavity<br />
behind the lens is the retina, the light-sensitive neural layer (that is detailed<br />
diagrammatically in figure 13-7). Arteries and veins to supply this active retinal<br />
tissue come through the back of the eyeball with the fibers of the optic nerve,<br />
thence to be distributed over the front surface of the retina. Light rays enter the<br />
transparent cornea, and in so doing are refracted at the curved interface between<br />
air and the tear fluid which bathes the cornea. Most of the optical power of the<br />
eye inheres in this initial refraction. After passing through the cornea and the
622 Bioastronautics DataBook<br />
clearliquid(theaqueous humor) contained in the anterior chamber, the bundle<br />
of rays is restricted by a circular variable aperture, the pupil, whose size is<br />
changed through action of the muscles of the iris. The rays are further refracted<br />
by passage through the lens, traversing the clear, jellylike vitreous humor of the<br />
posterior chamber, so that, in a properly focused eye, a sharp image is formed on<br />
the retina. Scattering of light within the eye is minimized by a darkly pigmented<br />
layer of tissue underlying the retina, called the choroid. The shape of the eye is<br />
maintained by reason of its enclosure in an elastic capsule, the sclera, and the<br />
fact that the fluids within are maintained at positive pressure.<br />
Figure 13-6 and table 13-7 give dimensions and optical constants of the<br />
human eye. Values in brackets shown in the table refer to state of maximum<br />
accommodation. The horizontal and vertical diameters of the eyeball are<br />
24.0and 23.5 mm, respectively. The optic disk, or blind spot, is about<br />
15 degrees to the nasal side of the center of the retina and about 1.5 degrees<br />
below the horizontal meridian.<br />
Changes in focus are accomplished by altering the shape of the lens;<br />
relaxation of the ciliary muscle results in a thickening of the lens, with a<br />
consequent shortening of the focal length so that nearby objects are brought<br />
into focus. The action is termed accommodation.<br />
The retina is a thin membrane lining rear of the posterior chamber and<br />
containing the light-sensitive cells. These cells are of two functionally discrete<br />
types, called rods and cones. Rod cells are the more abundant, there being about<br />
120 million in each eye. They subserve night vision, and are incapable of yielding<br />
the information necessary for color discrimination, since they contain a single<br />
common photosensitive pigment. Cone cells are both less numerous (6 million or<br />
so in each eye) and less sensitive to low levels of luminance. Human cones are of<br />
three types, each containing a different photopigment with peak response to a<br />
particular part of the visible spectrum. Thus, by differential transmission of<br />
nerve impulses upon stimulation, the cones are able to encode information about<br />
the spectral content of the image so that the observer experiences the sensation<br />
of color.<br />
In addition to the rods and cones, the retina contains other nerve cells of<br />
various function. Some of these enable the impulses from many rods to be<br />
converged upon relatively few optic nerve fibers; others permit many sorts of<br />
excitatory and inhibitory cross-innervations within the retina. Through this<br />
arrangement of bipolar cells, ganglion cells, and their various interactions,<br />
impulses which arose in the photoreceptors are transmitted to the visual cortex<br />
of the brain. A vastly simplified diagram of the retina is shown in figure 13-7.<br />
Light must traverse the various layers of cell bodies and synapses before reaching<br />
the photosensitive pigments which are contained in the outer segments of the<br />
rods and cones. The darkly pigmented choroid serves to absorb unused light and<br />
thus to reduce the amount of intraocular scattering. Although there are many<br />
more rods (around 125 000 000) than cones (about 6 500 000), the impulses<br />
from many rods converge upon relatively few bipolar cells. This convergence is<br />
significantly less in the case of the cones, and is one reason for the fact that<br />
visual acuity is best at luminance levels high enough to permit adequate cone<br />
function, especially in the fovea where only closely-packed cones are found.
I<br />
e_<br />
Q<br />
C<br />
g<br />
o<br />
i"<br />
0<br />
0<br />
_-_ -_=<br />
Vision 623<br />
v<br />
A A<br />
7"I ._.<br />
_"+ _ "+,_ o. ._<br />
- ._ _ _ _-<br />
.+-_ +++- = o + _"<br />
k-- ..<br />
=_=_-=<br />
++_ +,.++_ _ _+_ .+<br />
+_<br />
.<br />
- -:_ •
624 Bioastronautics Data Book<br />
t_<br />
_o<br />
'_<br />
• !<br />
.c<br />
N O<br />
_c<br />
N<<br />
o<br />
¢nl<br />
w<br />
_._ _ o_<br />
_._ ;¢._-_ _._<br />
_. _ _"<br />
£<br />
.2<br />
h_<br />
=<br />
I<br />
E<br />
.E<br />
,2
i<br />
_ ®'. _<br />
m _<br />
Vision 625
626 Bioastronautic_ DataBook<br />
OPTIC NERVE<br />
R RECTUS<br />
'-._-_%""_---_- . _ f., PULL EY<br />
SiL_SUPERIOR OBLIQUE<br />
E A f v I(:_._.._ CIL IA RY BODY<br />
OPTIC DISC _ __ 1_'_"_ /IRIS<br />
(Blind spot in the \ _'_L(_I_"_\ _ _ --CORNEA<br />
FOVEA _,_'_'_,4._) 1 I-j<br />
LATERAL RECTUSf _ I _,_ "rio _ /<br />
ARTERY-"- _,,_
Refractive index<br />
Vision<br />
Table 13-7<br />
Optical Constants for the Human Eye<br />
Constant Eye Area or Measurement<br />
Radius of curvature, mm<br />
Distance from cornea, mm<br />
Focal distance, rnm<br />
Position of cardinal points<br />
measured from corneal<br />
surface, mm<br />
Cornea<br />
Aqueous humor<br />
Lens capsule<br />
Outer cortex, lens<br />
Anterior cortex, lens<br />
Posterior cortex, lens<br />
Center, lens<br />
Calculated total index<br />
Vitreous body<br />
Cornea<br />
Anterior surface, lens<br />
Posterior surface, lens<br />
Posterior surface, cornea<br />
Anterior surface, lens<br />
Posterior surface, lens<br />
Retina<br />
Anterior focal length<br />
Posterior focal length<br />
1. Focus<br />
2. Focus<br />
1. Principal point<br />
2. Principal point<br />
1. Nodal pbint<br />
2. Nodal point<br />
1.37<br />
1.33<br />
1.38*<br />
1.41<br />
1.41<br />
1.33<br />
7.7<br />
9.2 - 12.2<br />
5.4- 7.1<br />
1.2<br />
3.5<br />
7.6<br />
24.8<br />
17.1<br />
[14.2] **<br />
22.8<br />
[18.9]<br />
--15.7<br />
[--12.4]<br />
24.4<br />
[21.01<br />
1.5<br />
[1.8]<br />
1.9<br />
[2.1]<br />
7.3<br />
[6.5]<br />
7.6<br />
[6.8}<br />
Optic disk 2-5<br />
Diameter, mm Macula 1-3<br />
Fovea 1.5<br />
Depth, mm Anterior chamber 2.7 - 4.2<br />
*Cortex of lens and its capsule.<br />
**Values in brackets refer to state of maximum accommodation.<br />
627
628 Bioastronautics Data Book<br />
I<br />
-C><br />
LIGHT ENTERING THROUGH PUPIL<br />
Figure 13-7. Simplified diagram of retina.<br />
(White, 1964)<br />
SCLERA<br />
CHOROID<br />
RODS<br />
AND<br />
CONES<br />
SYNAPTIC<br />
LAY ER<br />
BIPOLAR<br />
CELLS<br />
SYNAPTIC<br />
LAY ER<br />
GANGLION<br />
CELLS<br />
NERVE<br />
LAYER<br />
The distribution of rods and cones over the retina is by no means<br />
uniform. The cones are most numerous at the center of the visual field, and<br />
are most densely packed in the region just at the fixational center. In this<br />
small central region, whose diameter is about 0.5 mm or l°40 , of arc, there<br />
are no rods at all. This is the region of best visual acuity and best color<br />
vision. The rods are most dense in a band lying about 20 ° from the<br />
fixational center, and it is for this reason that night vision (at levels when<br />
the cones are inoperative) is best for averted vision. The distribution of rods<br />
and cones is shown in figure 13-8. Note that there is a hiatus in a region of<br />
about 5 ° diameter centered at about 15 ° in the nasal retina; this is the<br />
"blind spot", where the optic nerve fibers leave the retina.
E<br />
C_<br />
z<br />
200<br />
_50 .....<br />
100<br />
I<br />
// o<br />
o //<br />
so<br />
/o<br />
os<br />
/ o<br />
o /<br />
100 80 60 40 20<br />
Vision 629<br />
ol<br />
t<br />
o_<br />
I<br />
_ t<br />
li<br />
I<br />
I<br />
!<br />
I<br />
I<br />
!<br />
!<br />
7<br />
I<br />
i • CONES'<br />
\ ' !<br />
°'o,_<br />
i \, • _o<br />
i N,<br />
, I<br />
20 40 60 80<br />
NASAL RETINA (TEMPORAL FIELD) FOVEA TEMPORAL RETINA (NASAL FIELOt<br />
ANGULAR ECCENTRICITY- degrees<br />
Figure 13-8. Typical distribution of rods and cones. (_sterberg_ 1935;<br />
used by permission of Ejnar Munksgaard, publisher)<br />
Rods and cones differ in their response to fight of different wavelengths, as well<br />
as in their overall sensitivities. Figure 13-9 shows the spectral response curves for<br />
each. It will be noted that the sensitivity maximum for rods lies at 505 nm, while<br />
that for cones is at 555 nm. For this reason, colors of long wavelength become<br />
rapidly darker in appearance as the luminance is decreased.<br />
The distribution of rods and cones in the retina is such that the extent of the<br />
visual field for a single eye is as shown in figure 13-10(a). The foveal fixation point<br />
lies at the center of the figure. The absolute limits of the visual field are bounded by<br />
the black portion of the polar plot, while the limits for the appreciation of various<br />
colors are shown by the indicated contours. The chromatic contours are subject to<br />
fluctuation with changes in luminance and size of the test patch, while the outer<br />
limit is stable and set by anatomical features such as the brow, nose, and cheek.<br />
When both eyes are open, the field of view is increased, as shown in figure 13-10(b)<br />
and there is a considerable region over which both eyes are operative, that is, there<br />
is binocular vision. The cenlral white area is the field of stereoscopic vision. The<br />
cross-hatched region in the figure is seen only by one eye, and the blackened area is<br />
not seen. Binocular vision is an important factor in good depth discrimination, as<br />
well as having other advantages. The visual field represented is for a stationary eye<br />
or pair of eyes. Movement of the head and eyes and of the whole body will, of<br />
course, extend the limits of the visual field. On the other hand, the use of optical<br />
instruments almost always restricts the field. For certain space applications where<br />
whole-body movement may be restricted, it is instructive to note the extent of the<br />
binocular visual field under various conditions of restraint, as is shown in<br />
table 13-8, taken from the data of Hall and Greenbaum (1950).
630 Bioastronautics Data Book<br />
/ _ ROD VISION<br />
/ \<br />
/ %<br />
>.<br />
-<br />
0.8 / %<br />
1.0 tff t/- "%_ /<br />
z_ 0.6 %%<br />
LU<br />
03<br />
UJ<br />
_><br />
I---<br />
_, 0.4<br />
0<br />
_ 0.2<br />
0 i I 1%<br />
400 500 600 700<br />
VIOLET BLUE GREEN YELLOW REO<br />
WAVELENGTH (nm)<br />
Figure 13-9. Spectral response of rods and cones, with relative amount of radiant energy<br />
for vision at absolute threshold shown as a function of wavelength of light. (Hecht<br />
& Williams, 1922)<br />
Detailed description of the structure of the visual pathways to the brain,<br />
and the muscles responsible for eye movements is beyond the scope of this<br />
chapter. Reference should be made to any good contemporary texts in<br />
physiology and anatomy, or to the general references cited (e.g., Davson,<br />
1962).<br />
The size of the pupil of the eye is of concern, especially in the design<br />
of optic',d instruments wherein it may be the limiting aperture of the<br />
device. Under conditions of steady illumination, pupillary diameter depends<br />
upon the prevailing luminance level, as is indicated in figure 13-11. The<br />
dynamics of pupillary change are indicated by figure 13-12. The left part of<br />
the figure shows the contraction of a dark-adapted pupil with 8ram<br />
diameter when exposed to bright light, and indicates that the pupil has<br />
stabilized at about 3 mm after 4-5 seconds. The right portion of the figure<br />
shows that dilation upon going into darkness is a slower process, and that<br />
even after 5 minutes the pupil has not reached its fully dark-adapted<br />
diameter. It should be noted that the change in diameter is responsible only<br />
for about a seven-fold change in the amount of light entering the eye, and<br />
hence plays only a miniscule role in the whole process of light and dark<br />
adaptation.
Vision 631<br />
105 ° 900 75 °<br />
1 120° 600<br />
150o 300<br />
165 50<br />
180 °<br />
195o 345o<br />
210o 3300<br />
2250 315°<br />
Blue<br />
o 300 ° Yellow ...=....<br />
2,o R_ -'-7";<br />
255 2700 o<br />
(a)<br />
oct<br />
(b)<br />
Figure 13-10. Human field of vimon. (a) Field of view from right eye.<br />
(b) Binocular field of vision. (Boring ¢t aL, 1948)<br />
0 o
632 Bioastronautics Data Book<br />
o_<br />
I- co<br />
E<br />
_D<br />
0<br />
"0<br />
"0<br />
u_<br />
c-<br />
O<br />
n,-<br />
t-<br />
o o o.'_, o<br />
e-- _ (,D _ C,<br />
% % %% %<br />
_ E<br />
"0 X x --<br />
,t-<br />
%<br />
0 0 0<br />
0 0 0<br />
co 00 _<br />
o _<br />
LD Ln _1<br />
X<br />
e_<br />
<<br />
0 0 0 0<br />
O_ r_ 03 CD<br />
C ,- 0<br />
"o=__ _ '_'__='-<br />
0<br />
o-<br />
E<br />
x<br />
LU
48_-858 0 - _3 - 41<br />
Vision 633
634 Bioastronautics Data Book<br />
.LARG/ST DI,_ 1<br />
------'P_--,,,.E_TER OB- I<br />
1 "I_'-,...._.._ERVED<br />
_AVE_ _ | ?".,,,,L<br />
,000001 .00001 .0001<br />
LUJ_cT$ r<br />
\<br />
%%%%<br />
N N<br />
_ 0<br />
_ g<br />
g g<br />
u.l _<br />
%%<br />
%<br />
i.u _1<br />
"_ %Xs,<br />
%.<br />
%%<br />
.001 .01 .1 10 000<br />
LUMINANCE OF FIELD - mL<br />
Figure 13-11. Pupil diameter as a function of luminance of adapting field. (Kauf-<br />
man, 1966; I.E.S. lighting handbook. New York: nluminating Engineering Society, 1966)<br />
7<br />
_z 6<br />
w<br />
I-- 5<br />
<<br />
g 4<br />
CONTR ON<br />
ACTll<br />
0 1 2 3 4 5 60<br />
DARK TO LIGHT<br />
O 1 2 4 5 6 7 8 9<br />
TIME IN SECONDS<br />
15 30<br />
LIGHT TO DARK<br />
Figure 13-12. Pupillary response to light and darkness. (Reeves, 1918;<br />
copyright 1918 by the American Psychological Association)<br />
30O
The Stiles-Crawford Effect<br />
Vision 635<br />
A ray of light will be maximally effective if it reaches the retina via the<br />
center of the pupil. An identical ray which traverses a peripheral part of<br />
the aperture may, according to its eccentricity, need to be made several<br />
times more intense in order to produce the same result. This phenomenon<br />
is called the Stiles-Crawford effect, after its discoverers, h is primarily of<br />
concern for photopic vision, and has been shown experimentally to be<br />
related to the structure and optical properties of the cones.<br />
The quantitative aspect of the Stiles-Crawford effect is shown in<br />
figure 13-13. It should be noted that the maximum of the curve is displaced<br />
nearly a millimeter toward the nasal side, and that the effect therefore is<br />
neither strictly symmetrical, nor exactly concentric with the pupil. The<br />
magnitude of the effect is dependent upon the wavelength of light, with<br />
more diminution in intensity for blue and red than for the center of the<br />
spectrum. There are also changes in hue and saturation of colors as the<br />
entrant ray is moved across the pupil. In general, most peripheral rays<br />
undergo a change toward some longer wavelength, although greens in a<br />
narrow band around 520 nm appear to shift toward blue (Stiles, 1939).<br />
Z<br />
tdd<br />
><br />
W<br />
U.<br />
<<br />
.=1<br />
1.1<br />
1.0<br />
0.9<br />
0.8<br />
03<br />
0.6<br />
0.5<br />
0.4<br />
0.3<br />
0.2<br />
0.1<br />
0<br />
5<br />
-- _FT LOWER<br />
N<br />
I L<br />
-<br />
-<br />
-<br />
-<br />
_<br />
-<br />
- -<br />
- L 1 -<br />
TEMPORAL BOTH<br />
- _ l 1 I _<br />
4 3 2 1 0 1 2 3 4<br />
POINT OF ENTRY (ram _rom Center)<br />
Figure 13-13. Stiles-Crawford effect. Light falling on different parts of pupil is not<br />
equally effective in producing sensory end result, even though light reaches same point<br />
on retina. Data are those for B. H. Crawford's eye. (Stiles & Crawford, 1933; reprinted<br />
by permission of the Controller of Her Britannic Majesty's Stationery Office)<br />
_<br />
.<br />
I<br />
_<br />
_<br />
_<br />
_<br />
L<br />
_<br />
_
636 Bioastronautics Data Book<br />
There are two practical cases in which the Stiles-Crawford effect is of<br />
concern. The first of these relates to the design of optical instruments, where it<br />
is evident that distribution of the light flux at the eyepiece should be such that<br />
neither instrument nor operator performance is penalized. An example may be<br />
found in the ease of certain binoculars and monoculars which use reflecting<br />
optics. In these instruments light emerges from the eyepiece as a hollow<br />
cylindrical beam, so that the most efficient central part of the pupil is not used,<br />
and the annular rays may suffer both loss of luminance and distortion of color.<br />
The second consequence of the effect is that it is critically necessary, in the<br />
determination of retinal illumination, to allow for the fact that simple<br />
enlargement of either the natural or an artifical pupil will not produce as large an<br />
increase in visual effect as would be expected on the basis of the increase in<br />
pupil area. The troland unit of retinal illumination thus has limited utility, for it<br />
matters to the retina from what part of the pupil it receives its light. An<br />
approximate correction for the Stiles-Crawford effect has been attempted<br />
(LeGrand, 1957), but even so the troland remains an imprecise unit.<br />
Chromatic Aberration<br />
The eye is unable to bring rays of all wavelengths to focus at the same<br />
retinal plane simultaneously. As in other simple optical systems, light of<br />
short wavelengths being more strongly refracted by the lens, is focused at a<br />
plane in front of that for the longer, less deviated ones. The eye tends to<br />
maintain focus for the wavelengths near the photopic sensitivity maximum,<br />
so that, in the white light case, the red and blue components of an image<br />
will lie behind and in front of the plane of best focus, respectively. This<br />
effect is quite large, and chromatic differences of focus over the spectrum<br />
amount to approximately three diopters.<br />
Measurements of chromatic aberration in the human eye have been made by<br />
several investigators, and the results are in good agreement (Ivanoff, 1949;<br />
Hartridge, 1950; Wald & Griffin, 1947). The data of figure 13-14 are typical.<br />
The consequences of chromatic aberration are many, and although much of<br />
ordinary visual activity is affected little or not at all, there are some important<br />
implications for engineering design. Normal visual acuity is best for conditions<br />
where the color of the illuminant for the task is confined to the spectral region<br />
near the peak of the luminosity curve, at least at low to moderate levels of<br />
illumination (Schober, 1937; Schober & Whittman, 1938). The effect may be<br />
bothersome in certain optical instruments using polychromatic fields, although<br />
this may be corrected by incorporation of a specially designed lens (Wright,<br />
1947). It is often impossible to discriminate between white and yellow stimuli of<br />
small angular extent, since the eye tends to focus on the yellow-green<br />
component of the white and allows the blue and red to blur out so that they are<br />
ineffective in the discrimination (Wilmer, 1946). Finally, it is clear that small<br />
colored stimuli, such as signal lights, will be perceived to be at different distances<br />
according to their spectral composition and that, further instances may occur<br />
when critical detail of displays shows serious chromatic disparities, leading to<br />
operator error.
tw<br />
tlJ<br />
+1<br />
_" 0<br />
el.<br />
O<br />
Z<br />
o<br />
v- -1<br />
({<br />
n"<br />
rr<br />
UJ<br />
Q3<br />
<<br />
/<br />
< -2<br />
X<br />
<<br />
-3<br />
Vision 637<br />
I I I I I i I I i<br />
400 500 600 700<br />
WAVELENGTH (m _)<br />
Figure 13-14. Axial chromatic aberration of human eye. Averages of measurements on 14<br />
observers. Ordinates show lens correction in diopters needed to give each eye same refractive<br />
power it possesses when accommodated for distance vision at578 m# {Wald &<br />
Griffin, 1947)<br />
Visual Performance<br />
Normal visual performance involves a number of interdependent discrimina-<br />
tions which are made in response to factors in the visual environment and<br />
mediated by the structure of the visual system. Principal among these<br />
discriminations are the appreciation of detail (visual acuity), contrast, color,<br />
form, distance, movement and certain temporal aspects of the object of regard.<br />
The limiting capabilities of the human observer have been extensively<br />
investigated in all of these areas, usually in laboatory studies which isolate the<br />
function of interest. It must be recognized, therefore, that the data do not take<br />
into account the interactions between functions which are known to occur.<br />
Rather, they should he taken as indicative of the limiting case, modifiable for<br />
better or worse in accordance with other factors.<br />
Visual Acuity<br />
There are many definitions of the term "visual acuity;" all, however,<br />
incorporate the notion of the resolution of detail. A variety of test patterns has<br />
been used to measure acuity, from simple single dots to twin stars, gratings,<br />
broken rings, checkerboards, and letters. It is unfortunate that no general<br />
agreement as to the choice of a test has been reached, and that results from the<br />
different patterns are often at odds. The Snellen Letter Test is probably the<br />
most familiar, and is widely used in clinical practice, despite the fact that it is a
638 Bioastronautics Data Book<br />
test of letter recognition rather than of retinal resolution. The most satisfactory<br />
expression for visual acuity is in terms of the angular subtense of the critical<br />
detail which can just be discriminated. (In the Snellen notation, the width of the<br />
letters of the 20/20 line is such that they subtend one minute of arc at 20 feet.)<br />
A well-entrenched popular misconception is that 20/20 ,or 1', represents<br />
"perfect" vision. Acuity depends upon the character of the test, and resolutions<br />
of a few seconds of arc are not uncommon. Some results from use of various test<br />
patterns are shown in figure 13-15.<br />
,0[ i -<br />
I.o_<br />
\<br />
\<br />
\ ....... VERNIE. T ST<br />
\ ............. \\j" _DtSP,ACEMEN'r ANGLE1<br />
MINIMUM<br />
PERCEPTIBLE<br />
ACUtTY ACUITY<br />
..... J _ VISUAL ANGLES<br />
001 01 o I I Io ]oo looo ]oooo<br />
BACKGROUND LUMINANCE - mL<br />
Figure 13-15. Approximate relationship between various measures of visual acuity and<br />
background luminance. Uppermost curve is obtained using a broken ring (Landolt C) test<br />
object, and data are values of angular gap size discriminable over range of luminances tested.<br />
Vernier acuity task: discrimination of discontinuity in otherwise smooth edge, or of small<br />
linear displacement. Stereoscopic acuity angle: difference in subtense between two test<br />
objects of identical size whose distances from eye are just discriminably different. Minimum<br />
perceptible acuity: smallest detectable spot, with contrast limited to -1.0. (Adapted from<br />
White, 1964)<br />
There are some important variables which affect visual acuity, and which<br />
must be taken into account in operational planning terms:<br />
Luminance. The level of adapt'ion of the eye has a profound effect upon<br />
visual acuity, as might be expected. This dependency is shown for two different<br />
test patterns in figure 13-16.<br />
Position In The Field. At photopie levels, acuity is best at the fovea, and<br />
drops off as the retinal periphery is approached, owing to receptor population<br />
differences. Nocturnal acuity is quite poor, with essential blindness at the fovea
Vision 639<br />
andbestresolutionappearing in theperipherywhererodpackingisdensest. The<br />
variationofvisualacuityisindicated infigure13-17.<br />
>-<br />
2.5,<br />
LANDOLT C, SUBJECT ELS _l_-_-_r-<br />
2.0 -- GRATING, SUBJECT AMC<br />
D 1.5--<br />
O<br />
<<br />
J<br />
<<br />
><br />
1.0--<br />
GRATING SUBJECT ELS / °'e<br />
/C-<br />
x x<br />
o.5- S .f I I I I I L<br />
0.0 o oc_O<br />
-3 -2 -1 0 1 2 3 4 5 6<br />
LOG RETINAL ILLUMINANCE -trolands<br />
Figure 13-16. Variation of acuity with retinal iUuminance for resolution of a grating<br />
and for recognition of orientation of a Landolt C test object. (Schlaer, 1937)<br />
<<br />
J<br />
J<br />
Z<br />
<<br />
_J<br />
<<br />
t-<br />
no.<br />
w<br />
tr<br />
v<br />
0,2<br />
00<br />
0.1<br />
6x_03<br />
_/ • .3X I0" cd/m<br />
0021 [ l L I I 210<br />
0 30' 1 ° 2 ° 5 ° 10 ° o<br />
DISTANCE FROM THE FOVEA<br />
Figure 13-17. Change in visual acuity (reciprocal of Landolt C gap size) as a function of<br />
position on retina for 5 luminances. Eccentricity shown in degrees from fovcal center.<br />
(Mandelbaum & Sloan, 1947)<br />
40 °
640 Bioastronautics Data Book<br />
Duration. When the pattern is exposed for only a short time, measured<br />
acuity diminishes in accordance with the function shown in figure 13-18. It<br />
is evident from this figure that the duration effect is related to the<br />
luminance of the test.<br />
E<br />
n<br />
r7<br />
W<br />
IJJ<br />
ts<br />
240<br />
2OO<br />
160<br />
120<br />
80<br />
40<br />
0<br />
10.2 FT-L<br />
,_.8 FT-L<br />
5.1 FT-L<br />
:3.4 FT-L<br />
1.7 FT-L<br />
_ FT-L<br />
1' 2' 3" 4'<br />
VISUAL ANGLE (min of arc)<br />
Figure 13-18. Visual acuity as a function of time of exposure for several luminance<br />
levels. At any given level less time is needed to see larger objects, and, for any given<br />
object size, less exposure time is required at higher luminances. (Ferree & Rand, 1922)<br />
Color. For tasks illuminated by monochromatic or narrow-band sources,<br />
there is a small but measurable difference in acuity as a function of the<br />
dominant wavelength used, provided that all colors have been equated for<br />
luminance. In comparison with acuity measured in white light, there is a<br />
nominal improvement when sodium vapor lamps are used, while with blue<br />
or violet light acuity is poor (Moon, 1961). These statements apply only to<br />
photopic vision.<br />
Contrast. Visual acuity decreases as the contrast between pattern and<br />
background is diminished. The form of this relationship depends upon the<br />
adapting luminance, as was shown by Connor and Ganoung (1935) and by<br />
Cobb and Moss (1928), whose results are combined in figure 13-19.<br />
Movement. Detail vision for moving objects is called dynamic visual<br />
acuity. Investigations of this problem have been reported by Miller (1958),<br />
whose results are summarized in figure 13-20. These data must not be used<br />
uncritically, for it was shown by Ludvigh and Miller (1958) that wide<br />
differences exist between observers, and that these are not correlated with<br />
their measured static visual acuities.<br />
I
Vision 641<br />
1.8 I .............. 1 8<br />
/<br />
1 4 [ _ 1.4<br />
o.,_<br />
O'_j<br />
__<br />
j _'_ _ _<br />
_ __'Jl<br />
_ __-__ _o2<br />
o ___- _---------,,__ 1 I o<br />
00001 0.00t 0.01 0.1 10 100<br />
LUMINANCE OF TASK BACKGROUND (ft-LI<br />
Figure 13-19. Visual acuity as a function of background luminance for a number of<br />
contrast levels, here expressed as percentages. (Data on left from Conner & Ganoung, 1935;<br />
on right from Cobb & Moss, 1948)<br />
¢<br />
"_ 12<br />
t<br />
.04 ft-c<br />
16 /_20 ft-c<br />
°_ J r<br />
U ......-----_ "<br />
J<br />
2O 4O 6O BO I00 120 140<br />
ANGULAR VELOCITY - deg/sec<br />
Figure 13-20. Dynamic visual acuity. Note decrease as velocity increases,<br />
for 6 levels of test chart illumination. (Miller, 1958)<br />
e
642 Bioastronautics Data Book<br />
Contrast Discrimination<br />
Vision requires that there be differentiation of the luminances (or<br />
colors) in the field of view. Without these gradients of energy across the<br />
retinal image, there can be no information received from the environment<br />
by visual means, at least in the ordinary sense. The luminance gradients<br />
which we use are distributed both in space and in time, and man is<br />
sensitive to both spatial and temporal differences. Simple contrast<br />
discrimination is conventionally discussed in terms of the static case, with<br />
the phenomena of movement, intermittency and color being treated as<br />
separate entities. In a sense, nearly all of visual activity (visual acuity<br />
included) may be regarded as contrast discrimination. Here, however, we<br />
will restrict its meaning to refer to the simplest case of the appreciation of<br />
a luminance difference-generally in white light.<br />
Contrast is defined as the ratio of a luminance change ascribable to the<br />
presence of an object, or target, to the luminance of the background. If the<br />
luminances of target and background are bt and bo, respectively, then the<br />
luminance contrast, C, is:<br />
C --<br />
Bt - Bo AB<br />
Bo Bo<br />
It is evident that the contrast of targets brighter than their backgrounds can<br />
vary between zero and infinity, while those darker than their backgrounds<br />
can vary from zero to minus one. In many cases it has been found (e.g.,<br />
Blackwell, 1946) that targets of equivalent numerical contrast are equally<br />
visible ircespective of sign. This generalization has recently been questioned<br />
by Patel and Jones (1968) who find higher thresholds for positive thap for<br />
negative targets; the effect becoming significant at low luminance levels.<br />
The most important variables affecting contrast discrimination are<br />
luminance of the background, size and duration of the target, and the<br />
portion of the visual field used. Color is relatively unimportant in simple<br />
target detection if a luminance gradient exists (MacAdam, 1949), although<br />
color is important in many other visual tasks.<br />
Background Luminance And Target Size. These two variables have been<br />
investigated quite thoroughly for the case of simple circular targets on<br />
uniform backgrounds (e4g. , Blackwell, 1946; Blackwell & Taylor, 1970).<br />
Their influence on contrast discrimination is seen in figures 13-21 and 13-22,<br />
taken from the earlier study. These data have been used extensively in the<br />
construction of nomograms for predicting the visibility range of objects<br />
under a variety of viewing conditions (Middleton, 1952; Duntley, 1960).<br />
Duration. For very brief exposure times, contrast discrimination depends<br />
on the product of the luminous flux and the duration of the flash, that is,
Vision 643<br />
ABx t =aconstant atthreshold. Thisis Bloch'slaw,andit holdsfor values<br />
of t up to a criticalduration,tc, whichvariesfrom0.002to0.1second,<br />
dependinguponconditions(Baumgardt & Segal,1946)althoughthelatter<br />
figureis moretypicalunderconditionsof practicalinterest.At exposure<br />
timeslongerthana fewtenthsof a second, thresholdis independent of<br />
durationand_B=aconstant.Thecharacter of thetransitionfromAB x t =<br />
C andAB = C issometimes abrupt,sometimes gradual,depending uponthe<br />
conditions. (For details,see,e.g.,Kishto,1968.)Datarelatingdurationto<br />
contrastdiscrimination havebeenpublishedby GrahamandKemp(1938),<br />
by Blackwelland McCready(1958),andbyBlackwelland'Faylor (1970).<br />
Datafromthefirststudyareshownin figure13-23.<br />
10 000<br />
1000<br />
.001<br />
•00001<br />
7.0<br />
.0001 .001<br />
6.8 6.4<br />
• 01 .I 1 2 S 10 I00 1gOB<br />
BACKGROUND LUMINANCE - mL<br />
S.B 5.1 4.4 3.6 2.B 2.1<br />
PUPIL DIAMETER- mm<br />
Figure 13-21. Contrast thresholds as a function of adaptation luminance<br />
for 7 sizes of uniform circular targets. (Blackwell, 1946)<br />
Position In The Visual Field. In the light-adapted eye contrast<br />
discrimination is best at the fovea, where the density of cone receptors is<br />
highest, and deteriorates as the target moves out toward the periphery of<br />
the visual field. Under dark-adapted conditions, foveal vision is inoperative<br />
and optimum discrimination is achieved by use of averted vision, usually at<br />
about 10° away from the visual axis. Some data for the daytime case for<br />
targets in the near periphery are shown in figure 13-24, from a study by<br />
Taylor (1961).
644 Bioastronautics Data Book<br />
-o5<br />
3O<br />
10<br />
0<br />
-10 I l<br />
1ooo 1_ 1o i lO -1<br />
10-2 IO -3 1o -4 1o-1<br />
--3O -25 -20 -15 --10 _06 0 06 10 15, 20 25 30 -IK qO<br />
LOG LIMINAL CONTRAST<br />
Figure13-22. Interpolations made from curves of figure l3-21, plotted to show<br />
relation_ip of target size to threshold contrast. Individual curves refer to adaptation<br />
luminances over 1000 ft-L-lO-6ft-L range. (Blackwell, 1946)<br />
en<br />
_3<br />
t,o<br />
-1,0<br />
O -2.0<br />
-3.0<br />
-4.0<br />
iii:<br />
:2:3_ /J Z t _ --<br />
_L__ I t<br />
-3 -2 - 1<br />
LOG t {sec)<br />
Figure 13-23. Relation betweenAB and t. Individual curves are labeled with values of<br />
log B, adapting luminance, in m-L. Horizontal tines represent equation Log B.t = constant;<br />
the inclined lines, AB = constanL Critical duration, to, is shown to decrease with increase in<br />
adapting luminance. (Graham & Kemp, 1938)
II<br />
fl_<br />
>-<br />
I0<br />
<<br />
nrlz<br />
o<br />
o<br />
a<br />
-I<br />
o<br />
"r"<br />
03<br />
U.l<br />
n"<br />
"I"<br />
I--<br />
.oi<br />
Vision 645<br />
!_ .--.-'o'_ 1.50"<br />
1.2o'<br />
.003 1 I I I t I I I I 1 [ 1<br />
0 2 4 6 8 10 12<br />
ECCENTRICITY<br />
(DEGREES FROM FIXATIONAL CENTER)<br />
Figure 13-24. Threshold contrast as a function of retinal p_ition and target size for<br />
binocular photopic vision. Adaptation level, 75 ft-L (257 cd/m ); target duration, 0.33 see.<br />
Curves labeled to indicate angular diameter of uniform circular stimuli;4 observers, for<br />
which plotted average values represent0.50 probability of detection in "yes-no"<br />
experiment; each data point based upon 2400 observations. (Taylor 1961)<br />
Depth and Distance Discrimination<br />
Tile estimation of depth and distance in ordinary terrestrial seeing is<br />
accomplished by use of a number of cues which are available to the<br />
experienced observer. Some of these cues are provided by the nature of the<br />
scene of interest, while others inhere in the observer himself. Some of the<br />
important external and internal cues are indicated in table 13-9. But a<br />
number of these cues may be absent in the space environment, and it will<br />
be necessary to evaluate any visual task which requires critical judgment of<br />
depth or distance in terms of the available information.<br />
In cases where only internal cues to distance are available, that is to say<br />
when the objects of interest are of unknown size and shape, and none of<br />
the external aids such as aerial perspective or interposition is of help, it is<br />
evident that the observer must depend upon his stereoscopic acuity,<br />
accommodation and convergence, and, where possible, movement parallax.<br />
Accommodation is only an effective cue to distances at ranges of a meter<br />
or less, and even here it is inaccurate. Convergence alone is a somewhat
646 Bioastronautics DataBook<br />
more useful cue, but is limited to a range out to about 20 meters. Stereoscopic<br />
acuity, however, provides a powerful cue to distance. Experimentally<br />
determined values of stereoscopic acuity are in the range from<br />
about 10" to 2" are. An observer with a stereoscopic acuity of 5", for example,<br />
can discriminate that an object at 2600 meters is closer than one at infinity<br />
(LeGrand, 1967).<br />
Linear perspective<br />
Apparent size<br />
Motion parallax<br />
I nterposition<br />
Aerial perspective<br />
Shading<br />
Apparent intensity<br />
Accommodation<br />
Convergence<br />
Binocular disparity<br />
Table 13-9<br />
External and Internal Cues to Depth and Distance<br />
External Cues<br />
Apparent convergence of parallel lines and related effects<br />
A strong cue to distance of objects of known size, and texture<br />
Relative angular motion as either head or objects move<br />
Nearer objects eclipse more distant ones<br />
Contrast and color lossdue to aerosols; uselessin free space<br />
A cue to three
Vision 647<br />
displays, differentiation between steady and flashing lights, and the time-varying<br />
visual signals received from a sunlit, tumbling space object seen against a black<br />
background. Experimental data regarding temporal discriminations are<br />
exceedingly voluminous, and the reader should consult the general references<br />
noted at the end of this chapter for details. Only a small sample of these results<br />
will be given here.<br />
As the rate of intermittency of a flashing light is gradually increased, there is<br />
a rather sharply defined point at which the light begins to appear as a steady<br />
one. The rate at which this transformation occurs depends upon a host of<br />
conditions, but two of the most important are the luminance of the background<br />
and the position in the visual field. (Size, of course, is an important variable, but<br />
it may be assumed that intermittent stimuli in the space environment will be<br />
angularly small.) The transition point between steady and intermittent<br />
appearance is called the "critical frequency of fusion", and is often abbreviated<br />
"CFF." In figure 13-25 the value of the CFF is plotted as a function of<br />
background luminance, for a 2° circular test target located at the fovea and<br />
at 5° and 15 ° above the fovea. Had the target subtended 0.3 ° ,the CFF values<br />
would have been about 5 Hz lower for the foveal case (Hecht and Verrijp,<br />
1933).<br />
5O<br />
4O<br />
3O<br />
2O<br />
10<br />
""AP'"<br />
/<br />
/<br />
_/O . i'^<br />
/<br />
./<br />
Oo<br />
f<br />
_" so<br />
I" "4k.<br />
¢1<br />
15 ° --<br />
-4 -3 -2 -1 0 1 2 3 4<br />
LOG RETINAL ILLUMINANCE (trolands)<br />
Figure 13-25. Relation between critical frequency and log retinal illuminance for white light<br />
for three different retinal locations: at the fovea and 5 and 15 ° above the fovea. (Heeht and<br />
Verrijp. Reprinted by permission of The Rockefeller Institute Press from The Journal of<br />
General Physiology, 1933, 17, 251-265; Fig. 2, p. 257)<br />
There are other considerations regarding intermittent illumination. Spacecraft<br />
internal illumination, for example, should not exhibit perceptible flicker, owing to<br />
possible performance decrements suffered by the crew. Temporally-coded display<br />
systems, likewise, should be designed so that the crewman's temporal resolution<br />
capabilities are never exceeded.
648 Bioastronautics Data Book<br />
Movement Discrimination<br />
Several sorts of tasks are subsumed under this category, and several modes of<br />
movement must be considered. The more common cases of interest may be<br />
listed as follows:<br />
1. Movement across the visual field in the fronto-parallel plane, with or<br />
without stationary reference objects in the field of view.<br />
2. Movement in depth, toward and away from the observer and with or<br />
without reference objects.<br />
3. A combination of the above.<br />
4. A change in the rate or direction of movement.<br />
5. The discrimination of rotational movement, usually centered on the line<br />
of sight, but not always.<br />
In space operations, movement discrimination is especially critical in instrument<br />
reading, rendezvous and docking maneuvers, and in spacecraft landing<br />
procedures. It is abetted by the presence of reference objects in the field<br />
(especially familiar ones), high luminance levels, and optimum rates of<br />
movement.<br />
The variables influencing movement discrimination of any sort are identical<br />
with those affecting other visual functions (luminance, size, contrast, and retinal<br />
position), but with the additional factors of velocity and rate of change of<br />
velocity as complications. The recent book by Spigal (1965) should be consulted<br />
for detailed treatment of the subject, as should the general references.<br />
Some specimen data are shown in figures 13-26 to 13-28.<br />
Color Discrimination<br />
Color vision is mediated by the retinal cones, and is therefore best at<br />
photopic luminance levels and in those parts of the visual field where the cones<br />
are most densely packed. Color discrimination may be general, as in<br />
differentiating between different colors, or it may be specific, as in the<br />
appreciation of some one color characteristic such as hue, saturation, or<br />
luminance. When color is used in coding and in displays, only general<br />
discrimination is usually required (wiring, signals, pipelines, warning and<br />
clearance lights, etc.). In space tasks involving naturally ocurring colors,<br />
however, it may be necessary to make subtle discriminations of chromatic<br />
differences (lunar and planetary exploration, spacecraft landing, vehicular<br />
maintenance, and observations of the terrestrial surface from orbit).<br />
Hue, the psychophysical counterpart of the physical dominant wavelength of<br />
a stimulus, can be discriminated very well under conditions of adequate<br />
luminance (10 ft-L or more) provided that the angular size is large enough. The<br />
data of figure 13-29 refer to the case of a 2° field and photopic luminance<br />
(Wright and Pitt, 1934). About 150 hues can be discriminated under these<br />
conditions; with larger fields, the number of hues would be larger (Wright,<br />
1947).
3<br />
9<br />
o<br />
uJ<br />
t-<br />
u.<br />
u.<br />
1.0<br />
Vision 649<br />
.0' 0.1 IO lOO<br />
ANGULAR SPEED Iw) - de_$ec<br />
Figure 13-26. Sensitivity to change in velocity of a moving (Ar0) as a function of angular<br />
speed (¢.0). Formula for straight line with unit slope: LOgl0AOJ :-1.00+LOgl0CO.<br />
(Brown, R. H., 1960; copyright 1960 by The American Association for the Advancement of<br />
Science)<br />
.001 .01 0 I 1.0<br />
LUM_NM4CE - mL<br />
Figure 13-27. SensiUvity to movement in depth, expressed in terms of percent distance<br />
traveled by a 3.5 in. luminous disc at mean distance of 25 ft against dark background, as a<br />
function of luminance of disc. Both monocular and binocular curves refer to 75% level of<br />
movement detection. Target was a lamp 3.5 in. in diameter, moved back and forth on a tract<br />
from an initial distance of 25 feet. At the initial distance, the lamp subtended 4,0 min. at the<br />
eyes. 2% change in distance represents a 2% change in visual angle, or about 0.8 rain. Target<br />
speeds ranged from 1.65 to 13.2 in./see producing initial changes in visual angle from<br />
about 0.25 to 2 rain of arc. (Baker & Steedman, 1961 )<br />
48"r-858 0 - 93 - 42<br />
i<br />
ii
650 Bioastronautics Data Book<br />
i<br />
_1<br />
0<br />
uJ<br />
"1-<br />
I--<br />
0<br />
I-.<br />
uJ<br />
_E<br />
I.-<br />
\<br />
5.(<br />
4.o \_'<br />
2.0<br />
1.0<br />
0.5<br />
i s T i i i i t<br />
L, , , , , ,,i,<br />
2 3 4 5 10 15<br />
RATE OF MOVEMENT - in/see<br />
Figure 13-28. Sensitivity to movement in depth as a function of rate of movement.<br />
Conditions as in figure 13-27, but target luminance was fixed at 1 ft-L while target speed<br />
was varied. Values on ordinate are times required to detect movement at probability 0.75.<br />
(Baker & Steedman, 1961)<br />
A<br />
6<br />
r'<br />
4<br />
2<br />
1<br />
0<br />
42O<br />
I<br />
...t_ _._ j<br />
440 460 480 500 520 540<br />
WAVE LENGTH (m J=)<br />
r<br />
J<br />
56o 58o<br />
t /<br />
600 620 640<br />
Figure 13-29. Hue discrimination. Shows the amount of change in wavelength (_X) needed<br />
to produce a noticeable change in hue for various parts of the visible spectrum.<br />
(Wright, 1947)<br />
f<br />
1<br />
/
Vision 651<br />
Saturation, the psychophysical .equivalent of spectral purity, refers to the<br />
degree to which a color of given hue differs from white. Pale pink, for example,<br />
is a red of low saturation. Discrimination of saturation is best at the center of<br />
the visible spectrum (570 nm), as seen in figure 13-30.<br />
-r<br />
2.5<br />
o<br />
re 2.0<br />
tJ.<br />
p.<br />
I-<br />
re<br />
0<br />
0<br />
-J<br />
1,0<br />
0.5<br />
450 500 550 6O0 65O 7(3O<br />
WAVELENGTH (nrn)<br />
Figure 13-30. Saturation discrimination. Values on ordinate represent amount of color<br />
added to white for color change to be discriminable, assuming equality of luminance for the<br />
two conditions. The expression F_/F), + Fw, where F)_ is light flux of wavelength and F w is<br />
flux of white illuminant, is called colorimetric purity. (Wright, 1947)<br />
In most practical cases one is interested in the discrimination of a<br />
combination of hue and saturation - a quantity known as chromaticity.<br />
Investigations of chromaticity discrimination by MacAdam (1942) have yielded<br />
data of the sort shown in figure 13-31, in which the ellipses indicate the fineness<br />
of this discrimination in various parts of the chromaticity diagram. (For a<br />
discussion of the chromaticity diagram, see Wright, 1947, or other general<br />
reference.)<br />
There are some special considerations which should be taken into account in<br />
the design, of systems and in the planning of missions if color discrimination is to<br />
be successful. Some of these have already been alluded to (chromatic aberration,<br />
luminance level); others should be noted.<br />
Small Subtense Color Vision. The ability to discriminate colors is drastically<br />
reduced in the case of angularly small targets. Under this condition, only<br />
three colors may be reliably differentiated: red, green, and another color<br />
which may be yellow, or white, or gray. For this reason, the coding of<br />
signal lights is restricted to three colors whenever they are to be seen at any<br />
appreciable distance.
652 Bioastronautics Data Book<br />
Y 90<br />
0<br />
0.1 0.2 0.3 0.4 0.5 0.6 0.7 0.8<br />
Figure 13-31. Ellipses representing]0 times S.D. of color matchesmade at constant<br />
luminance.Each egipse is basedon matches madewith variationrestrictedin direction in<br />
the diagram. These variations were taken in 5 to 9 directions, and 50 matches were made for<br />
each direction of variation, so that each ellipse is based on 250 to 450 color matches.<br />
(MacAdam, 1942)<br />
Peripheral Color Vision. Best color vision occurs at and near the center<br />
of the field. As stimuli are moved toward the periphery, discrimination<br />
becomes poor, and colors are not seen (although the loss of color occurs at<br />
different distances from the fovea). Some typical data are shown in<br />
figure 13-32, from the report of the Committee on Colorimetry (1953). This<br />
figure shows in a very general way the limits of color discrimination in the<br />
parafoveal retina for the colors shown. The use of larger or more luminous<br />
stimuli would cause expansion of these fields; perhaps to the outer limit<br />
shown for achromatic (white) luminance discrimination.<br />
Visual Search<br />
The visual acquisition of objects in the field of view when their location<br />
is unknown is called visual search. The important variables in the search<br />
process include size and structure of the field, characteristics of the target<br />
object, including its size and complexity, luminance level, contrast,<br />
uniqueness, and so on. Although a great deal of work has been done on the<br />
problem, there is no simple set of rules which may be used to formulate<br />
optimum search procedures.<br />
X<br />
;95
Vision 653<br />
O*<br />
f/.04 !_<br />
Figure 13-32. Visual fields for color in a right eye.<br />
(Committee on Colorimetry, 1953)<br />
From the standpoint of engineering design for space operations it may<br />
be assumed that the usual objective will be to assist the search process (as opposed<br />
to concealment and camouflage). Accordingly, it will be desirable to increase the<br />
probability of visual acquisition by careful attention to the factors which are<br />
known to assist in the search process. A number of such factors have been<br />
summarized by Taylor (1969), and a collection of papers edited by Morris and<br />
Home (1960) should be consulted for additional suggestions.<br />
Size Discrimination<br />
The size of an object is usually discriminated by the aid of such cues as<br />
known distance, comparison with other objects of known size, and such factors<br />
as perspective and familiarity. In space operations, however, these cues may be<br />
lacking, or conditions may be such as to deceive the observer. A very important<br />
phenomenon is that called irradiation. Simply put, two objects of identical size<br />
and at the same range will appear of the same size if they are illuminated<br />
equally. If one is very much more intensely lit, it will appear larger. The effect is<br />
especially great in the case of angularly small objects. Recent work by Haines<br />
(1967) should be consulted for the quantitative aspects of the irradiation<br />
phenomenon as it affects both size and shape discrimination.<br />
Form Discrimination<br />
The form of an object is of undoubted interest in all phases of space<br />
exploration, and especially so in the discrimination and description of<br />
planetary and lunar surface features as well as in the differentiation of
654 Bioastronautics DataBook<br />
orbitingobjectsandterrestrial formations.<br />
Themany variables which affect<br />
the form discrimination process are discussed in Wulfeck and Taylor (1957).<br />
Observer experience and training are important, and the task will depend<br />
upon the level of discrimination desired.<br />
Dark Adaptation<br />
Optimal visual discrimination under conditions of very low luminance can be<br />
nmdc only if tile visual system is adapted to the level of the prevailing photic<br />
environment, or even lower. If a fully light adapted eye is suddenly plunged into<br />
darkness, its sensitivity is initially very poor. With time, however, sensitivity.<br />
begins to increase as a result of photochemical regeneration, certain functional<br />
neural changes, and (to a much smaller degree) enlargement of the pupil of the<br />
eye. If the eye remains in total darkness for 30 to 60 minutes, the adaptation<br />
process will be nearly complete and the sensitivity of the cye in those parts of<br />
the retina where both rods and cones are present will have increased by a factor<br />
of 10 000 for white light.<br />
The course of dark adaptation is influenced by many factors, such as the<br />
intensity, duration, and color of the preadapting light, the size and area of the<br />
retinal area stimulated, and the nature of the visual stimulus used to test the<br />
effect. Summaries of the many parametric studies of dark adaptation may be<br />
found in Graham et al. (1966), Davson (1962), LeGrand (1957) and in Jayle and<br />
Ourgaud (1950). A general curve, obtained with white light, is shown in<br />
figure 13-33. The early portion of the curve, extending to about 10 minutes, is<br />
here reflecting the adaptation of cones. Tile subsequent increase in sensitivity is<br />
due to activity of the rods. The curve is an average from the data<br />
of 101 observers. It clearly indicates that adaptation of the cones is complete<br />
after about 10 minutes. Later increase in sensitivity is caused by activity of the<br />
rods.<br />
There are several important operational consequences of the dark adaptation<br />
process and its properties:<br />
1. Best performance on a task at low luminance requires that the eye be<br />
preadapted to an appropriately low level for sufficient time so that maximum<br />
sensitivity obtains.<br />
2. Since the rods are more sensitive than the cones at low luminances, best<br />
detection capability will occur on those parts of the retina where rods abound<br />
(10 to 30 degrees from the fovea), and averted vision is required for optimal<br />
performance.<br />
3. Since the rods are relatively insensitive to extreme red wavelengths, dark<br />
adaptation will proceed if the observer dons suitable red goggles or if the<br />
illumination provided, in a spacecraft for example, is very deep red. By this<br />
means it is possible to continue to use the high-acuity capability of the central<br />
fovea at elevated iunfinance levels for reading instruments, etc., while the<br />
adaptation process goes on; although vision will naturally be monochromatic in<br />
this case.
Vision 655<br />
4. Because the two eyes are essentially independent as regards adaptation, it<br />
is possible to maintain dark adaptation in one (e.g., by means of an eye patch)<br />
while the other is used for tasks at high luminance.<br />
J<br />
zt<br />
at<br />
z<br />
z<br />
12<br />
11<br />
10<br />
9<br />
z 8<br />
O<br />
7<br />
re<br />
"r 6<br />
• _ PRE--AOAPTING LUMINANCE<br />
,_ fNFERRED INSTANTANEOUS<br />
THRESHOLD<br />
| I |<br />
10 20 30<br />
MINUTES IN THE DARK<br />
Figure 13-33. Course of dark adaptation following exposure to a luminance of about 1000<br />
ft-L. Measurements made using a test spot1 ° in diameter imaged on a retinal<br />
region 15 ° in nasal periphery where both rods and cones are present. (Sloan, 1947;<br />
adapted from How we see: A summary of basic principles, by A. Chapanis, in Human<br />
factors in undersea warfare, by permission of the National Academy of Sciences)<br />
Vision Under Stress<br />
Environmental stresses to which astronauts may be subjected have been<br />
studied in some detail. Most of these are of a transient nature, occurring only<br />
during some relatively short part of the mission, such as launch, extravehicular<br />
activity, or reentry. Others, however, will be a necessary part of extended<br />
missions, and a potential part of system malfunctions. Added to environmental<br />
factors may be individual stresses induced by anxiety, boredom, interpersonal<br />
4O
656 Bioastronautics Data Book<br />
frictions or sensory deprivation*. The latter class of stresses has been only<br />
partially amenable to test, and the practical importance of these factors remains<br />
a matter of conjecture. The physical environmental stresses thought to be<br />
important may, however, be quantitatively evaluated in many instances.<br />
Acceleration<br />
The effects of acceleration on vision have been summarized by White and<br />
Monty (1963). As is well known, the decrement in performance is a function of the<br />
g vector, and less impairment is incurred in the case of transverse g loads. Central<br />
and peripheral contrast discrimination are affected differentially, and central losses<br />
in acuity are suffered. Figure 13-34 shows the nature of these effects, and their<br />
implications for system design and mission profile planning are clear.<br />
J 68<br />
74,<br />
72<br />
70<br />
< 06<br />
J<br />
_ 04<br />
I.Z<br />
I0<br />
TRANSVERSE G<br />
Om'_OIPRONE BUOy POSITION)<br />
_ pOSITIVE G<br />
64 3(<br />
FOVEAL THRESHOLDS AS A FUNCTION<br />
OF ACCELERATION (WHITE. 1960)<br />
ITIONI<br />
I 2 3 4 ;<br />
ACCE L ER/_,T_0N (g)<br />
PERIPHERAL THRESHOLDS AS A FUNCTION<br />
OF ACCELERATION (WHITE 960 )<br />
Figure 13-34. Binocular visual acuity as a function of transverse g-forces.<br />
Note that effect is independent of body position in these data. (White & Jorve, 1956)<br />
*Sensory deprivation refers to the condition wherein the individual is kept in an<br />
environment with drastically reduced sensory input. Laboratory experiments in which<br />
subjects were immobilized (e.g., in a tank of water at skin temperature) and isolated from<br />
all visual and auditory stimuli, have led to bizarre behavior, hallucinations, delusions, etc.<br />
It is no longer believed that these phenomena are of any interest in hiotechnology, even<br />
for extended interplanetary missions.<br />
(c)
Vibration<br />
Vision 657<br />
Whole body vibration produces a loss in visual acuity and the accuracy of<br />
dial reading. The effects are related to the axis of vibration, the nature of the<br />
task, and the frequency, but appear to be relatively independent of the<br />
amplitude, at least over the range from 0.025 to 0.05 inches (Mozell and White,<br />
1958). Recent studies have shown visual performance decrements to depend<br />
upon the kind of head restraint used (Taub, 1966) and the use of various helmet<br />
and liner combinations (Schoenberger, 1968). Y-axis vibration applied to the<br />
head alone (Rubinstein and Kaplan, 1968) shows acuity to be a U-shaped<br />
function of frequency, with poorest acuity in the range from 25 to 35 Hz. The<br />
same study showed that acuity gradually returns to normal as frequency is<br />
increased, and that the effect has vanished at 78 Hz. It should be noted that the<br />
decrement in acuity could be overcome by increasing the contrast of the<br />
resolution pattern used. The data for both constant acceleration (1.0gy) and<br />
constant displacement (0.03 cm) are shown in figure 13-35.<br />
Weightlessness<br />
As it is impossible to simulate zero-g conditions in the laboratory, or<br />
for long periods in parabolic aircraft flights, the effects of prolonged<br />
weightlessness on vision are only imperfectly known. The existing data were<br />
collected on Gemini flights, GT5 and GTT, of approximately 7 and 14 days'<br />
duration, respectively. Visual acuity was the only task which was evaluated,<br />
and no significant differences were found between preflight, inflight, and<br />
postflight results (Duntley et al., 1968).<br />
Hypoxia<br />
The effects of oxygen lack on vision are well known from many studies.<br />
Some of the effects of G-forces may be attributed to the fact that blood<br />
supply to the head is diminished, and that an anoxia is thereby produced<br />
both in the retina and the visual cortex. The effects of oxygen lack on the<br />
visual threshold are exemplified by figure 13-36 (McFarland, 1946), which<br />
also shows the effect of cigarette smoking on this function.<br />
Glare<br />
Visual performance is degraded when a source of high luminance<br />
intrudes upon the field of view. The disability and discomfort which result<br />
are functions of the size and intensity of the glare source, and its position<br />
in relationship to the object of regard. Whether the glare source is small<br />
and intense, as when the sun is in the field of view, or large and diffuse, as<br />
in looking through a spacecraft window which is scratched or dirty and<br />
illuminated by a strong source, the effect is to reduce the apparent contrast<br />
of the desired object. The quantitative expression of glare is usually done in<br />
terms of an hypothetical uniform veiling luminance which would produce<br />
the same performance decrement, although this is at best only an<br />
approximation. (For a discussion, see LeGrand, 1957).
A<br />
O<br />
Z<br />
O<br />
I--<br />
,q<br />
Ul<br />
.-I<br />
W<br />
U<br />
Z<br />
Z<br />
0<br />
U<br />
658 Bioastronautics Data Book<br />
Z<br />
,,m<br />
uJ<br />
U<br />
_J<br />
0<br />
Z<br />
Z<br />
0<br />
m I m 1 I o<br />
, i d T T<br />
IIINOW 7VrlSIA 3AIIV7:II:I<br />
i i I m I o<br />
i l , ' s T<br />
AllrlOV 7'o'rlsIA 3AIIV7:II:I<br />
_o<br />
A<br />
)-<br />
O<br />
,,t<br />
rr<br />
A<br />
v<br />
>-<br />
U<br />
o<br />
uJ<br />
n"<br />
u.<br />
J_<br />
i"<br />
¢¢<br />
0<br />
0<br />
)<br />
o<br />
0<br />
¢0
j_3,<br />
38<br />
.ooMA,.I _sT...o, ,ooxo.I .ooM ..<br />
• [
660 Bioastronautics Data Book<br />
..J J _2<br />
E E E<br />
..d _1" -=l M .Jt'q<br />
EO EO EO o<br />
O_m40o <<br />
8<br />
0<br />
"1 '_r Jot, Jo,I<br />
EO E O Eo<br />
o_lm4oo<br />
I<br />
0<br />
o _ o o<br />
:)as- 31AIIJ. NOl.l.d=13N=Id<br />
0<br />
0o<br />
o.<br />
0<br />
>k-<br />
)<br />
I_<br />
o<br />
I I I I J<br />
o 0 0<br />
_s" 3PJI1 NOIld:IO_:M<br />
%<br />
%<br />
0<br />
6<br />
C'N<br />
-- 0<br />
co 0<br />
%<br />
0<br />
6<br />
_J<br />
E<br />
uJ<br />
Z<br />
_z<br />
_J<br />
w<br />
(2<br />
rr<br />
F-<br />
.J<br />
E<br />
w<br />
Z<br />
z®<br />
.J<br />
F-<br />
_r<br />
F.-<br />
MU<br />
"i_<br />
?.)}<br />
t-..:.N = =
Vision 661<br />
space missions. It is now thought that any or all of the following activities<br />
will depend significantly upon vision, either in a primary sense, or in a<br />
backup mode:<br />
1. Orientation, both personal and vehicular<br />
2. Rendezvous and docking, including detection and interception;<br />
estimates of distance and closure rates<br />
planets,<br />
4.<br />
5.<br />
6.<br />
7.<br />
8.<br />
9.<br />
10.<br />
11.<br />
12.<br />
.<br />
Navigation, including star tracking and angle measurements<br />
Observation, from the upper atmosphere, of the Earth,<br />
and the Moon<br />
Astronomical observations from space<br />
Lunar surface observation from lunar orbit<br />
Planetary surface observation from orbit<br />
Lunar landing, including estimates of distances and closure rates<br />
Observation of the lunar surface from the lunar surface<br />
other<br />
Planetary landing, including estimates of distance and closure rates<br />
Translation on the lunar surfaee<br />
Extravehicular maintenance and other activity.<br />
The effects of certain environmental variables upon the ability of man to<br />
perform the above tasks, as well as the visual functions necessary in each,<br />
have been discussed by Taylor (1964), and that document should be<br />
referred to for detailed consideration of the list.<br />
References<br />
Allen, C.W. Astrophysical qmmtities. (2nd ed.) London: The Athlone Press, 1963.<br />
Baker, H. D. Initial stages of light and dark adaptation. Journal of the Optical Society of<br />
America, 1963, 53, 98-103.<br />
Baker, C. A. & Stcedman, W. C. Perceived movement in depth as a function of luminance<br />
and velocity. Human Factors, 1961, 3,166-173.<br />
Baumgardt, E. & Segal. Compt. Rend. Soc. Biol., 1946, 140, 231.<br />
Bedford, R. E. & Wysgeeki_ G. Axial chromatic aberration of the human eye. Journal of the<br />
Optical Society of America, 1957, 47, 464-465.<br />
Biberman, ]_. M., Dunkelman, L., Fickett, M. L., & Fink, R. G. Levels of nocturnal<br />
illumination. Research paper P-232, Institute for Defense Analysis, 1966.<br />
Blaekwell, H. R. Contrast thresholds of the human eye. Journal of the Optical Society of<br />
America, 1946, 36, 624-643.<br />
Blaekwell, H. R., & MeCready, D. W., Jr. Foveal contrast thresholds for various durations of<br />
single pulses. USN BuShip8 Contract NObs72038, ERI Report No. 2455-13-F,<br />
University of Michigan, 1958.<br />
Blackwell, H. R., & Taylor, J. H. Consolidated set of foveal contrast discrimination data for<br />
normal binocular vision. Journal of the Optical Society of America, 1970, 60, 736A.<br />
(Full paper in press)
662 Bioastronauties Data Book<br />
Boring, E. G., Langfieid, H. S., & Weld, H. P. Foundations of psychology. New York: John<br />
Wiley & Sons, 1948.<br />
Brown, D. R. E. Natural illumination charts. USN BuShips Report No. 374-1, 1952.<br />
Brown, J. L. Flash blindness. General Electric Technical Information Series, 61SD129,<br />
November 1961.<br />
Brown, J. L. Flash blindness. American Journal of Ophthalmology, 1965, 60, 505-520.<br />
Brown, R. H. Weber ratio for visual discriminatton of velocity. Science, 1960, 131,<br />
1809-1810.<br />
Burns, N. M., Chambers, R. M., & Hendler, E. (Eds.) Unusual environments and human<br />
behavior. Glencoe: The Free Press, 1963.<br />
Chapanis, A. How we see. In a survey report of human factors in undersea warfare.<br />
Prepared by the Panel on Psychology and Physiology of the Committee on Undersea<br />
Warfare of the National Research Council. Washington: NRC, 1949.<br />
Cobb, P. W., & Moss, F. K. Four fundamental factors in _4sion. Trav.sactions of the<br />
American Illuminating Engineering Society, 1928, 23,496.<br />
Committce on Colorimetry, Optical Society of America The science of color. New<br />
York: Thomas Y. CroweU, 1953.<br />
Conner, J. P., & Ganom_g, R. E. An experimental determination of the visual thresholds at<br />
low values of illumination. Journal of the Optical Society of America, 1935, 25,<br />
287-294.<br />
Davies, J. M., & RaiMolph, D. T. (Eds.) Proceedings of the U.S. Army Natick Laboratories<br />
flash blindness symposium. NAS-NRC Committee on Vision, Washington, 1967.<br />
Davson, H. (Ed.) The eye. New York: Academic Press, 1962.<br />
Duntley, S. Q. Final report of Contract N5ori-07864 MIT, Scripps Institution of<br />
Oceanography, 1952.<br />
Duntley, S. Q. Improved nomographs for predicting visibility by swimmers. Report No. 5-3,<br />
USN BuShips Contract NObs 72039, 1960.<br />
Duntley, S. Q., Austin, R. W., Harris, J. L., & Taylor, J. H. Experiments on visual acuity<br />
and the risibility of markings on the ground in long-duration earth-orbital space flight.<br />
Report No. 68-8, University of California, Scripps Institution of Oceanography, 1968.<br />
Duntley, S. Q., Gordon, J. 1., Taylor, J. tt., White, C. T., Boileau, A. R., Tyler, J. E., Austin,<br />
R. W., & Harris, J. L. Visibility. Applied Optics, 1964, 3,549-598.<br />
Ferree, C. E., & Rand, G. The effect of variation of visual angle, intensity, and composition<br />
of light on important visual functions. Transactions of the American illuminating<br />
Engineering Society, 1922, 17, 69-102.<br />
Gibson, J. J. The perception of the visual world. Cambridge: The Riverside Press, 1950.<br />
Gordon, J. 1. Optical properties of objects and backgrounds. Applied Optics 1964, 3,<br />
556-562.<br />
Graham, C. ll., & Kemp, E. H. Brightness discrimination as a function of the duration of<br />
the increment in intensity. Journal of General Physiology 1938, 21,635-650.<br />
Graham, C. H., Bartlett, N. R., Brown, J. L., Hsai, Y., Mueller, C. G., & Rings, L. A.<br />
(Eds.) Vision and visuaiperception. New York: John Wiley & Sons, 1966.<br />
Graham, C. H. (Ed.) Vision and visual perception. New York: John Wiley & Sons, 1965.<br />
Haines, R. F. Size matching accuracy under very high target luminances. Published in<br />
Proceedings of 1967 Aerospace Medical Association Meeting, Washington, D.C.,<br />
April 10-13, 1967, Pp. 278-279.
Vision 663<br />
Hall, M. V., & Greenbaum. L. J., Jr., Area of vision and cockpit visibility. Transaction of<br />
the American Academy of Ophthalmology and Otolaryngology September-October,<br />
1950.<br />
Hartridge, H. Recent admnces in the physiology of v/don. Philadelphia: Blakiston, 1950.<br />
Heeht, S., & Verrijp, C. D. Intermittent stimulation by light. II[: The relation between<br />
intensity and critical fusion frequency for different retinal locations. Journal of General<br />
Physiology, 1933, 17, 251-265.<br />
Holladay, L. L. The fundamentals of glare and visibility. Journal of the Optical Society of<br />
America, 1926, 12, 271-319.<br />
Ivanoff, A. Chromatic aberration of the eye. Documents of Ophthalmology , 1949, 3,<br />
322-323.<br />
Jayle, G.-E., & Ourgaud, A.-G. La v/sion nocturne et zes troubles. Paris: Masson et Cie,<br />
1950.<br />
Jones, L. A., & Condit, H. R. Brightness scale of exterior scenes and the computation of<br />
correct photographic exposure. Journal of the Optical Society of America, 1941, 31,<br />
651.<br />
Jones, R. L. An investigation of earthshine lighting conditions for lunar-sudace operations.<br />
NASA Technical Memorandum TM X-58011, 1967.<br />
Jones, W. L., Allen, W. H., & Parker, J. F. Advanced vision research for extended<br />
spaceflight. Aerospace Medicine, 1967, 38, 475-478.<br />
Kanfman, J. E. (Ed.)LE.S. Lighting handbook. New York: Illuminating Engineering<br />
Society, 1966.<br />
Kinney, J. S., & Connors, M. M. Recovery of foveal acuity following exposure to various<br />
intensities and durations of light. American Journal of Psychology, 1965, 432-440.<br />
Kishto, B. N. The photometric evaluation of flashing light sources. PhD Thesis, University<br />
of London, 1968.<br />
Koval, I. K. On the study of the optical properties of the atmosphere and surface of Mars.<br />
In I. K. Koval (Ed.), Physics of the moon and planet:. Kiev: Naukova Dumka.<br />
(Translation by Israel Program for Scientific Translations, Ltd., IPST Catalogue<br />
No. 1548, Jerusalem 1964.)<br />
Krinov, E. L. Spectral reflectance properties of natural formations. USSR Academy of<br />
Science, Translation by G. Belkov, National Research Council of Canada, 1947.<br />
Kuiper, G. P. The earth as a planet. Chicago: The University of Chicago Press, 1954.<br />
LeGrand, Y. Light, eoiourand vision. New York: John Wiley & Sons, 1957.<br />
LeGrand, Y. Form and space t_ion. Bloomington:Indiana University Press, 1967.<br />
Ludvigh, E. J., & Miller, J. W. Study of visual acuity during the ocular pursuit of moving<br />
test objects. [., Introduction. Journal of the Optical Society of America, 1958, 48,<br />
799-802.<br />
MacAdam, D. L. Visual sensitivities to color differences in daylight. Journal of the Optical<br />
Society of America, 1942, 32,247-274.<br />
Mandeibaum, J., & Sloan, L. L. Peripheral visual acuity. American Journal of<br />
Ophthalmology, 1947, 30,581-588.<br />
McFarland, R. A. Human factors inair transport design. New York: McGraw-Hill, 1946.<br />
Meyer-Arendt, J. R. Radiometry and photometry: Units and conversion factors. Applied<br />
Optics, 1968, 7, 9-12.<br />
Middleton, W. E. K. Vision through the atmosphere. Toronto: The University of Toronto<br />
Press, 1952.
664 Bioastronautics Data Book<br />
Miller, J. W. Study of visual acuity during the ocular pursuit of moving test objects. II.<br />
Effects of direction of movement, relative movement, and illumination. Journal of the<br />
Optical Society of America, 1958, 48, 803-808.<br />
Moon, P. The scientific basis of illuminating engineering. (Rev. ed.) New York: Dover<br />
Publications, 1961.<br />
Morris, A., &Horne, E. P. (Eds.) Visnalsearch techniques. NAS-NRC Publication No. 712,<br />
1960.<br />
Mozell, M. M., & White, D. C. Behavioral effects of whole body vibration. Journal of<br />
Aviation Medicine, 1958, 29, 716-724.<br />
0sterberg, G. Topography of the layer of rods and cones in the human retina. Acta<br />
Ophthalmology, 1935, 13, Supplement 6.<br />
Patel, A. S., & Jones, R. W. Increment and decrement visual thresholds. Journal of the<br />
Optical Society of America, 1968, 58,696-699.<br />
Reeves, P. Rate of pupillary dilation and contraction. Psychology Review 1918, 25,330.<br />
Rennflson, J. J., Holt, H. E., & Morris, E. C. In situ measurements of the photometric<br />
properties of an area on the lunar surface. Journal of the Optical Society of America,<br />
1968, 58, 747-755.<br />
Rubinstein, L., & Kaplan, R. Some effects of Y-axis vibration on visual acuity. USAF<br />
AM RL-TR-68-19, 1968.<br />
Schlaer, S. The relation between visual acuity and illumination. Journal of General<br />
Physiology, 1937, 25, 553-569.<br />
Schober, H. Neuere untersuchungen 'fiber sehscharfe, auflosungsvermiJgen der optischen<br />
instrumente und besonders des menschlichen auges. Zeitschrift fflr Physik, 1937, 19,<br />
343-344.<br />
Schober, H., & Wittman, K. Untersuchungen i_ber die sehscharfe bei versehiedenfarbigen<br />
licht. Das Licht 1938, 8, 199-201.<br />
Schoenberger, R. W. Investigation of the effects of vibration on dial reading performance<br />
with a NASA prototype Apollo helmet. USAF AMRL-TR-67-205, 1968.<br />
Shoemaker, E. M., Bateson, R. M., Holt, H. E., Morris, E. C., Rennilson, J. J., & Whitaker,<br />
E.A. Surveyor V: Television pictures. Science, 1967, 158,642-652.<br />
SIoan, L. L. Rate of dark adaptation and regional threshold gradient of the dark-adapted<br />
eye. Physiologic and clinical studies. American Journal of Ophthalmology, 1947, 30,<br />
705-719.<br />
Speetor, W. S. (Ed.) Handbook of biological data. Philadelphia: W. B. Saunders Co., 1956.<br />
Spigal, I. M. (Ed.)Readings in the study of visually perceived movement. New<br />
York: Harper & Row, 1965.<br />
Stiles, W. S. The directional sensitivity of the retina and the spectral sensitivities of the rods<br />
and cones. Proceedings of the Royal Society, (London), 1939, 127B, 64-105.<br />
Stiles, W. S., & Crawford, B. H. The luminous efficiency of rays entering the pupil at<br />
different points. Proceedings of the Royal Society, (London), 1933, B 116,428-450.<br />
Taub, H. A. Dial reading performance as a function of frequency of vibration and head<br />
restraint system. USAF AMRL-TR-66-57, 1966.<br />
Taylor, J. H. Contrast thresholds as a function of retinal position and target size for the<br />
light-adapted eye. USN BuShips Contract NObs 72092, REport No. 61-10, 1961.<br />
Taylor, J. H. Survey of research relating to man's visual capabilities in space flight. USN<br />
Contract NO_ 86012, Final report, Lot HI, 1964.<br />
Taylor, J. H. Visual performance on the moon. In F. J. Malina (Ed.), Life sciences and lunar<br />
medicine. Oxford: Per_mon Press, 1967.
Vision 665<br />
Taylor, J. H. Factors underlying visual search performance. S.I.O. Ref. 69-22, Pp. 23,<br />
University of California San Diego, 1969.<br />
Wald, G., & Griffin, D. R. The change in retractive power of the human eye in dim and<br />
bright light. Journal of the Optical Society of Ameriea, 1947, 37, 321-336.<br />
Walsh, J. W. T. Photometry. London: Constable, 1958.<br />
Whiteside, T. C. D. The problems of vision in pight at high altitude. London: Butterworth's,<br />
1957.<br />
White, W. J. Vision. In P. Webb (Ed.), Bioastronautics data book.Washington: National<br />
Aeronautics and Space Administration, 1964.<br />
White, W. J., & Jorve, W. R. The effects of gravitational stress upon visual acuity. WADC<br />
Technical Report 56-247, Wright Air Development Center, Wright-Patterson Air Force<br />
Base, Ohio, 1956.<br />
White, W. J., & Monty, R. A. Vision and unusual gravitational forces. Human Factors,<br />
1963, 5, 239-262.<br />
Wilmer, E. N. Retinal structure and colour vision. Cambridge: University Press, 1946.<br />
Wright, W. D. Researches on normal and defective colour vision. St. Louis: C. V. Mosby<br />
Co., 1947.<br />
Wright, W. D., & Pitt, F. H. G. Hue discrimination in normal colour vision. Proceedings of<br />
the Physical Society, (London), 1934, 46,459.<br />
Wulfeck, J. W., & Taylor, J. H. (Eds.) Form discriminatio- as related to military problems.<br />
NAS-NRC Publication No. 561, 1957.<br />
487 858 O 73 43
CHAPTER 14<br />
AUDITORY SYSTEM<br />
by<br />
Harlow W. Ades, Ph.D.<br />
University of Illinois<br />
The importance of effective communication cannot bc ow_rstated. Progress<br />
in all facets of civilization depends on the exchange of ideas, messages, and<br />
commands. The orderly flow and management of information has become a sine<br />
qua non in all file complex activities of a modern world.<br />
Communications, whether occurring between humans in normal day-to-day<br />
association or occurring during the operation of complex man-machine systems,<br />
depend primarily on the auditory and visual systems. This dlapter deals with tile<br />
former. In designing any system in which communications plays _me part, the<br />
unique characteristics of any auditory systcm must be considered. An<br />
understanding of its structure and eccentricities will 'allow this receptor system<br />
to be matched with other system elements to achieve efficient system design.<br />
However, the responsibility of the designer does not end here. He must attend<br />
not only to system efficiency but to the impact of system operation on tbc<br />
environment of which it becomes a part. In this regard, noi_ pollution has<br />
become an issue of major concern. While noise-free systems are usually not<br />
feasible, the design engineer still bears the responsibility for understanding the<br />
noise characteristics of his system and their likely effects on audition.<br />
This chapter is divided into three major sections. The first deals briefly with<br />
the physical correlates of hearing, i.e., the acoustic stimulus. In working with a<br />
psychophysical phenomenon such as heariug, one must be able to define and<br />
measure the stimulus parameters with precision since the stability of measurement<br />
for any psychophysical relation_ip gcner',dly comes from the physical (or<br />
stimulus) side; however, the reader is referred to other recent works for most of<br />
the detail.<br />
The second section describes in some detail the auditory system itself. Here<br />
one is confronted with the time-honored question, "How much information<br />
should a designer have concerning the morphology and neurology of a body<br />
Reviewed by William D. Neff, Ph.D., Indiana University<br />
667
668 Bioa_tronautics Data Book<br />
system in order to work with it effectively?" Although it is possible to work in a<br />
system design dealing only with input-output relationships, a certain level of<br />
sophistication concerning System elements will provide confidence to the<br />
designer if nothing else. Here again, except for the inner ear itself, the reader is<br />
referred to recent works on the subject.<br />
The third section _ f this chapter presents recent data concerning hearing loss<br />
and structural change caused by carefully controlled over-stimulation of the<br />
auditory System. The main purpose of this section is to provide information<br />
concerning the physiological response of the auditory System, as evidenced by<br />
physical damage. The section serves further as a caution against subjecting the<br />
auditory system to stimulation for which it was not designed. It also sets the<br />
stage for the next chapter which deals with the response of the auditory system<br />
under conditions of noise and overload.<br />
Physical Correlates of Hearing<br />
Hearing is the sum total of the transmission of sound from the external<br />
environment to the brain. It involves the conversion of mechanical impulses to<br />
neural impulses, the transmission of these impulses to the brain, and their<br />
"perception" by the brain. The sensation of airborne sound is produced when<br />
vibrations of the molecules of air strike the ear drum in alternating phases of<br />
condensation and rarefaction. A graph of these movements as changes in<br />
pressure on the tympanic membrane per unit of time shows a series of waves.<br />
The speed of sound increases with temperature and with altitude. Water also<br />
conducts sound, at speeds over four times as fast as air (775 mph versus<br />
3215 mph), but here we are concerned mostly with airborne sound. The<br />
loudness of a sound correlates with the amplitude of a sound wave. The pitch of<br />
a sound correlates with the frequency or number of waves per unit of time, with<br />
greater amplitude meaning louder sound and greater frequency, i.e., higher pitch.<br />
The presence of one sound decreases an individual's ability to hear other<br />
sounds. This phenomenon is known as masking. It is believed to be due to the<br />
relative or absolute refractoriness of previously stimulated auditory receptors.<br />
The degree to which a given tone masks other tones is related to its frequency.<br />
(For curves of masking effect as a function of frequency, see chapter 15, Noise<br />
and Blast.) The masking effect of a background noise raises the auditory<br />
threshold a definite and measurable amount.<br />
In describing an auditory stimulus, one must specify the frequency of the<br />
sound and its intensity. When dealing with pure tones, frequency is expressed as<br />
"cycles per second" or the preferred synonymous term "Hertz" (Hz). The<br />
intensity of a sound wave is a function of the amplitude of the wave and is<br />
measured in pressure units. Three terms are widely used in referring to intensity.<br />
These are decibels (dB), perceived noise (PNdB), and effective perceived noise<br />
(EPNdB).<br />
The decibel is based on the ratio of the acoustic energy being measured to a<br />
reference energy. The standard sound reference level adopted by the Acoustical
Auditory System 669<br />
Society of America is 0.0002 dynes per square centimeter, a value just at the<br />
auditory threshold for the average human. The ratio of the two energy or<br />
intensity measures is transformed into a logarithmic scale for greater manage-<br />
ability. A value of zero decibels does not mean the absence of sound, but a<br />
sound level equal to that of the arbitrary standard, the least sound the average<br />
human ear can hear. Zero to 140 dB, a range extending from threshold intensity<br />
to an intensity generally assumed to be painful to the ear, actually represents a<br />
1014 or 100 million million-fold increase in sound intensity.<br />
The perceived noise (PNdB) is a calculated unit used to express unwanted or<br />
unacceptable sound; that is, noise. The unit, used frequently to describe aircraft<br />
noise, is calculated by combining actual sound level with a weighted annoyance<br />
factor based on a variation in frequencies since some frequencies are more<br />
troublesome to the human ear than others. Kryter (1970) feels that the<br />
relationship between the sound pressure level and judged perceived noisiness, or<br />
annoyance, as a function of the frequency content of random noise is reasonably<br />
well established. Frequency weightings for noisiness and for loudness given by a<br />
number of investigators are in close agreement. Weightings given by Stevens'<br />
loudness index contours (1961) are similar to the equal noisiness contours<br />
developed by Kryter and Pearson (1963), and Wells (1967).<br />
The effective perceived noise decibel (EPNdB) is also a calculated unit,<br />
which is little used, and which carries the weighting concept further by<br />
accounting for the effects of pitch and duration of noise.<br />
A concept which is gaining rapidly in usefulness is the use of the noise<br />
exposure forecast (NEF) in conjunction with the compatible noise exposure<br />
limit (CNEL). In these terms, the noise around an airport, for example, may be<br />
expressed. All of the foregoing terms are expressed in the NEF which can be<br />
monitored and checked periodically and, in addition, can be predicted for the<br />
future by computer calculation. Kryter (1970) describes these terms in much<br />
more detail.<br />
The Auditory System<br />
The process of sound transmission can be very briefly summarized as<br />
follows. Sound waves impinge upon the tympanic membrane and are trans-<br />
formed by this organ and the bones of the middle ear into mechanical waves,<br />
and, by the action of the footplate of the stapes into fluid-borne waves, since the<br />
inner ear is fluid-filled. The action of these waves on the organ of hearing proper,<br />
the organ of Corti, in the inner ear, triggers impulses in nerve fibers which supply<br />
the organ. These nerve fibers transmit coded information regarding sound to the<br />
brain.<br />
The audible range of frequencies for humans is generally given as 20 to<br />
20 000 Hz, though few individuals can hear as high as 20 000. In other animals,<br />
much higher frequencies can be heard. The greatest sensitivity is in the range of<br />
1000 to 3000 Hz. Pitch discrimination is less sensitive at frequencies outside this<br />
range.
670 Bioastronautics Data Book<br />
The ear has three anatomical subdivisions containing, along with numerous<br />
other structures, all of the conductive and some of the nerve elements of the<br />
hearing mechanism. Figure 14-1 shows the human ear in cross section. The<br />
external ear, a trumpetlike structure, comprises the pinna and the external<br />
auditory canal or meatus. The middle ear houses the auditory ossicles. The inner<br />
ear contains the organ of hearing proper, the organ of Corti, together with the<br />
nonacoustic labyrinth, the vestibular apparatus.<br />
External Ear<br />
Figure 14-1. Drawing of cross section through human ear.<br />
(Naval Flight Surgeon's Manual, 1968)<br />
The pinna, the fleshy and cartilaginous outer ear, has little effect on hearing<br />
in the human. The ear canal, or external auditory meatus, on the other hand, can<br />
affect hearing seriously if it should become occluded. The canal is bounded<br />
medially by the drum membrane, or tympanic membrane.<br />
The Middle Ear<br />
The tympanic membrane is also the lateral boundary of the middle ear.<br />
Some of the sound waves that strike the tympanum are reflected back into the<br />
auditory canal. The rest are transmitted across the membrane to the air-filled<br />
middle ear. The middle ear contains, in addition to nerves and vasculature, the<br />
bony chain of the sound conduction system, the malleus, the incus, and the
Auditory System 671<br />
stapes. These bones functionally connect the ear drum with the inner ear,<br />
transmitting the waves imposed on the drum across the middle ear to the<br />
footplate of the stapes which rocks to and fro, delivering the agitation to the<br />
perilymph of the cochlea.<br />
The ear bones of the middle ear function as a lever system. A small<br />
mechanical advantage is gained because the handle of the malleus is longer than<br />
the long crus of the incus. Much more important, however, is the ratio of the<br />
area of the tympanic membrane to the footplate of the stapes at the oval<br />
window. This ratio is effectively 14 to 1, and corresponds to an increase of<br />
23 dB. The total force at the oval window is about the same as at the tympanic<br />
membrane, but it is concentrated in a much smaller area. Pressure exerted on the<br />
fluid of the inner ear is therefore only 3 to 5 dB less than that exerted by the<br />
sound pressure wave on the tympanum.<br />
Theln_rEar<br />
The inner ear is a closed fluid-filled chamber. It communicates with the<br />
middle ear at the oval and round windows (see figure 14-1). The oval window,<br />
closed by the stapes which is fixed by means of an annular ligament, links the<br />
middle ear with the vestibule of the inner ear. The round window provides the<br />
means of relieving the pressure imparted to the cochlea by connecting the<br />
middle ear with the basal turn of the cochlea through a flexible membrane. The<br />
cochlear wall is rigid and incompressible.<br />
The cochlear partition, including basilar membrane and Reissners'<br />
membrane, ends a little short of the apical end of the cochlear canal. There the<br />
scala vestibuli and the scala tympani join through the helicotrema while the<br />
cochlear duct ends blindly. At the other end of the scala tympani is the round<br />
window. The scala vestibuli opens into the central chamber of the labyrinth, the<br />
vestibule, close to the oval window. The length of the cochlear partition in man,<br />
from its origin between the oval and round window to the helicotrema, is about<br />
35 mm. The sensory surface of the cochlea is thus a long narrow ribbon, coiled<br />
in spiral form, mounted on an elastic membrane, between two fluid-filled<br />
channels. This membrane is moved by the fluid which is driven acoustically at<br />
the oval window by the stapes.<br />
The Organ of Corti<br />
1_ae organ of Lorti occupies the cochlear duct between the scala<br />
vestibuli and the scala tympani (see figure 14-2a). The cochlear duct is<br />
bounded by the thin vestibular (Reissners') membrane and the basilar<br />
membrane on which the organ of Corti is situated. The organ of Corti,<br />
otherwise known as the acoustic papilla, consists of hair cells, supporting<br />
structures, and nerve endings, the hair cells being the sound sensitive<br />
elen, ents (figure 14-2b).<br />
i_.e orgar, of Corti is divided by one variety of the supportive elements, the<br />
inner and outer pillar cells, which slant toward each other to meet at the free
672 Rioastronautics Data Book<br />
surface, forming a triangular space, the tunnel of Cortl On the medial<br />
(modiolar) side of this, the inner hair cells are situated, and on the outer side are<br />
the three rows of outer hair cells. The pillar cells are stiffened by bundles of<br />
tonofibrils. The outer hair cells reach the surface of the epithelium, but not the<br />
base, being supported underneath and held in place above by the phalangeal cells<br />
(also called Deiters' cells). Outside file outer tunnel is a solid bank of less<br />
differentiated cells, the cells of Hensen. These gradually diminish in height to<br />
merge with the cells of Claudius which form a simple epithelium merging, in<br />
turn, with the stria vascularis at the side of the cochlear duct.<br />
(a)<br />
I,,,if -"<br />
j , n , I<br />
_,_ ," , , I _ ',<br />
:.:.: ..... I . ..<br />
Z'_._ : ,...'g"_, : I,,,.,,_<br />
' I<br />
(b)<br />
Figure 14-2. A: Drawing of section through one turn of cochlea. B: Enlarged drawing<br />
of section of acoustic papilla showing all essential parts. (From Rasmussen, 1943)
Auditory System 673<br />
Medial to the inner hair cells is a comparable, though more abrupt, bank of<br />
cells which are called border cells, and which diminish rapidly to a simple<br />
epithelium composed of cuboidal cells comparable to the cells of Claudius,<br />
covering the surface of the limbus spiralis. The limbus has a projection, the<br />
tectorial membrane, an acellular organ which extends outward, covering, and in<br />
contact with, the hairs of the hair cells.<br />
The structure of the organ of Corti might be summed up as being an<br />
organization in which the hair cells are suspended in a fluid-filled space<br />
supported by their accessory cells, sitting on a membrane (basilar membrane)<br />
which is capable of passive movement, and covered by a membrane (tectorial<br />
membrane) which is capable of exerting a shearing action on the tips of the hairs<br />
upon such movement. The space in which the hair cells hang is open throughout<br />
the length of the organ of Corti. It is filled with a fluid, the cortilymph, and it is<br />
covered top and bottom by the surfaces of hair cells and phalangeal cells, and by<br />
the basilar membrane. This is significant because the electric potential of the<br />
endolymph within the cochlear duct, according to Davis (1959), has been<br />
determined to be +80 relative to the cortilymph, which is -70, which means<br />
about a 150 mV differential.<br />
The organ of Corti is the organ by which the complex sound waves are<br />
analyzed into their component frequencies. A mechanical disturbance beginning<br />
at the oval window becomes a wave which moves from the base to the apex of<br />
the cochlea along the basilar membrane. This in turn moves the entire acoustic<br />
papilla in such a way that a shearing force is exerted on the hairs by their motion<br />
against the tectorial membrane. In some way, this is translated into excitation of<br />
the hair cells, which is transmitted to the nerve endings at the base of the cells,<br />
and transmission of what are now no longer mechanical, but electrical impulses<br />
to the brain.<br />
The Basilar Membrane<br />
The basilar membrane (figure 14-2b) has distinct properties which enable it<br />
to participate in the analysis of complex sounds. First, the membrane is much<br />
wider at the apex titan at the base, the ratio being between five-fold and<br />
eight-fold in man (Wever, 1949). This characteristic is related to the fact that the<br />
membrane is a low-pass filter, permitting low frequency ._unds to travel further<br />
along than high frequency sounds. The question of how sound waves move along<br />
the membrane was once thought to be explained by a theory that suggested that<br />
the entire membrane resonated. This theory presupposed that the membrane was<br />
under tension, which has been proven not to bc the case. The membrane does,<br />
however, vary in stiffness along its length, and is about one hundred times stiffer<br />
at the basal than at the apical end (Bekesy, 1947). This characteristic is the one<br />
primarily responsible for movement of energy waves.<br />
Relying on mechanical models, Bekesy (1960) determined that when<br />
periodic forces are applied to a system with a stiffness gradient, traveling waves<br />
are generated. He had earlier demonstrated the existence of such waves in the<br />
cochlea by stroboscopic illumination. Figure 14-3 shows the amplitude and
674 Bioastronautics Data Book<br />
phase relations of the vibrating membrane at various points. At low frequencies,<br />
the membrane vibrates in phase. At higher frequencies, the rate of change in<br />
phase increases with distance. The result is a wave train of several cycles. Also as<br />
frequency is increased, the amphtudc envelope, described by the dotted lines in<br />
f'gure 14-3, moves toward the basal end of the basilar membrane.<br />
Figure 14--3. Successive positions of the _raveling wave along the basilar membrane. The<br />
dotted envelope shows the maximum amplitude of vibration at each point. (From Whitfield,<br />
1967; after Bekesy, 1953)<br />
One final point should be made concerning propagation of waves along the<br />
basilar membrane. Although the waves always travel from the base to the apex,<br />
this property is independent of the direction of the mechanical driving force. If<br />
this were not the case, conduction of sound through the bones of the skull,<br />
bypassing the stapes entirely, would not be possible. The driving force results<br />
from pressure changes in the fluid surrounding the cochlear duct; it is not<br />
provided directly by movement of the stapes. This has been confirmed<br />
experimentally by Wever and Lawrence (1954); however, since the time of<br />
transmission of waves along the entire length of the cochlea is only 10 to<br />
20 msec, an) pressure is applied almost simultaneously to all points along the<br />
length of the membrane, setting a considerable fraction of the membrane in<br />
motion.<br />
Hair Cells<br />
The ear converts sound waves to nerve impulses. It is relatively clear how<br />
sound waves become mechanical vibrations of the basilar membrane and that<br />
nerve impulses are generated in the cochlear nerve. The transducer mechanism<br />
involves the hair ceils of the organ of Corti, but how it does so is a more difficult<br />
question. These cells are illustrated diagrammatically in figure 14-2, as they<br />
appear to the scanning microscope (figure 144), and when specimens have been<br />
prepared by the surface specimen technique (Engstr6m, Ades, & Andersson,<br />
1966) as seen in figure 14-5. The sensory cells are known as hair cells because of
Auditory System 675<br />
the tufts of stereocilia which extend from the free ends of the cells. The cilia are<br />
embedded in the cuticle and make contact with the overlying rectorial<br />
membrane. There are some 25 000 hair cells in the human ear (Guild, 1932)<br />
which are arranged in a regular mosaic as a single row of inner hair cells and<br />
three to five rows (the number increases toward the apical end of the cochlea) of<br />
outer hair cells.<br />
Figure 14-4. Scanning photomicrograph of a _gment ot organ of Corti of guinea pig,<br />
IHC= inner hair cell row; OHC 1, 2, 3 = outer hair cell rows as numbered; PC = pillar<br />
cells; D = Deiters' (phalangeal) cells.<br />
Inner Hair Cells<br />
The upper surface of the inner hair cell is bounded by a membrane with an<br />
underlying cuticle in which the roots of the stereocilia are embedded. The<br />
stereocilia have different lengths and form three or four slightly irregular lines.<br />
Each inner hair cell is provided with a single basal body placed at the side of the<br />
rows of stereocilia away from the modiolus. The inner hair cells have a<br />
characteristic shape with a relatively slender upper portion terminating in<br />
the cuticular plate, a bent neck and a thicker cell body containing the<br />
nucleus. Thcy are slanted toward the tunnel of Corti (figure 14-2b).
676 Bioastronautics Data Book<br />
Outer Hair Cells<br />
Figure 14-5. Surface preparation of organ of Corti of guinea pig.<br />
Symbols as in Figure 14-4.<br />
The outer hair cells form three regular rows. lhey slant inward, that is,<br />
toward the modiolus, at an angle of 25 to 30 degrees (figure 14-2b). They<br />
have a flat upper surface with a thick cuticle, a cylindrical body, and a<br />
rounded base. It is customary to distinguish a cuticular, an infracuticular, a<br />
supranuclear, and an infranuclear region. On their cuticular surfaces the cells<br />
are provided with about 120stereocilia and one modified kinocilium<br />
consisting only of the basal body. The stereocilia of the outer hair cell<br />
form a regular W-pattern with a basal body located below the W<br />
(figure 14-4). The angle between the outer ends of the W is wide (120 to<br />
130 degrees) in the basal coil of the cochlea and narrows gradually to about<br />
70 degrees in the apical coil. The rootlets of the stereocilia are inserted in<br />
the cuticular plate which is thicker toward the modiolus and thinner toward<br />
the basal body. Surrounding the basal body is a region where there is no<br />
cuticular plate at all, but only a plasma membrane. The infracuticular region<br />
contains many mitochondria and other organelles grouped around the basal<br />
body. Among these structures are rounded granules containing osmiophilic<br />
particles which increase in size in old animals and animals that have been<br />
exposed to intense noise (EngstriSm, & Ades, 1960).
Auditory System 677<br />
Thecentralpart of thesupranuclear regionis ratherhomogeneous in<br />
structurecontainingfew mitochondriaor cytoplasmicorganelles. The<br />
nucleusis roundedor slightlyovoidin shape.The infranuclear region<br />
containslargegroupsof mitochondria.The baseof the hair cell is<br />
surroundedby the cup-shaped Deiters'cellandby thenerv endings. The<br />
cochlearsensorycellsareprovidedwith twokindsof nerv endingsat their<br />
base.Onetypehasa centripetal or afferent,andtheothera centrifugal or<br />
efferent,conductingproperty(figure14-6).Theafferentfibersformamajor<br />
part of the acoustic nerve and consists of a large number of myelinated<br />
fibers, their myelin sheaths being continuous with the myelin coating of the<br />
spiral ganglion cells. This sheath continues along the peripheral dendrite of<br />
the neuron to the region immediately below the medial attachment of the<br />
basilar membrane where the myelin ends.<br />
Each ganglion cell in the spiral ganglion is surrounded by a distinct<br />
myelin coating. The myelin of the ganglion cell is much less regular than<br />
that of the nerve. The myelin coating is externally bordered by the nuclear<br />
region of the Schwann cell. After prolonged treatment with neomycin, the<br />
ganglion cells demonstrate varying stages of degeneration and the myelin<br />
and Schwann cells show a highly pathological structure with irregular myelin<br />
folds and vacuolated mitoehondria. Similar severe destruction may also<br />
occur after exposure to high intensity noise.<br />
At the outer margin of the spiral osseous lamina the myelinated nerves<br />
all shed their myelin sheaths within a very restricted zone. The Schwann<br />
cell protoplasm follows the nerve fibers all the way to the basilar membrane<br />
whereas the nerve fibers, surrounded only by their axolemma, penetrate the<br />
basal layer and enter the organ of Corti where they run as unmyelinated<br />
fibers.<br />
/nnervationof Hair Cells<br />
The afferent neurons of the auditory nerve are bipolar cells. They are<br />
arranged in a long spiral ganglion parallel to the organ of Corti but within<br />
the bony modiolus. The axon-like dendritic processes pass outward through<br />
the sieve-like bony and fibrous habenula perforata into the organ of Corti.<br />
They are myelinated up to the habenula. Some of them pass directly to the<br />
inner hair cells, innervating the outer hair cells. There is a spiral bundle<br />
under each row of outer hair cells. These fibers may then pass great<br />
distances in the spiral bundle and innervate many outer hair cells. Thus<br />
there is a great difference between the innervation of inner hair cells and<br />
outer hair cells. The inner hair cells are innervated directly -- no fiber passes<br />
to more than three to six cells and no cell is innervated by more than<br />
three to six fibers. The outer hair ceils may be /nnervated by fibers which<br />
pass for considerable distances under them, and great segments of outer hair<br />
cells may be innervated by the same fiber. Each cell receives typically more<br />
than one fiber.
678 Bioastronautics Data Book<br />
÷<br />
Figure 14-6. Electron photomicrogram of base of outer hair cell (OHC) wilh<br />
two kinds of nerve endings, NE1 and NE2. Dc is a part of a Deiters' cell. (EngstriJm,<br />
Ades, and Hawkins, 1965; used by permission of Academic Press, Inc. Copyright 1965<br />
by Academic Press, Inc.)<br />
In addition to the afferent fibers, an efferent olivo-cochlear bundle runs<br />
lengthwise of the organ of Corti as the intraganglionic bundle within the<br />
modiolus just peripheral to the spiral ganglion. These fibers end as highly<br />
granulated endings on the base of the hair cells. Some of them may end as<br />
well on afferent fibers. There are fewer of them than there are hair cells
Auditory System 679<br />
innervated, so that each one ends on many hair cells. They innervate<br />
particularly the inner hair cells and the first row of outer hair cells. Their<br />
function is not well known, but is tentatively assumed to be inhibitory.<br />
A detailed explanation of the physiology of the central auditory<br />
pathways is beyond the scope of this chapter. For additional information,<br />
the reader is referred to the chapter entitled "Central Auditory<br />
Mechanisms" in the Handbook of Physiology (Ades, 1959).<br />
Transducer Mechanisms<br />
The ear, as stated above, converts the mechanical energy of sound waves<br />
to nerve impulses in the auditory nerve. It is clear that the basilar<br />
membrane of the organ of Corti is displaced as a result of the force<br />
imparted to the fluid in the inner ear by the action of the stapes moving in<br />
and out at the oval window. It is also clear that nerve impulses are<br />
discharged in the nerve endings surrounding the base of the hair cells. The<br />
mechanism of stimulation of the hair cells is not known, although it is now<br />
generally assumed that a shearing force is exerted by the tectorial<br />
membrane on the stereocilia and that this somehow results in stimulation. It<br />
may be because of the displacement imparted by the stereocilia to the basal<br />
body, the residue of the kinocilium, which is all that remains on cochlear<br />
hair cells (although a kinocilium is present on vestibular hair cells and fetal<br />
cochlear hair cells).<br />
The phenomena of electrical potentials associated with the cochlea<br />
during stimulation and at rest are germane to this discussion, but not to the<br />
main emphasis of this chapter. For the interested reader, they are summed<br />
up in Davis' (1959) chapter in the ttandbook of Physiology.<br />
Hearing Loss<br />
Damage to or lesions of any one or several elements of the hearing<br />
chain can result in reduced or complete loss of sensitivity to sounds of<br />
various frequencies. This loss of sensitivity, referred to as threshold shift, is<br />
treated in some detail in chapter 15. In this section we shall discuss some<br />
of the physiological changes which accompany hearing loss. Loss of hearing<br />
can be either temporary or permanent and is considered, practically<br />
speaking, total when the threshold is 85 to 90 dB above normal.<br />
Two broad types of hearing loss are generally identified. These are<br />
conductive hearing loss and perceptive hearing loss. ltearing loss that is<br />
hysterical in origin will not be treated here, since obviously there is no<br />
question of demonstrable damage. Conductive hearing loss involves the<br />
external ear, the tympanic membrane, and/or the auditory ossicles. Perceptive<br />
or sensorineural hearing loss involves the organ of Corti or any one<br />
of a number of sites along the auditory pathway, that is, the cochlear nerve<br />
or the auditory centers of the brain. Figure 14-7 indicates the audibility<br />
curve in man under ideal conditions (solid line) and under conditions
68O Bioastronautics Data Book<br />
(broken line) of audiometry. The threshold for feeling is also shown. At<br />
sound pressure levels in excess of 130 or 140 dB, sensations in addition to<br />
hearing are perceived. These can include discomfort, tickling, and, finally,<br />
pain.<br />
z<br />
140<br />
120<br />
100<br />
80<br />
.J<br />
UJ<br />
><br />
UJ 60<br />
.J<br />
>-<br />
Z<br />
UJ<br />
40<br />
Z 2O<br />
\<br />
Auditory System 681<br />
hereditary defect, the footplate of the stapes may become progressively<br />
fixed. If the disease is purely conductive and does not involve sensorineural<br />
elements as well, heating can be improved by surgery.<br />
--10<br />
¢n 0<br />
.-I<br />
ILl<br />
,',', lO<br />
0<br />
'- 20<br />
0<br />
Z 3O<br />
U)<br />
u) 40<br />
0<br />
-J 50<br />
(3<br />
z 6o<br />
o:<br />
682 Bioastronautics Data Book<br />
for both ears ascending in right and left tracts. Unlike conductive loss,<br />
sensorineural loss can be complete.<br />
Sensorineural loss comes about by a variety of agencies or events. These<br />
include hereditary and congenital conditions, disease, drug toxicity,<br />
presbycusis, and exposure to noise. Of these, the latter may well be far and<br />
away the greatest single cause. It may, indeed, include "presbycusis."<br />
Sensorineural hearing loss affects high frequency perception primarily, with<br />
ultimate progression t'o lower frequencies. Figure 14-9 is an audiogram<br />
showing heating loss characteristic of the gradual degenerative process in<br />
"presbycusis." High tones are lost first.<br />
125<br />
FREQUENCY IN CYCLES PER SECOND<br />
250 500 750 1500 3000 6000 8000<br />
-10 -10<br />
r.,o<br />
..j 0 0<br />
141<br />
m 10 10<br />
r,j<br />
,,, 20 20<br />
£3<br />
z 30 30<br />
ca 40 40<br />
O<br />
•J 50 50<br />
(3<br />
z 66 6O<br />
,,_ 70 " 70<br />
-r 80 • 80<br />
9O ( )" "( )" "<br />
• • 90<br />
100 _'_ "'_ 100<br />
AIR _ RIGHT<br />
BONE---- LEFT X"-----X<br />
Figure 14-9. Audiogram of profound sensorineural hearing loss. (From DeWeese, D. D., &<br />
Saunders, W. H. Textbook of Otolaryngology (3rd ed.) St. Louis: C. V. Mosby Co.,<br />
1968)<br />
When the human ear is exposed to excessively loud sounds, it shows a<br />
loss of .acuity to sound, that is, a rise in threshold. This is called<br />
"temporary threshold shift," and it will return to normal over a time<br />
regulated by the parameters of the sound causing it. If the sound is<br />
repeated, the return to normal may be less than complete and this may<br />
progress with repeated exposure, the residual hearing loss being designated<br />
as "permanent threshold shift." We presume that this is due to loss of hair<br />
cells in the organ of Corti.<br />
There is reason to believe that repetition of exposure over many years causes<br />
a gradual loss of hair cells, and consequent loss of hearing. This is known as
Auditory System 683<br />
boilermakers' disease, a tribute to a bygone profession, the like of which is<br />
reduplicated many times over in modem industry. The same thing has been<br />
noted to occur among individuals who have engaged in frequent small arms fire,<br />
such as soldiers, persistent hunters, skeet shooters, and the like. Significantly,<br />
Bredberg (1968) found many examples of a similar affliction in his review of a<br />
large number of elderly cases whose ears he examined at autopsy. Although he<br />
had relatively few whose noise-exposure history was known, there were enough<br />
to create the definite suspicion that he was dealing with chronic acoustic trauma<br />
rather than merely the ravages of age.<br />
Effects of High Intensity Pure Tones<br />
Total or partial deafness can result from damage to the hair cells of the<br />
cochlea. It is widely believed that there is a relationship between tonal frequency<br />
and position on the cochlear partition at which it vibrates with maximum<br />
amplitude. This vibration, if great enough, is believed to cause mechanical injury<br />
to hair cells. Further, it is believed that there is an approximately inverse relation<br />
between the logarithm of frequency and the distance from the base of the<br />
cochlea with relation to the site of damage. Greenwood's function is probably<br />
the best available expression for this relationship. It may be stated as follows:<br />
f = 253(100A°5x -1)<br />
Since stress equals mass times acceleration per unit area, and the mass of the<br />
cochlear partition is thought to be the same over its entire length (Schuknecht &<br />
Tonndorf, 1960), the stress on any segment of the cochlear partition duriug<br />
displacement will be directly proportional to its acceleration. Since acceleration<br />
varies directly with frequency, high frequencies will produce greater stress in the<br />
region of maximum amplitude than do lower frequencies. High frequencies<br />
should, therefore, cause greater hair cell damage.<br />
In addition to mechanical stress, it is thought that prolonged exposure to<br />
acoustic stimuli damages the hair cells by exhausting cytochemical or enzymatic<br />
materials in the cells (Beagley, 1965; Engstrtm & Ades, 1960). Outer hair cells<br />
are more sensitive to this type of destruction.<br />
Recently, Stockwell, Ades, and EngstrOm (1969) studied the effects of high<br />
intensity noise (130 to 150 dB) on the hair cells of the guinea pig cochlea, which<br />
is similar in all important respects to the human cochlea. Various aspects of both<br />
the mechanical and chemical theories of hair cell destruction were investigated as<br />
were the relationship between exposure frequency and the site of hair cell<br />
damage and the effects of exposure time on damage. Table 14-1 shows the plan<br />
of exposure for the animals in this experiment.<br />
The study reconfirmed that maximum damage bears some relation to<br />
exposure frequency, but as frequency increases, the position of maximum<br />
damage tends to move in the basalward direction. Figure 14-10 shows mean<br />
damage curves for animals exposed to 130 dB. (The arrows indicate the position
684 Bioastronautics Data Book<br />
of maximum stimulation for exposure frequency calculated with Greenwood 's<br />
formula.) Figure 14-11 shows mean damage curves for 150 dB exposures. These<br />
indicate that inner hair cell damage is complete after 1 hour, but outer hair cell<br />
damage increases between 1 and 4 hours.<br />
Frequency<br />
4000 Hz<br />
2000 Hz<br />
1000 Hz<br />
500 Hz<br />
125 Hz<br />
2000 Hz<br />
1000 Hz<br />
125 Hz<br />
Table 14-1<br />
Plan of Exposures<br />
Exposure Duration<br />
l<br />
1 Hour I<br />
t<br />
130 dB<br />
4 Hours<br />
16 ears/10 animals<br />
2 ears/1 animal<br />
4 ears/2 animals<br />
6 ears/3 animals<br />
4 ears/2 animals<br />
(From Stockwetl, Ades,& Engstr_m, 1969)<br />
150 dB<br />
8 ears/4 animals<br />
6 ears/3 animals<br />
6 ears3 animals<br />
4 ears/2 animals<br />
4 ears/2 animals 2 ears/1 animal<br />
1 ear 2 ears/1 animal<br />
18 ears/9 animals 1 ear<br />
These results suggest that at higher frequencies, mechanical stress is the<br />
important mechanism of hair cell damage; furthermore, outer hair cells are more<br />
affected than inner hair cells. At lower frequencies, the same sound pressure<br />
levels produce less mechanical stress, so hair cell damage may result from<br />
gradually accumulating effects of stimulation, that is, enzyme exhaustion. Outer<br />
hair cells also appear to be more sensitive than inner hair cells to this latter type<br />
of damage.<br />
Effect of Impulse Noise<br />
Impulse noise (see also chapter 15) is the type of noise produced, for<br />
example, by small arms fire and certain children's toys, notably cap pistols. This<br />
type of noise, considered dangerous when it exceeds 140 dB at a distance of less<br />
than 20 cm (NAS, 1965), produces mechanical destruction of hair cells<br />
comparable in severity to that produced by prolonged exposure to high intensity<br />
pure tones. Figure 14-12 shows hair cell damage demonstrated by Poche,<br />
Stoekwell, and Ades (1969) in a guinea pig exposed to impulse noise and one<br />
exposed to pure tone. Distribution of damage along the organ of Corti is<br />
indicated. Table 14-2 indicates overall hair cell damage. The figure shows<br />
considerable variation in susceptibility to damage. [n ears that did sustain<br />
damage in this study, outer hair cells (OHC) were more susceptible than inner
Auditory System 685<br />
hair cells (IHC) (a finding one might expect when the mechanism of damage is<br />
mechanical stress). When damage due to cap gun exposure is plotted against<br />
damage caused by pure tone noise (figure 14-13), it is clear that cap gun<br />
exposures produce damage equal in severity to a 4-hour exposure to 2000 Hz<br />
tone of 125 to 130 dB.<br />
'V 4000 Hz 40<br />
A 60 130 dB<br />
I _lour 20<br />
_[ ,t tilit JIiL liLlil I I 0 l<br />
.j I Hour 20<br />
"llli_lj_lJl_ LLI_J _L 0<br />
- so ,oc:-..!'"..'"'".'. _._ ._._- -o<br />
60 i " E<br />
_ I: ,oooH,1',o- ,000H,t<br />
-- t ' HOUr I 20 - 4 HOUr' 1<br />
tl I i _ * _ _ , d I L q 0 "ll_l,.lia,_l .... II Lil/<br />
sooH,t 40[;:.: SO0H,I<br />
L , Hour_t_°L 4 .ou,. 1<br />
[liittlll iliiJ , LILI J *] O /dill I d il4 ' I'' * Jl* i[_l<br />
I- .:'"" -t 60t-,., -,,,,"<br />
"1'oh":<br />
1<br />
't<br />
I: "' H':1'°1: "'"'t<br />
L i sou,1 z°L 4 Hou,,1<br />
/lillt |tili ILl lllj i h tl 0 [llll I It I_iliil,iL _l_l<br />
20 i5 iO 5 _0 iS iO 5<br />
MI LLIMETERS FROM BASAL END<br />
Figure 14-10. Mean damage curves for groups exposed to 130 dB SPL. The small arrow<br />
above each curve indicates the position of maximum stimulation for the exposure<br />
frequency. (Stockwell, Ades, & Engstf6m, 1969; reprinted by permission of the Annals of<br />
Otology, Rhinology, and Laryngology)<br />
The scanning electron microscope has been a further blessing for the study<br />
of the structure of the ear. For example, this device has made it possible to see<br />
changes in the surfaces of hair cells not visible by other means. We have observed<br />
the hair cells of the cochlea alongside a serious lesion, that is, one in which the<br />
acoustic papilla had been reduced to a simple epithelium (figure 14-14). On<br />
either side of the lesion, numbers of hair cells are distorted in that the hairs are<br />
fused, overgrown, or both (figure 14-15). It is not known to what extent these<br />
cells are functional, but it seems probable that they are not, inasmuch as the
686 Bioastronautics Data Book<br />
damage to hearing is considerably wider in terms of frequency than would be<br />
true if only the cells visibly damaged in surface specimen (Engstr_m, Ades, &<br />
Andersso,, 1966) were functionally impaired. This then, would represent an<br />
intermediate stage of damage in which the hair cell was not completely<br />
destroyed, but was functionally impaired while retaining its viability.<br />
_1<br />
0<br />
z<br />
t-<br />
Z<br />
w<br />
0c<br />
.....j,oo<br />
•"" A 80<br />
60<br />
NORMAL 40<br />
20<br />
tllltllltJtlllJll±_ 0<br />
20 15 I0 5<br />
150 dB<br />
20 15 I0 5 20 15 I0 ,5<br />
MILLIMETERS FROM BASAL ENO<br />
Figure 14 It. Mean damage curves for groups exposed to I50dB SPL. The smM! arrow<br />
above each curve indicates the position of maximum stimulation for the exposure<br />
frequency. (Stockwell, Aries, & Engstr_m, 1969; reprinted by permission of the Annals of<br />
Otology, Rhinology, and Laryngology)<br />
It is important to note that in these experiments, among the methods<br />
of light/phase contrast, electron, and scanning electron microscopy, each has<br />
its place in the study of the pathological cochlea, and none will stand<br />
alone. Similarly, in the study of the noise-damaged cochlea, it is imperative<br />
that each cell be seen in its proper place in relation to the other hair cells,<br />
for otherwise, it is impossible to observe all the damage and relate it<br />
appropriately to the intact regions.
Io0<br />
9O<br />
_1<br />
" 80<br />
iii<br />
<<br />
"i- 6O<br />
_1<br />
<<br />
:; 50<br />
I1-<br />
0 40<br />
Z<br />
I-<br />
Z 30<br />
w<br />
rr ZO<br />
w o.<br />
I0<br />
Auditory System 687<br />
,00 tJ_ oooooo;]oo o o ooo_ o o _-_'_''_ °°'' _-°-_e e_ _ _8°_ i-<br />
_ 80 ,<br />
a: 7O<br />
3: gO<br />
"J GP SIR<br />
II:<br />
_40 • OHC<br />
:, _o ,_\,_,_<br />
w<br />
o: ZO<br />
IO<br />
o<br />
20 19 18 17 16 I,_ 14 I_, 17 II I0 9 e • + 5 4 3 2 I 0<br />
MM FROM BASE<br />
(b)<br />
Figure 14-12• Percent hair-cell damage plotted as a function of distance from basal end of<br />
the organ of Corti. (a) Left ear of an animal exposed to 500 rounds of cap-gun fire at<br />
30 cm. (b) Right ear of an animal exposed for 4 hours to a 2000-Hz tone at 130 dB.<br />
(Poche, Stoekwell, & Ades, 1969)
688 Bioastronautics Data Book<br />
uJ<br />
L9<br />
<<br />
<<br />
Q<br />
..J<br />
_J<br />
it,<br />
tv-<br />
"1-<br />
Iz<br />
LU<br />
n"<br />
LU<br />
,oo<br />
8o<br />
6o<br />
4o<br />
20;<br />
o<br />
• o.c<br />
D IHC /<br />
@<br />
e/ PISTO L<br />
@<br />
i i i i<br />
120 130 140 150<br />
2000-Hz EXPOSURE INTENSITY (db)<br />
Figure 14-13. Comparison of overall hair cell damage produced by a 2000-Hz tone and by<br />
cap-pistol fire. Damage is plotted separately for IHC and OHC as a function of pure-tone<br />
exposure intensity. (Poche, Stockwell, & Ades, 1969)<br />
Table 14-2<br />
Overall Hair Cell Damage (Percent) in Ears From Unexposed Animals<br />
and From Animals Exposed to 500 Rounds of Cap-gun Fire<br />
Maximum<br />
Minimum<br />
Mean<br />
Maximum<br />
Minimum<br />
Mean<br />
IHC OHC 1 OHC 2 OHC 3<br />
0.73<br />
0.00<br />
0.29<br />
33.04<br />
0.05<br />
10.37<br />
(From Poche, Stockwell, & Ades, 1969)<br />
Normals 12 ears)<br />
1.39 2.11<br />
0.19 0.33<br />
0.58 1.21<br />
Cap Gun (27 ears)<br />
55.19 56.84<br />
0.23 0.93<br />
17.80 18.86<br />
3.30<br />
2,40<br />
3.08<br />
54.18<br />
2.53<br />
21.50
OC<br />
Auditory System 689<br />
Figure 14-14. Scanning electron micrograph of one-quarter turn of cochlea of guinea pig<br />
exposed to 4000 Hz. MO = modiolus_ OC = organ of Corti; TM = rectorial membranc_ lcston<br />
between arrows. Note abruj_t character of lesion, and simple epithelium replacing acoustic<br />
papina. (breaberg, Acles, & Engstrfm, in press)<br />
Figure 14-15. Highly magnified scanning electron micrograph of ten outer hair cells of<br />
gmn"ea pig, showing abnormal stereocilia. Arrow points to a giant stereoeilia. Other cells<br />
show varying degrees of abnormality. (Bredberg, Ades, Engstr_m, in press)
690 Bioastronautics Data Book<br />
References<br />
Ades, H. W. Central auditory mechanisms. InJ. Field, H. W. Magoun, and V. E. Hall (Eds.),<br />
Handbook of physiology. Washington, D.C.: American Physiological Society, 1959.<br />
Beagley, H. A. Acoustic trauma in the guinea pig: Eiectrophysiology and histology. Acta<br />
Oto-Laryngologica, 1965, 60, 437.<br />
Bekesy, G. V. Experiments in hearing, tn E. G. Wever (Ed.), New York: McGraw-Hill Book<br />
Co., Inc., 1960.<br />
Bekesy, G. V. Sheafing microphonics produced by vibrations near the inner and outer hair<br />
cells. Journal of the Acoustical Society of America, 1953, 25, 783-790.<br />
Bekesy, G. V. The variation of phase along the basilar membrane with sinusoidal vibrations.<br />
Journal of the Acoustical Society of America, 1947, 19, 452-460.<br />
Bredberg, G. Cellular pattern and nerve supply of the human organ of Corti. Acta<br />
Oto-Laryngoiogica Supplement 136, 1968.<br />
Bredberg, G., Ades, H. W., & Engstr'6m, H. in press.<br />
Davis, H. Excitation of auditory receptors. InJ. Field, H. W. Magoun, and V. E. Hall (Eds.),<br />
Handbook of physiology. Washington, D.C.: American Physiological Society, 1959.<br />
Department of the Navy, Bureau of Medicine and Sul,gery. U,S. naval flight surgeon's<br />
manual. Washington, D.C.: U.S. Government Printing Office, 1968.<br />
DeWeese, D. D., & Saunders, W. H. Textbook ofotolaryngology. St. Louis: C. V. Mosby<br />
Company, 1968.<br />
Engstrfm, H., & Ades, H. W. Effect of high intensity noise on inner ear sensory epithelia.<br />
Acta Oto-Laryngologica Supplement 158, 1960.<br />
Engstriim, H., Ades, H. W., & Andersson, A. Structural pattern of the organ of Corti.<br />
Stockholm: Almqvist and Wiksell, 1966.<br />
Engsff6m, H., Ades, H. W., & Hawkins, H. E.. Jr. Cellular pattern, ncrve structures and fluid<br />
spaces of the organ of Corti. In W. D. Neff (Ed.), Contributions to sensoryphysioiogy.<br />
New York: Academic Press, 1965.<br />
Guild, S. R. Correlations of histologic observations and the acuity of hearing. Acta<br />
Oto-Laryngologica, 1932, 17, 20?-249.<br />
Kryter, K. D. Possible modifications to the calculation of perceived noisiness.<br />
NASA-CR-1636, National Aeronautics and Space Admininstration, Washington, D.C.,<br />
August 1970.<br />
Kryter, K. D., & Pearson, K. S. Some effects of spectral content and duration on perceived<br />
noise level. Journal of the Acoustical Society of America, 1963, 35, 866.883.<br />
National Academy of Sciences, National Research Council, Committee on Hearing and<br />
Bioaconstics, Working Group 46. Hazardous exposure to intermittent and steady state<br />
noise. Washington, D.C.: National Academy of Sciences, 1965.<br />
Poche, L. B., Stockwell, C. W., & Ades, H. W. Cochlear hair-cell damage in guinea pigs after<br />
exposure to impulse noise. Journal of the Acoustical Society of America, 1969, 46,<br />
947-951.<br />
Rasmussen, G. L. Outlines of neuro_natomy. (3rd ed.) Dubuque, Iowa: William C. Brown,<br />
Co., 1943.<br />
Schuknecht, H. F., & Tonndorf, J. Acoustic trauma of the cochlea from ear surgery.<br />
Laryngoscope, 1960, 70, 479.<br />
Stevens, S. S. Procedure for calculating loudness: Mark VI. Journal of the Acoustical<br />
Society of America, 1961, 33, 1577-1585.<br />
Stockwell, C. W., Ades, H. W., & Engstr6m, H. Patterns of hair cell damage after intense<br />
auditory stimulation. Anna/s of Otology, Rhinology, and Laryngology, 1969, 78, 1144.
Auditory System 691<br />
Wells, R. J. Recent research relative to perceived noise level. Journal of the Acoustical<br />
Society of America, 1967, 42, 1151.<br />
Wever, E. G. Theory ofhcaring. New York: John Wiley & Sons, 1949.<br />
Wever, E. G., & Lawrence, M. Physiological acoustics. Princeton: Princeton University Press,<br />
1954.<br />
Whitfield, I. C. The auditory pathway. Baltimore: Williams & Wilkins Company, 1967.
CHAPTER I5<br />
NOISE AND BLAST<br />
by<br />
David C. Hodge, Ph.D.<br />
and<br />
Georges R. Garinther<br />
Aberdeen Proving Ground<br />
Noise and blast problems may occur in all phases of aerospace activities.<br />
Tremendous quantities of acoustical energy are developed by rocket engines on<br />
the launch pad and during lift-off, and this may affect ground personnel as well<br />
as the crew on board the space vehicle. As payloads become larger and boosters<br />
increase in size and power, significant increases in noise and blast problems may<br />
be expected. Noise from equipment used in assembling and static testing of<br />
'boosters and payloads may adversely affect ground-support personnel. In<br />
mission-control centers, noise from computers and monitoring devices may<br />
interfere with voice communications. Current evidence suggests that noise and<br />
blast problems in future space operations may be more severe at ground-service<br />
crew locations and in nearby communities than in the space vehicles themselves.<br />
However, control of noise levels inside spacecraft will still require consideration<br />
in assessing the likelihood of mission success.<br />
The most significant effects of noise and blast on man are damage to hearing,<br />
masking of speech and warning signals, and annoyance. In addition, noise<br />
interferes with some of man's sensory and perceptual capabilities and thereby<br />
may degrade critical task performance. Noise also produces temporary or<br />
permanent alterations in body chemistry.<br />
This chapter describes the noise and blast environment. It provides a<br />
definition'of units and techniques of noise measurement and gives representative<br />
booster-launch and spacecraft noise data. It reviews the effects of noise on<br />
hearing sensitivity and performance and discusses briefly community response to<br />
noise exposure. Physiological, or nonauditory, effects of noise exposure are also<br />
Reviewed by Henning E. yon Gierke<br />
693
694 Bioastronautics DataBook<br />
treated,asare designcriteriaandmethodsfor minimizingthe effectsof<br />
noiseon hearingsensitivityandon communications. Thereferences citedin<br />
thischapterelateprimarilyto researchconducteduringthepast10years<br />
in theUnitedStatesandseveral foreigncountries.<br />
Definitions and Units<br />
Descriptionof the Noise and Blast Environment<br />
Airborne sound refers to a rapid variation in ambient atmospheric<br />
pressure. By definition, noise is unwanted sound. Steady-state noise is a<br />
periodic or random variation in atmospheric pressure which has a duration<br />
in excess of lO00milliseconds. Impulse noise is a nonperiodic variation in<br />
atmospheric pressure which has a duration of less than lO00msec, and a<br />
peak to root-mean-square (RMS) ratio greater than 10 decibels (dB). Blast is<br />
an anomalous term, but is most frequently used to describe very' large<br />
amplitude and/or long duration pressure waves accompanying tile discharge<br />
of large-caliber w¢_apons, the ignition of rocket motors, or the detonation of<br />
conventional and nuclear explosives. Taken together, sound, noisc, and blast<br />
all refer to airborne acoustical phenomena whose energy may be described<br />
both in terms of their physical characteristics (amplitude, frequency content,<br />
and/or duration)and their effects on man's physiology and behavior.<br />
Amplitude The amplitude of sound at any given point is expressed as<br />
sound-pressure level (SPL). Its physical unit is the decibel which is given as:<br />
SPL = 20 log (P/Po) in dB<br />
wbere p = the sound pressure being measured; and Po =a reference<br />
pressure, usually 20 mieronewtons per square meter (/aN/m2). The reference<br />
pressure of 20/.tN/m 2 is approximately equal to thc lowest pressure which a<br />
young person with normal hearing can barely detect at a frequency of<br />
1000 llertz (Hz). Other measures of sound pressure may be encountered in<br />
the literature, such as dynes per _uare centimeter (dyn/cm2), microbar<br />
(_bar) and pounds per square inch (psi). Table 15-1 shows the relationship<br />
[_tween t\_ur such measures.<br />
Common examples of representative SPL include:<br />
A business office 50 dB<br />
Speech at 3 feet 65<br />
Subway at 20 feet 95<br />
Jet aircraft at 35 feet 130<br />
Atlas launch at 150 feet 150<br />
On gantry during Saturn V launch 172.
dB<br />
0<br />
14<br />
34<br />
54<br />
74<br />
94<br />
114<br />
134<br />
154<br />
174<br />
Noise and Blast 695<br />
Table 15-1<br />
Relationship Between Decibels, Newtons/Meter 2,<br />
. .x-<br />
Mlcrobar , and Pounds/Inch 2<br />
NIm 2<br />
0.00002<br />
0.0001<br />
0.001<br />
O.01<br />
0.1<br />
1<br />
10<br />
100<br />
1000<br />
10000<br />
*Also note that 1 #bar = 1 dyn/cm 2.<br />
_bar PSI<br />
0.0002 2.94 X 10 -9<br />
0.001 14.70 X 10 -9<br />
0.01 147.0 X 10⁻⁹<br />
0.1 1.47 X 10⁻⁶<br />
1 14.70 X 10⁻⁶<br />
10 147.0 X 10 -6<br />
100 1.47 X 10 -3<br />
1000 14.70 X 10 -3<br />
10000 147.0 X 10 -3<br />
100000 1A7<br />
Velocity. The speed of sound is dependent only upon the absolute<br />
temperature of the air, assuming that air behaves as an ideal gas. The equation<br />
for the speed of sound (C) in meters per second is:<br />
C = 20.05 _ m/sec<br />
where T is the absolute temperature in degrees Kelvin (273.2 ° plus the<br />
temperature in degrees Centigrade). Thus the speed of sound at 21.1 ° C is about<br />
344 m/sec.<br />
In English units:<br />
C = 49.03 V/-ff ft/sec<br />
where R is the temperature in degrees Rankine (459.7 ° plus the temperature in<br />
degrees Fahrenheit). Again, at 70°F, the speed of sound is about 1128 ft/sec.<br />
Wavelength. The wavelength (X) of a sound is the distance the wave travels<br />
during one period or cycle. It is related to the speed of sound and to frequency<br />
by the equation:
696 Bioastronautics Data Book<br />
where c = speed of sound (m/se'c or ft/sec), and f -- frequency (Hz). For<br />
example, during one period a 100 tlz wave would move 3.44 meters or 11.3 feet<br />
at 70°F (21.1°C). It is helpful to keep in mind that as frequency increases,<br />
wavelength becomes shorter.<br />
Frequency. The unit of frequency is Hertz (Hz) or cycles per second (cps).<br />
Nominally, the range of aurally detectable sounds is 20 to 20,000 Hz. Pressure<br />
oscillations at frequencies above this range are called ultrasonic. These<br />
frequencies cannot normally be heard by man but they do produce some<br />
biological effects and will be discussed in a later section. The effects of<br />
infrasonic frequencies (
NoiseandBlast 697<br />
Rise Time is the time taken for the single pressure fluctuation that forms<br />
the initial or principal positive peak to increase from ambient pressure to the<br />
peak pressure level.<br />
Pressure Wave Duration (A-_D_ is the time required for the<br />
pressure to rise to its initial or principal positive peak and return momentarily to<br />
ambient pressure.<br />
Pressure Envelope Duration (B-Duration) is the total time that the<br />
envelope of pressure fluctuations (positive and negative) is within 20 dB of the<br />
peak pressure level. Included in this time would be the duration of that part of<br />
any reflection pattern that is within 20 dB of the peak pressure level.<br />
Psychological Terms. The measures of loudness are the phon and the sonc.<br />
Sones are obtained by a conversion of eight octave bands into sones from an<br />
appropriate table. The phon is merely a transformation of the sone into a<br />
logarithmic scale. Sounds that are perceived as equally loud to the human ear<br />
will have the same sone or phon value. The mel is used as a subjective measure of<br />
the pitch differences in frequency between sounds.<br />
Propagation of Sound<br />
In an ideal, homogeneous, loss-free atmosphere SPL decreases, through<br />
spherical divergence, inversely with distance in the far field. That is, there is a<br />
6 dB decrease in SPL for each doubling of distance from the source. In addition,<br />
when sound travels through still, homogeneous air, a significant amount of<br />
energy is extracted through "molecular absorption" which is related to the<br />
relaxation behavior of the oxygen molecules. This excess attenuation depends<br />
not only on frequency, but also on temperature and humidity and is in addition<br />
to losses resulting from spherical divergence. Figure 15-1 shows engineering<br />
estimates of excess attenuation as a function of distance and frequency for air<br />
temperatures ranging from 0 ° to lO0°F and over a relative humidity range from<br />
10 to 90 percent. Data are given for the preferred octave bands ranging from<br />
500 to 8000 Hz. While there is some absorption in the lower bands, it can<br />
usually be neglected. A more complete discussion of atmospheric absorption is<br />
provided by the Society of Automotive Engineers (SAE) (1964).<br />
In certain cases "classical ab_rption" should also be considered. Classical<br />
absorption is proportional to the frequency squared, is independent of humidity,<br />
and its effects typically are much less than those of molecular absorption<br />
(Nyborg & Mintzer, 1955).<br />
In addition to the preceding, the refraction of sound waves produced by<br />
meteorological conditions between the earth's surface and altitudes of 3 to<br />
5 kilometers must be considered. This phenomenon may cause sound waves<br />
produced at or near the surface of the earth to be focused near residential areas<br />
adjacent to rocket launch sites (Perkins et al., 1960). This refraction is due to<br />
changes in velocity of sound with altitude, and it is caused by variations in<br />
temperature, humidity and wind with altitude. The SPL for various refraction<br />
487-858 (9 - 73 - 45
698 Bioastronautics Data Book<br />
_o |t-- I I I I I 1 I I I I I l I I I f I 1 I 1 1 | I<br />
4th OCTAVE BAND<br />
_165/710 HZ<br />
aTOTA_" S GMF 500 Hz RELATIVE HUMIDITY (%)<br />
{dB/1000 FT) o _10 _NtLP*ItV¢ MUM/I<br />
O. TOTA L 5<br />
IdB/1000 FT)<br />
5Ih OCTAVE BAND<br />
10 710/1400 HZ<br />
GMF 1000 HZ<br />
0<br />
zO<br />
6th OCTAVE BAND<br />
RELATIVE HUMIDITY (%)<br />
-- t 400/2800 HZ q<br />
GMF 2000 HI RELATIVE HUMIDITY (%)<br />
(dB/1000 FT) 30<br />
a<br />
r- _,o -11 1<br />
oF ] I I I I l I I t l ] I I I l 1 I I 1 I I i I<br />
o _o zo 3o 40 so so 70 Io go Ioo<br />
TEMPERATURE (°F)<br />
lO "q_ RELATIVE<br />
; i I I1 I I I i I 1 l i _ i I I i i i ! f<br />
3O GMF2800R(IO0 _7th OCTAVE40_OBAND HzB AN D_<br />
HUMIDITY I%)<br />
aTOTAI_ 30<br />
klB/I QIDOFT}<br />
aTOTAL<br />
(dB/t000 F1<br />
o<br />
5q500111,200 HZ HUMIDSTY 1%)<br />
F eGO0 Hz<br />
I I I I I I<br />
o ;o _ 3o 4o _ eo 70 8O gO IOO<br />
TEMPERATURE (°FI<br />
Figure 15-I. Atmospheric absorption coefficients for octave bands of noise<br />
for different temperatures. (Society of Automotive Engineers, 1964)<br />
oGM
Noise and Blast 699<br />
conditions and their focal points may be calculated by a modified ray acoustic<br />
method if the directivity characteristics of the source are known. Experience has<br />
shown, though, that quite often the effects of refraction and focusing do not<br />
occur and the SPL approaches that predicted for a homogeneous medium.<br />
Although those conditions causing focusing do sometimes occur in the Cape<br />
Kennedy area, they are not prevalent (Chenoweth & Smith, 1961).<br />
Noise Measurement.<br />
The basic measuring system for evaluating the physical characteristics of<br />
noise to relate them to their effect on man consists of the following elements:<br />
1. transducer (microphone)<br />
2. electronic amplifier and calibrated attenuator<br />
3. data storage<br />
4. octave-band analyzer<br />
5. read-out.<br />
The ci_oice of instrumentation for a particular situation must be based upon a<br />
knowledge of the limitations and capabilities of the various types of<br />
instrumentation available. Normally, the weakest item of a measuring system is<br />
the transducer (microphone). Most of the discussion will, therefore, center<br />
around tile selection of transducers and the techniques to be used in measuring<br />
steady-state and impulse noise. The associated equipment will naturally require<br />
characteristics which are as good as, or better than, those of the microphone<br />
selected.<br />
Steady-State Noise. Microphones are available in a variety of sensitivities.<br />
When very" low noise Levels are to be measured, the minimum SPL to which a<br />
micropilone can respond should be the determining factor in seicction. It must<br />
also be ascertained that the self-noise of the microphone (and the entire<br />
measuring system for that matter) is at least 10 dB below the noise that is to be<br />
measured in each octave band of interest. On the other hand, for measuring<br />
high-level noises such as those produced by rocket engines, the choice of<br />
microphone to be used will be linfited by the maximum SPL to which the<br />
microphone can respond without excessive distortion or failure. After the<br />
preceding two considerations have narrowed the selection, the microphone that<br />
should be selected is the one having the smoothest frequency response over the<br />
range of interest.<br />
The frequency response of most microphones varies with the direction of<br />
arrival of the sound wave. At low frequencies (below 1 kHz), where the size of<br />
the microphone is small in relation to the wavelength of sound, microphones are<br />
omnidirectional. However, at higher frequencies the direction in which the<br />
microphone is pointed, or its incidence angle s , must be carefully considered.<br />
_The incidence angle for most microphones is that angle subtended between its longitudinal<br />
axis and a line drawn between the noise source and the microphone.
700 Bioastronautics Data Book<br />
The manufacturer's specifications should be consulted to obtain the incidence<br />
angle which provides the smoothest possible frequency response.<br />
If a moving noise source is to be measured, a microphone which has its best<br />
response at 0° (normal) incidence should not be used since the measured<br />
spectrum will change with noise-source location. Therefore, in this case, it would<br />
be desirable to select a microphone with good response at 90 ° (grazing)<br />
incidence and to position it so the moving noise source is always at 90 °<br />
incidence to the microphone.<br />
Impulse Noise and Blast. The measurement of impulse noise presents several<br />
problems which must be discussed separately. The principal limitations in the<br />
measurement of impulse noise lie in the ability of the transducer and its<br />
associated equipment to respond to the pressure pulse accurately (Garinther &<br />
Moreland, 1965; Coles & Rice, 1966). The minimum qualities of the transducers<br />
and associated equipment for such measurements are:<br />
1. A good phase response.<br />
2. A uniform amplitude response characteristic over a wide frequency range.<br />
[A bandwidth of from 100 Hz to 70 kHz is adequate for measuring most short<br />
duration impulses such as from small arms, but longer duration impulses such as<br />
from large caliber weapons and sonic booms require an extension of the low<br />
frequency response, and may permit relaxation of the upper limit (Crocker,<br />
1966).1<br />
3. Less than 1.5 dB ringing and overshoot at the pressure being measured<br />
(ringing should be completely damped after 100/.tsec).<br />
4. Rise time capability of 10 #sec or less at the pressure being measured.<br />
5. Sufficient robustness to withstand damage from the pressure pulse being<br />
measured.<br />
6. Mounting of all apparatus to eliminate microphonics.<br />
7. Sufficient sensitivity to allow a signal-to-noise ratio of 25 dB or greater.<br />
8. Minimum drift caused by temperature instability.<br />
The angle of microphone incidence is even more important for measuring<br />
impulse noise than for measuring steady-state noise. Garinther and Moreland<br />
(1965) have shown that at 0° (normal) incidence, the measured peak pressure<br />
level of various microphones may differ by as much as 10 dB. Since the peak<br />
readings obtained from various microphones should theoretically be, and were in<br />
fact found to be, in good agreement at 90 ° incidence, the transducer should be<br />
oriented for impulse-noise measurements at an angle of 90 ° (grazing incidence)<br />
between the longitudinal axis of the transducer and the direction of travel of the<br />
pressure pulse or shock wave.<br />
With the transducer positioned at grazing incidence, rise-time characteristics<br />
will be affected by the transit time of the wave across the sensing dement.<br />
Therefore, it is necessary that the transducer selected have a sensitive diameter<br />
of about 4mm or less.
NoiseandBlast 701<br />
Twoprecautionsmustbe statedregarding themeasurement andanalysis<br />
of short-durationimpulsenoise.First, great care must be taken in<br />
interpretingtheresultsof a frequencyanalysis. [Pease(1967)haspublished<br />
a computerprogramfor spectrumanalysisof impulsenoises.]Second, in<br />
tape recordingimpulsenoiseit has beenfound necessary to useFM<br />
recordingequipment. "Direct"(AM)taperecordingproducesphaseshiftof<br />
frequencyvs.time whichdistortsthe pressure-time historyof animpulse<br />
noise.<br />
Prediction of Launch Noise<br />
The primary sources which must be considered in assessing missionassociated<br />
noises are: (1)static and preflight tests, (2)launch, and<br />
(3) flight operations. Consideration must be given to how each of these<br />
phases of propulsion system noise affects the crew, ground-support<br />
personnel, and the surrounding community.<br />
In addition to the propulsion system, noise generated within the<br />
command module must be carefully assessed with regard to its long-term<br />
effects upon the crew. In space, the only sources which need to be<br />
considered are those generating noise within the capsule and any structureborne<br />
noise.<br />
The potential noise environment should be defined as early as possible<br />
in the development of a system. Techniques are available for predicting<br />
from a knowledge of certain parameters the sound spectrum of a propulsion<br />
system. These have been shown to be accurate to within a few decibels. A<br />
brief discussion of these follows, but the reader should consult Wilhold et<br />
al. (1970) to obtain an understanding of the computations.<br />
The area surrounding the rocket must be divided into three regions to<br />
be properly analysed. In the acoustic near field (within 1 X) no accurate<br />
predictive technique exists. The second region is the mid-field (3-5X). Here<br />
it is possible to calculate a dimensionless spectrum function and source<br />
position which is dependent upon frequency, using techniques outlined in<br />
Dyer (1958). From these, and the known parameters of the propulsion<br />
system, the acoustic environment may be determined. The far field of the<br />
noise produced by the launch of a rocket is the area with which we are<br />
most concerned in dealing with the effects of noise upon man. The<br />
predictive method for this region is quite involved and is described in detail<br />
by Wilhold et al. (1963). Excess attenuation and meteorological effects<br />
described in an earlier section must, if appropriate, be included in<br />
computation. This technique has proven to be very accurate in predicting<br />
the band pressure levels of several rocket systems.<br />
The acoustic environment of advanced Saturn V vehicles has been<br />
calculated for strap-on configurations having 13.1 million and 32million<br />
pounds of thrust (Wilhold et al., 1970). These are shown in figures 15-2<br />
through 15-5.
702 Bioastronautics Data Book<br />
150,<br />
14o-<br />
¢_ 130 --<br />
0{3<br />
n-J 120 -ct}<br />
d<br />
< 110-rr"<br />
o<br />
I_ 1013-<br />
× 90-<br />
<<br />
_E<br />
80<br />
I I I I | ! I f<br />
I I I I I I 1 I<br />
y<br />
3 6 9 12 15 18 21 24 27<br />
DISTANCE FROM LAUNCH SITE TO OBSERVATION POINT (kin)<br />
Figure 15-2. Maximum anticipated overall SPL for Saturn V MLV configuration<br />
of 32.0 million lb of lhmst, as a function of distance from launch pad. (Wilhold ¢t al., 1970)<br />
140<br />
_. 130--<br />
oJ<br />
(:0<br />
J<br />
120 --<br />
uJ<br />
><br />
LU<br />
.j 110--<br />
D<br />
mm 100-w<br />
121<br />
z 90--<br />
<<br />
rft<br />
< 8o--<br />
I.-<br />
o<br />
7o<br />
i 11 I I I r i i I i f<br />
310SEC AFTER LAUNCH<br />
GROUND RADIUS 4,5kin (15 000 FT)<br />
OASPL : 134.37dB<br />
I I I It I I I II I I<br />
I I<br />
10 100<br />
FREQUENCY (Hz)<br />
1000<br />
Figure 15-3, Predicted octave band pressure level spectrum at 4.5 km<br />
from Saturn V MLV launch (32 million lb thrust). (Wflhold et al., 1970)
5<br />
140<br />
130<br />
120<br />
110<br />
lOO<br />
90<br />
8O<br />
7o<br />
997 SEC AFTER LAUNCH<br />
Noise and Blast 703<br />
GROUND RAOIUS = 165 km (55 000 FT}<br />
OASPL = 11779 {dB)<br />
, i i 1 l i i |l I I i i i i i<br />
1.o lo lOO lO0O<br />
FREQUENCY {Hzl<br />
Figure 15--4. Predicted octave band pressure level spectrum at 16.5 km<br />
from Saturn V MLV launch (32 n_llion lb thrust). (Wilhold et al., 1970)<br />
©<br />
\<br />
lo lo_ 1oco lo.ooo<br />
Figure 15-5. Predicted spectra for 3vehicle stations for a 13.1million lb thrust<br />
configuration. (Saturn V with four 1.4 million lb thrust strap-on units.)(Wilhold et al.,<br />
1970)<br />
330 FT<br />
165 F T<br />
OFT
704 Bioastronautics Data Book<br />
Apollo Launch Noise<br />
Detailed measurements of Apollo launch noise have been made at many<br />
positions in and around Cape Kennedy Launch Complex 39A. The range of<br />
octave-band SPL around the vehicle at a distance of 400 meters is shown in<br />
table 15-2. Also shown are the maximum levels achieved on the side of the<br />
gantry closest to the rocket 10 m above ground.<br />
Table 15-2<br />
Octave Band Pressure Levels Around an Apollo Launch<br />
at a Distance of 400 Meters and on the Gantry 10 Meters Above Ground<br />
Center Frequency (Hz)<br />
16<br />
31<br />
63<br />
125<br />
250<br />
50O<br />
1000<br />
20OO<br />
4000<br />
*re 20 #N/m 2.<br />
800O<br />
(J.F. Kennedy Space Center, 1969a)<br />
At 400 Meters<br />
122 -- 143<br />
136 --155<br />
141 -- 157<br />
136 -- 158<br />
135 -- 158<br />
130 --152<br />
129 -- 149<br />
127 -- 146<br />
125 -- 142<br />
120 - 139<br />
116 --138<br />
118 -- 136<br />
110 --131<br />
Sound Pressure Level (dB)*<br />
On the Gantry<br />
The SPL to which the Apollo astronauts are exposed remains above<br />
85 dB for about 80seconds during liftoff (French, 1967). The maximum<br />
SPL achieved at the crew position is shown in table 15-3. Since the crew<br />
will be wearing helmets and space suits during launch, a conservative<br />
estimate of the actual SPL at the ear is also shown in table 15-3.<br />
It is important to note that the maximum SPL for the Apollo system<br />
occurs at very low frequencies, below 100 Hz. This noise, which is produced<br />
by the turbulent mixing of the booster propulsive flow with the<br />
surrounding atmosphere, will continue to become higher in intensity, and<br />
lower in frequency, as boosters increase in size and thrust. The very larg e<br />
boosters, such as Nova, will probably produce their maximum noise energy<br />
in the infrasonic region (below 20 Hz) (National Aeronautics and Space<br />
Administration, Marshall Space Flight Center, 1961).<br />
158<br />
163<br />
162<br />
159<br />
159<br />
164<br />
166<br />
168<br />
164<br />
161<br />
158<br />
156<br />
152
Noi_andBlast<br />
Table 15--3<br />
Sound l'ressure Level ill Crew Area and at Ear Position<br />
Center Frequency (Hz)<br />
(French, 1967)<br />
63<br />
125<br />
250<br />
50O<br />
1000<br />
2000<br />
of Apollo Astronauts at T + 60 Seconds<br />
Sound Pressure Level (dB)<br />
Crew Area Ear Position<br />
123<br />
123<br />
126<br />
125<br />
123<br />
120<br />
Low-frequency sounds must be measured accurately so research may be<br />
continued on the effects of these sounds on man. ttearing protective<br />
devices, such as helmets and circumaural muffs, provide their poorest<br />
protection at low frequencies (discussed further in a later section), so<br />
research must be continued on providing more efficient means of protecting<br />
man from the possible damaging effects of low-frequency sound. Also, as<br />
was discussed in the section on propagation of sound, low-frequency cnergy<br />
is least affected by excess attenuation. Therefore, these are the frequencies<br />
which are most likely to produce both physical and psychological effects in<br />
the communities surrounding launch areas.<br />
Spacecraft Noise Levels During Non-Powered Flight<br />
Apollo crew compartment noi_ measurements are shown in figure 15-6<br />
for non-powered flight. These data were acquired in the 2TV-I command<br />
module which was used for combined thermal/vacuum tests at the NASA<br />
Marshall Space Flight Center (MSFC) facility. Measurements were made with<br />
the internal environment controlled by the spacecraft life support system,<br />
and compartment pressure was maintained at about 5psia. During this<br />
simulated flight, the interior noise sources included the glycol pumps, cabin<br />
fans, suit compressors, B mags, inverters, and guidance and navigational<br />
systems.<br />
Effects of Noise and Blast on Hearing<br />
This section treats the factors influencing the acquisition and recovery<br />
of hearing loss for steady-state and impulse noise, and for blast (a special<br />
case of impulse noise). A basic understanding of the anatomy, physiology<br />
and functioning of the human auditory system is assumed. Readers not<br />
possessing this background may find a preliminary reading of chapter 14<br />
helpful.<br />
119<br />
116<br />
112<br />
106<br />
96<br />
89<br />
705
706 Bioastronautics Data Book<br />
o<br />
><br />
w<br />
5<br />
o<br />
=u<br />
..J<br />
==<br />
O<br />
Z<br />
70<br />
6O<br />
50<br />
40<br />
30<br />
70<br />
6O<br />
5O<br />
SO<br />
30<br />
-- GLYCOL PUMP; CABIN FAN; SUIT COMPRESSORS: B MAGS; GUIDANCE AND<br />
NAVIGATION SYSTEM; INVERTERS<br />
-- -- GLYCOL PUMP; INVERTERS<br />
....... CABIN FAN: INVERTERS<br />
I I 1 1 I l 1 1 1<br />
31 5 63 125 250 5(30 I000 2000 4000 8000<br />
,' • , ,=, ''l I i , . I .... I I . I . ,, I. I<br />
5 100 2 S 1000 2 5 10 000<br />
FREQUENCY (Hzl<br />
(a) 1/3 octave band pressure level in command module crew area.<br />
SUIT COMPRESSOR; INVERTER<br />
B MAGS; tNVERTERS<br />
...... GUIDANCE AND NAVIGATION SYSTEM; INVERTERS<br />
I l 1- I I I I I I<br />
31 5 63 125 _'_0 5OO 1000 2000 4000 8000<br />
.... o , I , ,,I.v<br />
s 100 2 s 1000 10000<br />
FREQUENCY (Hz)<br />
(b) 1/3 octave band preuure level in command module crew orea.<br />
Figure 15-6. Apollo crew compartment noise.<br />
160O0<br />
I<br />
I<br />
16O00<br />
I<br />
i
Types of Hearing Loss<br />
Noise and Blast 707<br />
The sensitivity of human hearing at a particular test frequency is<br />
referred to as the threshold of audibility. Thresholds stated with reference<br />
to standard criteria [such as ANSI-1951 or ISO-1964 audiometric zero<br />
(International Standards Organization)] are called hearing levels re the<br />
app,opriate reference level. When a loss of sensitivity is temporary, i.e., returns<br />
to baseline after a suitable recovery interval, it is referred to as a temporary<br />
threshold shift, or TTS. A loss of sensitivity which does not return to baseline is<br />
called a permanent threshohl shift, PTS. TTS is usually measured at 2 minutes or<br />
longer after exposure, and is referred to as TTS 2 min or, simply, TTS 2.<br />
Relation Between TTS and PTS<br />
Some relation is assumed to exist between TTS 2 experienced on a near-daily<br />
basis and the likelihood of eventual accumulation of PTS. CItABA (Committee<br />
on Hearing, Bioacoustics and Biomechanics) Working Group 46 (! 965) assumed<br />
that 10 years of near-daily exposure would result in PTSI0 yr=TTS2 min- TTS<br />
measures are widely used ill assessing noise effects on hearing because (1) TTS is<br />
a valid measure of the temporary effects of noise exposure, and (2) TTS can<br />
affect man's ability to perform tasks requiring maximum hearing sensitivity. In<br />
fact, where life-or-death decisions rest on the acuteness of man's hearing, as in<br />
astronauts' reception of speech signals, or in the perceiving of auditory warning<br />
signals, prevention of excessive TTS is the most important consideration.<br />
Absence of TTS may be responsible for saving a life or many lives. TTS will be<br />
used here as the primary indieant of noise effects on hearing threshold<br />
sensitivity.<br />
Susceptibility to TTS<br />
The concept of susceptibility refers jointly to the fact that for a given noise<br />
exposure, different ears demonstratc varying amounts of TTS, and for a given<br />
_mple of cars, difh_rent noise conditions may produce varying distributions of<br />
TTS. Because of the unpredictable and uncontrollable variability in ears'<br />
responses to noise--between days and among noise conditions--the possibili_ of<br />
developing criteria for protecting specific ears from excessive TTS is at best slim<br />
(Ward, 1968; l lodge & McCommons, 1966). As a result, criteria for determining<br />
what constitutes hazardous vs. nonhazardous noise exposures are, in reality, a<br />
form of actuarial or statistical tables in which tile responses of certain<br />
proportions of noise-exposed populations are predicted.<br />
Steady Sounds and Noise<br />
Acquisition of TTS. The many factors influencing the acquisition of TTS<br />
from steady sound and noise exposure have been reviewed by Ward (1963,<br />
1969) and Nakamura (1964). Some of the salient aspects are summarized below.<br />
When reading these, it should be kept in mind that the interaction of<br />
variables is a most important consideration. The present discussion will be limited<br />
primarily to TTS measured 2 minutes or longer after exposure.
708 Bioastronautics Data Book<br />
Stimulus Amplitude. TTS 2 increases linearly with average SPL over the<br />
range of 75 to 120 dB and possibly higher. The difference between TTS<br />
produced by 85- and 90-dB noise is about the same as the difference between<br />
that produced by 90- and 95-dB SPL. This relationship is illustrated in<br />
figure 15-7.<br />
,50<br />
4O<br />
20<br />
10<br />
J t I I<br />
80 85 90 95<br />
OCTAVE BAND SPL (dB)<br />
Figure 15-7. TTS at 4 kHz as a function of SPL for exposure to octave band<br />
of 2-4 kHz. Parameter is exposure time in minutes. (Shoji et al., 1966)<br />
Exposure Frequency. For equal SPL in octave-bands of noise, low<br />
frequencies present less hazard to the ear than higher frequencies up to 4 kHz.<br />
This is due to the frequency-response characteristics of man's ear. Figure 15-8<br />
illustrates the general relation between exposure frequency and TTS for octave<br />
bands of noise.<br />
Pure tones produce more TTS than corresponding octave bands of noise of<br />
the same amplitude. Carter and Kryter (1962) showed that the overall level of an<br />
octave band had to be about 5 dB higher than a pure tone at the octave center<br />
frequency to produce an equal amount of TTS; this 5 dB correction was later<br />
adopted for use in the CHABA (1965) steady-state noise damage-risk criterion.<br />
Cohen and Bauman (1964), investigating TTS from broad-band noise,<br />
showed that when pure tones below 2 kHz were present the combined tone and<br />
noise condition produced more TTS than noise alone, even though the overall<br />
SPLS for the two conditions were equated.<br />
Jerger et al. (1966), and Alford et al. (1966) investigated TTS from<br />
infrasonic tones, concluding that the most hazardous conditions were at or<br />
above 141 dB SPL in the range of 10 to 12 Hz.<br />
55<br />
35<br />
15<br />
5
t 20<br />
:Z t10<br />
8O<br />
Noise and Blast 709<br />
_ o_,,.,<br />
250 500 1000 2000 4000 8000<br />
FREQUENCY (Nz)<br />
Figure 15-8. Relation between exposure of frequency and TTS for octave bands of<br />
noise: comparison of some iso-traumatic lines, all based on TTS. Within any one set of<br />
data, the same exposure time or TTS criterion was used. (Plomp et al., 1963)<br />
There is evidence that exposure to ultrasonic tones up to 120 dB SPL is<br />
unlikely to produce TTS (Acton & Carson, 1967). No clear evidence exists<br />
upon which to assess the effect of higher SPL.<br />
Duration of Exposure. TTS 2 from steady noise grows linearly with<br />
the logarithm of exposure time, as illustrated in figure 15-9. Most<br />
experiments have involved relatively short exposures ( 8 hr), but Yuganov,<br />
et al. (1967) have suggested that the rule is valid for exposure times of up<br />
to 720 hours.<br />
The effects of intermittent noise exposure have been reviewed by Ward<br />
(1963, 1966) and Cohen and Jackson (1969), and others have compared the<br />
effects of continuous and intermittent exposures. In general, intermittent<br />
exposures produce less TTS than continuous exposures.<br />
Test Frequency. TTS involves areas, not points, on the basilar<br />
membrane (Ward, 1963). Thus, virtually ally type of tone or noise exposure<br />
affects auditory thresholds at a range of test frequencies. For SPL above<br />
60 dR, maximum TTS occurs at a frequency on the order of one-half to<br />
one octave above the stimulating frequency for pure tones and bands of<br />
noise. The relative TTS occurring at various frequencies with a broad-band<br />
("white") noise exposure is shown in figure 15-10.<br />
Preex_Dosure Hearing Level. The foregoing discussion has been based<br />
almost entirely on ears with normal sensitivity. Impaired ears may<br />
demonstrate different results. Ears with conductive hearing losses, for
710 Bioastronautics Data Book<br />
example, would be expected to show less TTS because less energy is<br />
transmitted to the cochlea. Ears with pure sense organ losses should also<br />
-show less TTS than normals, but this is due to their having less remaining<br />
sensitivity to lose.<br />
50<br />
40<br />
3o<br />
10<br />
t I I I I [ l<br />
- 95<br />
9O<br />
85<br />
5 15 35 55 100<br />
EXPOSURE TIME (rnin)<br />
Figure 15-9. TTS at 4 kHz from exposure to 2-4 kHz octave band noise.<br />
Parameter is noise level in SPL. (Shoji et al., 1966)<br />
Sex and Age. No systematic difference in TTS as a function of sex<br />
and age have been reported (Ward et al., 1959b; Loeb & Fletcher, 1963),<br />
nor have any systematic trends in TTS growth been reported solely as a<br />
function of age. For a discussion of the PTS which normally accompanies<br />
the aging process (presbycusis), see chapter 14.<br />
Monaural vs. Binaural Exposure. Ward (1965) showed that monaural<br />
exposures were accompanied in general by about 5dB more TTS than<br />
binaural exposure to the same condition.<br />
Recovery of TTS. When TTS2 does not exceed about 40 dB, and is<br />
induced by relatively short exposures to continuous blocks of steady-state<br />
noise, TTS recovers linearly in log time and occurs within a maximum of<br />
16 to 48 hours (Ward, 1963; Smith & Loeb, 1969). Under these conditions<br />
recovery rate is also independent of test frequency. The slope of the<br />
recovery function may, however, vary as a function of the amount of<br />
TTS 2. Representative recovery functions are shown in figure 15-11.<br />
0
A<br />
ro<br />
O3<br />
J--<br />
35<br />
30<br />
25<br />
20<br />
15<br />
10<br />
5<br />
0<br />
Noise and Blast 711<br />
i<br />
I I I<br />
_ 100<br />
m<br />
m<br />
_ 90<br />
B<br />
1 2 4 8<br />
TEST FREQUENCY (kHz)<br />
Figure 15-10. Distribution of TTS resulting from 5-rain exposure to broad-band noise.<br />
Parameter is amplitude in sensation level. (Nakamura, 1964)<br />
bb-<br />
20<br />
15<br />
10<br />
0'<br />
I I<br />
12 MIN AT 106dB<br />
27MINAT 98dB<br />
117MtNAT 90 dB<br />
I<br />
4kHz 6kHz<br />
@ rN<br />
O<br />
• ==<br />
2 ,5 10 20 50 100 200<br />
RECOVERY TIME (mini<br />
Figure ]5-]]. Course of"recovery at 4 and 6 kHz following 3 different exposures<br />
to ].2 - 2.4 kHz octave band noise. (Ward et al., 1959a)
712 Bioastronautics Data Book<br />
Since subsequent recovery is usually quite predictable once the value of<br />
TTS 2 is known, generalized recovery functions can be developed for<br />
TTSH4OdB. Such functions permit TTS measured at various times after<br />
exposure to be converted backward or forward to TTS 2 for purposes of<br />
direct comparison. Kryter (1963) published such a graph for converting<br />
TTSt to TTS2 as shown in figure 15-12.<br />
t-<br />
a<br />
TIME {sec}<br />
/<br />
/ '<br />
Figure 15-12. Graph for conversion of TTS to TTS2 with TTS as the parameter.<br />
Example: for TTS of 25 dB measured 500sec after exposure, add 10 dB to arrive at<br />
TTS2 = 35 dB. Graph is based on exposure of subjects to continuous periods of steady-state<br />
noise, and is probably invalid for application to TTS induced by other types of exposures.<br />
(Krytcr, 1963)<br />
When TTS is induced by exposures to steady noise longer than 8 hours,<br />
or by intermittent noise, these generalized recovery functions are probably<br />
invalid. Ward (1970) found that intermittent noise caused a significant<br />
increase in recovery time, for equal TTS, and Yuganov et al. (1967) and<br />
Mills et al. (1970) reported similar findings for exposures of 12to<br />
720 hours.<br />
As TTS 2 exceeds about 40 dB a change in the recovery function may<br />
be noted. Recovery from high values of TTS is linear in time, rather than<br />
hnear in log time, as illustrated in iigure 15-13.<br />
Impulse Noise<br />
An impulse may be defined as an aperiodic pressure phenomenon of less<br />
than 1000 msec duration, having a fast rise time and a peak-to-RMS ratio greater<br />
than 10 dB. Such a definition leaves much to be desired, including a 'gray' area<br />
of pressure phenomena which may be considered either as long impulses or<br />
short, steady sounds. Impulses are, however, characteristic of many working<br />
J<br />
i
Noise and Blast 713<br />
environments, and common examples.include the sound of gunfire, impact and<br />
power-operated tools, drop forges, pile drivers, etc.<br />
5G<br />
4@<br />
20<br />
Io<br />
i i i i I i I<br />
R$<br />
xH<br />
I I I I I 1 I<br />
$ to _ I_ _ logo 3ooo<br />
RECOVERY TIME (rain)<br />
so I _l , i i n i<br />
20<br />
%o °'_o ^<br />
Id8<br />
NP ,,_<br />
(a)<br />
RECOVERY TIME (min)<br />
(b)<br />
Figure 15-13. (a) Average course of recovery at 3 and 4 kHz following exposure to<br />
105 dB SPL 1.2-2.4 kHz noise whose duration was sufficient to produce 50 dB TTS 2. Time<br />
is represented logarithmically. (b) Data repiotted in tern_ of time, rather than log time<br />
(abscissa). (Ward, 1960)<br />
487-858 0 - 73 - 46
714 Bioastronauties Data Book<br />
The literature on impulse noise effects has been reviewed by Ward (1963),<br />
Chaillet et al. (1964), Coles et al. (1967, 1968), and Rice (1968). Some of the<br />
more important findings are summarized below. As was the case with steady<br />
noise, the interaction of variables is an extremely important consideration.<br />
Acquisition of TTS..<br />
Peak Pressure Level. The higher the peak pressure level, the greater is the<br />
risk of TTS, other parameters being equal. This relation is illustrated in<br />
figure 15-14 by data from the classic studies of Murray and Reid (1946), and in<br />
figure 15-15 by data from Ward et ai. (1961). The peak pressure level where TTS<br />
is first produced depends in part on other parameters such as impulse duration<br />
or the number of impulses presented, as well as on individual susceptibility.<br />
80<br />
2O<br />
170 180<br />
_90<br />
PEAK PRESSURE LEVEL (dB re 20/zN/m 2)<br />
Figure 15-14. TTS as a function of peak pressure level for ears exposed to 10 impulses<br />
produced by various weapons. Notation "105 H" on abscissa indicates peak pressure level<br />
found in crew area of a current Army howitzer. Graph underscores need for protection of<br />
personnel exposed to high noise levels. (Murray & Reid, 1946)<br />
Impulse Duration. Fletcher and Loeb (1967) have shown that, for a<br />
peak level of 166 dB, 10 to 25 impulses of 92 psec duration had about the same<br />
effect as 75 tto 100 impulses of 36 gsec duration. Similar results were later<br />
obtained by the same investigators (1968). Acton et al. (1966) showed that<br />
0.22 caliber rifles fired in the open (short duration) did not constitute a hazard<br />
to hearing, whereas the same rifles fired in an indoor reverberant range (long<br />
duration) did constitute a borderline hazard. The relation between impulse
Noise and Blast 715<br />
duration and risk of TI_S is best described by reference to the CHABA<br />
damage-risk criterion for impulse-noise exposure (discussed later).<br />
A<br />
p-<br />
<<br />
2O<br />
10<br />
I i I I [<br />
-j<br />
I I I i i<br />
130 135 140 145<br />
1<br />
150<br />
PEAK LEVEL OF CLICKS (dB re 20 /_ N/m 2)<br />
Figure 15-15. TTS at 4 kHz as a function of peak level of clicks. Upper curve: 3 n_dn<br />
exposure at 25 clicks/rain. Lower curve: 1 min exposure at 25 dieks/min. (Ward ¢t al.,<br />
1961 )<br />
Rise Time. Many impulses have rise times less than 1 gsec since a shock<br />
wave is a major component of the event. To date, however, no serious attempt<br />
has been made to relate impulse rise time to the risk of TTS, and this variable is<br />
not treated systematically in damage-risk criteria.<br />
Spectrum. Recently it has become possible to perform spectral analyses<br />
of impulses with a computer (Pease, 1967). There are, however, few data relating<br />
the spectrum of impulses to risk of TTS, and considerably more investigation<br />
will be required before sucb information will be of any real benefit.<br />
Number of Impulses., TTS appears to grow linearly with the number of<br />
impulses, or linearly in time for a constant rate of presentation, as illustrated in<br />
figure 15-16.<br />
Rate of Impulse Presentation. TTS growth rate from impulses does<br />
not differ significantly when the inter-pulse interval is between one and<br />
9seconds. At less than one second between pulses, TTS growth rate is<br />
reduced because of the protective action of the aural reflex. Also, when as<br />
much as 30 seconds elapses between successive impulses, TTS grows more
716 Bioastronautics Data Book<br />
:--lowly because of the recovery which takes place between impulses (Ward,<br />
1962; Ward et ai., 1961).<br />
NUMBER OF PULSES<br />
bo 1oo 9_00 300 400<br />
--]-- I I I !<br />
m'" _1<br />
3o<br />
500 Hz<br />
_D AV 1,2 kHz _ ,At<br />
u_t3" AV 3, 4, 6 kHz /sss-<br />
O 25 - - ..... AV 8, 10 kHz / s/ -z<br />
.=I_EARS --/./<br />
O_ //<br />
F,.4: 20 - S/S j /_ --<br />
Pt- P<br />
LIJ<br />
I-<br />
IJ_ 1(} _ s S _'_'_ --<br />
< i /._f" _..,._e.--._°'''_ °_ "'''""<br />
z_ / . ..r _<br />
p...<br />
F o ___L .... L_ I ....... I I<br />
0 2 4 8 12 16<br />
EXPOSURE TIME (min) TO PULSES<br />
Figure 15-16. Average growth of TTS from pulses as a function of exposure time<br />
(lower abscissa), or of number of pulses (upper abscissa) when pulses are presented at<br />
a constant rate. TTS from impulses increases linearly with time or with number of<br />
pulses. (Ward et a., 1961)<br />
Ear Orientation. When the impulse noise includes a shock wave, the<br />
orientation of the cxternal ear with respect to the shock front is of<br />
considerable importance. Hodge et al. (1964) showed that when the ear is at<br />
normal incidence to thc shock wave, the TTS produced is approximately<br />
txluivalent to that produced by an impulse having 5 dB greater amplitude but<br />
arriving at grazing incidence. Golden and Clare (1965) reported a similar<br />
difference. Hodge and McCommons (1967b) have also shown that when the<br />
sbockwave strikes one ear at normal incidence, the other ear, which is shadowed<br />
(protected) by the head, evidences considerably less TTS. This explains why it is<br />
usually found that right-handed rifle shooters demonstrate more TTS in the left,<br />
than right, ear: the right ear is at least partially protected by the head's shadow.<br />
Test Frequency. TTS from impulse-noise exposure occurs at a wide<br />
range of frequencies, with the maximum TTS usually occurring in the region of<br />
4 to 6 kHZ. This effect is illustrated in figure 15-17. Note that whereas mean<br />
and median TTS was between Oand +10 dB at all frequencies, the range of
Noise and Balst 717<br />
effect was from-25 dB (sensitization) at 3 kHz to +55 dB (loss) at 4 kHz.<br />
Also note that this exposure produced TTS at frequencies up to 18 kHz. Loeb<br />
and Fletcher (1968) believe that high-frequency TTS is a precursor of speech<br />
range TTS, and they suggest that when speech range TTS exceeds the CHABA<br />
(1968) allowable limits there is a chance of producing permanent high-frequency<br />
hearing loss<br />
5(<br />
_ 2o<br />
_,o<br />
-20<br />
o<br />
-Io<br />
A_<br />
0 Oz<br />
v O_<br />
N'I6<br />
o 8 9 o o '2 o o o .<br />
_+- - *, . __ o .+. _ _ _*-- g ....... ¢<br />
-5 I 2 3 4 6 8 g I0 it 12 13 14 $5 16 18<br />
AUOtOMETRIC TEST FREQUENCY {kHz}<br />
Figure 15-17. Distributions of TTS 2 following exposure to 25 gunfire impulses.<br />
(Hodge & McCommons, 1966)<br />
Monaural vs. Binaural Exposure. Hodge and McCommons (1967a) found<br />
that, on the average, TTS growth rates for binaural and monaural exposure did<br />
not differ significantly when the interpulse interval was 2 seconds. There were<br />
large individual differences among the subjects, but no consistent trend favoring<br />
either type of exposure.<br />
Recovery of TTS. A growing body of data indicates that recovery from TTS<br />
induced by various types of intermittent noise differs radically from that caused<br />
by steady noise exposure. Rice and Coles (1965) observed instances of individual<br />
subjects with TTS 2 _25 dB who showed little or no recovery for periods of up<br />
to one hour after exposure, but thereafter recovery became approximately linear<br />
in log time. Luz and Hodge (1971) have found four types of recovery curves for<br />
impulse-noise-induced TTS in humans and monkeys: (1) recovery linear in log<br />
time; (2) no apparent recovery for periods of up to one hour, followed by linear<br />
in log time recovery; (3) slight recovery followed by an increase in TTS; and<br />
(4) slight recovery followed by a long plateau of no change, and then further<br />
recovery. These diverse functions occur to TTS 30 dB in humans, and suggest
718 Bioastronaulies DataBook<br />
thatconsiderable fltrtheresearchwillberequired to deriw_ averaged, generalized<br />
recovery functions for impulse noise induced TTS.<br />
For TTS 2 40dB recovery may bc very slow; Fletcher and Cairns (1967)<br />
suggest that 6 months of recovery may be necessary to accurately assess residual<br />
PTS from excessive exposure to gunfire noise.<br />
Blast<br />
Blast differs little from impulse noise so far as tile hearing mechanism is<br />
concerned. The term "blast" is typically used to refer to nmch higher pressures<br />
and/or hmger durations than are uswally associated with common impulse-noise<br />
sources. Ilowcver, so far as the development of TTS is concerned, the preceding<br />
discussion of impulse-noise paramters is equally applicable to the parameters of<br />
blast.<br />
Single, large-amplitude blast waves may rupture the eardrum. The threshold<br />
for eardrum rupture is about 5 psi; at 15 psi 50 percent of eardrums will<br />
probably be ruptured (Hirsch, 1966). When the eardrum is ruptured loss of<br />
hearing is sew, re in the affected ear, although after healing (2 to 6 wceks), the<br />
ear's sensitivity may retvrn to normal, particularly if the middle ear _,ssielcs are<br />
intact (llambcrger & Lidcn, 1951; Akiyoshi et al., 1966). Rupture of the<br />
eardrum thus serves as a "safety valve." If the eardrum is not ruptured by the<br />
blast, profound PTS may result from a single exposure, particularly at the higher<br />
frequencies of hearing (Ward & Glorig, 1961; Singh & Atduwalia, 1968).<br />
Long-Term Exposure to Spacecraft Noise<br />
Short-term exposure to file high level, low frequency noise of spacecraft<br />
launch will not likely adversely affect astronauts, especially when earmuffs,<br />
hehnets, and other protectiw" gear are worn (Mohr et al., 1965). On the other<br />
hand, the relatively lower level steady background noise to which they will be<br />
exposed could adversely affect astronauts' hearing. Such back_ound noise is<br />
produced by the life support system and other items of onboard equipment,<br />
such as _.dycol pumps, c.abin fans, suit compressors, guidance and navigation<br />
systems, and inw_rters.<br />
Yugam_v et al. (1967) reported an extensive series of studies of the effects of<br />
spacecraft background noise on bearing. Their studies were conducted in a<br />
simulated spacecraft environment (complete with confinement and<br />
hypoactivity) during ground static testing. FigaJre 15-18 illustrates the growth of<br />
TTS resulting from successively longer exposures to 75 dB levels. _ Yuganov et<br />
M. reported that recovery time for noise-induced TTS became progressively<br />
longer with increased exposure time. This phenomenon has been verified by<br />
NASA-sponsored studies conducted under the Gemini pro_am, and was also<br />
reported by Mills ct al. (1970).<br />
_Alihough it is not clearly stated in their report, it is assumed from the description of procedure<br />
and instrumentation that the noi_ levels stated refer to dBA.
3O<br />
F- 20<br />
s<br />
cc<br />
< i<br />
_o<br />
L<br />
i<br />
MAXIMUM PERMISSIBLE TTS AT ANY FREQUENCY<br />
( CHABA, 1965)<br />
Noise and Blast 719<br />
i<br />
ol , , i Jt ) _ j , i i i _i) i , , J i L.J<br />
to 2o 40 60 100 2OO 4OO 600<br />
EXPOSURE T_ME (hr)<br />
Figure 15-18. Growth of TTS with time for overall exposure level of 75 dB. Growth rate<br />
was linear in log time, and compares favorably with other data for higher levels and shorter<br />
durations (see figures 15-8 and 15-10). CHABA (1965) limit of 20 dB maximum TTS at any<br />
frequency was exceeded at about 130 hr exposure. (Yuganov et al., 1967)<br />
In followup studies with 60 to 65 dB noise levels, Yuganov et al. found no<br />
evidence of TTS (or behavioral or physiological alterations) in astronauts<br />
exposed up to 60 days (1440 hours). Thus these authors concluded, and<br />
recommended, that for extended space flights of up to 60 days the background<br />
noise levels inside spacecraft should not exceed 65 dB. The 65 dB overall<br />
background noise limit recommendation compares favorably with the design<br />
criterion for background noise for Apollo spacecraft, indicated by Dr. B. O.<br />
French of the Manned Spacecraft Center (personal communication) to be<br />
NC-55, or approximately 60 dBA.<br />
Effects of Hearing Loss on Performance<br />
Some persons are likely to suffer TTS or PTS from noise exposure in spite of<br />
the application of safety criteria or the use of protective equipment. Other<br />
persons may have PTS from disease or trauma. Accordingly, in this section the<br />
effects of TTS and PTS on performance will be briefly considered.<br />
Detection of Low-Level Sounds<br />
Earlier, it was noted that an ear's threshold sensitivity (hearing level) is<br />
stated with reference to audiometric zero, such as the ANSI-1951 or ISO-1964<br />
values. Audiometric zero at various test frequencies represents ti_e lowest SPL
720 Bioa.,tronantic._ Ilata Book<br />
which can be detected, on the aw_'rage, by listeners having "normal"<br />
hearing. Table 15-4 shows the SPI, representing ISO-196,1 audiometric zero<br />
at selected frequencies and the "allowable TTS" p_,rmitted by the CIIABA<br />
(1965, 1968) damage-risk criteria for steady and impulse noise. The column<br />
at the far right shows the minimum SPL detectable, on the average, by a<br />
listener whose baseline hearing sensitivity equals ISO audiometric zero and<br />
who has CttABA-limit TTS at the various frequencies. These values are also<br />
descriptive of the detection limits for a listener who has PTS of tile<br />
amounts si_own in colunm 3.<br />
Table 15 4<br />
SPL Representing ISO Audiometric Zero and Minimum Detectable<br />
SPL for a Listener [laving CHABA-Limit TTS<br />
Frequency SPL for ISO Zero CHABA Allowable Minimum Detectable SPL<br />
(Hz) (dB re 20 #N/m 2) TTS (dB) (dB re 20 _N/m2) *<br />
50O<br />
1000<br />
2000<br />
3000<br />
4000<br />
6000<br />
8OOO<br />
11<br />
6.5<br />
8.5<br />
7.5<br />
9<br />
8<br />
9.5<br />
*This interpretation assumes that the listener's preexposure hearing sensitivity was equal to<br />
ISO audiometric zero.<br />
Given a knowledge of the spectral characteristics of a low-level sound<br />
which must be detected, and the lowest SPL at various test frequencies<br />
which a particular listener can detect, predictions can be made of the<br />
hstener's ability to detect the low-level sound. A convenient example from a<br />
military context, well-known to the authors, may be cited. It has been<br />
shown that sounds created by people walking over various types of terrain<br />
contain em_rgy primarily in the 3 to 8 kllz range. Knowing this, it would be<br />
hypothesized that persons having TTS or PTS in this range of frequencics<br />
would be les_ able to detect such sounds than persons with normal hearing<br />
sensitivity. This hypothesis has been confirmed by experimental test, and<br />
these results suggest that, for example, military, personnel receiving TTS<br />
from daytime exposure to weapon noise should not be assigned nighttime<br />
duty as perimeter sentry where the preservation of a life, or many lives,<br />
may depend on maximum hearing sensitivity, unimpaired by slowlyrecovering<br />
TTS. These results further suggest that in any detection situation<br />
the' listeners selected should have the most sensitive hearing possiblc, free of<br />
TTS or PTS.<br />
10<br />
10<br />
15<br />
20<br />
20<br />
20<br />
20<br />
21<br />
16.5<br />
23.5<br />
27.5<br />
29<br />
28<br />
29.5
Reception of Speech<br />
Noise and Blast 721<br />
The spectral characteristics of speech must be considered in assessing the<br />
effects of TTS or PTS on speech reception. Speech sounds range in<br />
frequency from 0.2 to 7 kHz; peak energy occurs at about 0.5 kHz. Speech<br />
sounds are of two basic types: vowels and consonants. Vowel sounds fall<br />
roughly into the frequencies below 1.5 kHz, and consonants are above<br />
1.5 kHz (Sataloff, 1966). Vowels are thus more powerful (i.e., contain more<br />
energy) than consonants. Vowel sounds indicate that someone is saying<br />
something, but consonants aid in discriminating what is being said. Thus,<br />
consonants may be said to convey more information than vowels.<br />
A person with TTS or PTS in the range of 0.2 to 1.5 kHZ has difficulty<br />
hearing speech unless it is quite loud, and is unable to hear soft voices. If<br />
the talker raises his voice level the listener will be able to understand what<br />
is being said.<br />
The person with TTS or PTS in the range of 1.5 to 7 kHz, on the other<br />
hand, hears vowels normally but finds it difficult to discriminate<br />
consonants. Increasing the speech level aids little, but careful enunciation by<br />
the talker is of great benefit. This type of TTS or PTS is a particularly<br />
severe problem in occupational deafness since the loss of hearing sensitivity<br />
frequently occurs first in the 3 to 6 kHz range. The problem is compounded<br />
by the presence of background masking noise, since the low-level consonant<br />
sounds are masked to a greater extent by broad-band noise than the<br />
higher-level vowel sounds. This fact has led some hearing conservation<br />
groups to develop criteria for protecting hearing at frequencies up to 4 kHz<br />
(e.g., Piesse et al., 1962). In the United States, however, this has not been<br />
done: only frequencies of 0.5 to 2kHz are considered in assessing<br />
occupational hearing impairment (Bonney, 1966).<br />
Table 15-5 shows classes of hearing handicap which are defined by the<br />
average of PTS at 0.5, 1, and 2 kHz, as recommended by the Committee on<br />
Conservation of Hearing (1969). In general it may be said that TTS of the<br />
same amount will constitute an equivalent degree of impairment, although<br />
of course the impairment disappears when the individual has recovered from<br />
the TTS.<br />
Subjective and Behavioral Responses to Noise Exposure<br />
An earlier section considered the effects of noise demonstrated after<br />
exposure and indicative of a decrease in the responsiveness or neural activity<br />
in the auditory receptors. In this section, by contrast, noise effects which<br />
occur currently with exposure and result in increased neural activity will be<br />
considered. These responses will be discussed in terms of (1)general<br />
observations, (2) masking of auditory singals, (3) masking of speech, and<br />
(4) annoyance. Methods for measuring speech intelligibility and assessing the<br />
effect of noise on speech intelligibility will be presented. The treatment of<br />
annoyance will introduce the notion of "community response" to noise<br />
exposure.
722 Bioastronauti_ Data Book<br />
tr_<br />
°,m e_<br />
¢0<br />
0_<br />
r_<br />
t_<br />
A_<br />
_.E<br />
8,=.<br />
®.__<br />
r_'r<br />
i<br />
-I<br />
_ _ _ _ __=<br />
z a ,,<br />
z _ _ :_ _<br />
,,_ rn 0 I_ UJ U.<br />
&<br />
o<br />
rn<br />
"0<br />
._ ,q.<br />
O_<br />
0<br />
C<br />
._. ,o<br />
_8<br />
_- 0<br />
r_
General Observations<br />
Noise and Blast 723<br />
Broadbent and Burns (1965) and Cohen (1969) have reviewed the<br />
effects of noise on behavior and psychological state. In some respects the<br />
existing literature does not yet support firm conclusions, but representative<br />
subjective and behavioral responses are summarized in table 15-6.<br />
Masking of Auditory Signals<br />
The amount of masking is the number of decibels that the quiet<br />
threshold of a signal must be raised to be intelligible because of the<br />
presence of masking sound. Masking effects may be classed as monaural or<br />
interaural. Monaural masking occurs when the signal and noise reach the<br />
ear(s) at the same time; this type of masking is most critical in working<br />
environments where personnel are not wearing earphones, and will be<br />
discussed below. (Interaural masking occurs when the signal reaches one ear<br />
and noise the other ear. No interaural masking occurs unless the noise<br />
exceeds about 40 to 50 dB SPL, since below this level the listener can<br />
readily distinguish between the sounds heard separately in his two ears. At<br />
higher levels the noise is transmitted to the "signal" ear via bone<br />
conduction; thus this situation may be regarded as a special case of<br />
monaural masking with the head serving as an attenuator. Interaural masking<br />
is a particular problem when the telephone is used in a noisy environment,<br />
and when the SPL in one ear is much higher than in the other.)<br />
The monaural masking effect of a pure tone, or of a noise having a<br />
strong pure tone component, is greatest near the frequency of the tone but<br />
also extends to frequencies adjacent to the masking tone. Curves of masking<br />
effects as a function of frequency are shown in figure 15-19. Audible beats<br />
near the frequency of the masking tone increase the audibility of the signal<br />
and thus reduce the degree of masking at these frequencies. For tones of<br />
low intensity masking is confined to a region near the masking tone; for<br />
higher intensities the masking is extended, particularly at frequencies above<br />
the masking tone. The masking effect of narrow-band noise is quite similar<br />
to that for pure tones, except that the dips due to audible beats are absent.<br />
Masking of signals by wide-band noise whose level does not exceed about<br />
60 to 70 dB SPL is governed by the critical band concept. At low noise<br />
levels pure tones are masked by only a narrow range of frequencies whose<br />
width defines the critical band for that signal frequency. The width of the<br />
critical band varies from about 40 to 200 Hz, over the tonal range of 0.5 to<br />
8 kHz. Within this range, and for low noise levels, an increase of 10 dB in<br />
noise level results in about 10 dB additional masking of tones within the<br />
critical band. Above masking levels of about 70 dB SPL, however the width<br />
of the critical band increases markedly in both directions. A 10 dB increase<br />
in noise level will still cause about 10 dB more masking of frequencies<br />
within the noise band, but it may also increase the masking effect at more<br />
distant frequencies by as much as 20 dB.
724 Bioastronautics Dala Book<br />
O<br />
t_<br />
.2 O<br />
Z<br />
._<br />
e.,<br />
t,o<br />
o ._ =<br />
_ _ °<br />
-_ .=_ _ _-_:<br />
-_ _ _ _ _<br />
• _ _ "_ ._<br />
0 0 "0<br />
E _" o 0 o<br />
0 0 0 U3<br />
LO 0_1 _ C3<br />
O<br />
-I<br />
o<br />
GO<br />
tD<br />
O_<br />
O<br />
t_<br />
E<br />
E<br />
8<br />
"6<br />
O<br />
t_<br />
.E<br />
0 u3 L_ 0<br />
O_ O0 f_ _D<br />
0<br />
O<br />
O ._<br />
0<br />
r_<br />
o<br />
"{3<br />
CL<br />
0<br />
e-
"o<br />
_z<br />
<<br />
100<br />
80<br />
6O<br />
4O<br />
2O<br />
0<br />
1 O0<br />
80<br />
6O<br />
40<br />
20<br />
0<br />
60<br />
200 H z<br />
1200 Hz<br />
100<br />
800 1600 2400 3200 4000<br />
Noise and Blast 725<br />
100<br />
400 Hz<br />
2400 HZ<br />
100<br />
800 1600 2400 3200 4000<br />
FREQUENCY (Hz)<br />
f_100 800 H Z<br />
10¢..<br />
800 1600 2400 3200 4000<br />
Figure 15-19. Masking as a function of frequency for masking by pure tones of various<br />
frequencies and levels. Number at top of each graph is frequency of masking tone. Number<br />
on each curve is level above threshold of masking tone. (Weg¢l & Lane, 1924)<br />
Masking of Speech by Noise<br />
Most of the energy required for near-perfect speech intelligibility is<br />
contained in the range of 0.2 to 7 kHz. This range may be narrowed to<br />
0.3 to 4.5 kHz without significant loss in intelligibility. (In reducing the<br />
frequency range it must be remembered that 1.5 kHz constitutes the "center of<br />
importance" of speech, and narrowed pass bands of a communications system<br />
should be centered on about 1.5 kHz.) Consonants contain energy at frequencies<br />
above 1.5 kHz, whereas vowels contain lower-frequency energy. Unfortunately,<br />
the consonants, which convey most of the information in English speech,<br />
contain very little energy. Thus, they are more subject to interference (masking)<br />
from noise than are vowels. Conversely, vowels contain more energy but<br />
transmit less information.<br />
Communication System Design. It is desirable to maintain as high a speech<br />
signal-to-noise ratio as possible in each frequency band, with particular emphasis<br />
on those bands which contribute most to intelligibility. Another consideration is<br />
the point of overload of the hearing mechanism: the level above which<br />
intelligence is no longer extracted from the stimulus. The overload effect can be<br />
demonstrated quite readily in a noisy environment when a voice comes over a<br />
loudspeaker at a very high level. A listener will find the amplified speech more<br />
intelligible when his ears are plugged than when listening without earplugs. This<br />
effect occurs because with the ears plugged the speech signal does not overload<br />
the hearing mechanism and, at the same time, the signal-to-noise ratio remains<br />
cons¢tant. Overloading of the ear due to speech amplitude begins to occur when<br />
the overall RMS level of the speech signal is about 100 dB at the listener's ear.<br />
(The average overall RMS level of speech in a quiet environment may be
726 Bioastronaulics DataBook<br />
approximated bysubtracting 3dBfromthearithmeticaverage of thepeaklevels<br />
observed onasoundlevelmetersetforslowmeterdampingontheC-scale.) In<br />
additionto not contributingto intelligibility,higherlevelsof speechsignals<br />
producediscomfort andpossiblehearing loss.<br />
Factors in Speech Intelligibility. Two types of communications must be<br />
considered in discussing spcech intelligibility: electrically-aided, and direct. The<br />
effectiveness of both types of coice communication are determined by the<br />
fi_llowing parameters: (1) level and spectrum of ambient noise at the ear<br />
(includes both acoustical uoise, and electronically-induced noise); (2) voice lew_l<br />
and spectrum of speech; (3) distance between the speech source and the<br />
listener's ear; and (4) the complexity and number of alternative messages<br />
available to the listener. Electrically-aided speech more specifically also depends<br />
upon the characteristics of all of the components of the transmission amt<br />
receiving systems.<br />
Recommended Approaches to Measurement of Speech Intelli-<br />
_bility. Speech intelligibility is measured by determining the pcrcentage of<br />
words correctly received by listeners. This may be done by conducting subjectiw_<br />
tests with talkers and listeners, or by calculations based on the signal-to-noise<br />
ratio in various frequene) bands. The choice of approach will be determined by<br />
the amount of time, pcrsomtel and/or instrumentation available.<br />
PB Word Intelligibility Test. In the bioastronautics field one usually<br />
attemps to discriminate among, or evaluate, highly effective communications<br />
systems. This requires a sensitive test of speech intelligibility-one that is capable<br />
of detecting small differences between systenrs. Therefore, the use of the<br />
"Phonetically Balanced (PB) Monosyllabic Word Intelligibility Test" (ANSI<br />
Standard $3.2-1960) is rcct_mmended for applications requiring maximum<br />
accuracy.<br />
Some aspects of the test procedure are as follows. The test material consists<br />
of 20 lists of 50 phonetically-balanced words each. Each list is of approximately<br />
the _me difficulty. The talker reads the words in a "carrier sentence" at<br />
4-second intervals and the listener writes down each key work. The hearing level<br />
of hoth talkers and listeners must aw_ragc no more than 10 dB overall, with no<br />
more than 15 dB at any of the frequencies 0.25, 0.5, 1, 2, and 4 ktlz (re ANSI<br />
Standard Z24.5-1951). Talkers must have no obvious speech defects or strong<br />
re_zional or national accents. Test personnel must be completely familiar with<br />
each of the 1000 words and with the speech characteristics of the talkers. The<br />
test must always be given in its entirety (i.e., all 1000 words must be used), and<br />
if the test is to be repeated several times with the _me personnel, it is<br />
recommended that the order of words within lists be randomized for each<br />
presentation. Normally, 8 to 10 hours of talker and listener training are required<br />
to properly utilize the PB intelligibility test.<br />
PB intelligibility score may be acceptable in certain instances with values as<br />
low as 50 percent (of words correctly received). Only rarely is an intelligibility<br />
score of 90 percent required. Singtc digits may be transmitted with greater than<br />
9_ percent reliability with a system providing a PB score of 60 to 70 percent,
Noise and Blast 727<br />
since the listener has only 10 alternatives from which to choose. The criterion of<br />
acceptability for communication systems should be a mandatory score of<br />
70 percent and a desirable score of 80percent when the ANSI PB method is<br />
followed.<br />
Modified Rhyme Test. If testing time is limited, or time is not available<br />
to thoroughly train subjects for the PB method, the second recommended choice<br />
is the Modified Rhyme Test (MRT) described by House et al. (1963). The test<br />
material consists of 300 words which are printed on an answer sheet in<br />
50 groups of six words each. The talker reads one of the six words in the first<br />
group and each listener _lects one word from the closed set of six alternatives.<br />
Unlike the PB test, little account is taken of word familiarity or of the relative<br />
frequency of occurrence of sounds in the language. This test has the advantage<br />
of requiring little or no training, and does not require a written response as is the<br />
case with PB tests. A chart for converting MRT scores to PB test scores is shown<br />
in figure 15-20.<br />
100<br />
BO<br />
60<br />
4O<br />
00<br />
1 1 t 1<br />
20 40 60 80 100<br />
PB SCORES I%l<br />
Figure 15-20. Relationship between MRT test scores and PB test scores.<br />
(Based on unpublished data from K. D. Kryter, 1964)<br />
Articulation Index Calculation. Intelligibility of speech in noise may<br />
also be calculated from measures of the speech and noise levels through use of<br />
the Articulation Index (AI) (Kryter, 1962). AI can be calculated from<br />
octave-band measurements using the worksheets shown in figure 15-21 and<br />
table 15-7, provided the noise does not have any severe pure tone components<br />
and is steady in character without an extremely sloping spectrum. (Additional<br />
worksheets are available in the source document if the situation requires the use<br />
of 1/3-octave band measurements.)
728 Bioastronautics Data Book<br />
5<br />
Z<br />
uJ<br />
..J<br />
Le,O<br />
_40<br />
_ZO<br />
tOO<br />
iO<br />
SO<br />
40<br />
ZO'<br />
CENTER FREQUENCIES OF OCTAVE BANDS<br />
CONTRIBUTING TO SPEECH INTELLIGIBILITY<br />
_AXlUUM 0L_8L£ LEV£L ? / _"_..--"_'-- I<br />
a UNCL,PP[O 5P((C_ - _ / /<br />
-- b 5PEECNP[AK CLbPP£O izom-J /<br />
c SP[ECM PEA_ CLbPP£O Z4De-- --J<br />
-- SPC£C_ PEANS AIIOVE T_£ APPRO<br />
I_mlatE curve oO _or CONtriBUTE<br />
IIAND NO 2 3<br />
OCT_v[ CArlO |_f#[SMOtO OF<br />
a_Dlnt_V rOA SOUNDS ,_vIN_ /<br />
/<br />
CONtiNUOUS SPECtR_<br />
/<br />
fO[ACIZ[O SP[ECH PEaN$-UaC( ¥0a¢[|<br />
LONG TEnM RU$ • lZ O_<br />
(LONGTERURUSLEV[LOV[RALLI&$OII<br />
l_oc mo_<br />
FREQUENCY (Hz)<br />
Figure 15-21. Worksheet for calculating Articulation Index<br />
by the octave band method using ANSI preferred frequencies. (Kryter, 1962)<br />
Octave Band<br />
1. 180- 355Hz<br />
2. 355- 710<br />
3. 710-1400<br />
4. 1400--2800<br />
5. 2800--5600<br />
(Kryter, 1962)<br />
Col 1<br />
Table 15 7<br />
Worksheet for Calculating Articulation<br />
Index by the Octave Band Method<br />
(Preferred Octave Bands)<br />
Col 2<br />
Speech Peak-to-Noise<br />
Frequency Difference in dB<br />
250 Hz<br />
500<br />
1000<br />
2000<br />
4000<br />
S<br />
Col 3 Col 4<br />
Weight Col 2 X Col 3<br />
0.0018<br />
0.0050<br />
0.0075<br />
0.0107<br />
0.0083<br />
AI =
Noise and Blast 729<br />
The octave band method of calculating AI is as follows: (1) Pint thc<br />
measured octave band SPL of the noise. (2) Adjust the idealized speech<br />
spectrum shown on the worksheet to reflect its actual level. (3) Measure<br />
the difference between the speech and noise in each band, and assign a value<br />
between zero and 30 dB. (4) Multiply this assigned value in each band by the<br />
appropriate weighting factor (this accounts for the difference in the importance<br />
among the several bands) and add the resultant numbers. This number, which is<br />
between zero and one, is the AI which may then be converted to PB<br />
intelligibility, score through the use of figure 15-22.<br />
IOO<br />
LIMITED TO 32<br />
,_ 90 .....<br />
UZ SENTENCES_ _/ /<br />
W IKNOWN TO _ 7 /'<br />
zF 80 LISTENERS)/t/_/_ ...........<br />
//(,ooo D,_FERENT WORDSl<br />
E >- 70<br />
m'u<br />
r (tO00 OtFF_RENT SYLLABLe.S)<br />
' lilt/ --'NO SENSES,LLASLES<br />
"°-o71/,'\ -<br />
,o
730 Bioastronautics Data Book<br />
Quantification and prediction of community response to noise exposure<br />
involves identification and/or measurement of many variables, including level,<br />
spectrum, duration, time of day, frequency of occurrence, type of residential<br />
neighborhood and amount of previous noise exposure. Integrating these data,<br />
with appropriate weighting, into a predictive scheme results in a single<br />
"composite" rating of the annoyance reaction to be expected. Such reactions<br />
range from no response, through occasional complaints by individuals, to<br />
concerted legal action by groups.<br />
Two general approaches to the prediction of annoyance reactions enjoy wide<br />
acceptance. The first approach, typified by the Composite Noise Rating of<br />
Rosenblith and Stevens (1953), results in a qualitative prediction of community<br />
response without attaching to it a precise numerical value. Botsford (1969) has<br />
simplified this approach, as illustrated in figure 15-23, by reducing the<br />
measurement of level and spectrum to A-and C-weighted sound levels. This<br />
figure call thus be used to predict community responses to noise levels up to<br />
95 dBA and 110 dBC.<br />
The second approach involves computation of a numerical index of<br />
perceived noisiness which is then used to predict community response. Kryter's<br />
(1968) Effective Perceived Noise Level (EPNL) expressed in EPNdB, has found<br />
particular application in the evaluation of community response to aircraft noise<br />
[although, as Kryter (1970) indicates, the method is applicable to all types of<br />
community noise exposure]. The general relationship between EPNL and<br />
annoyance reactions is illustrated in figure 15-24.<br />
It is not practical to recommend a single, optimum procedure for calculating<br />
EPNL since many new developments are rapidly taking place. The various<br />
existing procedures differ primarily in terms of the weighting to be assigned to<br />
the highest SPL during an occurrence of a noise, and the length of the<br />
integration time used in calculating perceived noise level. Sperry (1968) presents<br />
the calculation procedure used for Federal Aviation Agency certification of new<br />
commercial aircraft. Kryter (1968) reviews a variety of computation procedures,<br />
and (Kryter, 1970) describes his latest recommendations for EPNL calculation,<br />
including a discussion of its application to sonic boom problems. Department of<br />
Defense (1964) reports related procedures helpful in land use planning. Cole and<br />
yon Gierke (1957) discuss community response to noise from missile static<br />
testing and launch operations.<br />
Physiological (Nonauditory) Responses to Noise Exposure<br />
Low Level Stimulation<br />
It is now well established that noise exposure can affect human physiological<br />
processes and that measureable effects are obtained with noise exposure conditions<br />
involving little or no risk of TTS. The main concern of researchers is whether these<br />
effects of noise, which in some instances appear to be correlated with pathological<br />
effects and/or behavioral alterations, may represent a real hazard to the health<br />
and well-being of exposed persons.
EXPECTED<br />
COMPLAINT<br />
RESPONSE THREATS<br />
Noise and Blast 731<br />
O RGAN IZED<br />
ACTION<br />
1/dily L_, _ t C/ ,, . '_ \ L<br />
.... o, \ \\ ,,',_,\\\\\<br />
,-,o_, .\_..\\.-.. \_ \ \ \ \ \,<br />
t0-00,,o.- \\\ .'.'.._._\\\\\<br />
Irnpul==<br />
NO Ir,,nlmal_l_<br />
PureTone<br />
Wide Band<br />
¢ I _" L ; _ 7f;" ¢ ¢ ¢ ¢<br />
t t t t ,. 1 i ! ll//i<br />
_ _o<br />
\ \ \_ '\', 'ti I I 1ii7<br />
X.\\\ ',,\ \-t, \ \ \ t tT<br />
3O 4O 50 60 70<br />
A-WEIGHTED SOUND LEVEL IN Db<br />
Figure 15-23. Annoyance of neighborhood sound levels. To use graph, locate in curved<br />
grid at bottom, point corresponding to sound levels of neighborhood noise under<br />
consideration and project directly above it into first of the 6 correction sections bounded by<br />
horizontal lines. Follow correction lane entered until reaching position opposite condition<br />
listed at left which applies to noise under consideration, and then proceed vertically,<br />
disregarding lanes, until next section is reached. Work upward through lanes of correction<br />
seetions until reaching response to be expected at the top, e. g., if truck movements at a new<br />
loading station are to be cued by a whistle that will produce 65 dBA and 70 dBC at the<br />
nearest homes 10 to I5 times/day, then few complaints would be expected according to the<br />
line traced through the chart above. (Botsford, 1969)<br />
Jansen (1969) dichotomizes physiological responses to noise into stress<br />
reactions and vegetative reactions. Stress reactions to unfamiliar stimuli, in<br />
general, show adaptation with repeated exposure as the stimuli become<br />
familiar and gain meaning to man, and hence are of less concern in the<br />
present context. It is the vegetative reactions to meaningless noise<br />
stimulation which is of primary concern here. Meaningless noise refers, for<br />
example, to the background noise found in industry, in the community and<br />
in the home. Adaptation to such noises has not been reported in many<br />
instances, and continued exposure may involve some risk of eventual<br />
interference with the health and well-being of workers.
732 Bioastronautics Data Book<br />
Figure 15-24. General reactions of people and communities to environmental noise.<br />
(Kryter, 1970)<br />
Representative observations from studies cited by Anticaglia and Cohen<br />
(1969) and Jansen (1969) are summarized below:<br />
• Noise exposure causes increases in the concentration of corticosteroids in<br />
the blood and brain and affects the size of the adrenal cortex. Continued<br />
exposure is also correlated with changes in the liver and kidneys and with the<br />
production of gastrointestinal ulcers.<br />
• Electrolytic imbalances (magnesium, potassium, sodium and calcium) and<br />
changes in blood glucose level are associated with noise exposure.<br />
• The possibility of effects on sex-hormone secretion and thyroid activity is<br />
indicated.<br />
• Vasoconstriction, fluctuations in blood pressure, and cardiac muscle<br />
changes have been reported. Vasoconstriction in the extremeties, with<br />
concomitant changes in blood pressure, have been found for noises of 70 dB<br />
SPL, and these effects become progressively worsened with higher levels of<br />
exposure.<br />
• Abnormal heart rhythms have been associated with occupational noise<br />
exposure and this and other evidence supports the tentative conclusion that<br />
noise may cause cardiovascular disorders.<br />
• Panian (1963) states that in Russia the cardiovascular symptoms outlined<br />
above are collectively referred to as "noise sickness."<br />
• Yuganov et al. (1967) found that 10 to 30 days of exposure to noise levels<br />
of 75 dB produced electroencephalographic and cardiovascular alterations in<br />
astronauts similar to those described above. Reduction of the noise level to<br />
65 dB resulted in no such observations at all for exposures of up to 60 days.<br />
• With respect to impulse-noise exposure, Yuganov et al. (1966) reported<br />
that repeated exposure to simulated sonic booms having peak levels up to<br />
9 kg/m2 ( 133 dB re 20 p.N/m2) caused alterations in electrocardiogram and
NoiseandBlast 733<br />
electroencephalogram tracesaswellasmoderate bleeding in tympanicmembrane<br />
epithelium,and they saidthat subjectsreportedheadache, tinnitusand<br />
"fullness" in theirears.<br />
Risk of Injury or Death from Steady Noise<br />
Studies of very intense steady acoustic stimulation have been carried out<br />
primarily with animals, and few data are available for human exposures. Three<br />
relevant observations follow:<br />
. One instance of a ruptured human eardrum has been reported for<br />
exposure to 159 dB SPL at 6.5 kHz for 5 minutes (Davis et al, 1949).<br />
• Mohr et al. (1965) reported no risk of bodily injury to astronauts from<br />
the intense, low-frequency noise simulating a space rocket launch, but a number<br />
of questions remain unanswered in this regard. Exposure to tones in the 1 to<br />
100 Hz range should not exceed 2 minutes or 150 dB SPL, as these values appear<br />
to be close to the limits of human tolerance.<br />
• Parrack (1966) calculated that for a 2kHz whole-body exposure<br />
(probably not attainable in a practical situation) human lethality from<br />
overheating would require from 5 minutes at 167 dB SPL to 40 minutes at<br />
161 dB. At 6 to 20kHz the exposures required for lethality range from<br />
5 minutes at 187 dB to 40 minutes at 1811dB SPL. Parrack's paper further<br />
indicates that ultrasonics pose no special hazard to man's life until the SPL<br />
exceeds 180 dB.<br />
Blast and Impulse Noise Effects<br />
The effects of high-intensity blast waves on man are classed as primary,<br />
secondary and tertiary: primary effects are those resulting from the impact of<br />
blast waves on tissues; secondary effects are caused by flying debris set in<br />
motion by the blast; tertiary effects result from propulsion of the body. Only<br />
the primary effects of blast will be briefly summarized here.<br />
The following extrapolations of animal data to human exposures are valid<br />
only for exposure to single, fast-rising blast waves inw_lving classical or<br />
near-classical waveforms:<br />
• Risk of injury or death increases with increased pressure and/or<br />
duration, and with the presence of nearby reflecting surfaces.<br />
• Ri_ of injury is lessened with increased rise time, and<br />
higher-than-normal ambient pressures.<br />
• Gas-containing organs (ears, lungs, intestines) are very susceptible to<br />
blast injury.<br />
• The eardrum is most susceptible: its threshold for rupture is about<br />
5 psi.<br />
• The lungs are most critical with regard to possible lethality: the<br />
threshold for lung damage (minor hemorrhage) is about 10 psi.
734 Bioastronautics Data Book<br />
• Animals exposed to blast show evidence of central nervous system<br />
(concussive) damage--ataxia, paralysis, convulsions, dazed appearance, and<br />
lethargy--and often do not respond to noxious stimuli.<br />
• Figure 15-25 shows 99 percent survival limits and lung damage thresholds<br />
as a function of peak overpressure and blast duration.<br />
5<br />
4C_LT-_ I i I Ill I I I I I I III I<br />
I0<br />
,_ 99 suF_vIv_t IIP,+IIS<br />
I I l I I 111<br />
____J L J i LLLL[__ __L.] .... L L ±_J_LLL<br />
10 ICO 1000<br />
OURATION ()F POSITIVE iNCiDENT OV_RPRESSURE {m_c_<br />
l°°_,,_ l-- ! _ I _ Ill 1 I I I "F77-TI_-- I I ; _ , III<br />
p -,,,.<br />
i B THRESHO_ D FOq LUN(_ _AMAC, E<br />
i ,o<br />
(a)<br />
4 1 I I I I 1111 I J 1 I I t Ill I I I 11 I II<br />
10 108 1000<br />
[)URAT_OI_ O_ POSITIVE INCID_N[ OV_RPFIESSURE [m_c_<br />
(b)<br />
Figure 15-25. Blast exposure limits as a function of peak overpressure and duration.<br />
(A: 99% survival limits; B: threshold for lung damage; 1: long axis of body parallel to blast<br />
wave; 2: long axis of body perpendicular to blast wave; 3: thorax near a reflecting _rface<br />
which is perpendicular to blast wave.) All curves relate to subjects facing any direction.<br />
(Bowen et al., 1968)<br />
Few studies have been made of the effect of repeated, high-amplitude blast<br />
waves and impulse-noise waves. De Candole (1967) states that repeated blast<br />
exposure is responsible for the syndrome known as "battle fatigue." Anecdotal<br />
reports indicate that large caliber weapon instructors exposed to 50 impulses per<br />
day at about 10 psi complain of chest pains, nausea, and sleeplessness. Jacobson<br />
2<br />
3<br />
3
Noise and Blast 735<br />
et al. (1962) felt that it was necessary for subjects exposed to repeated impulses<br />
from a bowitzer to wear a foam rubber "chest protector" at levels of 6 psi and<br />
higher. Tanenholtz (1968) recommends that artillery crewmen not be exposed<br />
to repeated blast at pressures above 7 psi, even when utilizing protection.<br />
Design Goals<br />
Design Criteria<br />
It seems unlikely that noise and blast will ever be completely eliminated<br />
from man's environment. Therefore, steps must be taken to insure that the noise<br />
which reaches man's receptors is tolerable. The term "tolerable" may be<br />
interpreted in several ways. (1) It refers to the prevention of excessiw_ hearing<br />
loss and unpleasant subjective sensations; criteria for this purpose are discus_'d<br />
below. (2) Prew_ntion of injury from blast is also considered. (3) Further,<br />
tolerable noise exposure refers to limiting back_ound noise levels to the extent<br />
required to minimize masking of speech communications, and (4) to providing<br />
noise levels in work areas that do not interfere with the performance of duties.<br />
(5) Also, community noise levels must bc limited tt> prevent annoyance,<br />
complaints or threats of legal action.<br />
Finally, one method of achieving tolerable noise levels at a person's ear is by<br />
the use of hearing protectors. Various protective devices and techniques are<br />
presented at the end of this section.<br />
Noise Exposure Limits<br />
Documents developed to aid in specifying noise exposure limits are variously<br />
referred to as damage-risk criteria (DRC), damage risk contours, and hearing<br />
conservation criteria. The first two names point to a consideration which must<br />
not be ignored. "Damage risk" implicsjust that: there is always the risk of some<br />
TTS or PTS in a portion of the noise-exposed population. Because of the wide<br />
range of susceptibility to hearing loss (discussed earlier), it is neither<br />
philosophically realistic nor economically feasible to enforce DRC which will<br />
protect cve_one (Coben, 1963). Always, there is a risk that someone will lose a<br />
portion of his hearing sensitivity either temporarily or permanently. Thus, it is<br />
incumbent upon the user of any DRC to insure that he understands the risks<br />
involved.<br />
It should be noted that the noise limits imposed by DRC refer to the noise<br />
which actually enters the ear canal. If the environmental noise exceeds the<br />
allowable limits, sew_ral means are available for reducing the levels to or below<br />
acceptable limits.<br />
Steady-State and Intermittent Noise DRC.<br />
CHABA DRC. The CHABA Damage Risk Criteria (DRC) (1965) was<br />
developed through the efforts of Working Group 46of the NAS-NRC<br />
Committee on Hearing, Bioacoustics and Biomechanics. The acceptable limits
736 Bioastronautics Data Book<br />
for end-of-day TTS 2 are: 'lOdB at or below 1 kHz, 15dB at 2 kHz, and<br />
20 dB at or above 3 kHz, in 50percent of exposed ears. These TTS limits<br />
are considered to be, equal to the maximum acceptable amounts of PTS<br />
after "about 10 years of near-daily exposure. The allowance of less TTS in<br />
the lower frequencies is designed to provide additional protection for the<br />
speech-range frequencies, and the 10-15-20 dB TTS limits are related to the<br />
borderline criteria for compensable hearing loss. It is ,lot safe to attempt to<br />
extrapolate the criteria to prevent PTS at intermediate number of years, nor<br />
the protection of different amounts of hearing. For such individualized<br />
applications, special criteria should be developed.<br />
The CHABA steady noise DRC is presented in the form of 11 graphs<br />
relating the trade-offs among (1) spectrum, (2) exposure time up to 8 hours<br />
and, (3)SPL. Figure 15-26 shows the exposure limits for octave (and<br />
narrower) bands of noise, and figure 15-27 gives the limits for exposure to<br />
pure tones.<br />
8C 75<br />
!00 _0 500 1000 2000 5000 I0000<br />
BAND CENTER FREQUENCY [Hz)<br />
Figure 15 26. Damage risk contours for 1 exposure/day to octave (left-hand ordinate)and<br />
1/3 octave or narrower (right-hand ordinate) bands of t,oise. Graph can be applied to<br />
individual band levels present in broad band noise. (CHABA, 1965)<br />
The CHABA DRC's 8-hour exposure limit makes it inapplicable as a<br />
design criterion for extended space flight, but it is applicable to the<br />
protection of _ound-service crews and other personnel who typically work<br />
8-hour shifts each day. (See below for design criteria for extended space<br />
flight.)<br />
Those regulations, which apply to noise, under the Occupational<br />
Safety and Health Act of 1970 include the limits on occupational noise
Noise and Blast 737<br />
exposure. Noise exposure limits are stated ill terms of A-weighted sound levels,<br />
and table 15-8 shows tile permissible levels for exposures of 15 minutes to<br />
8 hours per day. For octave band SPL data, a graph is provided for determining<br />
equivalent A-weighted sound levels, as shown in figure 15-28.<br />
-zlt$<br />
w<br />
I35<br />
125<br />
I05<br />
85<br />
7.a<br />
lO0<br />
e<br />
FREQUENCY IN<br />
_000<br />
CYCLES PER SECONO<br />
Figure 15-27. Damage risk contours for 1 exposure/day to pure tones. (CHABA, 1965)<br />
Table 15-8<br />
Occupational Safety and Health Act<br />
Permissible Daily Noise Exposure*<br />
Duration (hr) Sound Level (dBA)<br />
8 90<br />
6 92<br />
4 95<br />
3 97<br />
2 100<br />
1.5 102<br />
1 105<br />
0.5 110<br />
0.25 115<br />
*When the exposure is intermittent at different levels the fraction C1/T 1<br />
+ C2/T 2. . .Cn/T n should not exceed unity to meet the exposure limit.<br />
C n = total exposure time at the specified noise level.<br />
T n = total exposure time permitted at the specified level.<br />
_ON<br />
_ES<br />
OR<br />
IO,O00
738 Bioastronautie8 Data Book<br />
140<br />
rJ 130<br />
r_<br />
Z 120<br />
_.2 110<br />
_m I00<br />
Z<br />
90<br />
_ ao<br />
m<br />
I<br />
\\ .<br />
A Weighted 90_ _ _ /<br />
Sound Level<br />
J<br />
100 200 500 1000 2000 4000 8000<br />
BAND CENTER FREQUENCY (HERTZ)<br />
Figure 15-28. Contours for determining equivalent A-weighted sound level. Graph is used<br />
in interpreting octave-band sound levels according to the provisions of Occupational Safety<br />
and Health Act. (OSHA, 1970)<br />
Noise Limits for Extended Space Flight. To obviate the possibility of<br />
TTS during extended space flights (up to 60 days) the background noise level<br />
inside spacecraft should not exceed 65 dB overall (Yuganov et al., 1967).<br />
Ultrasonic Noise Limits. To prevent TTS and unpleasant subjective<br />
responses to ultrasonic noise, the SPL must not exceed 75 dB in 1/3-octave<br />
bands centered at 8 to 16 kHz or 110 dB at 20 to 31.5 kHz (Action, 1968).<br />
Low-Frequency and Infrasonic Noise Limits. To prevent physiological<br />
injury from low-frequency and infrasonic noise (1 to 100 Hz) the limits shown<br />
in table 15-9 must not be exceeded. Even at these limits, experienced astronauts<br />
may report transient unpleasant sensations. Above these levels wearing of<br />
hearing protective devices is mandatory.<br />
Frequency*<br />
(Hz)<br />
1-- 7<br />
8-- 11<br />
12-- 20<br />
21 - 100<br />
21 - 100<br />
Table 15-9<br />
Low-Frequency and Infrasonic Noise Exposure Limits<br />
SPL<br />
(dB)<br />
150<br />
145<br />
140<br />
135<br />
150<br />
(min/day) Notes<br />
Duration** [<br />
4 _ Use of ear plugs will reduce un-<br />
4<br />
4 t pleasant sensations<br />
&<br />
20 [ Without protection<br />
20 J With ear plugs<br />
*Refers to pure tones or to octave bands with center frequencies as indicated.<br />
**Refers to one exposure per day with at least 24 hr elapsing between successiveexposures.<br />
(Wilhold et al., 1970)
Noise and Blast 739<br />
Impulse-Noise Limits. The most comprehensive DRC for impulse noise<br />
exposure is that published by CHABA (1968) and based on the formulations of<br />
Coles et al. (1967, 1968). This DRC assumes the same TTS limits as does the<br />
CHABA (1965) steady noise DRC. However, the impulse noise DRC is designed<br />
to protect 95 percent of ears exposed. The basic DRC (figure 15-29) assumes a<br />
daily exposure of 100 impulses distributed over a period of from 4 minutes to<br />
several hours and that the impulses reach the ear at normal incidence.<br />
w<br />
J<br />
t_<br />
150 --<br />
1¢5 --<br />
140 --<br />
13s I I I<br />
! 1 I I t<br />
0025 _ 01<br />
I l I I I I I<br />
A - I]_tall<br />
I I I I I I I I I I I<br />
OZ 0.5 1 2 S I0 I_ ,SO I_ _ S(_I<br />
L)URATIONI [msec)<br />
Figure 15-29. Basic limits for impulse noise exposure assuming 100 impulses/day<br />
and other conditions as stated in text. (CHABA, 1968)<br />
Two correction factors are included in the DRC. First, if the pulses reach the<br />
ear at grazing incidence (rather than normal) the curves can be shifted upward<br />
by 5 dB. Second, if the number of impulses in a daily exposure is some value<br />
other than 100 (i.e., 1 to 1000) all adjustment can be made according to the<br />
curve shown in figure 15-30.<br />
Blast Exposure Limits<br />
To minimize temporary or permanent hearing loss from blast, the impulse<br />
noise criteria stated above should be used. To avoid other physiological injury<br />
from fast rising, long duration blast waves, the following pressures must not he<br />
exceeded"<br />
5 psi (unprotected) to prevent eardrum rupture<br />
10 psi (ears protected) to prevent lung damage. (See figure 15-25)<br />
Speech Interference Criteria<br />
In a preceding section, calculation of the Articulation Index was discussed.<br />
AI, as a method of estimating the masking effect of noise on speech<br />
I<br />
X_
740 Bioastronautics DataBook<br />
intelligibility, is quite involved. A relatively simple method was devised by<br />
Beranek (1947) and later modified by Webster (1969). Webster's method, called<br />
the three-band preferred octave speech-interference level (PSIL), is obtained by<br />
averaging the noise levels in the 500, 1000, and 2000 Hz octave bands.<br />
+10<br />
w 0<br />
a:<br />
I I I I I 1 I l I I<br />
1 _1 ...... J __ __1 I l I I I I<br />
I 2 S 10 20 50 1OO 200 SO0 10OO<br />
NUMBER OF IMPULSES<br />
Figure 15-30. Correction factors to be added to ordinate of figure 15-29 to allow<br />
for daily impuse noise exposures different from 100 impulses. (CHABA, 1968)<br />
Once the PSIL value has been calculated, reference to figure 15-31 may be<br />
made to determine what voice level is required to provide acceptable<br />
intelligibility at a given talker-to-listener distance. "Acceptable intelligibility"<br />
here corresponds to a PB intelligibility score of 75 percent and assumes that no<br />
lipreading occurs. The "expected voice level" results from the fact that a speaker<br />
tends to raise his voice level about 3 dB for each 10 dB increase in ambient noise<br />
starting at about 50dB PSIL when he receives no feedback from the<br />
listener. The "communicating voice" is that effort produced when a talker<br />
receives instantaneous feedback of success or failure from the listener.<br />
Workspace Noise Criteria<br />
Beranek (1960) presents criteria for limiting workspaee background noise<br />
where communications interference, loudness, or annoyance of noises are an<br />
important design consideration. These noise criterion curves, or "NC"<br />
curves, are widely used as workspaee design criteria. Figure 15-32 shows the<br />
allowable octave-band SPL (for both commercial and preferred octave<br />
bands) and table 15-10 identifies typical work spaces with the appropriate NC<br />
curves. These curves were derived in such a way that each octave band contributes<br />
about equally to the loudness of the background noise. To be acceptable, the noise<br />
level in each octave band must not exceed the level permitted by the selected NC<br />
curve. It should be noted that when using commercial frequencies the NC number<br />
is also the SIL for that particular spectrum.<br />
I
16<br />
uJ<br />
Z<br />
201_ {<br />
I- 8 _--<br />
w<br />
J<br />
10_<br />
6<br />
o<br />
rr<br />
u. 0.5111<br />
50<br />
Noise and Blast 741<br />
60 70 80 90 100 110 120 130<br />
NOISE LEVEL (dBA)<br />
Figure 15-31. Voice level and distance between talker and listener for satisfactory<br />
face-to-face speech communications, as limited by ambient noise level. Along abscissa are<br />
two generally equivalent objective measures of noise level: average octave-band level in<br />
octaves centered at 500, 1000, and 2000 Hz, called the three-band preferred octave<br />
speech-interference level (PSIL), and A-weighted sound level meter reading (dBA).<br />
Example: Jet aircraft cabin noise is roughly 80 +2 dBA. At 80 dBA with raised voices,<br />
seatmates can converse at 2 ft, and, by moving a little, can lower their voices to normal level<br />
and converse at 1 ft. To ask the stewardess for an extra cup of coffee from the window seat<br />
(4 ft)_ one would need to use his communicating (very loud) voice. (Webster, 1969)<br />
The recommended NC level inside a spacecraft without engines operating is<br />
NC-55.<br />
Community Noise Criteria<br />
It should be clearly recognized that the final decision as to criteria for<br />
community noise exposure is an administrative one. Scientific and tecimical data<br />
may aid in answering questions, but it remains the province of society and legal<br />
administrative officials to make ultimate decisions (Galloway & yon Gierke,<br />
1966). Only society, and its official representatives, can decide what price it is<br />
willing to pay for community noise control.<br />
FAA (1969) lists EPNL limits for new commercial aircraft. Department of<br />
Defense (1964) recommends PNL limits for land use planning around airports.<br />
Fredrikson (1970) discusses zoning ordinances for limiting community noise.<br />
Hearing Protection<br />
Four general approaches may be taken to prevent sound from reaching the<br />
ear: (1) The person may be removed to a distance from the noise source such<br />
that spherical divergence and excess attenuation reduce the noise level to an<br />
5
742 Bioastronautics Data Book<br />
acceptable extent. (2) A physical barrier may be placed between the noise or<br />
blast source and the man. (3) The natural "aural reflex" action of man's<br />
middle-ear muscles may be stimulated as a means of protection. (4)A<br />
mechanical hearing protector may be placed over, or in, the ear canal to<br />
attenuate sound energy. Discussion of this latter approach to noise reduction<br />
will occupy the bulk of this section.<br />
E<br />
Z<br />
O<br />
cq<br />
¢0<br />
ctl<br />
_l<br />
w<br />
><br />
u3<br />
_J<br />
L_<br />
rc<br />
CD<br />
M.J<br />
r¢"<br />
tl-<br />
a<br />
z<br />
a<br />
z<br />
<<br />
b-<br />
o<br />
20 75 _50 300 600 t200 Z400 4800<br />
?_ I_0 300 600 F200 _400 4800 2_.00<br />
-q-.j<br />
-<br />
k \ " -.<br />
OCTAVE BAND CENTER FREQUENCIES<br />
Figure 15-32. Noise criteria (NC curves) referred to preferred octave bands (lower abscissa)<br />
and commercial octave bands (upper abscissa). (From Schultz, 1968) NC 75-90 curves are<br />
present authors' own extrapolations which have been found to be very useful in practical<br />
applications. NC-55 is design criterion for Apollo spacecraft during nonpowered flight.<br />
Mechanical Hearing Protection. Situations often arise in which it is neither<br />
economical nor practical to remove people to a distance from a noise<br />
source or to place a barrier between them and the source. In such cases the<br />
use of mechanical hearing protection is recommended to reduce the noise to<br />
a level which is not hazardous to hearing and/or will permit effective<br />
communication.
¢,=)<br />
Z<br />
O<br />
¢o<br />
o<br />
8<br />
O<br />
Z Z Z Z Z<br />
Noise and Blast 743<br />
tD<br />
o _ _ _-_- °o<br />
-- 'z ?._<br />
_ o _0 _<br />
_ _ _ _-_o,._<br />
.- _E<br />
I I<br />
e_<br />
E<br />
o<br />
Z--
744 Bioastronautics Data Book<br />
Hearing protectors will often improve person-to-person and loudspeakerto-person<br />
communication in noise (Acton, 1967). The same speech signal-tonoise<br />
ratio reaches the ear with and without protection in such cases, but the use<br />
of protection may cause the speech signal to reach the ear at a level in the<br />
optimum range for speech intelligibility (i.e., overall RMS level of about 70 dB).<br />
This effect may, therefore, influence the selection of hearing protection for use<br />
in a given situation. It would be undesirable to recommend a highly effective<br />
hearing protector for use in a relatively low noise level, for example, since this<br />
might reduce the speech signal to below the optimum speech level.<br />
Mechanical hearing protectors fall into four general categories: earplugs,<br />
_mi-inserts, earmuffs, and helmets.<br />
are available in two forms: (1) preformed rubber or plastic<br />
plugs supplied in up to seven sizes, and (2)disposable plugs, such as<br />
wax-impregnated cotton, or "glass down" (a very fine, nonirritating glass wool).<br />
Dry cotton is not recommended for use since it provides negligible sound<br />
attenuation (2 to 5 dB in the lower frequencies: 6 to 10dB at tile higher<br />
frequencies) and may provide a false sense of security.<br />
In order to be maximally effective, earplugs must be properly fitted for size.<br />
It is not unusual to find people who require a different size plug for each ear.<br />
Furthermore, the plugs must be properly inserted each time they are used: they<br />
must be tight to be effective. Finally, the plugs must be kept clean to minimize<br />
the possibility of ear infections.<br />
Semi-inserts are available in one size only and are pressed against the<br />
entrance to the ear canal by a light, spring-loaded headband. If frequent donning<br />
and doffing are required they are very convenient and, unlike bulky earmuffs,<br />
may easily be hung around the neck when not in use. On the other hand,<br />
_mi-inserts may not provide as effective a seal against sound as either earplugs<br />
or earmuffs.<br />
Earmuffs are made in one size only and almost everyone can be fitted<br />
satisfactorily with little difficulty. They attenuate sound as well as, or better<br />
than, earplugs at high frequencies, but are slightly poorer than plugs below<br />
1 kHz. The primary disadvantages of earmuffs are their bulk and relative<br />
expense. They do not, however, entail the fitting and insertion problems of<br />
earplugs. Another advantage, in certain situations, is that a supervisor can readily<br />
determine from a distance that all of his personnel are wearing their hearing<br />
protectors. Where very intense noise levels exist, it may be desirable to wear<br />
both earplugs and earmuffs. The total sound attenuation does not, of course,<br />
equal the sum of the individual protector attenuations, but this combination will<br />
ordinarily provide increased attenuation at most frequencies, with particular<br />
benefit being derived at the low frequencies (Webster & Rubin, 1962).<br />
Helmets can provide more attenuation than the aforementioned devices<br />
if they cover the greater portion of the head. The acoustical importance of a<br />
helmet increases when the SPL reaches a point where bone-conducted _und
Noise and Blast 745<br />
transmission through the skull becomes a controlling factor. In cases other than<br />
this the use of helmets for hearing-protective purposes alone is not justified. The<br />
maximum attenuation which can be provided by a plug, muff or semi-insert is<br />
about 35 dB at 250 Hz and is greater at higher frequencies (Zwislocki, 1955).<br />
After reductions of this magnitude, the remaining sound is conducted through<br />
the bones of the skull directly to the inner ear (Rice & Coles, 1966). An<br />
astronaut's helmet, which _als off the whole head, can provide an additional<br />
10 dB of protection. Beyond this point, conduction of sound by the body is the<br />
limiting factor.<br />
References<br />
Acton, W. I. Effect of ear protection on communications. Annals of Occupational Hygiene,<br />
1967, 10,423-429.<br />
Aeton, W. !. A criterion for the prediction of auditory and subjective effects due to<br />
air-borne noise from ultrasonic sources. Annals of Occupational Hygiene, 1968, 11,<br />
227-234.<br />
Acton, W. I., & Carson, M. B. Auditory and subjective effects of air-borne noise from<br />
industrial ultrasonic sources. British Journal of Industrial Medicine, 1967, 24, 297-304.<br />
Acton, W. I., Coles, R. R. A., & Forrest, M. R. Hearing hazard from small bore rifles.<br />
Rifleman, 1966, 74, 9-12.<br />
Akiyoshi, M., Amemiya, A., Sato, K., Takeda, T., & Shoji, T. On the pathogenesis of<br />
acoustic trauma of the cochlea in rabbits and guinea pigs due to explosion. International<br />
Audiology, 1966, 5,270-271.<br />
Alford, B. R., Jerger, J. F., Coats, A. C., Billingham, J., French, B. O., & McBrayer, R.<br />
O. Human tolerance to low frequency sound. Transactions of the American Academy<br />
of Ophthamoiogy and Otoiaryngology , 1966, 70, 40-47.<br />
American National Standards Institute. American National Standard specification for<br />
audiometers for general diagnostic purposes, Z24.5. New York: American National<br />
Standards Institute, 1951.<br />
American National Standards Institute. American National Standard specifications for an<br />
octave-band fdter set for the analysis of noise and other sounds, Z24.10. New<br />
York: American National Standards Institute, 1953.<br />
American National Standards Institute. American National Standard preferred frequencies<br />
for acoustical measurements, S1.6, New YorK: American National Standards Institute,<br />
1968a.<br />
American National Standards Institute. American National Standard method for<br />
measurement of monosyllabic work intelligibility, $3.2. New York: American National<br />
Standards Institute, 1960b.<br />
American National Standards Institute. American National Standard specification for sound<br />
level meters, SI.4. New York: American National Standards Institute, 1971.<br />
Anticaglia, J. R., & Cohen, A. Extra-auditory effects of noise as a health hazard. Paper<br />
presented to American Industrial Hygiene Association, Denver, May 1969.<br />
Beranek, L. L. The design of speech communication systems. In Proceedings of the<br />
Institute of Rxtdio Engineers, 1947, 35,880-890.<br />
Beranek, L. L. Noise reduction. New York: McGraw-Hill, 1960.<br />
Bonney, T. B. (Ed.)Industrial noise manual. (2nd ed.) Detroit: American Industrial<br />
Hygiene Association, 1966.<br />
Borsky, P. Some of the human factors underlying community reactions to Air Force noise.<br />
Paper presented to NRC Committee on Hearing and Bioaconstics, Washington, D.C.,<br />
1958.<br />
487_858 0 73 - 48
746 Bioastronautics Data Book<br />
Botsford, J. H. Simple method foir identifying acceptable noise exposure. Journal of the<br />
Acoustical Society of America, 1967, 42,810-819.<br />
Botsford, J. H. Using sound levels to gauge human response to noise. Sound and Vibration,<br />
1969, 3 (10), 16-28.<br />
Bowen, I. G., Fletcher, E. R., & Richmond, D. R. Estimate of man's tolerance to the direct<br />
effects of air blast. DASA Report 2113, Lovelace Foundation, _Albuquerque, New<br />
Mexico, October 1968.<br />
Brcadbent, D. C., & Bums, W. Effect of noise on hearing and performance. RNP Report<br />
65/1057, Royal Naval Personnel Research Committee, Medical Research Council,<br />
United Kingdom, April 1965.<br />
de Candole, C. A. Blast injury. Journal of the Canadian Medical Association, 1967, 96,<br />
207-214.<br />
Carter, N., & Kryter, K. D. Equinoxious contours for pure tones and some data on the<br />
"critical band" for TTS. Report 948, Bolt Beranek and Newman, Inc., Cambridge,<br />
Massachusetts, August 1962.<br />
CHABA Hazardous exposure to intermittent and steady-state noise. Report of Working<br />
Group 46, NAS-NRC Committee on Hearing, Bioacousties and Biomechanics,<br />
Washington, D.C., January 1965.<br />
CHABA Proposed damage-risk criterion for impulse noise (gunfire). Report of Working<br />
Group 57, NAS-NRC Committee on Hearing, Bioacoustics and Biomechanics,<br />
Washington, D.C., July 1968.<br />
Chaillet, R. F., Garinther, G. R., Hodge, D. C., & Newcomb, F. R. High-intensity impulse<br />
noise: A major problem. Technical Note 4-64, Human Engineering Laboratories,<br />
Aberdeen Proving Ground, Maryland, August 1964.<br />
Chenowcth, H., & Smith, O. Frequency of atmospheric conditions producing acoustical<br />
focusing over Cape Canaveral, Florida. Report MTP-AERO-61-61, Manned Spaceflight<br />
Center, July 1961.<br />
Cohen, A. Damage risk criteria for noise exposure. Aspects of acceptability and validity.<br />
Journal of the American Industrial Hygiene Association, 1963, 24,227-238.<br />
Cohen, A. Effects of noise on psychological state, in W. D. Ward & J. E. Fricke (Eds.),<br />
Noise as a public health hazard. Proceedings of the conference. Washington: American<br />
Speech and Hearing Association, 1969.<br />
Cohen, A., & Bauman, E. C. Temporary hearing losses following exposure to pronounced<br />
single-frequency components in broad-band noise. Journal of the Acoustical Society of<br />
America, 1964, 36, 1167-1175.75.<br />
Cohen, A., & Jackson, E. Threshold shift in heating as a function of bandwidth and mode<br />
of noise exposure. Report RR-12, Bureau of Occupational Safety and Health, U.S.<br />
Public Health Service, Cincinnati, Ohio, February 1969.<br />
Cole, J. N., & yon Gierke, H. E. Noise from missile static firing and launch sites and the<br />
resultant community response. Technical Report 57-547, Wright Air Development<br />
Center, Ohio, September 1957.<br />
Coles, R. R. A., & Rice, C. G. Speech communications effects and temporary threshold<br />
shift reduction provided by V-51R and Selectone-K earplugs under conditions of high<br />
intensity impulsive noise. Journal of Sound and Vibration, 1966, 4, 172-186.<br />
Coles, R. R. A., Garinther, G. R., Hodge, D. C., & Rice, C. G. Criteria for assessing hearing<br />
damage-risk from impulse-noise exposure. Technical Memo 13-67, Human Engineering<br />
Laboratories, Aberdeen Proving Ground, Maryland, August 1967.<br />
Coles, R. R. A., Garinther, G. R., Hodge, D. C., & Rice, C. G. Hazardous exposure to<br />
impulse noise. Journal of the Acoustical Society of America, 1968, 43,336-343.
Noise and Blast 747<br />
Committee on Conservation of Hearing. Guide for conservation of hearing in noise.<br />
Supplement to Transactions of the American Academy of Ophthamology and<br />
Otolaryngology, 1969.<br />
Crocker, M. J. Measurement of sonic booms with limited frequency response instrumentation.<br />
Report WR 66-20, Wyle Laboratories, Huntsville, Alabama, 1966.<br />
Davis, H., Parrack, H. 0., & Eldredge, D. H. Hazards of intense sound and ultrasound.<br />
Annals of Otology, Rhinology and Laryngology 1949, 58, 732-738.<br />
Department of Defense. Land use planning with respect to aircraft noise. Air Force Manual<br />
86.5, Dept. of the Army Tech. Manual 5-365, Dept. of the Navy Manual NAVDOCKS<br />
P-98, October 1964.<br />
Dyer, I. Estimation of sound4nduced missile vibrations. In S. H. Crandall (Ed.), Random<br />
vibrations. New York: John Wiley, 1958.<br />
FAA Noise standards: Aircraft type certification. Federal Register, 1969.<br />
Fletcher, J. L., & Cairns, A. B. Recovery from impulse noise induced acoustic trauma.<br />
Journal of Auditory Research 1967, 7, 35-39.<br />
Fletcher, J. L., & Loeb, M. The effect of pulse duration on TTS produced by impulse noise.<br />
Journal of Anditory Research, 1967, 7, 163-167.<br />
Fredrikson, H. M. Noise control on the local level. Archives of Environmental Health, 1970,<br />
20,651-654.<br />
French, B.O. Appraisal of Apollo launch noise. Aerospace Medicine, 1967, 38, 719-722.<br />
Galloway, W. J., & yon Gierke, H. E. Individual and community reactions to aircraft noise:<br />
Present status and standardization. Paper presented to London Noise Conference, 1966.<br />
Garinther, G. R., & Moreland, J. B. Transducer techniques for measuring the effect of small<br />
arms' noise on hearing. Technical Memo 11-65, Human Engineering Laboratories,<br />
Aberdeen Proving Ground, Maryland, July 1965.<br />
Golden, P. M., & Clare, R. The hazards to the human ear from shock waves produced by<br />
high energy electrical discharge. Report E-1/65, United Kingdom Atomic Energy<br />
Authority, Atomic Weapons Research Estabhshment, Aldermaston, Berks, England,<br />
1965.<br />
Hamberger, C. A., & Lidcn, G. The prognosis in hearing injuries following acoustic shot<br />
trauma. Acta Otolaryngologica, 1951, 39, 160-165.<br />
Hill, R. E. Space Division, North American Rockwell Corporation, Downey, California, 20<br />
November 1969. (Unpublished data)<br />
Hirsch, F. G. Effects of overpressure on the ear-A review. DASA Report 1858, Lovelace<br />
Foundation, Albuquerque, New Mexico, November 1966.<br />
Hodge, D. C., & McCommons, R. B. Reliability of TTS from impulse-noise exposure.<br />
Journal of the Acoustical Society. of America, 1966, 40, 839-846.<br />
Hodge, D. C., & McCommons, R. B. Growth of temporary threshold shift from impulse<br />
noise: A methodological study. Technical Memo 10-67, Human Engineering<br />
Laboratories, Aberdeen Proving Ground, Maryland, May 1967(a).<br />
Hodge, D. C., & McCommons, R. B, A behavioral study of the sound-shadow effect in<br />
impulse noise. Technical Memo 12-67, Human Engineering Laboratories, Aberdeen<br />
Proving Ground, Maryland, July 1967(b).<br />
Hodge, D. C., Gates, H. W., Helm, C. P., Soderholm, R. B., & Biackmer, R. F. Preliminary<br />
studies of the impulse-noise effects on human hearing (Project HumlN). Technical<br />
Memo 15-64, Human Engineering Laboratories, Aberdeen Proving Ground, Maryland,<br />
December 1964.<br />
House, A. S., Williams, C., Hecker, M. H., & Kryter, K. D. Psychoacoustic speech tests: A<br />
modified rhyme test. TDR 63-403, Electronic Systems Division, L. G. Hanscom Field,<br />
Bedford, Mass.,June 1963.
748 Bioastronautics Data Book<br />
International Standards Organization. Standard reference zero for the calibration of<br />
pure-tone audiometers. Recommendation 389, International Organization for<br />
Standardization, 1964.<br />
Jacobson, B., Dyer, E. M., & Marone, R.J. Effectiveness of the V-51R earplug with impulse<br />
pressures up to 8 psi. Technical Memo 1-63, Human Engineering Laboratories, Aberdeen<br />
Proving Ground, Md., November 1962.<br />
Jansen, G. Effects of noise on physiological state. In W. D. Ward & J. E. Fricke (Eds.),<br />
Proceedings of the conference on noise as a public health hazard. Washington:<br />
American Speech and Hearing Association, 1969.<br />
Jepger, J., Alford, B., Coats, A., & French, B. Effects of very low frequency tones on<br />
auditory thresholds. Journal of Speech and Hearing Research, 1966, 9, 150-160.<br />
J. F. Kennedy Space Center. Results of AS-503 facilities and environmental measurements,<br />
Vol. 1. Technical Report 927, January 1969.<br />
Kryter, K. D. Methods for the calculation and use of the articulation index. Journal of the<br />
Acoustical Society of America, 1962, 34, 1689-1697.<br />
Kryter, K. D. Exposure to steady-state noise and impairment of hearing. Journal of the<br />
Acoustical Society of America, 1963, 35, 1515-1525.<br />
Kryter, K. D. Personal communication with D. C. Hodge, 1964.<br />
Kryter, K. D. Concepts of perceived noisiness, their implementation and application.<br />
Journal of the Acoustical Society of America, 1968, 43,344-361.<br />
Kryter, K. D. Possible modifications to the calculation of perceived noisiness. Report<br />
CR-1636, National Aeronautics and Space Administration, Langley Research Center,<br />
1970a.<br />
Kryter, K.D. The effects of noise on man. New York: Academic Press, 1970b.<br />
Klumpp, R. G., & Webster, J. C. Physical measurements of equally speech interfering Navy<br />
noises. Journal of the Acoustical Society of America, 1963, 35, 1328-1338.<br />
Loeb, M., & Fletcher, J. L. Temporary threshold shift for "normal" subjects as a function<br />
of age and sex. Journal of Auditory Research, 1963, 3, 65-72.<br />
Loeb, M., & Fletcher, J. L. Impulse duration and temporary threshold shift. Journal of the<br />
Acoustical Society of America, 1968, 44, 1524-1528.<br />
Luz, G. A., & Hodge, D. C. Recovery from impulse-noise induced TTS in monkeys and<br />
men: A descriptive model. Journal of the Acoustical Society of America, 1971, 49,<br />
1770-1777.<br />
Mills, J. If., Gengel, R. W., Watson, C. S., & Miller, J. D. Temporary changes of the auditory<br />
system due to prolonged exposure to noise. Journal of the Acoustical Society of<br />
America, 1970, 47, 85.<br />
Mohr, C. G., Cole, J. N., Guild, E., & yon Gierke, H. E. Effects of low frequency and<br />
infrasonic noise on man. Aerospace Medicine, 1965, 36, 817-824.<br />
Murray, N. E., & Reid, G.J. Temporary deafness due to gunfire. Laryngoscope, 1946, 61,<br />
91-121.<br />
Nakamura, S. Some of the basic problems in noise trauma. Paper presented to 65th<br />
symposium of Japan Ear, Nose and Throat Science Association, May !964. (Tech.<br />
Transl. FSTC-HT-23.869-68, U.S. Army Foreign Science and Technology Center,<br />
Washington, D.C.)<br />
NASA-Marshall Space Flight Center. Safety and design considerations for the static test and<br />
launch of large space vehicles. Part II-B: Acoustic hazards and design data, Joint Air<br />
Force-NASA Hazards Analysis Board, 1961.<br />
Nixon, C. W., Harris, C. S., & yon Gierke, H. E. Rail test to evaluate equilibrium in low-level<br />
wideband noise. AMRL Tech. Report 66-85, Wright-Patterson Air Force Base, Ohio,<br />
1966.
Noise and Blast 749<br />
Nyborg, W. L., & Mintzer, D. Review of sound propagation in the lower atmosphere.<br />
WADC Tech. Report 54-602, Wright-Patterson Air Force Base, 1955.<br />
Occupational Safety and Health Administration. Occupational Safety and Health Act, Part<br />
1910.95, Federal Register, 1970, 36, (105), 10518.<br />
Panian, Z. Influence of noise on certain functions of the eye, Vojnosanitetski Pregted,<br />
20, 19-26. 1963. (Transl. No. J-1397, Office of Assistant Chief of Staff for Intelligence,<br />
Department of the Army, Washington, D.C., 1967).<br />
Parrack, H. O. Effects of air-borne ultrasound on humans. International Audiology, 1966,<br />
5, 294-308.<br />
Pease, C. G. Obtaining the spectrum and loudness of transients by computer. Tech. Report<br />
I, Institute of Sound and Vibration Research, University of Southampton, England,<br />
December 1967.<br />
Perkins, B., Lorrain, P. H., & Townsend, W. H. Forecasting/he focus of air blast due to<br />
meteorological conditions in the lower atmosphere. Report 1118, Ballistics Research<br />
Laboratories, Aberdeen Proving Ground, Md., 1960.<br />
Piesse, R. A., Rose, J. A., & Murray, N. E. Hearing conservation in industrial noise. Report<br />
19, Commonwealth Acoustic Laboratories, Sydney, Australia, June 1962.<br />
Plomp, R., Gravendeel, D. W., & Mimpen, A. M. Relation of hearing loss to noise spectrum.<br />
Journal of the Acomaical Society of America, 1963, 35, 1234-1240.<br />
Rice, C. G Deafness due to impulse noise. Philosophical Trarm_tion_ of the Royal Society<br />
of London, 1968, A 263, 279-287.<br />
Rice, C. G., & Coles, R. R. A. Impulsive noise studies and temporary threshold shift. Paper<br />
B67 presented at 5th International Congress on Acoustics, Liege, Belgium, 1965.<br />
Rice, C. G., & Colts, R. R. A. Design factors and use of ear protection. British Journal of<br />
Industrial Medicine, 1966, 23,194-203.<br />
Rosenblith, W. A., & Stevens, K. N. Handbook of acoustic noise control. Vol. II: Noise and<br />
man. Tech. Report 52-204, Wright Air Development Center, June 1953.<br />
Sataloff, J. Hearing loss. Philadelphia: Lippincott, 1966.<br />
Schultz, T. J. Noise-criterion curves for use with the USASI preferred frequencies. Journal<br />
of the Acoustical Society of America, 1968, 43,637-638.<br />
Shoji, H., Yamamoto, T., & Takagi, K. Studies on TTS due to exposure to octave-band<br />
noise. Journal of the Acoustical Society of Japan, 1966, 22, 340-349.<br />
Singh, D., & Ahluwalia, K. J. S. Blast injuries of the car. Journal of Laryngoiogy, 1968, 82,<br />
1017-1028.<br />
Smith, R. P., & Loeb, M. Recovery from temporary threshold shifts as a function of test<br />
and exposure frequency. Journal of the Acoustical Society of America, 1969, 45,<br />
238-239.<br />
Society of Automotive Engineers. Standard values of atmospheric absorption as a function<br />
of temperature and humidity for use in evaluating aircraft flyover noise, ARP 866,<br />
Society of Automotive Engineers, 1964.<br />
Sperry, W. C. Aircraft noise evaluation. Tech. Report 68-34, Federal Aviation Agency,<br />
Washington, D.C., September 1968.<br />
Tamenholtz, S. D. Research on acoustic problems of /he military: A review and future<br />
aspect. Tech. Report 69-ff-PR, U.S. Army Natiek Laboratories, Nafick, Mass., October<br />
1968.<br />
Ward, W. D. Recovery from high values of temporary threshold shift. Journal of the<br />
Acoustical Society of America, 1960, 32,497-500.<br />
Ward, W. D. Effect of temporal spacing on temporary threshold shift from impulses.<br />
Journal of the Acoustical Society of America, 1962, 34, 1230-1232.
750 Bioastronautics Data Book<br />
Ward, W. D. Auditory fatigue and masking. In J. Jergcr (Ed.), Modern developments in<br />
audiology. New York: Academic Press, 1963.<br />
Ward, W. D. Temporary threshold shift following monaural and binaural exposures. Journal<br />
of the Acoustical Society of America, 1965, 38, 121-125.<br />
Ward, W. D. Susceptibility to auditory fatigue. In W. D. Neff (Ed.), Advances in sensory<br />
physiology. Vol. 3. New York: Academic Press, 1968.<br />
Ward, W. D. Effects of noise on hearing thresholds. In W. D. Ward & J. E. Fricke (Eds.), In<br />
proceedings of the conference on noise as a public health hazard. Washing-<br />
ton: American Speech and Hearing Association, 1969.<br />
Ward, W. D. Temporary threshold shift and damage risk criteria for intermittent noise.<br />
Journal of the Acousticc3 Society of America, 1970, in press.<br />
Ward, W. D., & Glorig, A. A ease of firecracker-induced hearing loss. Laryngoscope, 1961,<br />
61, 1590-1596.<br />
Ward, W. D., Glorig, A., & Sklar, D. L. Relation between recovery from temporary<br />
threshold shift and duration of exposure. Journal of the Acoustical Society of Americe,<br />
1959a, 31,600-602.<br />
Ward, W. D., Giorig, A., & Sklar, D. L. Susceptibility and sex. Journal of the Acoustical<br />
Society of America, 1959b, 31, 1138.<br />
Ward, W. D., Selters, W., & Glorig, A. Exploratory studies on temporary threshold shift<br />
from impulses. Journal of the Acoustical Society of America, 1961, 33,781-793.<br />
Webster, J. C. SIL-Past, present, and future. Sound and Vibration, 1969, 3, (8), 22-26.<br />
Webster, J. C., & Rubin, E. R. Noise attenuation of ear protection devices. Sound, 1962, 1,<br />
34-46.<br />
Wegel, R. L., & Lane, C. E. The auditory masking of one pure tone by another and its<br />
probable relation to the dynamics of the inner ear. Physics Re_qew, 1924, 23,266-285.<br />
Wilhold, G. A., Guest, S., & Jones, J. A technique for predicting farfieid acoustic<br />
environments duc to a moving rocket sound source. Technical Note D-1832, National<br />
Aeronautics and Space Administration, August 1963.<br />
Wilhold, G. A., Jones, J., Guest, S., Cole, J., & Parrack, H. O. Acoustic energy hazards. In<br />
Chemical rockets/propellent hazards, Vol. 1, Chapter 7, Publication No. 194, Chemical<br />
Propellent Information Agency, Johns Hopkins University Applied Physics Laboratory,<br />
Silver Spring, Md., May 1970.<br />
Yuganov, Ye. M., Krylov, Yu. V., & Kuznetsov, V. S. Standards for noise levels in cabins of<br />
spacecraft during long-duration flights. In V. N. Chemigovskiy (Ed.), Problems in space<br />
biology, Vol. 7: Operational activity, problems in habitability and biotechnology.<br />
Moscow: Nauka Press, 1967. (Tech. Transl. F-529, National Aeronautics and Space<br />
Administration, Washington, D.C., 1969.)<br />
Yuganov, Ye. M., Mirzoyev, B. M., Krylov, Yu. V., & Knznetsov, V. S. Material on the<br />
physiolngicaldaygienie basis of the allowable levels of impulse noises (sound shocks). In<br />
V. V. Parin (Ed.), Problems of space medicine: Data on the conference of 24.27 May<br />
1966. Moscow: Ministry of Public Health, 1966. (Tech. Transl. 66-34698 (JPRS<br />
38-272), Clearinghouse for Federal Scientific and Technical Information, Washington,<br />
D.C. 1966.)<br />
Zwislocki, J. Design and testing of earmuffs. Journal of the Acoustical Society of America<br />
1955, 27, 1154-1163.
CHAPTER 16<br />
HUMAN CONTROL CAPABILITIES<br />
by<br />
Laurence Retman Young, Sc.D<br />
Massachusetts Institute of Technology<br />
This chapter concentrates on the capabilities and limitations of man as an element<br />
in a closed loop control system under normal environmental conditions. Only<br />
by careful consideration of the engineering aspects of man as a control element can<br />
performances of man-vehicle systems be assessed, stability and power assists be designed,<br />
and trade_ffs between manual and automatic functions be determined<br />
objectively.<br />
The usual breakdown of man's functions in a piloting task is shown in<br />
figure 16-1. The human operator uses his various senses to gain information on<br />
vehicle state and the command situation, integrates this information centrally<br />
where the appropriate control actions are decided upon, and through the use of<br />
effectors such as control sticks, changes the inputs to the vehicle or plant which is<br />
being controlled. In the typical piloting application, man participates in two levels<br />
of this man-machine system; control and guidance. In his control function, man<br />
establishes an equilibrium state of vehicle motion and regulates departures of the<br />
vehicle from equilibrium. In guidance man determines the appropriate course and<br />
speed to reach a desired point under constraints of time, fuel, position error, and<br />
accelerations. Typically the progression from control to guidance involves manual<br />
control functions which are successively slower in their characteristics but require a<br />
higher level of decision-making. The remainder of this chapter considers the human<br />
controller, controls, and displays. The effects of other-than-normal environments<br />
on the human senses and effectors are discussed in other chapters of this book.<br />
Nature of Manual Control<br />
Controller Characteristics<br />
The controlle, _ characteristics considered in this section correspond to<br />
continuous pilotiitg tasks. Information i8 received by observing meters, CRT<br />
Reviewed by Duane T. McRuer, M.S., Systems Technology, Inc.<br />
751
752 Bioastronautics DataBook<br />
displays, or other continuous information presentations, and responses are made<br />
by continuous movements of control sticks, rudder pedals, or other manual<br />
devices. This section includes empirical data on performance limitations and<br />
relative ease of controlhng in different types of situations. It also summarizes<br />
mathematical models for the human operator proposed as attempts to make<br />
engineering approximations to the pilot which can be used in systems design.<br />
Some of the more important variables which affect the human controller characteristics<br />
are: task variables (dynamics of the controlled element, characteristics<br />
of the manipulator, command inputs), environmental variables (temperature,<br />
vibration, acceleration), operator-centered variables (experience, training,<br />
alertness, fatigue, motivation), and procedural variables (instructions, order of<br />
presentations in competing configurations, analysis procedures).<br />
THE "HUMAN OPERATOR"<br />
COMMANOS fi_*S_AL coe_eE N_ T_oe_ MANU.L v,Ig_C. o............. VEHICLE TAT<br />
AURAL t =UL *O_l_vt J,_ _ =t. C $ E<br />
Figure 16-1. Human operator in a control task.<br />
Modes of Tracking: Compensatory, Pursuit, and Precognitive<br />
Three major modes of human tracking are distinguished and illustrated in<br />
figure 16-2.<br />
In compensatory tracking the operator observes only the system error or the<br />
difference between the system command and the actual system output. He has<br />
no explicit information on whether changes in this error result from a change in<br />
the command or a change in the vehicle output. Of course he may always<br />
estimate the contribution of changes in vehicle output to the observed error<br />
changes on the basis of the controls he has applied. Typical examples of<br />
compensatory situations are tracking a target through a telescopic sight or<br />
following a glideslope descent schedule by nulhng ILS needles. In the next stage<br />
of manual control, pursuit tracking, the human operator has explicit displays of<br />
system command and vehicle output separately. He can derive system error by<br />
direct comparison of the two. The pursuit situation simplifies the problem of<br />
stability by "allowing the operator to observe the vehicle output directly without<br />
interference from changing inputs. It also enables him to somewhat predict input<br />
by extrapolating from the current input and its derivatives. Examples are<br />
following a descent schedule in which command altitude and actual altitude are<br />
displayed simultaneously on the same altimeter, or tracking a moving object in<br />
which the azimuth and elevation of both the target and the tracking device are<br />
simultaneously displayed on the same instrument using different symbols.<br />
Finally, for precognitive tracking the operator has explicit or implicit<br />
information about future values of the input. Thus for driving an automobile on<br />
a curved road or lining up an airplane for a landing on a runway, the future
tlumanControl Capabilities 753<br />
requiredpathaswellasthe currentpositionof thevehicleareexplicitly<br />
available. Similarly,displays, whichshowwhereobstacles or desiredpathswill<br />
bein thefuture,leadto precognitive tracking. In addition, theoperatormay<br />
performprecognitive trackingif he is ableto extractreliablepredictive<br />
informationaboutinputordisturbance fromtheperiodicities orpredictability<br />
of thesesignals. In general, theoperatoris ableto overcomemostof the<br />
limitationsassociated withhisdecision timesandneuromuscular dynamics inthe<br />
cases ofprecognitive orpreviewtracking.<br />
ImO++<br />
P_lamOn Co++tollta<br />
Pilol E lemeat<br />
Ctmlrol<br />
_tr, ,<br />
(c / I_,s,a/ P_ase : COM, I_NSATOOY ¢S,_¢_ L ooD)<br />
F"+ -- -- Mmmoa P,lot - •<br />
I+pu_ +<br />
Ou_pu+<br />
+<br />
Con oleo<br />
I E It+men<br />
l t<br />
• l IE,,o, I c<br />
+<br />
I I<br />
L .......... --+<br />
(b) Second _,_o+e PUNSUzr _+m/oo_]<br />
.................... 7<br />
, Retoo_et<br />
FIO#IItn, N4P+rO<br />
Or Cue Mu+Cu_O,<br />
Detec¢ot<br />
H.a.m On P,IO_<br />
(cJ f,_o¢ P/,as¢ _ECOGIVlrJVE (OP,'._ Local<br />
Figure 16-2. Successive organization of perception. (McRuer et al., 1968)<br />
Quasilinear Models<br />
Precision and Approximate Models. The most generally applied model of<br />
the human operator used in analysis of man-machine performance is the<br />
quasilinear model, so named because it represents the human operator as a "best<br />
linear approximation" plus a remnant to account for the human control outputs<br />
other than those predicted by the linear approximation (figure 16-3).<br />
c<br />
Co..oiled<br />
E _emem
754 Bioastronautics Data Book<br />
r REMNANT 1 Distur bonce,_,/<br />
I ne I;, Manipulator, IYc '_; Display ; iw) I |<br />
I- I<br />
Foecin_ I<br />
[TRANSFER CHA_<br />
lO#erolor<br />
, _<br />
ONT_O(.LEO<br />
.....<br />
ELEMENT<br />
I<br />
S<br />
Y<br />
stem<br />
Fu.'_ct_on .A Error I ..L [ ...... i-1 fO_tput I (Effec_pvlver, cw I Outer<br />
_-<br />
-<br />
. , +<br />
4L-_" !<br />
I<br />
l<br />
i<br />
HUMAN-<br />
(Oescr;blng Funchon Matril) _ o_d<br />
It,, ,.,o,,_,o,o,,Yo_._o,._l _ _ I o_,_.'o,o,_',o_i-)l<br />
I ..... _.......... J 1<br />
'<br />
1 1Y¢(i,_), I<br />
/<br />
I<br />
OPE RATOR CHARACTERISTICS I<br />
Figure 16-3. Quasilinear human operator model. (MeRuer & Weir, 1969)<br />
The linear approximation generally used is the Gaussian input describing<br />
function. It varies significandy with the dynamics of the controlled element, as<br />
well as with the nature of the display and the bandwidth of the input. It is<br />
applicable only for tracking situations involving random or random appearing<br />
continuons inputs or disturbances and without additions, does not accurately<br />
predict responses to transient input such as steps or impulses, or in situations<br />
where one can preview the input. The most detailed form of this model is the<br />
precision model of McRuer et al. (1965), leading to a human operator describing<br />
function given in the following equation:<br />
Yp(jCd) : Kp_+ \T_j-----_+ T TN1 j60 + l)F/it,_\2L t_)<br />
r I i I<br />
H.O. De- Vari- Adjustable Approximation<br />
scribing able Lead-Lag to Low<br />
Function Gain Equalization Frequency Gain<br />
and Phase<br />
I _<br />
e-jc0r<br />
+ _ joe+ O)<br />
High Frequency Delay<br />
Neuromuscular Time<br />
Characteristics<br />
The use of this equation in systems design is limited to cases where accurate<br />
characterization at very high frequencies (>4 rad/sec) or very low frequencies<br />
are required (McRuer et al., 1965). Primary adjustment of operator<br />
characteristics is through the gain (Kp) and the lead and lag time constants (TL<br />
and TI). The neuromuscular characteristics change primarily with forcing-<br />
function bandwidth and with manipulator (control stick) restraints. A typical<br />
Bode plot for the neuromuscular system portion is shown in figure 164.<br />
(TLj_ + 1) e_J_Ze (2)<br />
Yp(jr_):Kp (TIj _ + 1)
Human Control Capabilities 755<br />
For practical systems design purposes, the above simplified model is<br />
generally adequate, r e is the effective time delay comprising the delays<br />
associated with reading and interpreting the display, deciding upon the<br />
appropriate control motion, and the high frequency neuromuscular lags. TL, the<br />
lead time constant, expresses the ratio of the weight the operator attributes to<br />
the displayed velocity compared to the displayed position. TI, the integral time<br />
constant, represents the amount of data smoothing the operator applies.<br />
There havc been a number of attempts to generate empirical and<br />
theoretically based adjustment rules for selecting the variable parameters of the<br />
pilot describing function appropriate to each compensatory tracking case. The<br />
simplest of these is the crossover model popularized by McRuer and his<br />
associates.<br />
The Crossover Model. The crossover model is based on the notion that the<br />
human operator adjusts his parameters so that the open loop frequency response<br />
[Yp (jo_) Yc (j6_)] satisfies conditions for closed loop stability and reasonably<br />
low error. The pilot adjusts his own transfer function to compensate, insofar as
756 Bioastronautics Data Book<br />
possible, for the transfer function of the controlled element. To quote from<br />
McRuer and Jex (1967, p. 234):<br />
The pilot adopts sufficient lead or lag equalization so that the slope<br />
of IYoLI = ]YpY¢I lies very close to -20dB/decade in the region of<br />
crossover frequencies. Besides the -90 deg phase shift associated with<br />
the 20dB/decade amplitude ratio, there is an accumulation of<br />
additional lags due to transport delays and high frequency<br />
neuromuscular dynamics. All of these can be represented (near<br />
crossover frequencies) by an effective time delay "re .<br />
[The crossover frequency (¢Oc) is the frequency at which the open loop<br />
amplitude ratio is unity, or zero dB.] The crossover model is:<br />
YOL(J 6°) " YpYc -<br />
COce<br />
j60<br />
, near COc. (3)<br />
Thus the open loop transfer function approximates an integrator and time delay<br />
in the region of the crossover frequency. Notice that in this simplified model<br />
only two parameters, me and "re, are functions of the task variables; plant<br />
dynamics, Yc, input bandwith, 60i, and manipulator characteristics. In situations<br />
involving rotational motion, the first-order effects of motion can also be<br />
accounted for in "re"<br />
Using the simple human operator describing function model of Equation 2,<br />
the parameters are varied according to the form of Yc, such that the system is<br />
stable, the magnitude ratio YpYc has a sl_,ve of approximately -20 dB/decade<br />
near _c, and the low frequency amplitude ratio is much greater than 1. Forms<br />
of the pilot's describing function for a variety of common controlled elements<br />
are given in table 16-1.<br />
Selection of actual values of ¢oc and "re for particular values of plant<br />
dynamics and input bandwidths is somewhat empirical.<br />
¢°c (Yc' 6_i) -'- %0 (Yc) + A¢°c and<br />
(Yc' ¢°i) " 7"0(Yc) A'r(¢°i)<br />
The following are u_ful linear approximations to the dependency of crossover<br />
frequency and time delay on input bandwidth:<br />
/x6_ c = 0.18 60 i and<br />
A_" = 0.G8¢o i<br />
(4)
O<br />
O<br />
.< t-<br />
O<br />
°_<br />
J<br />
m<br />
uJ<br />
Human Control Capabilities 757<br />
3P 3" -I_<br />
V I _ .tb<br />
¢-<br />
3<br />
_>-= 3 + 3 -<br />
_g 31,<br />
n u. _.<br />
E<br />
-_i -_<br />
u. _<br />
-- -r _.1<br />
l.i<br />
3 I<br />
3 U 3 _<br />
I v/ v<br />
- 3 : 3 +<br />
+ "T + 'T 3<br />
3 _ 3 %'=<br />
,_ ),-<br />
._._ v ..a v<br />
v v<br />
A _ V_-, _,ir<br />
=_ _= _o ,,_ _= .= ,._<br />
÷<br />
+<br />
_13=<br />
+
758 Bioastronautics Data Book<br />
The crossover frequency increases with input bandwidth until 6o. "_ 086o ,<br />
I -- ° C O<br />
when it is again reduced. Data on 6oc and _T is given in figure 16-5. Tlie<br />
dependency of 6oco and 7"0 (the values for crossover and effective time delay<br />
with no forcing function) for several plants are summarized in table 16-2. The<br />
value of _c can be used if the effect of input bandwidth on 6oc is ignored. Note<br />
that tile operator effective time delay also varies with the amount of lead<br />
equalization he must supply. When the pilot is acting as a pure amplifier with a<br />
delay (Yc = K/j6o), the effective time delay is of the order of 0.36 second. As<br />
more lead is required [Yc = Kc/(J6o)2]then the operator's effective time delay<br />
also increases. When the operator introduces lag, however, in the case of<br />
controlling a pure gain, his effective time delay is slightly reduced.<br />
u<br />
_5<br />
3°4<br />
6<br />
c<br />
g 3<br />
or<br />
u. 2<br />
t.)<br />
I --<br />
0 0<br />
K c<br />
Kc/(ju-2 )<br />
m Kc/(j=) =<br />
I I ] I<br />
! 2 3 4<br />
Fotcin 9 Function Bandwidth, _i (rod/sec)<br />
(a) Variations of crossover frequency with forcing function bandwidth<br />
0.3 m<br />
Human Control Capabilities<br />
Table 16-2<br />
Summary of Crossover Parameters<br />
TO co_o _o_<br />
Y c (sec) (tad/sec) (rad/sec)<br />
K C<br />
Kc/j (tO<br />
Kc/iJ CO- 1Pr)<br />
Kc/(jbj)2<br />
(McRuer et al., 1965)<br />
0.33<br />
0.36<br />
0.36<br />
0.51<br />
The performance expected of a dosed loop system including a human<br />
operator using the crossover model can be approximated very simply on the<br />
basis of the crossover model. If the input spectrum is assumed to be<br />
rectangular and band limited (maximum frequency 60i, uniform power<br />
spectral density t_ii , and mean square input power oi2), then the ratio of<br />
mean square error to mean square input is easily found by use of<br />
figure 16-6.<br />
4.8<br />
4.4<br />
4.4<br />
3.0<br />
oo,! i<br />
0005 05 qO<br />
re_c<br />
Figure 16-6. Mean square error ealeulated from the crossover model.<br />
L<br />
5.8<br />
4.75<br />
4.9<br />
3.25<br />
759
760 Bioastronautics Data Book<br />
A typical example of measured open loop frequency respon_ for a simple<br />
rate control plant at three input bandwidths is shown in figure 16-7.<br />
Figure 16-7. Measured open loop frequency response data. Averaged open loop describing<br />
function for Yc = Kc/JCO with ¢,di as parameter. (McRuer et al., 1965)<br />
Remnant. In addition to the quasilinear portion of describing functions, the<br />
remnant, or added disturbance injected by the operator, must be considered to<br />
establish the total error in a tracking loop. For certain conditions in which pilot<br />
behavior is particularly nonstationary and nonlinear (especially in tracking high<br />
order systems requiring pulsatile control), the contribution of remnant to error<br />
may be very significant. Levison et al., (1969) have shown certain simplifications<br />
if the remnant is referred to equivalent observation noise appearing at the<br />
operator's input, that is, added to the system error. (In most literature prior to<br />
1968, the remnant is given as additive noise at the operator's output.) By<br />
normalizing the observation noise spectrum with respect to the input noise<br />
spectrum, the injected observation noises seem to be relatively constant at<br />
approximately(-20 dB)and independent of frequency, input amplitude, vehicle<br />
dynamics, or input bandwidth (figure 16-8). The observed remnant in terms of<br />
I<br />
ol
Human Control Capabilities 761<br />
normalized observation noise spectrum increases significantly when the display is<br />
used peripherally rather than foveally. The effect of remnant on system error<br />
can be minimized by control design which does not require the operator to<br />
generate low frequency lead. Optimum controlled element gain and filtering of<br />
the operator's output can further reduce the contribution of remnant to error or<br />
to exciting high order system modes.<br />
it x<br />
,_,- 20<br />
o<br />
- 40<br />
o j 8<br />
8<br />
9 fl<br />
MS!,23DEG t]<br />
I<br />
-6( (_Z 0.5 0 2 5 10 20 50 _uQ<br />
FREQUENCY (RAD/SEC)<br />
(a) Effect of mean squared input on the normalized observation noise spectrum.<br />
zo<br />
Vehicle dynamics = K/s<br />
Input bandwidth = 0.5 Rad/Sec<br />
Average of 3 subjects<br />
N-zG 0 • O<br />
-trOt O.Z 0.S *.O 2 S _O<br />
FREOUE NCY. ( rod/sec)<br />
OK<br />
O K/S<br />
A K/S z<br />
_____<br />
20 50 _uO<br />
(b) Effect of vehicle dynamics on the normalized observation noise spectrum.<br />
Average of 3 subjects (K and K/s 2)<br />
Average of 4 subjects (K/s)<br />
Figure 16-8. Remnant expressed as normalized observation noise spectrum.<br />
(Levison et al., 1969)<br />
487-858 O - 73 - 49
762 Bioastronautics Data Book<br />
ZO<br />
0<br />
N<br />
_. -<br />
0<br />
(c)<br />
o=<br />
e_ N<br />
i<br />
-6q h a e ,,._<br />
20<br />
I<br />
ON<br />
FREQUENCY (RAD/SEC|<br />
|<br />
O _i = 0.5 RAD/SEC [<br />
0 _i • LO RAOISEC<br />
¢_i • 2.O RADISEC<br />
Effect of input bandwidth on the normalized observation noise spectrum.<br />
O_<br />
Vehicle dynamics = K/s<br />
Average of 3 subjects<br />
o o o_ _ v_<br />
• ° ° • - _ w<br />
F O FOVEAL<br />
i<br />
-40 -- O 16 e PERIPHERAL, REF EXT.<br />
A 16o PERIPHERAL, NO REF. EXT.<br />
O 22 e PERIPHERAL, NO REF. EXT.<br />
0(36 OA O,Z 05 gO 2<br />
FREQUENCY (rod/sec)<br />
s • =_ so<br />
(d) Effect of viewing conditions on the normalized observation noise spectrum.<br />
Vehicle dynamics = K/s<br />
Average of 4 subjects<br />
Figure 16-8. Remnant expressed as normalized observation noise spectrum.<br />
(Levison et al., 1965) - Continued<br />
Pursuit Tracking. Little experimental data on pursuit tracking is available. It<br />
is surmised that the pilot uses information on input alone to attempt open loop<br />
tracking. To this extent, he can be considered to operate on the input signal with<br />
a transfer function Ypi, which is just equal to the reciprocal of the controlled<br />
element (Ypi = 1/Yc). The remaining errors associated with inaccuracies inopen loop<br />
tracking and injected remnant are compensated by dosed loop compensatory<br />
tracking. The effect of pursuit tracking is to permit the operator to overcome
Human Control Capabilities 763<br />
internal delays and reduce his phase lag, thereby producing higher gains than for<br />
compensatory tracking at frequencies above 0.4 Hz. Figure 16-9 shows some<br />
compensatory-pursuit frequency response comparisons for Ye = K.<br />
(a)<br />
(b)<br />
i-20<br />
3C<br />
1.4<br />
1.2<br />
LO<br />
OJ<br />
o.a<br />
0.4<br />
0.2<br />
-I0<br />
I0<br />
w *30<br />
0<br />
-4O<br />
-50<br />
-60<br />
I I I 1<br />
02 0.4 Oe O.g<br />
FREQUENCY (opt)<br />
0.96<br />
13-_-5035 -rz[<br />
l [ 1 1<br />
0.2 0,4 0.6 O.O<br />
FREQUENCY |c_.)<br />
Figure 16-9. Pursuit and compensatory Yc (j60)frequency characteristics<br />
for Yc = K and various input bandwidths. (Elkind, 1956)<br />
LU<br />
I,Q
764 Bioastronautics Data Book<br />
(c)<br />
(d)<br />
m<br />
14<br />
t2<br />
IO<br />
oe<br />
04<br />
O.Z<br />
-tO<br />
-ZO<br />
-40<br />
-SO<br />
-6o<br />
o<br />
I<br />
0.16<br />
02<br />
0,24 0.40<br />
PU RSU IT<br />
• 0.64<br />
,,r<br />
I<br />
_ isn sm_-0q<br />
1 l l i 1<br />
0.4 01 08 IO<br />
FREQUENCY (¢N)<br />
[$-$l-SOD-g2[<br />
I I I I<br />
0.2 0,4 0.6 0.8 i.0<br />
FRE0_NCY(cN)<br />
Figure 16-9. Pursuit and compensatory Yc (jCO)frequency characteristics<br />
for Yc = K and various input bandwidths. (Elkind, 1956) - Continued<br />
Further study of pure pursuit tracking with input only [i (t)] or pursuit plus<br />
disturbance [g(t)], shown in figure 16-10, has explored pursuit behavior as the<br />
sum of an operation on the inputs, output, and error. Precision pilot model
tluman Control Capabilities 765<br />
parameters, using the model of Equation 1, are given for the various cases in<br />
table 16-3. The use of pursuit tracking in the presence of disturbances yielded no<br />
improvement in performance over simple compensatory tracking.<br />
(a)<br />
(b)<br />
i(t)<br />
.......... PILOT ...... 1<br />
MODEl, n(t_ I g(1)<br />
I<br />
,,<br />
PILOT .....<br />
r ......... 1<br />
I MODE/, n(t) I g(I)<br />
_,l,_:(t,r----7 i i I<br />
w_.l _ / v EmCl._. /<br />
o'(t)<br />
@<br />
Figure 16-10. Pure pursuit tracking: a. with input only [i (t)];<br />
b. plus disturbance [g (t)]. (Reid, 1969)<br />
n(t)
766 Bioastr0nautics Data Book<br />
m<br />
¢-<br />
t-<br />
Z<br />
z<br />
¢-<br />
v<br />
--I<br />
b.<br />
3._o<br />
,= "D<br />
d_dl<br />
r_ ¢_ r . .<br />
0 o 0<br />
I I I c,i<br />
0_ 0000<br />
_,_<br />
_ _1<br />
I I<br />
66' ' '<br />
IIII<br />
_¢ 6 •<br />
NNNo _''<br />
II1_ 166<br />
NNMN_d_4<br />
o1"166o6<br />
I<br />
_ O00 _Om 0 _ _Q 0000 _ _0<br />
_ o o _ ,o o o _,o o o _,o o o _,o _ _ o<br />
0000 0000 000000000000<br />
_ o _ _ ,_ _ m _,_ o _ _,_ _ _ _ ,_ _ _ _<br />
_o_<br />
>>>><br />
I<br />
I I I<br />
I<br />
_ >>>>
p_ p.. p..<br />
o. oo<br />
odd<br />
00<br />
,_o<br />
I_ 1.0<br />
00<br />
I c_d<br />
_000<br />
_.<br />
0000<br />
0_0<br />
]<br />
ooo<br />
o_o "'"<br />
_'; _<br />
0000 0_0<br />
Nddd'dddN<br />
_M_d'M_NN<br />
I I<br />
Human Control Capabilities 767<br />
0<br />
fr
768 Bioastronautics Data Book<br />
Pilot Opinion and Ratings<br />
In addition to satisfying specifications on performance (e.g., stability and<br />
error) it is important to consider the operator acceptability of a given vehicle<br />
system. Pilot rating for aerospace vehicles is usually given in terms of the Cooper<br />
rating shown in table 164. In general the pilot can make wide compensation for<br />
controlled element dynamics resulting in equivalent performance but with<br />
varying Cooper ratings.<br />
A review of pilot rating scales to eliminate uncertainty in definitions<br />
and increase the reliability of ratings led to the handling qualities rating<br />
_ale proposed by Cooper and Harper (1969) shown in figure 16-11.<br />
Particular emphasis in flight and ground base simulation has been paid<br />
to pilot opinion and aircraft handling qualities. Handling qualities for<br />
longitudinal aircraft attitude control are governed by the short period<br />
natural frequency _s-, the short period damping ratio _'sp, the numerator<br />
• IJ ....<br />
time constant T02 , and the aa-'plane gain. F_'ure 16-12 shows approximate<br />
boundaries of pilot opinion for one value of TOo as a function of _ sp and<br />
_'sp- These boundaries would be different _r other values of T02.<br />
Figure 16-13 shows similar trends of acceptable and controllable regions<br />
plotted in a somewhat different format for longitudinal control of a reentry<br />
vehicle. A discussion of lateral handling qualities is beyond the scope of this<br />
chapter. Pilot rating depends upon gain, roll mode time constants, spiral<br />
mode time constant, and dutch roll mode natural frequency and damping.<br />
(For further discussions, see Harper, 1961; Ashkenas & McRuer, 1962.)<br />
Pilot ratings can also be related to parameters of the pilot model. The<br />
gain which the pilot adapts for a particular application affects his rating.<br />
Although the absolute level of the optimum gain depends upon a great<br />
number of factors, including the type of control stick, deviations from this<br />
optimum result in poorer ratings, as shown in figure 16-14. Pilot ratings also<br />
suffer when the pilot is forced to introduce lead compensation<br />
(figure 16-15). No particular penalty is apparently associated with increased<br />
lag compensation. Pilot rating also has been observed to show a decrement<br />
of 2 to 3 points as the pilot's effective time delay Te decreases, associated<br />
with greater lead generation, as discussed earlier.<br />
To handle multiaxis tracking situations it has been suggested that the<br />
decrements in pilot rating (relative to optimum) for each axis individually<br />
be added to indicate the resulting decrement in the multiaxis rating<br />
(McRuer and Jex, 1967). A recent attempt to predict pilot ratings for<br />
VTOL on the basis of weighted sums of performance and pilot lead time<br />
constants shows some promise. The empirical relationship is<br />
R=R 1 +R 2+R 3+1.0 (5)
cJ<br />
>E<br />
_oI<br />
E_<br />
c<<br />
E<br />
0<br />
0<br />
r_<br />
E<br />
¢0<br />
rr<br />
o<br />
E<br />
3<br />
z<br />
.E<br />
rr<br />
Q_<br />
><br />
¢2<br />
iluman Control Capabilitics 769<br />
_ _ _ _ _ o a<br />
_ I<br />
_ _ _ _ _ ooo<br />
_> _ _ _ _ ZZZ<br />
o o<br />
Q a<br />
_ _ _ _ _ _0<br />
> o j_ _o<br />
c c<br />
o _ _ o<br />
o<br />
Z w Z _ oo
770 Bioastronautics Data Book<br />
_-z<br />
o=<br />
D- o<br />
oo<br />
J_<br />
zm<br />
o_<br />
D<br />
_ ,<br />
zl<br />
5<br />
_c<br />
g<br />
_c<br />
o<br />
a<br />
ac<br />
D<br />
o<br />
o<br />
w<br />
m<br />
o<br />
><br />
,d<br />
<<br />
o<br />
.5<br />
<<br />
z _<br />
z_ z_ G[<br />
_E ug<br />
_ oo Sl<br />
-_I<br />
's :Is@<br />
Om !<br />
-_>- m<<br />
JJ
I<br />
I<br />
I<br />
! I<br />
\<br />
r2 _. -<br />
_ o _<br />
\<br />
\<br />
$<br />
1<br />
q<br />
Human Control Capabilities 771<br />
_._o<br />
N,<br />
\,<br />
• \<br />
\'- "4" 1<br />
i:o_.li<br />
\<br />
_o_.<br />
1<br />
d_ eg_--<br />
g!.g "1<br />
_-_<br />
(zH) A_N'_CI'O'::II=I:::I 7"V'I-IhlVN C)OIId3d .LEIOHS<br />
t
772 Bioastronautics Data Book<br />
R 1 is the weighted sum of pitch and displacement errors relative to a<br />
criterion level<br />
0
!<br />
Kopt<br />
I0<br />
5<br />
2<br />
I.O<br />
0,5<br />
0.2<br />
0.1<br />
Human Control Capabilities 773<br />
"_':_...<br />
b..o.O .''''''''°<br />
,,'.
774 Bioastronautics Data Book<br />
"Rule of Thumb" for Compensatory Tracking<br />
A useful rule of thumb which includes some aspects of the dependence<br />
of pilot workload on lead and lag equalization as well as the easily achieved<br />
levels of crossover frequency for single axis compensatory tracking may be<br />
stated as follows: Design the controlled element and display so that the<br />
controlled element is approximately a pure integrator, input frequencies are<br />
limited to less than 0.5 Hz, and the human can act as a simple amplifier<br />
with a time delay.<br />
Although the optimum control and display depends upon input<br />
spectrum and performance criteria in a somewhat complex way, it is<br />
generally true that a pure integral plant is easily controlled for low<br />
frequency inputs. By the same token, without special training or assistance<br />
in display, men should not be expected to control elements with dynamics<br />
containing more phase lag than Ye=K/s 2. (Under certain conditions, using<br />
pulsatile control, plants as high as Ye=K/s 3 may be controllable for short<br />
periods.)<br />
Optimum Control Models<br />
Several attempts have been made to reduce some of the arbitrariness of<br />
the quasilinear describing function model for describing human operator<br />
characteristics by substituting the techniques of optimal control theory. The<br />
goal is still to estimate loop closures, pilot dynamics, crossover frequencies,<br />
etc., but the desire is to substitute the systematic optimal control<br />
calculation techniques for the previously described artistic conventional<br />
methods. This requires that a cost function to be minimized be specified.<br />
The peculiar nature of this function must be such that when the input and<br />
vehicle dynamics are given, the minimization of the cost function results in<br />
control law(s) which mimic those the human would adopt. The artistry has<br />
now shifted to the selection of the cost function. A promising approach<br />
using optimal control is shown schematically in figure 16-16. The block<br />
(e -sT) represents an approximation to the human operator's invariant<br />
equivalent simple time delay. State feedbacks for the human are assumed to<br />
be only gains and first derivatives of explicitly displayed information. The<br />
effect of the usual remnant, including motor uncertainties, and the effects<br />
of visual scanning are represented by a vector observation noise Vo_(t ).<br />
Because of his inherent delay and the observation noise, the human<br />
operator must estimate the true state which had existed T seconds ago<br />
[estimated state _(t-T)], predict the current state [__(t)], and generate the<br />
optimum control law control vector [u(t)] which minimizes the cost<br />
functional, subject to the constraints on state variables fed back. Although<br />
the application of optimal control techniques to estimation of human<br />
operator dynamics is still a very new art, reasonable agreement with<br />
conventional results for several simple plants and a V/STOL vehicle in<br />
hovering flight has been achieved (Elkind et al., 1968).
[-<br />
I<br />
I<br />
VEHICLE<br />
ttuman Control Capabilities 775<br />
x(t)<br />
[<br />
I<br />
I<br />
I<br />
J<br />
PILOT MODEL<br />
e "sT ] x(t-T)<br />
-_CONTROLLER I_ PREDICTOR _ ESTIMATORI"_<br />
Figure 16-16. Optimum control model for manual control. (Elkind et al., 1968)<br />
Motion Cues<br />
Describing function data for human operators gathered in laboratory<br />
fixed base experiments frequently must be extrapolated to moving base or<br />
flight tests. The presence of motion cues in flight, as sensed by the<br />
vestibular and tactile senses, influences the describing functions. At extremes<br />
of high vibration and acceleration levels it results in important performance<br />
decrements; for moderate motions, however, the information is generally<br />
useful to the pilot. In particular, angular rate information sensed by the<br />
semicircular canals may be used to generate additional lead compensation<br />
and reduce the effective reaction time. Gravicaptor cues help alignment to<br />
the apparent vertical. Roll motion cues are most useful at high frequencies<br />
and for plants in which high frequency variations in roll can occur. The<br />
effect of roll motion cues in allowing the operator to exhibit additional<br />
lead, and thereby increase his crossover frequency and reduce RMS error, is<br />
shown schematically in figure 16-17.<br />
Table 16-5 gives approximate linear models of the human operator<br />
describing function for a wide variety of controlled elements under fixed<br />
base or roll motion. (The0.1 sec delay in all controlled elements<br />
approximates the dynamics of the simulator utilized). When motion is in<br />
yaw rather than roll or pitch, presumably the linear acceleration sensors of<br />
the body are not stimulated. Experiments indicate that although the<br />
additional linear acceleration contributes to a higher gain of the human<br />
operator, the contribution is relatively less significant than that attributable<br />
to sensation of rotation (Dinsdale, 1968).
776 Bioastronautics Data Book<br />
Multiple-Input Tracking<br />
When multiple inputs are presented on separated displays the operator<br />
tends to adopt an optimal scanning pattern, devoting most time to those<br />
displays having the most information and linking scans between related<br />
displays. The implications for display layout and details of optimization are<br />
beyond the scope of this chapter (see Carbonell et al., 1968, and Clement,<br />
Jex, & Graham, 1968). One of the effects of multiple inputs on separated<br />
displays is a net increase in effective time delay associated with the<br />
scanning time.<br />
When multiple inputs can be displayed on a single integrated display,<br />
the effects of more than one input can be assessed according to the<br />
following cases: (a) homogeneous dynamics and homogeneous input,<br />
(b) homogeneous dynamics and heterogeneous inputs, and (c) heterogeneous<br />
dynamics. Two-axis tracking performance is nearly as good as single-axis<br />
performance with compatible integrated displays, when the dynamics in the<br />
two axes are the same, whether or not the inputs are identical. However,<br />
when the dynamics are different in the two axes, requiring different<br />
operator equalization, significant increases in normalized mean square error<br />
occur, ranging from 15 to 125 percent (Levison and Elkind, 1966). The<br />
equalization associated with one axis seems to affect that used on the<br />
other, resulting in an increase in error on both axes. Figure 16-18 shows the<br />
describing function for tracking with dynamics K in one axis, with and<br />
without a second axis task of K/s 2 dynamics.<br />
OPEN LOOP<br />
AMPLITUDE<br />
RATIO<br />
lVpVc(W)l<br />
OPEN LOOP<br />
PHASE<br />
(DEGREES)<br />
4YpYc(W)<br />
CROSS-OVER<br />
100" FREQUENCIES<br />
10 _.---_ -- -- _-_.<br />
.1<br />
zo-. I-1<br />
o.<br />
-20'<br />
-40,<br />
VISUAL CUES 0 I<br />
..... VISUAL AND MOTION CUES<br />
I<br />
,? ",d<br />
[ 110 '<br />
J _ (rad/sec)<br />
Figure 16-17. Schematic indication of effects of roll motion cues. (Shirley & Young, 1968;<br />
used by permission of the Institute of Electrical and Electronics Engineers)
Human Control Capabilities<br />
Table 16-5<br />
Human Operator Describing Functions<br />
for Various Dynamics - Compensatory Roll Tracking<br />
Controlled Fixed Base Roll Moving Base<br />
Element<br />
Ye Pilot Model Yp Pilot Model Yp<br />
e-.ls<br />
s<br />
20e-.ls<br />
s(s + 20)<br />
5e--.ls<br />
s(s + 5)<br />
4e-.ls<br />
s(s + 4)<br />
2e--.1 s<br />
s(s+ 2)<br />
e--.ls<br />
s(s + 1)<br />
e--.ls<br />
s2<br />
_e--.ls<br />
s(s -- 1)<br />
5e--.ls<br />
s2+5<br />
20e-.ls<br />
s2 + 20<br />
_2.5e-.1s<br />
s2 + s - 2.5<br />
5e-.ls<br />
s2 +ss + 5<br />
10e--.ls<br />
s2 +2s + 10<br />
487-858 O - 73 - 50<br />
4.5e-'08S(7s+l ) (1.9s+1) 4.5(7s+1 ) (5s+1)<br />
(15s+1) (1.75s+1) (.08s+1)<br />
10e--'O7s(6s+l ) (1.1 s+l )<br />
(27s+1) (.56s+1) (.08s+1)<br />
8e-'lS(7s+1) (.85s+1)<br />
(31s+1) (.13s+1) (.08s+1)<br />
16e--'lS(7s+1) (1.55s+1)<br />
(31s+1) (.15s+1)(.(_s+l)<br />
10.5e--.1S(7s+1)(2s+1)<br />
(31s+1) i.23s+1) (.08s+1)<br />
4.3e--1S(7s+l ) (3.8s+1)<br />
(31s+1) (.12s+1) (.08s+1)<br />
.15e--25s( 10s+1 ) (3s+1)<br />
(.01s+1) (1.5s+1)(.08s+1)<br />
.2e--'2s(10s+1) (3s+1)<br />
(.01s+1) (1.5s+1)<br />
3e-'38s( 1.75+1 ) (s2+2s+5)<br />
5(12s+1) (.08s+1)<br />
9e--'3s(1.5s+1 ) (s2+s+20)<br />
20(14s+1) (.08s+1)<br />
3e -1-5S(s2+1.5s+2.5)<br />
2.5(.2s+1) (.25s+1)<br />
11.5e-'25s(1.9s+1 ) (s2+4s+5)<br />
5(7.5s+1) (.5s+1)<br />
19e-.3s(2.5s+1) (s2+3s+10)<br />
10(10s+1 ) (.43s+1)<br />
(15s+1) (1.75s+1) (.08s+1)<br />
10(6s+1) (2.5s+1)<br />
(27s+1) (.9s+1) (.08s+1)<br />
8(7s+1) (1.6s+1)<br />
(31s+I) (.29s+1)(.OBs+l)<br />
16(7s+1 ) (4s+1)<br />
(31s+1) (.6s+1) (.08s+1)<br />
15(7s+1 ) (2s+1)<br />
(31s+1) (.23s+1)(.08s+1)<br />
5.5(7s+1) (3.8s+1)<br />
(31s+1) (.12s+1) (.08s+1)<br />
.18e--" 15s( 10s+1 ) (3s+1)<br />
(.01 s+l ) (1.5s+1) (.08s+1)<br />
.4e--.15s(10s+1) (3s+1)<br />
(.01 s+l ) (1.5s+1)<br />
5e--'25s(1.75s+1 ) (s2+2s+5)<br />
5(12s+1 ) (.08s+1)<br />
20e---2s(1.5s+1 ) (s2+s+20)<br />
20(14s+1) (.08s+1)<br />
5e--'O5S(s2+1.5s+2.5)<br />
2.5(.38s+1) (.3s+1)<br />
20e--" 14s( 1.9s+1 ) (s2+4s+5)<br />
5(7.5s+1) (.5S+1)<br />
23e---2s(2.5s+1) (s2+3s+10)<br />
10(10s+1) (.43s+1)<br />
777
?78 Bioastronauties Data Book<br />
Controlled<br />
Element<br />
Yc<br />
5e--.ls<br />
s2+Ss+5<br />
25e--.1s<br />
s2 + 5s + 25<br />
lOe--.ls<br />
s(s2 + 10)<br />
4e-.ls<br />
s2 (s + 4)<br />
lOe--.ls<br />
s (s2+ 2s + 10)<br />
lOe-.ls<br />
s (s2 + 4s + 10<br />
(Adapted from Shirley, 1968)<br />
o<br />
Table 16-5 (Continued)<br />
Human Operator Describing Functions<br />
for Various Dynamics - Compensatory Roll Tracking<br />
: : llllli _ i<br />
°_<br />
___,oo FJill<br />
_ 11111<br />
• 1-AXIS OF<br />
• 2--AXIS DF<br />
-200<br />
0_6 _0_1<br />
Fixed Base Roll Moving Base<br />
Pilot Model Yp Pilot Model Yp<br />
19e-'28s(4.3s+1 ) (s2+5s+4.5) 30e-" 15s(4.3s+ 1) (s2+5s+4)<br />
4.5(10s+1) (.65s+1)<br />
4.5e---3s(1.75s+1 ) (s2+5s+24)<br />
25(9s+1 ) (.17s+1 )<br />
.9e-.4S(3s+1) (s2+s+5)<br />
(12s+1)<br />
.4e--'32s(10s+l ) (3s+ 1)<br />
(1.2s+1) (.01s+1)<br />
•45e--'43s(.8s+1 ) (s2+4s+1 O)<br />
(.15s+1) (.15s+1)<br />
e--.35s(.9s+1 ) (s2+4s+10)<br />
(.15s+1 ) (.25s+1)<br />
1--AXIS MODEL<br />
_ 2-AXIS MODEL<br />
4.5(10s+1) (.8s+1)<br />
6.8e_-2s (1.75s+1) (s2+Ss+2)<br />
25(9s+1) (.17s+1)<br />
1.5e-'35s(3s+1 ) (s2+s+5)<br />
(12s+1)<br />
.48e-'25s(10s+1) (3s+1)<br />
(1.2s_1) (.01s+1)<br />
.8e--43s(.8s+l) (s2+4s+10)<br />
(.15s+1) (.15s+1)<br />
1.15e---35s(.9s+l) (s2+4s+1)<br />
(.15s+1) (.25s+1)<br />
"1<br />
Illl ::'<br />
4 i 6 " e'1.0 2 3 , s e, e 10 20<br />
FREQUENCY (rad/sec)<br />
Figure 16-18. One- and two-axis describing functions Yc = K (other axis = K/s2).<br />
(Levison & Elkind, 1966)
Multiple Loop Tracking<br />
Human Control Capabilities 779<br />
On many occasions, the operator is faced with a multi-loop control task<br />
in which he must participate in one or more coupled loops. Examples are<br />
control of aircraft pitch angle and angle of attack which, in turn, affects<br />
the control of airspeed and altitude. As another example, control of VTOL<br />
roll angle affects lateral position. A discussion of the extension of the<br />
single-axis models to multi4oop situations is given in McRuer and Jex<br />
(1967). A cascade model of the human operator suffices as an example of<br />
VTOL control (figure 16-19). The pilot adopts an inner loop equalization to<br />
stabilize pitch attitude and a separate slower outer loop equalization for<br />
commanding altitude to achieve the desired longitudinal position.<br />
Transmission Delays<br />
PILOT GIllED P&NAMIr T_A$<br />
NEUIqOWU$CUL&N LAG, T N • O,$S S(C<br />
#-LOOP TIqANSPq_T LAG, Tll • O.04J SEC<br />
I_LQOP TIqANSPOIqT LAG, r_, GOa S£C<br />
PILOT AOAP TABLE PAlUlA Idq[ T _ R $<br />
0- LOOP GAIN, Kp# 0N /mA0)<br />
fl - LOOP LEA0. TLI p (SEC)<br />
• - LOOP GAIN , Kpm (RAD/FT)<br />
• - LOOP LEAD, TLL |$EC)<br />
K T 4- I " FOS p_SlTt(_, i<br />
OUTER jeLO0_<br />
pip( Lips )e AIR¢ AFT<br />
T,.*I [ "1 ,o0 [R P'_C'oc. 9<br />
I_IIEPt LOOP<br />
Figure 16-19. A multi-loop pilot model. (Vinje & Miller, 1967)<br />
Manual control with transmission delays is a practical problem for<br />
remote manipulation across great distances. Delay in transmission of<br />
command information to the remote element and delay in receiving<br />
feedback information from the remote element forces manual controllers to<br />
adopt a move and wait strategy to cope with the delay. (The round trip<br />
delay from earth to moon is 2.6 seconds.) The time to complete a task<br />
depends on the delay and the number of discrete moves required.
780 Bioastronautics Data Book<br />
Completion time can be lowered by reducing the number of discrete<br />
motions (making larger open loop steps) at the expense of accuracy. For<br />
delayed manipulation, Ferrell (1965) uses two approximations (%1 and t¢2 )<br />
to total movement time:<br />
where<br />
to<br />
N<br />
td<br />
tr<br />
tN<br />
tel = to + N(t d + tr) + td<br />
tc2 = tN + (N + 1)t d<br />
= time to complete a task with no time delay<br />
= number of open loop steps required to perform the task<br />
= transmission delay<br />
= reaction time<br />
= average time to perform the task with no delay and no feedback<br />
between looks.<br />
Completion time estimates for tel are consistently lower than average times,<br />
and for tc2 are consistently higher. The average of these two<br />
is a good predictor of actual completion time.<br />
tel + tc2<br />
tea - 2 (7)<br />
The average number of times feedback is required is nearly independent<br />
of the delay time and depends only on the difficulty of the task. Task<br />
difficulty may be measured by the information index of difficulty proposed<br />
by Fitts (Fitts & Peterson, 1964).<br />
distance moved<br />
I = log 2 average clearance of final placement (8)<br />
(6)
Human Control Capabilities 781<br />
Both task difficulty and delay increase completion time, as seen in<br />
figure l6-20. For more complex remote manipulation tasks, involving<br />
movement and operation of tools, the same accuracy of prediction of<br />
completion time as a function of delay time seems to hold. The average<br />
number of open loop moves to perform a task depends on the task<br />
difficulty and can be estimated for simple one dimensional tasks from<br />
figure 16-21.<br />
z<br />
oo<br />
z u<br />
D-<br />
=J<br />
I i I<br />
$ 4 S<br />
INDEX OF DIFFICULTY I IN 81TS<br />
Figure 16-20. Effects of Iransrnission delay and task difficulty on completion time.<br />
(Ferrell, 1965; used by permission of the Institute of Electrical and Electronics<br />
Engineers)<br />
For continuous control of a dynamic system with transmission delay,<br />
phase lags associated with human operator and system delay would lead to<br />
instability unless the human reduced his gain and the crossover frequency.<br />
For a fixed input spectrum tracking errors increase with transmission time<br />
delay. To maintain a constant error level the input bandwidth must be<br />
reduced. Stated in terms of operating a remotely controlled vehicle, the<br />
vehicle speed must be reduced with increasing time delay for a constant<br />
path spatial frequency of path. Experiments on remotely controlled vehicles<br />
with variable time delay and two types of control (velocity and acceleration<br />
control) are summarized in figure 16-22. Notice that the curves indicate a<br />
relative trade-off between time lag and speed or speed and accuracy, as in<br />
the remote manipulation experiments referred to above.
782 Bioastronautics Data Book<br />
_zZ.0<br />
Z<br />
1.0<br />
3. S<br />
_.0<br />
! I I I s --<br />
/<br />
y /_ o aub)act<br />
/_ • adlu_ted<br />
model<br />
I ! I I I<br />
4 S 6 ? II<br />
INDEX OF DIFF'ICULTV I IN 81T$<br />
Figure 16-21. Number of open loop moves as a function of task difficulty. (Ferrell, 1965;<br />
used by permission of the Institute of Electrical and Electronics Engineers)<br />
Adaptive Manual Control<br />
The ability of the human controller to adapt his control according to<br />
requirements in changing conditions constitutes one of his major virtues as<br />
an element in dosed loop systems. The major classes of adaptation of<br />
interest are shown in figure 16-23.<br />
Input adaptation and prediction refer to man's ability to detect familiar<br />
or repeated patterns in the input and track these in a predictive or open<br />
loop fashion.<br />
Controlled element adaptation refers to the well-known ability of men<br />
to adapt different control strategies appropriate to changing dynamics of the<br />
system being controlled.<br />
Task adaptation encompasses the complex matter of optimization of the<br />
manual control loop on the basis of various control objectives. Thus, the<br />
human changes his strategy, for the same input and controlled elements,<br />
depending on the relative penalties associated with system error, vehicle<br />
accelerations, time to reach a terminal state, fuel penalties, or control<br />
effort.<br />
/<br />
/<br />
)h
o<br />
\<br />
2<br />
=_<br />
.S<br />
\ - \<br />
,\<br />
O t0 _00<br />
tg oi d ¢6<br />
HumanControl Capabilities 783<br />
G :_+LV_10 3 I.NI<br />
n-<br />
O<br />
=\<br />
>...<br />
_,% , X<br />
8OUUY ].Lt_'l_gV O_LLVUOYI.NI<br />
',,_, + +<br />
o<br />
= °<br />
¢,--_<br />
t=¢0<br />
"',X \<br />
Z<br />
o L<br />
I. + u_<br />
2r<br />
z_<br />
3_o<br />
_SS _<br />
3z z<br />
oJ_<br />
=<br />
8<br />
0<br />
E<br />
e,<br />
e,<br />
o<br />
e4<br />
i
784 Bioastronautics Data Book<br />
Programmed adaptation, or open loop adaptive control, and the role it<br />
plays must not be overlooked. In this mode the environmental status, for<br />
example, attitude, road surface condition, sea state, or time-to-go, is used<br />
by the human to adopt control strategies which he has been taught<br />
(programmed) are appropriate for that situation.<br />
Behavior of the human operator following sudden failures of the<br />
controlled element is fundamental to assessing the overall reliability of a<br />
manual, automatic, or manual backup system. The process of adaptive<br />
control is thought to consist of four phases: retention of prefailure<br />
dynamics, detection of the failure, identification of the failure and<br />
adaptation of appropriate dynamic form for the postfailure situation, and,<br />
finally, optimization of postfailure control. In the model reference schema,<br />
detection occurs when the observed change in error deviates from the<br />
expected change in error (based upon an internal model) by more than<br />
some threshold level. Typical detection times for laboratory experiments<br />
with sudden changes in gain or velocity range from 0.5 to 3 seconds. Times<br />
to detect failures involving higher order plants are increased to several<br />
seconds and may be considerably longer if emergency training is insufficient.<br />
I ,_poT 1 / CONT,OLLEO /<br />
AOAPTAT,ON h rt tLEMENT<br />
_EO'CT'O'I_ /I *OAPTAT,O_ /<br />
£___ Ol ST URBANC E<br />
ERROR mm ADAPTIVE<br />
CONTROL I I / \ l_l ENVIRONMENTAL<br />
/ / I-A"°T*E<br />
OBJECTIVES _| TASK _/ _ PROGRAMMED I_ STATUS<br />
Figure 16-23. Major adaptive functions in manual control. (Young, 1969)<br />
Control-Display Compatibility<br />
Controls and Manipulators<br />
A control function and the corresponding display should be<br />
geometrically compatible. Linear translations of the controls should<br />
correspond to colinear translations of the displayed variable. (The direction<br />
of display motion is opposite to control motion in a "fly-to" or inside-out<br />
display.) Rotations of controls corresponding to translation of a display are<br />
inherently ambiguous.
Human Control Capabilities 785<br />
In certain cases, a rotation between display axes and control axes is<br />
unavoidable. The resulting ambiguity can be overcome partially by indicating<br />
the instantaneous deflection of the control stick resolved in display axes on<br />
the display itself, as in configuration c of figure 16-24. Controls should be<br />
in conventional positions, well separated, associated with the task, and easily<br />
distinguished by touch (see figure 16-25).<br />
/ 1<br />
DISPLAY CONFIGURATIONS<br />
Figure 16-24. Display configurations for rotated display reference.<br />
(Bemotat, 1969)<br />
Figure 16-25. Control knob shapes. (Chapanis, Garner, & Morgan, 1955)<br />
a
786 Bioastronautics Data Book<br />
Control Forces<br />
A wide variety of manipulators are in common use in vehicle control,<br />
including steering wheels, "joy sticks," pencil controllers, and pedals. (Less<br />
commonly used are head position and eye position.) As a general rule,<br />
satisfactory control feel requires the normal use of forces well below<br />
maximum without being so sensitive that inadvertent muscular movements<br />
or tremors result in errors in control. Control stick specifications include<br />
consideration of flexibility, springback, minimum control increment, friction,<br />
preload and hysteresis. For a review of this problem see Glenn (1963).<br />
Control Stick Characteristics<br />
The two basic modes of control stick operation are position control, in<br />
which the displacement or angle of the control stick is the control signal, and<br />
force control (or pressure control), in which the force on the control stick<br />
(which is usually maintained nearly stationary) is the control signal. Pressure<br />
control yields significantly less phase lag at high frequencies and is consequently<br />
preferable for use in situations such as control of high order systems, where<br />
excessive delay is a problem. Pressure control, spring restrained position control,<br />
and free moving control yield similar tracking results at low frequencies. For<br />
spring restrained position control sticks, an optimum value of spring constant<br />
usually exists. Increasing the moment of inertia of the control stick decreases the<br />
crossover frequency and increases tracking error for high order controlled<br />
elements (Magdaleno & McRuer, 1966).<br />
Effects of Control Stick Nonlinearities<br />
Common control stick nonlinearities include coulomb friction, control stick<br />
preload, control displacement limits, nonlinear gearing, control system hysteresis<br />
and backlash, and control stick velocity limits. In a vibrating environment, low<br />
levels of static friction may improve tracking performance. In controlled fixed<br />
base simulations using fore and aft motion of a light center stick and simple rate<br />
control, control stick friction and preload are found to have no significant effect<br />
on tracking performance.<br />
For the case of control velocity limits, however, the effects on error are<br />
quite noticeable and show a marked decrement in performance as the control<br />
velocity limit is lowered, accompanied by rapid deterioration of the pilot rating.<br />
Graham (1967) concludes that human operators tend to linearize the<br />
nonlinearities of control sticks where possible by use of dither and high gain<br />
feedback around the nonlinearity. However, in the case of velocity limit, this<br />
linearization is not possible and performance degrades.<br />
Quantization and Pulsatile Control<br />
Deliberate quantization of the control stick output into relatively few<br />
discrete levels may be desirable for stability and ease of operation. For example,<br />
a common five-position control stick would permit fast slewing or slow control
788 Bioastronautics Data Book<br />
As mentioned earlier, the pursuit display permits the pilot to generate<br />
greater lead and anticipate the input, and consequently is of particular use for<br />
high frequency inputs or for controlling high order plants. On the other hand,<br />
error magnification can be far greater in a eompensatory display, since the scale<br />
need only accommodate maximum tracking error rather than maximum output.<br />
Thus, highly accurate null readings can be achieved for low frequency inputs and<br />
well controlled vehicles.<br />
Inside-Out versus Outside-ln<br />
The inside-out display, which is the conventional attitude instrument for<br />
aircraft, takes the aircraft as the fixed frame of reference and shows vehicle<br />
motion by movement of external reference lines or grids: the view from the<br />
inside of the vehicle looking out at the horizon.<br />
The alternative view takes the external reference frame as fixed and shows<br />
the moving vehicle motion with respect to this frame. This approach is the<br />
outside4n method and corresponds to the view of a moving vehicle seen by an<br />
observer on the earth. Both are shown in figure 16-27. An interesting alternative<br />
suggestion by Fogel (1963) is the "Kinalog display," in which the pilot's<br />
sensation of rotation in a turn, attributable to interpretation of vestibular<br />
stimuli, is made compatible with the display format, so that both the aircraft<br />
symbol and the horizon rotate in conformity with the pilot's kinesthetic<br />
adaptation to a turn.<br />
Where problems of vertigo may be present, general practice is to rely upon<br />
inside-out displays and to train pilots to suppress or ignore motion cues.<br />
Display Fomts<br />
AI INSIDE-OUT B) OUTSIDE-IN<br />
Figure 16-27. Inside-out and outside-in attitude displays.<br />
(The aircraft is pitched nose-up and rolled left.)<br />
Information is usually displayed in either a digital format, as numbers on a<br />
counter, or in a pure analog format such as length of a llne or position of a<br />
pointer. There are, however, a number of mixed analog-digital displays, in which<br />
information is either presented both ways or in which the slowly changing<br />
portion is displayed digitally for unambiguous readout (as in the case of
Human Control Capabilities 787<br />
to left or right, as well as null. The three-level controller of either the on-off or<br />
the pulse modulated type is useful for tracking situations requiring considerable<br />
operator lead. In controlling systems containing several integrators, for example,<br />
operators may prefer counting pulses to integrating their continuous control<br />
output (Young and Meiry, 1965).<br />
Displays<br />
This section discusses techniques for visual displays. Hardware, including<br />
developments in cathode ray tubes, electroluminescence, holographic displays,<br />
and other new techniques, is discussed fully in NASA SP-159 (1967), Poole<br />
(1966), and Luxeuberg and Kuehn (1968). Some interesting aerospace<br />
applications of audio and tactile displays for control have been explored, but<br />
these are mostly in the research stage and are not, therefore, discussed here.<br />
Compensatory and Pursuit Displays<br />
Pursuit and compensatory displays correspond to pursuit and compensatory<br />
tracking, as discussed previously. In a pursuit display, the commanded state of<br />
the system (input) as well as the actual system state (output) is displayed<br />
separately, and the operator's task is to control the actual output so that it<br />
tracks the command. An example of a pursuit display is shown in<br />
figure 16-26(a). When only the error between ordered and actual system state is<br />
displayed, as in figure 16-26(b), the display is compensatory.<br />
(COMMAND)_<br />
10(30<br />
800<br />
700<br />
60O<br />
5OO<br />
4OO<br />
3OO<br />
2OO<br />
100<br />
tO0<br />
4O<br />
20<br />
-0 ....<br />
-20<br />
-40<br />
_0<br />
_0<br />
-100<br />
A) B)<br />
PURSUIT COMPENSATORY<br />
Figure 16-26. Pursuit and compensatory displays.<br />
6O<br />
i<br />
ERROR<br />
i
Human Control Capabilities 789<br />
altimeters) and the rapidly moving portion is shown in an analog fashion. A<br />
variety of single quantitative instrument displays is shown in figure 16-28. Some<br />
of the pros and cons of various indicators are summarized in table 16-6.<br />
Moving tape displays have the advantage of permitting a very wide range of<br />
readings to be displayed (as in the case of pursuit displays) while still offering a<br />
large magnification or error between command input and actual output.<br />
However, they may he difficult to read when they are in motion.<br />
.....<br />
(1) (2)<br />
(3) (4)<br />
(5) (6)<br />
Combined analog and symbolic displays of submarine pitcn<br />
angle with an increasingly symbolic emphasis: (a) pictorial;<br />
(b) moving pointer (angular correspondence preserved); (c) moving<br />
pointer (angular correspondence distorted); (d) rotating<br />
scale; (e) moving dial; (f) electronic digital display.<br />
(a) (Kelley, 1968)<br />
Figure 16-28. Various display formats.
790 Bioastronauties Data Book<br />
>.<br />
J<br />
)-<br />
a<br />
IL<br />
I-<br />
Z<br />
.D<br />
0<br />
O<br />
,.,..,<br />
w<br />
I-<br />
Z<br />
D<br />
0<br />
U<br />
7<br />
g<br />
-°I<br />
0<br />
E.-<br />
Ilf "<br />
c_<br />
(_:..<br />
>-<br />
Method<br />
of Use<br />
Quantitative<br />
reading<br />
Qualitative<br />
and check<br />
reading<br />
Setting<br />
Tracking<br />
Good<br />
Human Control Capabilities<br />
Table 16-6<br />
Recommended Indicators According To Use<br />
Counter Moving Scale Moving Pointer<br />
Minimum time and<br />
error in obtaining<br />
exact numericat value<br />
Poor<br />
Numbers must be read.<br />
Position changes not<br />
easily detected<br />
Good<br />
Most accurate monitor-<br />
ing of numerical setting<br />
Relation to motion of<br />
setting knob less direct<br />
than for moving<br />
pointer. Not readable<br />
during rapid setting<br />
Poor<br />
(Baker & Grethar, 1954)<br />
Peripheral Displays<br />
No gross position<br />
changes to aid monitor-<br />
ing. Ambiguous rela-<br />
tion to control motion.<br />
Not readable during<br />
rapid changes<br />
Fair Fair<br />
Poor<br />
Difficult to judge direc-<br />
tion and magnitude of<br />
deviation without read-<br />
ing numbers and scale<br />
Fair<br />
Somewhat ambiguous<br />
relation to motion of<br />
setting knob. No<br />
pointer position change<br />
to aid monitoring. Not<br />
readable during rapid<br />
setting<br />
Fair<br />
No pointer position<br />
changes to aid monitor-<br />
ing. Somewhat ambig-<br />
uous relation to con-<br />
trol motion. Not read-<br />
able during rapid<br />
changes<br />
Good<br />
Location of pointer<br />
easily detected.<br />
Numbers and scale<br />
need not be read.<br />
Change in position<br />
easily detected<br />
Good<br />
791<br />
Simple and direct rela-<br />
tion of pointer motion<br />
to motion of setting<br />
knob. Pointer position<br />
change aids monitor-<br />
ing<br />
Good<br />
Pointer position<br />
readily monitored<br />
and controlled. Most<br />
simple relation to<br />
manual control<br />
motion<br />
While most conventional displays are designed for foveal viewing, and require<br />
fixation and accommodation for accurate reading of the instrument, there are a<br />
number of applications for displays which can be read in peripheral vision.<br />
Peripheral displays may be used to avoid interference with the primary scan<br />
pattern and to present additional information outside the central instrument<br />
display area. Although the rods of the eye are capable of poorer resolution than<br />
are the cones, they respond well to motion, Several examples of motion displays<br />
are shown in figure16-29. Peripheral motion displays are particularly<br />
appropriate for displaying vehicle rates of turn or linear velocities. Flashing lights<br />
are useful principally as warning indicators.
792 Bioastronautics Data Book<br />
Coding of Visual Information<br />
Rate o! turn Forward velocdy<br />
Rate of dive<br />
Figure 16 29. Motion displays. (Kelley, 1968)<br />
Further information can be added to the two dimensions of a displayed<br />
point by appropriate coding of the symbol. Coding may help in identifying the<br />
particular point (as in the case of air traffic control displays) or giving<br />
information on other dimensions. Use of alphanumeric identification tags is of<br />
great value, providing there is sufficient room to present legible alphanumerics<br />
without cluttering. A summary of other coding dimensions is given in table 16-7.<br />
Integrated Displays, Contact Analog Displays, and Head-up Displays<br />
In complex multi-axis control tasks, such as are typical of piloting aircraft or<br />
space vehicles, considerable assistance can be given the pilot by integrating<br />
related information on a single display. Generally, integrated displays show the<br />
rates of change of variables in proximity to the variable itself. Integrated displays<br />
permit the pilot to view a single display containing all relevant information and<br />
simplify his problem of reconstructing the geometrical status of a vehicle.<br />
If the integrated display contains symbols or lines unrelated to real<br />
geometrical variables it is a symbolic display. If the elements of the display bear<br />
some relation to a picture of the outside reference frame, such as a pilot might<br />
view looking through a window, then the display is of the contact analog variety.<br />
(This is analogous to flying in "contact" or under visual flight rule conditions.)<br />
Examples of contact analog displays for terrain avoidance and for submarine<br />
control are given in figure 16-30.
O<br />
=<br />
°_<br />
¢-*-w<br />
E-_ o<br />
48?-858 0 - 73 - 5£<br />
CC<br />
P,<br />
_6<br />
Z<br />
E<br />
8<br />
E<br />
(3<br />
Human Control Capabilities 793<br />
c E _. o<br />
- " o _ 8 =.<br />
"8o - ×<br />
_- _ ,, ,, o_ ._<br />
E .-_ o 8 _, E<br />
_ _ E<br />
_ P- _ ¢ _ _. z _<br />
.... (.3 Z "<br />
.E<br />
._ ,,,o _ .- .,_ "_ ._<br />
•_ _ '_ 2 '5 -_ .....<br />
.a<br />
0<br />
o<br />
t-<br />
(D<br />
ID<br />
I<br />
GO<br />
E e-<br />
E<br />
E c -_<br />
"s<br />
. = -.-r_ o a _"<br />
0 _ "_. tO 0<br />
_-_o _._ _ _ _<br />
"-'- = _ _3 E<br />
__ e e I<br />
LIJ ILl LU _ _- 1L<br />
_ oO<br />
"- I i<br />
E<br />
8<br />
0<br />
w.o<br />
CO<br />
Ob<br />
v
794 Bioaslronautics Data Book<br />
m m R<br />
v<br />
(a) Terrain avoidance display. (Ketchel & Jenney, 1968,<br />
from Kaiser Aerospace and Electronics data)<br />
(b) Simulation of the Norden contact analog perspectively<br />
quickened display. (McLane & Wolf, 1968)<br />
Figure 16-30. Contact analog displays.
Human Control Capabilities 795<br />
An integrated display presented by reflecting a CRT-gencratcd picture at<br />
optical infinity, so the operator can view the display while continuing to look<br />
out the window, is known as a head-up display. This configuration and an<br />
example are shown in figure 16-31. Integrated displays of the schematic or<br />
contact analog variety have been used with integration of pictures of the outside<br />
environment, which may be gathered from T.V., sonar, or radar data. Displays<br />
which emphasize attitude and position in a vertical plane may be thought of as<br />
forward-looking for a vehicle in level flight, and are known as vertical situation<br />
displays. Those which emphasize geographical information or position over the<br />
ground are horizontal situation indicators. Examples of each are given in<br />
figure 16-32.<br />
(a) (Poole, 1966)<br />
PILOT'S<br />
EYE<br />
ERED_ WINDSHIELD<br />
HkLF-SIL¥ S<br />
/ (b)<br />
Figure 16-31. Head-up display.<br />
LENS<br />
(Ketchel & Jenney,<br />
1968, after Sperry)
796 Bioastronautics DataBook<br />
3 Z _ 0 t<br />
_ i<br />
NIU LTISENSOR (RADAR/I R)<br />
TV DISPLAY<br />
Figure 16-32. Vertical situation, horizontal situation and pictorial displays.<br />
(Ketehel & Jenney, 1968)<br />
/<br />
/<br />
/
Control Augmentation and Display Quickening<br />
lluman Control Capabilities 797<br />
The human operator has difficulty controlling systems which contain more<br />
than two integrations, and operates best in systems approximating a single<br />
integration. When the controlled element is of a higher order than desired from a<br />
point of view of manual control, the designer can improve the dynamics of the<br />
total man-machine loop by control augmentation or quickening, as shown in<br />
figure 16-33. In control augmentation the dynamic compensation is performed<br />
on the man's output, by feedback of system output and its derivatives to the<br />
controlled element. Position and rate feedback in stability augmentation systems<br />
is a common technique to change the handling qualities of vehicles. As a<br />
consequence of control augmentation, however, man loses his direct control over<br />
the controlled element actuators, and controls the vehicle only indirectly<br />
through a servomechanism. Typically, with control augmentation the man has<br />
fidl information on vehicle output and operates with a status display.<br />
An alternative method of improving the loop dynamics by derivative<br />
feedback is adding lead through the addition of output derivatives in the display,<br />
thereby operating on the operator's input. When the displayed signal is a<br />
weighted sum of output and several of its derivatives, the technique is known as<br />
quickening (figure 16-34a). If some derivative signal is added to the display but<br />
the human operator must still generate lead equalization to perform the task,<br />
then it is known as a partially quickened display. If, on the other hand, just<br />
enough derivative feedback is added to the display so that the operator need<br />
merely move the control stick in proportion to the deflection on the _splay,<br />
then the display is fully quickened.<br />
The appropriate gains on the output derivatives for fully quickened displays<br />
are selected by assuming that the operator is a pure time delay of 0.2 to<br />
0.3 second for single axis tracking. The principal disadvantage of the display<br />
quickening technique is that the operator functions merely as a control amplifier<br />
and no longer has status information on the vehicle output, tie is thus deprived<br />
of his ability to exercise choice in the method of control. The pros and cons of<br />
display augmentation versus control augmentation are summarized in table 16-8.<br />
Command and status displays are closely related to the question of control<br />
display quickening and control augmentation. A status display presents<br />
DISPLAY ()PERAi £)N ELEMENT [<br />
AU(_ME NTATION<br />
ITOUT_UT<br />
Figure 16-33. Control augmentation.
798 Bioastronautics Data Book<br />
information on the ordered system output, the current system output, and<br />
whatever additional state variables may be necessary to help its operator control<br />
the system. The additional status information may include derivatives or<br />
integrals of system output, or settings of intermediate control variables, such as<br />
rocket gimbal angles or aerodynamic surfaces. The operator uses the status<br />
display to choose an appropriate control action, which may take into account<br />
many additionM constraints, such as acceleration, fuel, or time. By having<br />
b) SUPPLEMENTARY VELOCITY DISPLAY<br />
c) PMASE PLANE d) SUPPLEMENT DERIVATIVES<br />
Display Augmentation<br />
Operations performed on man's input<br />
Attention is transferred from outer-loop<br />
goal to inner-loop functioning<br />
Can employ man's muscular strength at<br />
the control junction in the inner loop to<br />
move a control surface, open a hydraulic<br />
valve, etc<br />
Man is kept aware of control signal<br />
Requires higher frequency, more com-<br />
plex human output<br />
(Kelley. 1968)<br />
Figure 16-34. Display quickening.<br />
Table 16-8<br />
Display vs. Control Augmentation<br />
Control Augmentation<br />
Operations performed on man's output<br />
Attention is transferred from inner-loop<br />
functioning to outer-loop goal<br />
Can employ man's senses in the outer<br />
loop to observe the controlled variable<br />
and the environment<br />
Man is kept aware of system output<br />
Requires simpler, lower frequency out-<br />
put.
lluman Control Capabilities 799<br />
complete status information the operator can exercise his judgment in selecting a<br />
control sequence. To help him in this control, he may be assisted by varying<br />
degrees of control augmentation, as discussed above.<br />
In the case of a pure command display, the operator is given information on<br />
required control action to achieve the desired system output. The display may<br />
be quickened or include other computation to ease the operator's task and, in<br />
the extreme, he need merely act as a proportional controller. Mthough the<br />
results may be satisfactory according to the computed response, the operator<br />
loses the ability to adapt to changing situations.<br />
Frequently, command and status displays are combined, so that the pilot can<br />
follow the commanded control if he wishes or take alternative action based on<br />
the status information.<br />
Supplementary Velocity Indication<br />
Several techniques have been used to present supplementary velocity<br />
indication without the loss of output state or error information associated with<br />
quickening. For example, supplementary velocity may be displayed by a variable<br />
length vector attached to the display spot, as shown in figure 16-34(b) or by use<br />
of a second axis to indicate velocity, as in the phase plane of figure 16-34(c).<br />
Finally, separate needle indicators on the derivatives for a two-axis display when<br />
appropriately arranged can yield supplementary velocity information to be used<br />
by the pilot, as shown in figure 16-34(d).<br />
Predictor Displays<br />
A powerful technique for stabilizing man-machine loops by putting lead<br />
information into the display, without removing the human operator from his<br />
role as an adaptive controller, is the use of a predictor instrument. A trace<br />
extends from the current output or error into the future. The trace representing<br />
future output is generated rapidly and repeatedly by use of a fast time model of<br />
the controlled element, which has the same initial conditions and control signals<br />
as those being applied to the actual controlled element. When used with systems<br />
having several integrations or with very slowly responding systems, the predictor<br />
display is of great value. It allows the operator to experiment with several<br />
different control possibilities off-line before actually applying one to the<br />
controlled element. Possible formats for the predictor display are shown in<br />
figure 16-35.<br />
Preview Displays<br />
Preview displays are related to predictor displays. In most control<br />
apphcations involving human operators, some explicit information concerning<br />
the input which will reach him in the future is available, and his control actions<br />
are based to a great extent on this preview. A view of the road and obstacles<br />
ahead or of the runway on which he will be landing is used by the operator in his<br />
role as a preview controller. Displays which can incorporate information on
800 Bioastronautics Data Book<br />
0 0IKI_0 L*<br />
X2<br />
(b) (Kelley, 1968)<br />
I_'C=¢IIK _VBB0_ O _STAC=.(<br />
(a) (Senders et al., 1964, from Kelley, 1960)<br />
Xl<br />
S_= _=w Front v_,,<br />
(c) (McLane & Wolf, 1966)<br />
Figure 16-35. Predictor displays.<br />
¢=}
Human Control Capabilities 801<br />
future inputs may be presented in a manner analogous to those of predicted<br />
future outputs for the predictor display. Models of the human controller,<br />
developed for compensatory tracking situations and extendable to pursuit<br />
tracking, are clearly inappropriate for the preview situations so common in<br />
controlling vehicles with a view of the external surround. Some optimal control<br />
models applicable to the preview situation have been developed and tested<br />
(Sheridan, 1966).<br />
Display Intennitteney<br />
Intermittent flashing of a display, or low frequency updating of a display,<br />
may lead to increased tracking errors. Well below the theoretical limits of<br />
sampling (twice the highest input frequency), tracking degrades because of<br />
interference with the ability to extract rate information and the appearance of<br />
flicker. The on-time of the display as well as the flash rate influences the<br />
performance, as shown in figure 16-36.<br />
$<br />
tu<br />
z<br />
Display Layout<br />
1.20<br />
1..15<br />
_ 1.10<br />
1.2s_ I IJI<br />
,f<br />
n 00, Ec-rL--<br />
_co,,,D. ,o,,o,., p/i<br />
/-/<br />
:>2 -"/ I<br />
m 20 15 I0 5 0<br />
FREQUENCY OF PRESENTATION - flashes/see<br />
Figure 16-36. Display intermiHency. (Senderset M., 1966)<br />
Most display layouts follow usual workspace guidelines and common sense.<br />
Related instruments should be grouped together. Instruments requiring frequent<br />
attention should be in the optimum viewing zone. Null indicating instruments<br />
should be oriented so that the pointers are all directed the same way for normal<br />
conditions, to assist monitoring. Recommended console dimensions and viewing<br />
angles for a seated operator are given in figure 16-37. Other such layout<br />
considerations exist for aircraft panel design (for example see A. F. Systems<br />
Command, 1969).
802 Bioastronautics Data Book<br />
4O<br />
30<br />
_0<br />
¥15U_. UNIT<br />
0 10 :20 30 f40 571INCHES<br />
(LIGHTS IIELl_l THIS LEVEL CAUSE _AII£) _+,, / LIIIT Of O01tTIt_4.S ItEACHEO<br />
/ // (|iTHOllT DOOYEIIDfllG)<br />
--- / ,'/ J-LIMIT OF EASILY REACHEDCOHTROL$<br />
NIII|Mll lltllnm / ]<br />
AIIGLE FOR OISPLAT ]' _'( _ J_J (WITH 800Y JEIIOtNG)<br />
" ..... _ ,_+++.,_ joPn,u, vIEm,;zo,+<br />
- +¢n.¢+w t J --<br />
- _ +:\+ _ I X ] \ _Mk]tlIIUMIIEACH<br />
: f - \ "'>+J_-I/I yt,+_,m, +t,om+<br />
: X,b I I<br />
: r--lU\/{/-_J-+r-C--+._..I I<br />
: ._m,TItI k"+'`_ " I _OPTIIIUMMANUAL CONTROL AIIEA<br />
+_.J+T I L_ ' P"--"_--'T_"/l<br />
I ! O,TU,_i' I '/I<br />
i i __LEC _ _1" Mill<br />
0 10 20 30 40 50 It'_,H ES<br />
0 10 20 30 40 50 INCHES<br />
":_lzlr rl_rr,ir_:rr+llt]<br />
.,_ _+- TOP PAHEL<br />
t- +...,..+_sueeoe'[ p,-- _,l<br />
3ot lit'_ Irm'l )----<br />
E F_', :$ i | "JI IWPET( T<br />
F _ !.,tlm} / _ PANEL I<br />
:SlJfl iCE<br />
+++t+ / m. ,,.,..IL-_,<br />
_o If+ -sl + q<br />
,,,ELt t<br />
f I //i_ ",t_''_ lIMl I HEIGHT<br />
0 / in HI_IT tx _t_" MIX - ---.1<br />
P_L re.oR_CllS _i_ I VI ,,m, UEEmO+4 I<br />
zs--+o" .'.._; es",,m t<br />
0 10 2_ 30 40 50 INCHES<br />
O'+[IALL KEIP._T<br />
65" MAt(<br />
(tXTEHOEDCOIISOLE}<br />
¢/FLOOil LEVEL<br />
,K_/FLO0_I LEVEL<br />
Figure 16-37. Recommended console dimensions and viewing angles. (Kubokawa, 1968;<br />
used by permission of the Institute of Electrical and Electronics Engineers)<br />
-_, 40<br />
o
2c<br />
z<br />
ltumanControl Capabilities 803<br />
INCHES<br />
?, ., ,o ,. ,..... ,o .... ,o<br />
_I_XIIMI |[/¢11<br />
7 \ VErlI_._OI[" / \<br />
I_,,, I_,, Jl't ,,_It,lt lltlt l,ti,lill+l, i t J |<br />
40 30 20 10 0 IO 20 30 40<br />
INCHES<br />
Figure16-37. Recommended console dimensions and viewing angles. (Kubokawa,<br />
1968; used by permisssion of the Institutc of Electrical and Electronics<br />
Engineers) - Continued<br />
References<br />
Adams, James L. An investigation of the effects of the t_me lag due to long transmission<br />
distances upon remote control= Phase I-tracking experiments. NASA TN D-1211,<br />
Stanford University, Stanford, Calif., December 1961.<br />
Air Force Systems Command. Crew stations and passenger accomodations. Design<br />
handbook 2-2. Wright-Patterson AFB, Ohio, May 1969.<br />
Anderson, R. O., & Dillow, J. D. "Paper pilot"-an application of pilot models to predict<br />
VTOL flying qualities in precision hover. Sixth Annual Conference on Manual Control,<br />
Air Force Institute of Technology, Wright-Patterson AFB, Ohio, April 1970.<br />
A_kenas, I. L. A study of conventional airplane handling qualities requirements. I= Roll<br />
handling qualities. AFFDL TR-65-138-I, Air Force Flight Dynamics Laboratory,<br />
Wright-Patterson AFB, Ohio, October 1965.<br />
Ashkenas, 1. L., & McRuer, D. T. A theory of handling qualities derived from pilot vehicle<br />
system consideration. Aerospace Engineering, 1962, 21(2), 60-102.<br />
Baker, C. A., & Grether, W. F. Visual presentation of information. WADC TR-54-160,<br />
Wright Air Development Center, Wright-Patterson AFB, Ohio, August 1954.<br />
Bernotat, R. Rotation of visual reference systems and its influence on control quality. Fifth<br />
Annual NASA-University Conference on Manual Control, NASA SP-215, Massachusetts<br />
Institute of Technology, Cambridge, Mass., March 1969.<br />
Bull, Gifford. Minimmn flyable longitudinal.handling qualities of airplanes. Comell<br />
Aeronautical Laboratory Report No. TB-1313-F-1, December 1959.<br />
Carbonell, J. R., Ward, J. L., & Senders, J. W. A queueing model of visual sampling:<br />
Experimental validation. Institute of Electrical and Electronic Engineers Transactions on<br />
Man-Machine Systems, 1968, MMS-9 (4), 82-87.<br />
2o_ z<br />
lO
804 Bioastronautics Data Book<br />
Chalk, Charles R. Additional flight evaluations of various longitudinal handling qualities in<br />
a variable-stability jet fighter. WADC TR 57-719, Wright Air Development Center,<br />
Wright-Patterson AFB, Ohio, Part 1,January 1958; Part II, July 1958.<br />
Chalk, C. R. Additional flight evaluations of various longitudinal handling qualities in a<br />
variable-stability jet fighter, Part II. Wright Air Development Center Technical Report<br />
57-719, Part II, July 1958 (also published as Comell Aeronautical Laboratory Report<br />
No. TB-1141-F-2).<br />
Chapanis, A., Garner, W. R., & Morgan, C. R. Applied experimental psychology: Human<br />
factors in engineering design. New York: John Wiley & Sons, Inc., 1955.<br />
Clement, W. F., Jex, H. R., & Graham, D. A manual control display theory applied to<br />
instrument landings of a jet transport. Institute of Electrical and Electronic Engineers<br />
Tranmctions on Man-Machine Systems, 1968, MMS-9( 4 ), 93-110.<br />
Cooper, George E. Understanding and interpreting pilot opinion. Aeronautical Engineering<br />
Review, 1957, 16(3), 47-51, 56.<br />
Cooper, G. E., & Harper, R. P. The use of pilot rating in the evaluation of aircraft handling<br />
qualities. NASA TN D-5153, Washington, D.C., April 1969.<br />
Dinsdale, P. B. Relative effects of roll and yaw motion cues in manual control. S.M. Thesis,<br />
Massachusetts Institute of Technology, Cambridge, Mass., September 1968.<br />
Elkind, J. 1. Characteristics of simple manual control systems. Report 111, M.I.T. Lincoln<br />
Laboratory, Lexington, Mass., April 1956.<br />
Elkind, J. I., Falb, Peter L., Kleinman, David, & Levison, W. H. An optimal control method<br />
for predicting control characteristics and display requirements of manned-vehicle<br />
systems. TR AFFDL-67-187, Air Force Flight Dynamics Laboratory, Wright-Patterson<br />
AFB, Ohio, June 1968.<br />
Ferrell, W. R. Remote manipulation with transmission delay, lnstl"tute of Electrical and<br />
Electronic Engineers Transactions on Human Factors in Electronics, 1965, IqFE-6(1),<br />
24-32.<br />
Fittsh P. M., & Peterson, J. R. The information capacity of discrete motor responses.<br />
Journal of Experimental Psychology, 1964, 67, 103-112.<br />
Glenn, J. Manual flight control system functional characteristics. Institute of Electriaal and<br />
Electronic Engineers Transactions on Human Factors in Electronics, 1963, HFE-4.<br />
Graham, Dunstan. Effect of some control system nonlinearities on single-loop<br />
compensatory tracking. Third Annual NASA-University Conferenoe on Manual Control,<br />
NASA SP-144, University of Southern California, Los Angeles, Calif., March 1967.<br />
Harper, R.' P. In-flight simulation of the lateral directional handling qualifies of entry<br />
vehicles. WADC TR 61-147, Wright Air Development Center, Wright-Patterson AFB,<br />
Ohio, 1961.<br />
Kelley, Charles R. Manual and automatic control: A theory of manual control and its<br />
application to manual and automatic systems. New York: John Wiley & Sons, Inc.<br />
1968.<br />
Ketchel, J. L., & Jermey, L. L. Electronic and optically generated aircraft displays: A study<br />
of standardization requirements. JANAIR Report No. 680505, Washington, D.C., May<br />
1968.<br />
Kidd, E. A., & Harper, R. P., Jr. Fixed-base and in-flight simulations of longitudinal and<br />
lateral-directional handling qualities for piloted re-entry vehicles. ASD-TDR-61-362, Air<br />
Force Flight Dynamics Laboratory, Wright-Patterson AFB, Ohio, February 1964.<br />
Kubokawa, C. C. Instant modular 3-D mockup for configuring control and display<br />
equipment. Institute of Electrical and Electronic Engineers Transactions on<br />
Man-Machine Systems, 1968, MMS- 9( 3 ), 72-81.
Human Control Capabilities 805<br />
Levison, W.H.,Baron, Sheldon, & Klcinman, DavidL. A model forhumancontroller<br />
remnant. FifthAnnual NASA-University Conference onManual Control, Ma_achu_tts<br />
Institute ofTechnology, Cambridge, Mass., NASASP-215, March1969.<br />
Levison, W.H.,&Elkind, J.I. Studies ofmulti-variable manual control systems: Twoaxis<br />
compensatory systems withcompatible integrated display andcontrol. NASACR-554,<br />
BoltBeranek andNewman, Inc.,Cambridge, Ma_.,August 1966.<br />
l,uxenberg, H.R.,& Kuehn, R.L. Display systems engineering. New York: McGraw-|lill,<br />
1968.<br />
Magdaleno, R. E., & McRuer, D. T. Effects of manipulator restraints on human operator<br />
performance. AFFDL-TR-66-72, Air Force Flight Dynamics Laboratory, Wright-<br />
Patterson AFB, Ohio, December 1966.<br />
McLane, R. C., & Wolf, J. D. Symbolic and pictorial displays for submarine control. Second<br />
Annual NASA-University Conference on Manual Control, NASA SP-128, Massachu_tts<br />
Institute of Technology, Cambridge, Mas_., May 1968.<br />
McRuer, D. T., Gr_am, G., Krendel, E., & Reiscner, W. Human pilot dynamics in<br />
compensatory systems-theory, models and experiments with controlled element and<br />
forcing function variations. AFFDL-TR-65-15, Air Force Flight Dynamics Laboratory,<br />
Wright-Patterson AFB, Ohio, July 1965.<br />
McRuer, D. T., & Jex, H. R. A review of quasi-linear pilot models. Institute of Electrical<br />
and Electronic Engineers Transactions on Human Factors in Electronics, 1967,<br />
lIFE-8( 3 ), 231-249.<br />
McRuer, D. T., & Weir, D. ti. Theory of manual vehicular control. Ergonomics, 1969,<br />
12(4), 599-633.<br />
NASA SP-169. Recent advances in display media. Symposium, Cambridge, Massachu_tts,<br />
September 1967.<br />
Poole, H. H. Fundamentals of display systems. Washington: Spartan Books, 1966.<br />
Reid, L. D. An investigation into pursuit tracking in the pre_nce of a disturbance signal.<br />
Fifth Annual NASA University Conference on Manual Control, NASA SP-215,<br />
Massachu_tts Institute of Technology, Cambridge, Mass., March 1969.<br />
Sadoff, M., McFadden, N. M., & lteinle, D. R. A study of longiludinal control problems at<br />
low and negative damping and stability with emphasis on effects of motion cues. NASA<br />
TN D-348, January 1961.<br />
Senders, John, Frost, George, & Crocker, Jeremy. The human operator. Bioastronautics<br />
data book. NASA SP-3006, 1966.<br />
Sheridan, T. B. Three models of preview control, lntitute of Electrical and Electronic<br />
Engineers Transactions on Human Factors in Electronics, 1966, HFE- 7(2), 91-102.<br />
Shirley, Richard S. Motion cues in man-vehiclc control. S.M. Thesis, Massachu_tts Institute<br />
of Technology, Cambridge, Mass., January 1968.<br />
Shirley, R. S., & Young, L. R. Motion cucs in man-vehicle control: Effects of roll-motion<br />
cues on human operator's behavior in compensatory systems with disturbance inputs.<br />
Institute of Electrical and Electronic Engineers Transactions on Man-Machine Systems,<br />
1968, MMS-9(4), ! 21-128.<br />
Vinje, E. W., & Miller, D. P. Interpretation of pilot opinion by application of multiloop<br />
models to a VTOL flight simulator task. Third Annual NASA-University Conference on<br />
Manual Control, NASA SP-144, University of Southern California, Los Angeles, Calif.,<br />
March 1967.<br />
Young, L. R. On adaptive manual control. Ergonomics, 1969, 12(4), 635-675.<br />
Young, L. R. Some effects of motion cues on manual tracking. Journal of Spacecraft and<br />
Rockets, 1967, 4(10), 1300-! 303.
806 Bioastronautics Data Book<br />
Young, L. R., & Meiry, J. L. Bang-bang aspects of manual control in high order systems.<br />
Institute of Electrical and Electronic Engineers Transactions on Automatic Control,<br />
1965, AC-IO(3), 336-341.
CHAPTER 17<br />
ATMOSPHERE CONTROL<br />
by<br />
Walton L. Jones, M.D.<br />
and<br />
A. L. Ingelfinger<br />
National Aeronautics and Space Administration<br />
l'he life support system regulates the temperature, pressure and humidity of<br />
the spacecraft atmosphere. In addition, the system controls the constituents of<br />
the atmosphere, removing carbon dioxide and trace contaminants; supplying<br />
oxygen to replace that lost by leakage and metabolic consumption; and<br />
supplying nitrogen to replace that lost by leakage. In order to design an<br />
acceptable life support system a number of design parameters must be<br />
established. Many of these parameters are related to the requirements of the<br />
crew and, therefore, are established in large degree by medical personnel. In<br />
addition, vehicle configuration will significantly influence the Tequirements for<br />
the life support system. When the man, mission and vehicle characteristics are<br />
established, however, then subsystem parameters must be selected which best<br />
integrate into the most effective life support/environmental control system. This<br />
chapter examines all functions of the atmosphere control system and presents<br />
representative performance data and physiological data for the most promising<br />
subsystems developed to date.<br />
Figure 17-1 indicates schematically the principal functions of an atmosphere<br />
control system and the interconnection of the various subsystems. An<br />
operational system is, of course, greatly more complicated than the schematic<br />
suggests, but the figure is included as an aid to those who may be unfamiliar<br />
with the essentials of providing breatheable atmospheres in spacecraft. Very<br />
briefly stated, the system operates as follows. Cabin air laden with humidity is<br />
dried, and trace gas contaminants generated by the crew and equipment are<br />
removed. Carbon dioxide is then extracted and concentrated in the carbon<br />
removal unit and purified air is returned to the cabin. The concentrated carbon<br />
Reviewed by Karl H. Houghton, M.D., and Mouhoud M. Yakut, McDonnell Douglas<br />
Astronautics Company, Huntington Beach, California<br />
807
808 Bioastronautics Data Book<br />
m._<br />
W<br />
IZz<br />
N--_<br />
I_<br />
_>-<br />
ImOI<br />
Lux<br />
m<br />
U.I<br />
W<br />
._z_.<br />
z_<br />
0<br />
z<br />
0<br />
zo<br />
Oz<br />
_g8<br />
il<br />
i<br />
a _c<br />
we¢-<br />
_8<br />
0-,<br />
0<br />
_L<br />
Q;<br />
e"<br />
E<br />
I
Atmosphere Control 809<br />
dioxide is then processed to recover oxygen, and carbon compounds are dumped<br />
overboard (or, in future systems, possibly cracked or used in attitude control). It<br />
should be emphasized that a typical system is being illustrated here. Particular<br />
processes will depend upon both mission parameters and available technology.<br />
Table 17-1 shows a materials mass for a one-man life support system. It also<br />
includes urine and wash water reclamation units (Jackson, 1971).<br />
Potable Water Recovery<br />
Output 3.45 Ib urine<br />
Table 17-1<br />
Space Cabin Mass Balance<br />
(Pounds/Man-Day, Based On<br />
2800 KCal/Day)<br />
3.08 Ib respiration and perspiration<br />
.25 Ib feces and H20<br />
Total Output 6.78 Ib H20<br />
- .66 Ib metabolic H20 from 1.3 Ib dry food<br />
Total required 6.12 Ib/man for drinking and rehydrating food<br />
Oxygen Recovery<br />
To produce<br />
Total<br />
To produce<br />
Wash Water<br />
2.12 Ib CO2 from concentrator<br />
.24 Ib H2 (electrolysis and stores--Sabatier reactantsl<br />
1.01 Ib H20 from Sabatier<br />
1.06 Ib H20 from storage<br />
2.07 Ib H20 electrolyzed<br />
1.83 Ib 02<br />
Oxygen and Nitrogen leakage<br />
(Jackson, 1971 )<br />
25 Ib recovered and recycled<br />
1-5 Ib/day<br />
Carbon Dioxide<br />
Man functions as a combustion heat engine, continuously consuming oxygen<br />
and producing carbon dioxide and water vapor as a part of the life processes. In<br />
closed atmospheres, the concentrations of these waste products must be<br />
controlled. Carbon dioxide management implies its removal from the breathing<br />
48'/-858 O - 73 _ 52
810 Bioastronauti_ Data Book<br />
gas supply and its disposal. The removal process can be accomplished by a<br />
variety of different methods, including adsorbents, solid and liquid absorbents,<br />
diffusion cells, and electrochemical cells. The carbon dioxide which is separated<br />
from the breathing gas can be dumped overboard, stored onboard, or processed<br />
to recover the oxygen contained therein for reuse. Presented in this section are<br />
representative data for the most promising carbon dioxide removal and/or<br />
collection methods, discussed in the following order:<br />
1. Lithium ttydroxide<br />
2. Solid Amines<br />
3. Hydrogen-Depolarized Cells<br />
4. Molecular Sieves<br />
Lithium Hydroxide<br />
Of all the CO 2 removal methods, lithium hydroxide has been used most in<br />
spacecraft application. This choice was based on the relatively high CO2<br />
absorption capacity of LiOH per unit mass of material, coupled with a<br />
lower-than-average heat of absorption. Table 17-2 compares the performance of<br />
LiOH with a number of other CO2 absorbents.<br />
Table 17-2<br />
Theoretical Performance of Carbon Dioxide Absorbents<br />
Substance Formula<br />
Theo. CO2 Capacity Heat of Carbonate<br />
(Ib CO2/Ib Absorption Decomposition<br />
Lithium oxide Li20 1.47 2210<br />
Absorbent) (Btu/Ib CO2)Temperature (OF)<br />
Lithium hydroxide LiOH 0.92 875<br />
Sodium oxide Na20 0.71 3140 1290<br />
Sodium hydroxide NaOH 0.55 1228 1290<br />
Potassium oxide K20 0.47 3820 1340<br />
Potassium hydroxide KOH 0.39 1395 1340<br />
Magnesium oxide MgO 1.09 1150 840-1020<br />
Magnesium hydroxide Mg (OH)2 0.76 358 840-1020<br />
Calcium oxide CaO 0.79 1738 1345-1515<br />
Calcium hydroxide Ca(OH) 2 0.60 670 1345-1515<br />
Silver oxide Ag20 0.19 151 250-300<br />
Cadmium oxide CdO 0.34 975 660<br />
(Coe et el., 1962)<br />
LiOH absorbs CO2 from a gas mixture and in the presence of water vapor. A<br />
cabin relative humidity of 50 to 70 percent usually provides sufficient water
Atmosphere Control 811<br />
vapor for the absorption reaction to take place. The reaction is given by the<br />
following equation:<br />
2LiOH + CO2 _ Li2CO3 + H20<br />
This reaction is exothermal, producing 875 BTU per pound of CO 2 absorbed,<br />
assuming the water of reaction is evolved as vapor. Table 17-3 lists some of the<br />
properties of LiOH as a CO2 absorbent.<br />
Chemical formula<br />
Molecular weight<br />
Melting point<br />
Density of crystals<br />
Table 17-3<br />
Properties of Lithium Hydroxide<br />
Bulk density of granular LiOH<br />
Theoretical CO2 absorption capacity<br />
Heat of absorption (H20 gas)<br />
Water of reaction<br />
(Coe et el., 1962)<br />
LiOH<br />
23.95<br />
862°F<br />
0.0918 Ibcu in.<br />
0.0145-0.0162 Ib/cu in.<br />
0.917 Ib CO2/Ib LiOH<br />
875 Btu/Ib CO2<br />
0.409 Ib/Ib CO2 (or<br />
0.375 Ib/Ib LiOH)<br />
The dynamic removal efficiency which expresses the reduction in CO 2<br />
concentration across the bed varies with time in the operation of a LiOH<br />
canister as _he absorbent is used up. Usua_y, as _own in Figure 17-2,<br />
removal efficiency remains high (in excess of 70percent) until the<br />
"breakthrough" point in time is approached. The breakthrough point is<br />
defined as the time when the CO 2 concentration in the effluent gas from a<br />
given canister reaches a specified value. It is apparent that utilization<br />
efficiency to some extent will be a function of the breakthrough point<br />
specified. Typically, a breakthrough point corresponding to a Pco2 of<br />
8.0 mm Hg is used for rating or performance comparison purposes.<br />
Figure I7-3 shows the temperature rise across a lithium hydroxide<br />
canister assuming that all of the water of reaction is evolved as vapor.<br />
Inspection of a psyehrometric chart shows that, for any case where the<br />
temperature of the air is not lower than 32°F and the pressure is not<br />
higher than one atmosphere, the slope of the process line in the LiOH bed is<br />
such that the increase in temperature of the air will be ample to provide<br />
vaporization of all the moisture produced in the chemical reaction. Operation of<br />
the LiOH canister with inlet gas temperatures around 120°F appears to result in<br />
higher utilization efficiencies than does operation at lower temperatures.
812 Bioastronautics Data Book<br />
_ l i / I I [ 1 _, i / / I 1 _,<br />
I0 cARBoN DIOXIDE REMOVAL RAIE = 0.11-0. 12 LB PER HR i<br />
• t'_ H 'I)R{X[D,_: !_:D I. ENc;I_ .7 ,_ N<br />
'<br />
I<br />
i ,/z<br />
' ; ! i<br />
! / BRi-;:\K IHt_CI[ I;H I IM][ _ [J<br />
, r : i i ' t i i<br />
i _ t J i , .//I<br />
, i i ! _<br />
5 : |<br />
_ i I I I II<br />
, i , ' I/<br />
i--,-- 1<br />
0 2 4 t ,_ lO t2 14 16 I_ 20 2Z 24 di d_ 30 _Z ,4<br />
lIME, HR<br />
Figure 17-2. Typical curve showing LiOH canister performance. (Coe et ai., 1962)<br />
Solid Amines<br />
Another type of chemical CO 2 absorption is based on the use of organic<br />
amines. These compounds are highly basic and react with CO 2 to form<br />
carhonates. At elevated temperatures, the reaction can be reversed, enabling the<br />
u_e of amines in a regenerative system. Liquid amines have been used in<br />
industrial applications and on submarines. These systems usually employ<br />
monoethanol amine (MEA), although other members of the same chemical series<br />
are also effective. 3'he attractive regenerative properties of the aliphatic amines<br />
have led to research on the possibility of employing solid amines, preferably in<br />
the form of resins, in order to avoid the zero-g liquid handling problems<br />
associated with solutions.<br />
Investigations of the use of amine resins for CO2 absorption have been<br />
carried out using both commercially available ion exchange resins and special<br />
resins synthesized for this purpose. Tests of the commercial resins have indicated<br />
that the strongly basic resins absorb CO 2 at relatively rapid rates, but that only<br />
limited regeneration is possible with the application of heat. The weakly basic<br />
resins, on the other hand, exhibit slow CO2 absorption ratcs but permit greater<br />
thermal regeneration. Specially prepared amine resins, in which excess aliphatic<br />
amines are added to epoxy resins, in certain cases yield resins that can be<br />
regenerated completely by heating and that show rapid CO 2 absorption rates.<br />
Solid amine systems remove CO 2 from cabin air by means of cyclic<br />
absorption/desorption in suitable granular amine resins. The chemical nature of<br />
the bonding between CO 2 and these resins provides a CO 2 removal method<br />
which is feasible for cabin PCO 2 levels of 3 mm Hg or less.
0<br />
?0<br />
6O<br />
50<br />
_ 4o<br />
[.-,<br />
_e 3O<br />
ZO<br />
10<br />
0<br />
0<br />
NOTE:<br />
CO2<br />
\\<br />
\<br />
ZO<br />
Atmosphere Control 813<br />
\<br />
GENERATION: 2.Z5 LB PER MAN-DAY<br />
/<br />
-- ZLiOH + CO Z : LiECO3 + HzO(g)<br />
10 i I i I<br />
4 60 80 I00<br />
GAS FLOW, LB / MAN - HR<br />
Figure 17-3. Temperature rise across LiOH canister. (Coe et al., 1962)<br />
Dynamic CO2 absorption and desorption processes, as well as equilibrium<br />
CO 2 bed loading conditions, are extremely sensitive to the amount of water<br />
present. For example, for Rohm and Haas IR-45 resin, increases in bed water<br />
content up to as high as 40 percent weight result in correspondingly increased<br />
absorption efficiencies. However, for this resin, water vapor content higher than<br />
25 percent causes excessive pressure drop and flooding. Table 17-4 lists some of<br />
the physical and chemical characteristics of IR-45. Also shown in Figure 17-4 is<br />
the transient outlet PC02 as a function of time and bed water content.<br />
Representative dynamic removal efficiency curves and the overall time inte-<br />
grated removal efficiency, which may be used in sizing IR-45 beds, are also<br />
presented in Figure 17-4.<br />
With the solid amines bed cooler than approximately 140°F, the absorption<br />
process takes place according to the following relationship:<br />
R * NH 2 + CO 2 + H20"q_RNH _ + HCO 3
814 Bioastronautics Data Book<br />
Physical Characteristic_<br />
Physical form<br />
Density<br />
Moisture content<br />
Screen grading<br />
Effective size<br />
Uniformity coefficient<br />
Voids<br />
Chemical Characteristics<br />
Exchange capacity<br />
pH Range<br />
Chemical stability<br />
Stability at elevated<br />
temperatures<br />
(Martin & Brose, 1970)<br />
Table 17-4<br />
Manufacturer's Data on Rohm and Haas IR-45 Resin<br />
Uniform, beadtike particles<br />
3943 Ib/ft 3<br />
37_15%<br />
20-50 mesh<br />
0.35-0.50mm<br />
1.6 max<br />
35-45%<br />
43 Kg/ft 3 max as CaCo 3<br />
0-7<br />
(27 Kg dynamic capacity)<br />
Excellent; completely insoluble<br />
and inert in strong acids (except<br />
nitric), concd alkalies,<br />
aliphatic and aromatic hydrocarbons,<br />
alcohols, ethers and all other<br />
common solvents; prolonged exposure<br />
to strong oxidixing agents should<br />
be avoided<br />
Outstanding; exchange capacity<br />
unchanged after prolonged<br />
exposure to boiling water<br />
The desorption of solid amines may be accomplished by the application of<br />
heat and/or vacuum, or steam. For the case of steam desorbed resins, desorption<br />
is accomplished by flowing superheated steam into the bed in the axial direction.<br />
The steam condenses on the resin, heats the resin and displaces the CO 2 and air.<br />
The process occurs in "chromatographic" fashion. That is, steam, C02, and air<br />
are found in individual zones which travel along the length of the bed. The<br />
displaced CO 2 is reabsorbed immediately ahead of the steam zone and the air is<br />
displaced ahead of the C02-rich zone. This chromatographic feature of the<br />
desorption process facilitates separation of CO 2 from air and steam. Flows of<br />
the separate quantities of gas in each of the zones have associated physical<br />
properties which can be sensed and used in control schemes for diverting the<br />
CO 2-rich flow to the CO 2 accumulator and also for diverting the air and steam<br />
flows back to the cabin via a condensing heat exchanger. Figure 17-5 shows<br />
representative performance data for the steam desorbed resin C02 concentrator<br />
used in the NASA Langley Research Center/McDonnell Douglas 90-day manned<br />
test. The lower curve shows the mixed PCO 2 downstream of the two absorption
Atmosphere Control 815<br />
beds. As shown, the effluent PCO2 drops rapidly at the start of the absorption<br />
phase, reaches a minimum value, and then rises with a plateau characteristic<br />
observed partway through the PCO2 rise.<br />
°'_tl I l\ _.,oTA- _,ow =<br />
I | 40% I ..... _f X I I/MIN<br />
_ 3' INLETRH = 50%<br />
W 0"10_ / /20% H20 _ 4' DBED = 1"3m IN<br />
o.o p/ / ,,EO,',,TE.<br />
I I / CO,_TE,',T AS<br />
I// , , NO;EO<br />
0 50 1 O0 150<br />
TiME (MIN)<br />
Figure 17-4. Transient outlet PCO_ and removal efficiences for IR-45.<br />
(Tepper et-al., 1968)<br />
Hydrogen-Depolarized Cells<br />
O<br />
-- 1OO c_<br />
_o<br />
-- 8O <<br />
,c'-<br />
-- 60 Z
816 Bioastronautics Data Book<br />
since mass transfer occurs only in the gaseous state. There are no free liquids or<br />
components dependent upon gravity operation.<br />
"1"<br />
v<br />
UJ<br />
tw<br />
¢0<br />
UJ<br />
tw<br />
tx<br />
t'xt<br />
8<br />
-1-<br />
UJ<br />
tr<br />
tO<br />
tO<br />
ILl<br />
rr<br />
--I<br />
.¢<br />
n"<br />
fit.<br />
OI<br />
8<br />
(TWO BED OPERATION)<br />
1,320 CO 2 ACCUMULATOR<br />
PRESSURE<br />
1300<br />
L26O<br />
1,3,io _BED<br />
+ 26O<br />
NO. I OESORBING BIED NO 2 DESOROING<br />
so --<br />
3.O<br />
40<br />
20 SEO flu 2<br />
1.0<br />
Pco IN UNIT OUTLET AIR<br />
BED NO. i<br />
x , /?°', , + /'i"°i<br />
0 O 2 4 6 8 10 12 14 16 18 20 22 24 26<br />
TIME (MIN)<br />
1.6O• lO5<br />
¢N<br />
I 7ox IO5 _<br />
I-<br />
20o n"<br />
O.<br />
P,I<br />
i(_ 0<br />
CJ<br />
Figure 17-5. NASA Langley Research Center/McDonnell Douglas manned test: amine<br />
Molecular Sieves<br />
resin CO 2 concentrator performance. (Jackson, 1971)<br />
Regenerative molecular sieve units use granular synthetic zeolites as the basic<br />
CO 2 collecting material. The zeo|ites are metal ion alumino silicates which have<br />
a relatively high affinity for CO2, but a still higher affinity for water. Thus,<br />
desiccants must be used to reduce the moisture content in the cabin atmosphere<br />
before it is introduced into the zeolite beds. Desiccant materials may be either<br />
silica gel or another synthetic zeolite. Molecular sieve units usually include air<br />
coolers to lower the temperature of the atmosphere being fed to the zeolite<br />
canisters to increase the CO 2 adsorption capacity of these beds. The synthetic<br />
zeolites of interest for CO 2 adsorption have a heat of adsorption of 300 BTU/Ib<br />
of CO2, a specific heat of 0.25 BTU/Ib°F, a thermal conductivity of<br />
0.34 BTU/hr ft°F, and a density of approximately 45 Ib/ft 3. Figures 17-8 and<br />
17-9 show equilibrium adsorption isotherms for molecular sieves and silica<br />
gel.<br />
z<br />
n_<br />
Q.<br />
8
Atmosphere Control 817<br />
HYDROGEN OXYGEN OXYGEN<br />
CARBON<br />
WATER CARBOh<br />
VAPOR DIOXIDE<br />
CO, CO 2<br />
(H_, H20_<br />
Figure 17Mi. Hydrogen depolarized cell. (Wynveen & Quatrone, 1971 )<br />
Table 17-5<br />
Physical Characteristics of Developmental Hydrogen Depolarized Cell<br />
Electrode area 35 in 2 (per cell)<br />
Electrode type AB-6<br />
Electrolyte matrix Asbestos<br />
Electrolyte Cs2CO 3<br />
Cell material Injection molded polysulfone<br />
Gas cavity spacer Expanded titanium<br />
Heat removal plates (current<br />
collectors) Titanium-clad copper<br />
Seals Flat, ethylene-propylene gaskets<br />
Cell size (overall) 7.7 x 13.7 x 0.15<br />
Current density (max) 40 ASF<br />
No. of cells per module 15<br />
Module size (overall) 7.7 x 13.7 x 4.5<br />
CO 2 transfer rate 0.234 Ib/hr<br />
CO 2 partial pressure 3.8 mm Hg<br />
(Huebscher & Babinsky, 1970)<br />
co2, TAL TI<br />
REACTOR
818 Bioastronautics Data Book<br />
Z<br />
c?<br />
d<br />
0<br />
0<br />
0'_,.<br />
0<br />
I<br />
'7<br />
n-1 13-<br />
Q a ° o o<br />
t_<br />
I I<br />
_Jc.I<br />
(SISV8 A_O " %) i_O _OINI CO0<br />
am0C<br />
COl--<br />
r4<br />
a<br />
w<br />
m<br />
5.10<br />
_._<br />
0<br />
_.1_ -.<br />
I,,-<br />
_ .02<br />
Atmosphere Control 819<br />
Z<br />
0<br />
.....<br />
_ 0<br />
m_ 0 1.0 2.0 3.0 4.0 5.0 6.0 7.0 8.0 9.0<br />
CARBON DIOXIDE PARTIAL PRESSURE, mm Hg abs.<br />
Figure 17-8. Adsorption isotherms for Type 5A molecular sieve. (Jackson & Blakely, 1967)<br />
z_<br />
.24<br />
o= 16<br />
z_<br />
w_<br />
40"F I<br />
0 v) IO0"F<br />
ltO'F _<br />
_ '200"F'<br />
3 6 9<br />
WATER VAPOR PARTIAL PRESSURE, mr. Hg abs.<br />
Figure 17-9. Adsorption isotherms for silica gel. (Jackson & Blakely, 1967)<br />
Three typical methods of CO 2 removal by molecular sieve materials which<br />
may be used for different spacecraft applications are considered here. These are<br />
all of the regenerative type. They are: (1) a two-bed adiapatic system utilizing<br />
two types of sieve material within each bed (one type for water adsorption, one<br />
for CO2 adsorption); (2) a two-bed system similar to the first type but having<br />
silica gel as the desiccant and a fluid heat exchanger in the silica gel; and (3) an<br />
isothermal four-bed system whereby the silica gel and molecular sieve materials<br />
are contained in separate beds and in which each bed is provided with integral<br />
fluid heat exchangers. The first two methods vent both water and CO 2 to space.<br />
The third provides water recovery and, if desired, CO 2 collection for oxygen<br />
recovery. The operating characteristics for each of these methods are discussed<br />
in the following paragraphs.
820 Bioastronautic._ DataBook<br />
Two-Bed Molecular Sieve- Water Adsorption/CO2Adsorption. This type<br />
system is primarily for low gas flow rate application. It has a small pressure drop<br />
and high removal efficiency. The molecular sieve beds are provided with a Linde<br />
Type 13X zeolite for water removal and a Linde Type 5A zeolite for CO 2<br />
removal. Electrical heaters are provided for bakeout of the beds should they<br />
become "poisoned" with water; otherwise, normal regeneration simply involves<br />
venting the beds to tile space environment. This system usually operates on a<br />
15-minute adsorption/desorption cycle. Inlet process air is 45 ° to 55°F and<br />
saturated.<br />
Two-Bed Molecular Sieve - Silica Gel Desiccant and Fluid Heat Exchanger.<br />
This system utilizes silica gel as a desiccant in each bed. The silica gel bed<br />
contains an integral fluid heat exchanger to improve its water adsorption and<br />
desorption characteristics. The molecular sieve portion of the bed also contains<br />
electrical heaters to aid adsorption and desorption of the molecular sieve bed if<br />
it becomes "poisoned" with water. This system is also a low gas flow, small<br />
pressure drop, high removal efficiency type. Operation usually involves a<br />
30-minute adsorption/desorption cycle, 120°F heating fluid, 60°F cooling fluid,<br />
and 45 to 55°F saturated inlet air.<br />
Isothermal, Four-Bed Sieve. In this method, the silica gel and molecular sieve<br />
materials are packaged in separate beds. Each bed is provided with an<br />
integral heat exchanger to improve adsorption and desorption characteristics.<br />
A schematic of the system is shown in Figure 17-10. In the operational<br />
mode shown in the schematic, silica gel bed No. 1 and molecular sieve bed<br />
No. 1 are being cooled and are in their adsorption cycle. The gas from<br />
molecular sieve bed No. 1 is then passed through silica gel bed No. 2 which<br />
is concurrently heated to desorb trapped water and return it to the cabin.<br />
At this time, molecular sieve bed No. 2 is being heated and desorbed. The<br />
CO2 may be vented to space. If, however, an oxygen recovery subsystem is<br />
used, recovered CO 2 is pumped into an accumulator or recovery unit. When<br />
pumps are used, a higher temperature is required for CO2 desorption<br />
because of the pump limitations. The isothermal, four-bed molecular sieve<br />
system usually operates on a 30-minute adsorption/desorption cycle, with<br />
process air supplied saturated at 40°F. Cooling fluid is supplied at<br />
approximately 40°F, and heating fluid at approximately 300°F.<br />
Experimental work with molecular sieves (ttouck et al., 1970) shows<br />
that as the heating fluid temperature decreases, the equilibrium chamber<br />
CO 2 concentration increases. This fact is illustrated in Figure 17-11. Heating fluid<br />
temperature in the study reprc_nted was varied over a range of 200 ° to 338°F.<br />
The high weight penalties associated with providing fluids at the elevated<br />
temperatures required for efficient molecular sieve operation led to the search<br />
for other CO2 concentration methods, notably solid amines and hydrogendepolarized<br />
cells. Another factor militating against the use of molecular sieves is<br />
their decreased adsorptive capacity at low CO2 partial pressures (negligible at<br />
1.0 mm tlg) which is incompatible with the current trend toward low cabin<br />
PC O 2 levels.
HEATING<br />
Atmosphere Control 821<br />
• . • _. .. • : -<br />
CAB,NA,R_ ,; _ J I /I<br />
FROM Vl BLOWER -- SPACE<br />
OUTLETT I \_ I ITv_ _ Tv3/L ',<br />
'OFWATER t f _L_ H- _, t / J--_ ' - II "<br />
,J°J,"_LT.v TO INLET<br />
_d_ER<br />
L "<br />
_TO:.B,N<br />
""OL_CULAR<br />
S,EVE.EO --- --<br />
cABN AIR I<br />
CO0_..T.LU,OI<br />
• _ HEATING FLUID |<br />
Figure 17-10. Four-bed isothermal regenerative molecular sieve system.<br />
CHAMBER CO2 CONC.,]'2_ /<br />
PERCENT VOLUME I_> <br />
.8 O<br />
(Jackson & Biakely, 1967)<br />
2.Or- CO 2 LOAD • 9.28 Ib/day<br />
DC-)3| FLOW , 160 Ib<br />
, OCO_ _C_
822 Bioastronautics Data Book<br />
Carbon Dioxide Reduction<br />
Sabatier Process. The Sabatier process involves the hydrogenation of CO 2<br />
over a 400 ° to 700°F catalyst in a reactor. The Sabatier reaction is summarized<br />
by the following equation:<br />
CO 2 + 4H2-t_CH 4 + 21120<br />
The Sabatier water product is electrolyzed to oxygen, for breathing, and to<br />
hydrogen for return to the Sabatier reactor. The methane produced may be<br />
disposed of in one of the following ways:<br />
1. Overboard dumping.<br />
2. Decomposing the methane to carbon and hydrogen, with return of the<br />
hydrogen to process streams and collection of solid carbon.<br />
3. Converting the methane to a compound containing a smaller proportion<br />
of hydrogen (e.g., acetylene), separating the gases, dumping the acetylene<br />
overboard, and returning hydrogen to process streams.<br />
From the equilibrium equation for the Sabatier reaction, Gibb's free energy<br />
relation, enthalpies and standard heat of formation, the theoretical degree of<br />
CO2 conversion can be related directly to the equilibrium temperature (Jackson,<br />
1971). This relationship is depicted in Figure 17-12, which shows the maximum<br />
possible CO 2 conversion at atmospheric pressure and any given temperature for<br />
a stiochiometric tt 2 :CO 2 ratio of 4:1. From this curve it can be seen that, from<br />
equilibrium considerations, it is desirable to operate the reaction at temperatures<br />
approximating 300°F for 100 percent CO 2 conversion, or up to 400°F for<br />
99 percent conversion; operation at temperatures higher than these prohibits this<br />
high degree of CO 2 conversion. At low temperatures (300 ° to 500°F),<br />
conversion occurs only with the proper choice of catalyst. The precious metals<br />
ruthenium, rhodium, and iridium are the most effective catalyzing materials for<br />
promoting the reduction reaction, with 0.5 percent ruthenium-on-alumina the<br />
best of these (Thompson, 1964 1967).<br />
The Sabatier stoichiometric H2 :CO 2 ratio of 4:1 for complete conversion of<br />
CO 2 to methane is not optimum in an actual unit. Optimum reaction rates have<br />
been experimentally determined to be a molar ratio of 4.35:1 (Yakut & Barker,<br />
1969). However, the ratio used should be based on mission tradeoffs, including<br />
water availability, stored 02 and H 2 gas weight penalties and water electrolysis<br />
penalty. For some mission applications, it may be advantageous not to store H2<br />
onboard but to use a C02-rich mixture to insure maximum conversion of<br />
hydrogen. Such a mission application was simulated in a 90-day manned test<br />
conducted by the NASA Langley Research Center and McDonnell Douglas<br />
Astronautics Company. Figure 17-13 shows the Sabatier feed gas mixture ratio<br />
for this test.<br />
Hydrogenation catalysts are poisoned by halogen or sulfur-containing<br />
compounds, so these must be excluded from the feed gas. The effect of<br />
contaminants on the conversion of CO 2 to CH4 is shown in Figure 17-14. As
Atmosphere Control 823<br />
the figure indicates, halogen-containing compounds are more poisonous than<br />
sulfur-containing compounds.<br />
CO 2 + 4H2-1_CH 4 + 2H20<br />
R = H2:CO 2 ratio, volumetric<br />
1.0<br />
19<br />
Z<br />
O .8<br />
R = 4.0,--_ !<br />
=5.0<br />
rr<br />
ILl<br />
><br />
Z .7<br />
O Theoret<br />
U<br />
o_ Conversion vs<br />
0<br />
U .6 uilbrium<br />
LL<br />
O Temp., OF<br />
Z<br />
O<br />
_ .5<br />
<<br />
lIE<br />
u.<br />
.J<br />
u<br />
.4<br />
I-w<br />
.3<br />
0<br />
tu<br />
i<br />
I-,- .2<br />
×<br />
.1<br />
/1" = REACTION PRESSURE, psia<br />
R =4.5, _T= 14.7<br />
3tic Reaction<br />
Tamp,. OF vs<br />
Conversio n<br />
= 4.0, 7i" = 14.7<br />
0 2 4 6 8 10 12 14 16 18 20 22 24<br />
TEMPERATURE (OF - Hundreds)<br />
Figure 17-12. Theoretical CO 2 equilibrium conversion vs temperature<br />
for Sabatier reaction. (Remus et al., 1965)<br />
Other factors also influence the efficiency of CO 2 conversion. Extremely<br />
short reactor beds may introduce channeling and extremely long beds result<br />
in a large pressure drop, both of which reduce conversion efficiency. Space<br />
velocity appears to have a much greater negative influence on the reaction<br />
rate than mass velocity. Space velocity is volume-dependent and is<br />
characterized by the volume of feed in a unit time per volume of catalyst.<br />
The reaction products, CH4 and water, have little effect on the Sabatier<br />
reaction rate.
824 Bioastronautics Data Book<br />
loo<br />
90<br />
80<br />
q¢<br />
T<br />
U 70<br />
O<br />
I--<br />
Q<br />
UJ 60<br />
In"<br />
LLI<br />
><br />
z 50<br />
o<br />
(J<br />
(N<br />
o<br />
o 40<br />
30--<br />
20<br />
0<br />
--',- 2000 ppm CCI 4<br />
'000__<br />
"'-" 2000 ppm CH3OH<br />
CATALYST: NO. 543- 127 (50%<br />
RUTHENIUM ON<br />
ALUMINA)<br />
SPACE VELOCITY: 4000 HR -1<br />
CATALYST BED DEPTH: 23.5 in<br />
BATH TEMPERATURE: 275°C (527°F)<br />
H 2 EXCESS: 10%<br />
I I I I I I P I<br />
2 4 6 8 10 12 14 16<br />
TIME (hr)<br />
Figure 17-13. NASA Langley Research Center/McDonnell Douglas 90-day test Sabatier<br />
mixture ratio. High mixture ratios resulted from reducing lhe catalyst with hydrogen<br />
to overcome poisoning. (Jackson, 1971)<br />
o_<br />
o<br />
o<br />
!<br />
I<br />
v !p \'<br />
o ;.o 3o 40 _o so to 8o<br />
TEST DAY<br />
Figure 17-14. Effect of contaminants on the conversion of CH2toCH 4.<br />
(Adlhart & Hartner, 1967)
Atmosphere Control 825<br />
A summary material balance for the 90-day test Sabatier reactor is presented<br />
in Table 17-6. The table shows that the overall conversion of H 2 to water and<br />
CH 4 was 95 percent and overall CO 2 conversion was 66 percent.<br />
Table 17-6<br />
Sabatier Subsystem Material Balance for 90-Day Test<br />
Material In Material Out<br />
Carbon dioxide 636.9 Ib Water to electric cell 332.0 Ib<br />
Hydrogen 81.0 Methane 152.5<br />
Nitrogen 16.6 Carbon dioxide 217.6<br />
Oxygen 8.1 Nitrogen 16.6<br />
Water vapor 5.5 Oxygen .5<br />
Hydrogen 3.8<br />
Water exhausted 25.1<br />
TOTAL 748.1 Ib TOTAL 748.2 Ib<br />
Bosch Reaction. The Bosch carbon dioxide reduction reaction is usually<br />
summarized by the followhlg equation :<br />
(:0 2 2H2_C + 2H20 + 595 W-hr/kg CO 2<br />
The reaction occurs in the presence of an iron catalyst at temperatures of 1100 °<br />
to 1800°F. Partial conversion is achieved, ranging from 30 percent at file lower<br />
temperatures up to 98 percent at higher temperatures. Unfortunately, maximum<br />
carbon formation occurs in the Bosch reaction temperature range. Within this<br />
range, additional reaction also occur. This results in the production of carbon<br />
monoxide and methane, as follows:<br />
CO 2 + C_2CO<br />
2112 ÷ C _CH 4<br />
The gases resulting from the side reactions above are usually recycled to achicvc<br />
a higher degree of conversion.<br />
The rate of the Bosch reaction is controlled by many apparently inde-<br />
pendent but nonetheless interrelated variables. The most important variables<br />
relate to the conditions in the reactor. Reaction kinetics are, for example,<br />
influenced by reactor temperature and gas flow rate or recycle rate, which is<br />
487 B5B O 73 53
826 Bioastronautics Data Book<br />
controlled by the recycle compressor. Increasing the flow rate through the<br />
reactor increases the probable number of collisions per unit time, thereby<br />
increasing the reaction rate, and this, in turn, calls for higher compressor power<br />
requirements. Experiments conducted to investigate the effects of reactant gas<br />
H2:CO 2 volume ratio on conversion rates (Clark, 1967) have shown that<br />
conversion rates are somewhat insensitive to gas ratios. However, a hydrogen-rich<br />
ratio appears more conducive to higher conversion rates.<br />
One of the major development problems encountered with the Bosch reactor<br />
is that of solid carbon collection. Two catalyst configurations have been utilized.<br />
One consists of an expendable static cartridge of steel wool and the other is a<br />
rotating assembly of low-carbon steel plates. Emphasis is placed at the present<br />
time on developing a Bosch CO 2 reduction unit with expendable catalyst<br />
cartridges. Typical test data from a Bosch system are shown in Table 17-7. The<br />
data in the table were taken after a 12-hour leadtime for warm-up.<br />
Solid Electrolyte System. The solid electrolyte system utilizes a solid<br />
electrolyte reactor and a carbon monoxide disproportionation reactor for the<br />
complete reduction of carbon dioxide to carbon and oxygen. A typical solid<br />
electrolyte reactor (Weissbart & Smart, 1970) is comprised of a number of<br />
two-cell drums. Each drum consists of two electrolyte disks, each having 20-cm2<br />
electrodes, sealed to a 6.3-cm diameter zirconia-calcia ring body. Disks (0.08 to<br />
0.22 cm thick) are made from hot-pressed compacts of scandia-stabilized<br />
zirconia. Typical electrolyzer modules are assembled by connecting drums to<br />
alumina manifold tubes by means of metal gas-feed tubulations. Modules<br />
incorporate parallel gas flow through the drums and series electrical connection<br />
between the cells. For a gas stream including CO 2 and water vapor the following<br />
reactions occur at the cathode:<br />
2CO 2 ÷ 4e----_2CO + 20:<br />
H20 + 2e---_ H 2 + O=<br />
At temperatures of 525 ° to 700°C (1000 ° to 1300°F), the 0: ions are<br />
transported across the oxide film by the potential gradient. (The reactions are<br />
enhanced by the presence of water in the gas stream.) The oxygen ion then<br />
migrates through vacancies in the crystal lattice of the solid electrolyte material<br />
to the anode, where the ion is converted to an oxygen atom. The cell material is<br />
essentially impermeable to non-ionic species (in particular to CO) so that pure<br />
02 is formed at the anode and may be sent to the cabin with no further<br />
processing other than cooling. The cell consumes power for decomposition of<br />
CO2 and resistance heating of the solid electrolyte. The unit must be well<br />
insulated to prevent heat leakage which would decrease performance. An<br />
auxiliary heater in the cell is designed to bring it to operating temperature.<br />
The free energy change involved in the decomposition of CO2 to CO and to<br />
02 is 123 kcal/gram-mole of 02. This corresponds to a theoretical power<br />
requirement for a cell of 136 W/kg of CO 2 per day. The mixture of CO and CO 2
Atmosphere Control 827<br />
from the cell cathode is passed through a catalytic reactor which converts<br />
CO to CO 2 (returned to the electrolytic cell) and to solid carbon. The free<br />
energy change in this reaction is 29kcal/gram-mole of carbon. This<br />
corresponds to a heat dissipation requirement of 735 W/kg of CO2 per day.<br />
Table 17-7<br />
Typical Bosch Carbon Dioxide Reduction System Test Data*<br />
Data Collection Time 1535 1600 1630 1700 1730<br />
CO 2 Feed Rate, lb/day 9.7 I0.2 I0.8 11.2 11.1<br />
H 2 Feed Rate, lb/day 0.900 0.960 1.02 1.02 1.02<br />
Recycle Rate, cfm 2.25 2.25 2.25 2.25 2.25<br />
Purge Rate, cfm 0. 005 0. 005 0. 005 0. 005 0. 005<br />
Water Separator Pressure, pslg 2.20 2.18 2.10 2.00 1.95<br />
Bosch Reactor Pressure, psig 9.6 9.3 9.2 9.1 8.9<br />
Temperature, o F<br />
Bosch Reactor 1230 1240 1240 1240 1240<br />
Carbon Collector 115 115 120 125 125<br />
Water Separator 47.3 47.0 46.0 44.7 44.0<br />
Compressor Discharge 150 150 150 150 148<br />
Bosch Reactor Inlet 800 810 820 820 820<br />
Bosch Reactor Power, watts<br />
Main Heater ** 200 200 200 200 200<br />
Auxtl iary Heater 610 610 320 320 620<br />
Gas Analysis, volume %<br />
H2 43.0 69.4 56.0 -<br />
CO 2 11.7 6.4 - 9.8 -<br />
CH 4 12.0 5.7 13.0 -<br />
CO 12.0 6.0 11.0 -<br />
N 2 18.0 11.0 9.2 -<br />
02 3.0 1.5 0.7 -<br />
Water Rate, lb/day 5.8 5.8 5.8 7.2 7.4<br />
Theoretical Water Rate, Ib/day 7.91 8.31 8.88 8.94 8.94<br />
* NASA/Langley I LSS Bosch reactor operated at 10 psia.<br />
* * Main heater started at 500 W and reduced gradually to 200 W as reactor came up to temppereture,<br />
(Armstrong, 1966)<br />
A flow diagram of a typical solid electrolyte system is presented in<br />
Figure 17-15. The regenerative heat exchanger pictured cools the gas<br />
products to approximately 950°F, which is the operating temperature of<br />
the catalytic reactor. The catalyst used in the reactor is nickel or stainless<br />
steel. Carbon build-up is sensed by a pressure switch which signals for a
828 Bioastronautics Data Book<br />
change of catalyst bed when necessary. The catalytic reaction is exothermic<br />
and no heating is needed once the system has reached operating<br />
temperature.<br />
ELECTRICAL<br />
POWER<br />
OXYGEN • T REACTOR (ISOO°FI<br />
TO CABIN _ I 2C02 2H20_ _ CO 2H 2 + ÷ O,_ 02<br />
t I .....<br />
CATALYTIC REACTOR<br />
(1000°EI CARSON AND<br />
2CO-"11_CO 2 + C +<br />
SPENT CATALYST<br />
Figure 17-15. Solid electrolyte system schematic. (Weissbart et al., 1971)<br />
A comparison of a number of solid electrolyte reactors is presented in<br />
Table 17-8.<br />
Molten Carbonate Process. The molten carbonate process involves both<br />
chemical and electrochemical reactions. When C02 is introduced into a<br />
molten lithium carbonate electrolysis cell, first, Li2CO 3 is electrolyzed to<br />
Li20 , carbon, and 02. Lithium oxide then reacts with CO 2 to reform<br />
Li2CO 3. Carbon, from the first reaction, is deposited on the cathode, while<br />
the 02 to be collected is generated at the anode. Electrolysis of pure<br />
molten carbonate can be satisfactorily accomplished in a gravity field (Stein,<br />
1965); however, a satisfactory solution for phase separation of the gases<br />
from the molten salts in zero gravity has not been found. The high<br />
operating temperature also requires heat-resistant materials and accelerates<br />
corrosion of the equipment.
_ 0<br />
Atmosphere Control 829<br />
0<br />
N
830 Bioastronautics Data Book<br />
Water Electrolyfis<br />
An electrolysis unit is required in the oxygen recovery system to convert<br />
water generated in either the Sabatier or Bosch carbon dioxide reduction process<br />
to oxygen and hydrogen, so that oxygen can be returned to the atmosphere for<br />
breathing. With an electrolysis cell available, water can be used for making up<br />
oxygen lost through leakage or extravehicular operations, which simplifies the<br />
resupply process.<br />
Commercial electrolysis units have been used reliably for many years, but<br />
they cannot operate in zero-g. The phase separation problems of the space<br />
environment complicate the design and make more difficult the achievement of<br />
a reliable system. The design of a flight-type electrolysis unit for long duration<br />
usage has been one of the most difficult technological problems to solve. Yet it<br />
is a major "key" to both low-weight oxygen supply, ease of resupply, and<br />
recovery.<br />
The several most attractive concepts under development are discussed in this<br />
section.<br />
Static Feed Electrolysis Unit. This electrolysis cell uses a potassium<br />
hydroxide electrolyte (35 percent KOH in water) which is contained in an<br />
asbestos matrix held between electrodes. 02 and H2, generated at the anode and<br />
cathode, respectively, are collected in cell cavities and passed into integral gas<br />
manifolds. Water is fed to the water pocket behind the water transport matrix,<br />
which also contains a potassium hydroxide solution. Water is transported to the<br />
electrolyte matrix by diffusion of water vapor across the H 2 gas cavity to the<br />
more concentrated electrolyte solution. Zero-g capability of the electrolysis cell<br />
design is provided by containing the electrolyte and water feed in asbestos<br />
matrices. Capillary retention of the liquid at the matrix interfaces prevents<br />
mixing of the gases and liquids. In addition, the matrix prevents 02 and H 2 from<br />
mixing as they are produced.<br />
The unit operates at about 150°F and consists of a number of modules, a<br />
condenser-separator, current controllers (one for each module), back-pressure<br />
regulators, and necessary plumbing, wiring, and control devices. Major development<br />
problems encountered with the unit include difficulties in startup,<br />
shutdown, automatic electronic control, cell flooding with KOH in startup and<br />
shutdown, and cell drying. Data from a representative life test and performance<br />
tests of a static-feed water electrolysis system are given in Figures 17-16 and<br />
17-17, respectively.<br />
Circulating Electrolyte Electrolysis Unit. In this unit, the alkaline (potassium<br />
hydroxide) is circulated between the dual asbestos matrix of the cell and is<br />
cooled by a heat exchanger external to the cell. The electrolyte temperature is<br />
well regulated with the external heat exchanger and, consequently, so is the<br />
water vapor content of the 0 2 and H 2 gases generated in the cell. The<br />
circulation of the electrolyte helps to minimize concentration polarization and<br />
decrease the time required to reach steady-state operation after either starting up<br />
or adding makeup water to the electrolyte. The purposes for the asbestos matrix<br />
were previously described.
im<br />
tD<br />
<<br />
i7° - 100_<br />
w 50<br />
O<br />
I-<br />
Z<br />
w<br />
I1:<br />
U<br />
rt<br />
><br />
-I<br />
uJ<br />
2.5<br />
2.0<br />
1.5<br />
-I<br />
o<br />
> i'<br />
o<br />
MODULE DATA<br />
NO. OF CELLS 10<br />
CELL AREA 0.228 =q. ft.<br />
OPERATING CONDITIONS<br />
Atmosphere Control 831<br />
TEMPERATURE 175 ° F<br />
02 PRESSURE 30 PSIA<br />
02 TO H2hP -0.8 TO 1.5 PSI<br />
02 GENERATION RATE 0.15 LBS/HR AT 100 ASF<br />
ELECTROLYTE 25% KOH<br />
I I I I<br />
1000 2000 3000 4000<br />
10,014<br />
I I I I I<br />
5000 6000 7000 8000 9000 10,00o<br />
TIME (hr)<br />
Figure 17-16. Representative life test of a static-feed water electrolysis module.<br />
(Babinsky & O'Grady, 1970)<br />
A typical continuous flow electrolysis system uses 30percent KOH<br />
diluted in water, operates at near-ambient temperature and pressure, and has<br />
the following design features. The body and matrix screen and spacers are<br />
cast of epoxy resin. The dual matrix located on either side of the<br />
electrolyte pocket consists of an asbestos fuel cell sandwiched between a<br />
nickel matrix-support screen and a fuel cell electrode (type AB).<br />
Spot-welded to the electrodes are nickel electrode support screens and<br />
electrical leads. The electrical lead is nickel sheet cut in a picture frame<br />
configuration and spot-welded around the edge of an electrode. The<br />
modules are sealed by O-tings and fastened together by end plates and<br />
bolts. The electrodes from adjacent cells are supported by four intercell<br />
spacers. A liquid-level sensor in the electrolyte reservoir, located external to<br />
the cell, provides the signal for adding makeup water to the module when<br />
it is in operation. To prevent the electrolyte from passing through the<br />
matrix and into the gas manifolds, a differential pressure controller<br />
maintains the pressure in the gas marrifolds higher than the electrolyte<br />
pressure (AP : 3 psig).
832 Bioastronautics Data Book<br />
v<br />
<<br />
2.4<br />
2.2<br />
.J<br />
o<br />
> 2.0-<br />
J<br />
.J<br />
uJ<br />
U<br />
<<br />
I,U<br />
1.8--<br />
< 1.6t_,_-<br />
NOTE:<br />
MODULE DATA<br />
AFTER 2500 HR, 175°F --<br />
71 HR, 175°F--<br />
I I I I I<br />
50 100 150 200 250<br />
NO. OF CELLS 10<br />
CELL AREA 0°228 ft 2<br />
OPERATION CONDITIONS<br />
02 PRESSURE 30 psla<br />
ELECTROLYTE 250/0 KOH<br />
CURRENT DENSITY (amp/ft 2)<br />
Figure 17-17. Representative pedormance tests of static-feed water electrolysis module<br />
after 0.6, 81, 2500, 6671 hr of operation. (Schubert, 1969)<br />
Some of the more serious development problems encountered with the<br />
unit have included: (1) difficulty in maintaining differential pressure<br />
control; (2) a small increase in cell voltage required at startup to maintain a<br />
constant current; (3) slow deterioration in cell performance; and (4) some<br />
degradation of the epoxy resin plates. A continuous flow KOH electrolysis<br />
unit was tested in the NASA Langley Research Center/McDonnell Douglas<br />
90-day test. Figure 17-18 shows the 02 generation characteristics of the unit<br />
during the test (Jackson, 1971).<br />
Vapor Feed Electrolysis Unit. The vapor feed cell is unique among<br />
electrolysis cell concepts because it is designed to operate directly off<br />
humid cabin air. Therefore, the cell can assist the cabin air-conditioning<br />
system in controlling humidity. Furthermore, since the vapor cell uses<br />
expired and perspired water vapor for its water supply, it is not<br />
contaminated by dissolved solids normally present in undistilled, liquid<br />
water. The vapor cells have an acid rather than alkaline electrolyte and,<br />
thus, are not contaminated by expired CO2. The vapor cell utilizes a<br />
wicking material which holds the electrolyte, usually sulfuric acid, between<br />
the anode and cathode. The unit is made of a number of cells, each<br />
consisting of anode and cathode screens with a pad of microporous rubber,
Atmosphere Control 833<br />
or the like, acting as the wicking material. Electrolysis dehydrates the<br />
electrolyte and delivers H 2 at the cathode and 02 at the anode. New<br />
moisture then rehydrates the electrolyte, and the process is continued.<br />
Theoretically, 1520amp-hr are required for the electrolysis of water to<br />
produce one pound of 02. On a 24-hour operational basis, this corresponds<br />
to 63.3 amp/lb of 02 per day. The corresponding theoretical reversible<br />
voltage necessary to electrolyze liquid water at room temperature is 1.23 V,<br />
an unusually high operational voltage (Figure l7-19). As figure l7-19<br />
illustrates, the observed voltage, Ecell, between the connecting terminals of<br />
the electrolysis cell is the summation of Eo, the theoretical minimum<br />
reversible potential, and the polarization voltages. The following equation<br />
expresses this relationship.<br />
where,<br />
Eoot =<br />
Eta =<br />
Eac =<br />
E/R =<br />
20J<br />
Z<br />
o 15<br />
F-<br />
<<br />
rr<br />
LU<br />
(.9<br />
t_<br />
o 5<br />
r_<br />
\<br />
Ecell = E o + Eaa + Eca + Eac + Ecc + EIR<br />
Activation polarization at anode<br />
Activation polarization at cathode<br />
Polarization at the anode created by concentration<br />
(diffusion) gradient at the anode<br />
Polarization at the cathode created by concentration<br />
(diffusiorr) gradient at the cathode<br />
(Ohmic) polarization, tile voltage loss due to ohmic<br />
resistance of the electrolyte or electrolyte media, leads,<br />
and electrode metal.<br />
f0<br />
i i I<br />
*9.58 LB 0 2 REQUIRED<br />
PER DAY (AVERAGE)<br />
Af%^ .<br />
30 40 50 60 70 80<br />
TESTDAY<br />
Figure 17-18. Oxygen generation characteristics of a continuous flow KOH electrolysis<br />
unit operated in the NASA Langley Research Center/McDonnell Douglas 90-day test.<br />
(Jackson, 1971)<br />
9.58*<br />
9O
834 Bioastronautics Data Book<br />
"l 24 -- 1 /<br />
E; 20tS+O 1961o_ t *000871--__<br />
iii ioc i<br />
W 2o<br />
J<br />
0 q8 ....<br />
.-1<br />
.,J<br />
i11<br />
14 ........<br />
Revers,ble Celt Poten{,ol<br />
,_ - -- -"1- ---1-- -t--i-- .... {- -- - -i"- -'1-- l--r-- ---- 1----oF<br />
,0<br />
CURRENT DENSITY (i), amp/ft 2<br />
• E,m=0 285 v<br />
EeoC0 040 v<br />
,Eo(_ 089'_<br />
I i J<br />
Figure 17-19. Voltage characteristics for vapor electro, sis at 1074 hr<br />
(polarization voltage ahown at current density of 33 amp/ftcz_). (Clifford, 1967)<br />
Solid Polymer Electrolysis. Solid polymer electrolysis utilizes an<br />
ion-exdlange membrane (cation exchange membrane about 12 mils thick)<br />
which, when saturated with water, is the only electrolyte used. The system<br />
uses no free acid or alkaline liquids. Water is supplied to the 02 evolution<br />
electrode (anode) where it is electrochemically decomposed to provide<br />
oxygen, hydrogen ions, and electrons. The hydrogen ions move to the<br />
hydrogen-evolving electrode (cathode) by migrating through the solid<br />
polymer electrolyte (SPE). The electrons pass through the external circuit to<br />
reach the hydrogen electrode, where hydrogen ions and electrons recombine<br />
electrochemically to produce hydrogen gas. An excess of water is usually<br />
supplied to the system and recirculated to remove any waste heat. The<br />
gases are generated at a stoichiometric ratio of H 2 and 02 at any pressure<br />
required of the system. The SPE can withstand large differential pressures<br />
(>1000 psia) as well as high generating pressures which can easily be<br />
attained simply by back-pressuring the system.<br />
The ion-exchange membrane in a system under development is a<br />
perfluorinated sulfonic acid which meets the stability and performance<br />
requirements of a long-lived electrolysis system. The development of<br />
electrocatalysts, made of platinum-iridium or other noble metals, has<br />
reportedly (Nuttal & Fiteriugton, 1971) reduced cell voltage from values<br />
over 2.0 VDC at 200 amp/ft2 to less than 1.60 VDC at 200 amp/ft2 in an<br />
acid SPE electrolysis cell (figure 17-20), thereby reducing power
Atmosphere Control 835<br />
consumption. Figure I7-21 indicates the performance capability of a<br />
one-man SPE module developed for the NASA Langley Research Center<br />
with current density inputs up to 260 amp/ft 2, which were obtained prior<br />
to subjecting the unit to life testing.<br />
z<br />
0<br />
2.00<br />
E<br />
w 1 90<br />
g<br />
O 1 60<br />
b-<br />
1 5C<br />
_ -0<br />
I<br />
Pt 5 Ir at 120°F 1968<br />
I I 1 I 1<br />
25 S0 75 100 125 150 175 200<br />
CURRENT DENSITY (amps/IKt fl}<br />
Figure 17-20. Solid polymer electrolyte electrolysis performance at ambient pressure<br />
as a function of anode catalyst and temperature. (Nuttal & Fiterington, 1971)<br />
1.9 13.3<br />
1.8--<br />
El 1.7--<br />
.<<br />
t- 1.6--<br />
J<br />
0<br />
> 1.5--<br />
.J<br />
.J<br />
,,, 1.4--<br />
U<br />
LU<br />
1.3--<br />
<<br />
rr<br />
El 1.2--<br />
><br />
<<br />
1.1--<br />
1.0--<br />
5<br />
o<br />
1<br />
2O<br />
TEST COND ITIONS<br />
MODULE TEMPERATUREs85 ° F<br />
ANODE H20 FEEDs60 cc/min<br />
ZERO GAS DISCHARGE PRESSURE<br />
1 1 I i I i ! I I I i I i<br />
40 60 80 100 120 140 160 180 200 220 240 260 280 300<br />
CURRENT DENSITY (amps/sq ft)<br />
I I _ I t I '<br />
10 20 30 40 50 60<br />
CURRENT (amps)<br />
- 12.6<br />
-- 11.9<br />
El<br />
-11.2 <<br />
k-<br />
J<br />
--10.5 0<br />
><br />
"_ 9.8 U<br />
<<br />
I-<br />
9.1 u_<br />
J<br />
<<br />
8.4 I-<br />
0<br />
Figure 17-21. Performance data for a seven-cell module solid polymer electrolyte tested<br />
for the NASA Langley Research Center. (Nuttal & Fiterington, 1971)<br />
7.7<br />
7.0
836 Bioastronautics Data Book<br />
Trace Contaminants Removal<br />
Trace contaminant removal equipment maintains atmospheric contaminants<br />
at a physiologically acceptable level. Contaminants may be separated into the<br />
broad categories of particles and gases. Particles include solids such as dust and<br />
small liquid droplets. Those gases which have been identified as potential<br />
contaminants and those which have been detected in the Mercury and Gemini<br />
space vehicles, submarines, Apollo outgassing tests, and Earth-based space cabin<br />
simulator tests are rather extensive. Discussions of these gases and the measured<br />
generation rates are available in the literature (Olcott, 1970; see also Chapter 10,<br />
Toxicology). Table 17-9 shows the major trace contaminants identified in the<br />
NASA/McDonnell Douglas 90-day test (Jackson, 1971). Contaminant levels<br />
during the test were at all times below the allowable levels established by the<br />
National Academy of Sciences.<br />
Trace contaminant removal equipment includes particulate filters, activated<br />
charcoal, sorbent beds, and catalytic burners. Particulate filters may include not<br />
only a debris falter but also an absolute f'dter used in conjunction with charcoal<br />
or other sorbent beds. The debris filter traps coarse particles entering the<br />
atmosphere purification loop and the absolute filter removes particles as small as<br />
0.3 it.<br />
Trace Contaminant Removal by Solid Adsorbents<br />
Activated charcoal is used primarily to remove trace contaminant gases<br />
having high molecular weights, including many hydrocarbons, alcohols, ketones,<br />
aldehydes, mercaptans, organic acids, halogenated materials, and ozone.<br />
Figure 17-22 shows adsorption capability of activated charcoal for NO 2. Most of<br />
the odor-causing and toxic materials expected to accumulate in a space cabin are<br />
effectively adsorbed by charcoal. Activated charcoal, however, is a poor<br />
adsorbent of CO4, CO2, and CO. Water is adsorbed but not retained. Activated<br />
charcoal is sometimes impregnated with phosphoric acid for the removal of<br />
ammonia and basic (i.e., high pH) compounds.<br />
Other solid adsorbents, notably molecular sieves and silica gel, have been<br />
shown to adsorb most of the organic contaminants found in low<br />
concentrations in a space cabin simulator as well as those normally adsorbed<br />
by activated charcoal (Mader, 1969). However, they have a great affinity for<br />
CO2 and/or water and, thus, cannot be used effectively without prior<br />
removal of these compounds.<br />
Trace Contaminants Removal by Catalytic Oxidation<br />
Catalytic burners are used to oxidize various low molecular weight gases in<br />
the cabin atmosphere to CO2, water vapor, or other compounds. Catalytic<br />
burners are not necessary for short missions (of the Mercury, Gemini, and<br />
Apollo type) but they are likely to be included in life support systems for<br />
future, long-term missions in which contaminant level buildup could become a<br />
problem.
t'--<br />
I<br />
o<br />
Or)<br />
0<br />
eL<br />
Ct_<br />
o<br />
<<br />
> _<br />
o_z- E-<br />
o •<br />
0 _._<br />
_ _ 0<br />
Atmosphere Control 837<br />
X×X_XXXX X_XX<br />
• • • o<br />
e_<br />
z _<br />
o _ o o oN o _ o o o N _ N_IN N m N m m m N<br />
< _<br />
o<br />
o<br />
o<br />
o<br />
_ _ 0<br />
_ _r_ __ _ 0<br />
_,_N.n_. u _u_O - _ o _-_ _ o._, Z_ o _'/^<br />
2<br />
O}<br />
o<br />
o
838 Bioastronautics Data Book<br />
v<br />
40<br />
35<br />
3O<br />
25<br />
o_ 2o<br />
Z<br />
lO<br />
20 40 60<br />
. f<br />
80 I00 120<br />
Time (hr)<br />
_<br />
Flow Rate = 4.7 mole/hr<br />
• Run No. 2-21-I<br />
• Run No. 3-I]-3<br />
• Run No. 2- 7-I<br />
' _ '<br />
140 160 1 0 200 220<br />
Figure 17-22. Breakthrough curves for NO2 adsorbed on activated carbon.<br />
(Gully et al., 1969)<br />
A typical catalytic burner includes a catalytic bed, electrical heaters, and<br />
a regenerative heat exchanger, all contained within an insulated jacket. The<br />
pre- and post-sorbent bed filters are connected to the catalytic burner with<br />
tubing, and the filter canisters and catalytic burner are assembled on a<br />
lightweight structural frame. A number of catalysts have been used in<br />
catalytic burners, including 0.5 to 1.0percent palladium or platinum<br />
deposited on alumina, Hopcalite, and other proprietary materials. Hopcalite,<br />
a mixture of the oxides of manganese, copper, cobalt, and silver, has been<br />
used for many years as a catalyst for removal of CO in air. Pre- and<br />
post_sorbent beds are used to prevent catalyst poisoning and to remove<br />
undesirable oxidation products. These beds utilized acid-impregnated<br />
activated charcoal, Linde-type 13 zeolite, and lithium hydroxide sorbents. Of<br />
these, LiOH is the most desirable. During use, the presorbent LiOH is<br />
partially converted to LiCO3 as it absorbs CO2. The combination of LiOH<br />
and LiCO3 presorbent effectively removes such compounds as SO2, H2S,<br />
HCI, and HF. As a postsorbent, LiOH-LiCO3 removes such acid gases as<br />
HCI and HF resulting from the catalytic oxidation processes.<br />
Figure 17-23 shows the concentration of CH 4 and CO 2 during a 90-day<br />
test referred to previously. The catalytic burner was purposely turned off<br />
between test days 68 to 82. After test day 68, the CO level had increased<br />
from about 16ppm to 26 ppm. When the catalytic burner was reactivated,<br />
the level was gradually reduced to 17 ppm by the end of the test.
i0<br />
20i '<br />
0...... I0<br />
I<br />
L<br />
, I<br />
Atmosphere Control 839<br />
llll<br />
2O 3O 40 5O<br />
TESTDAY<br />
I<br />
I<br />
- ./_ METHANE<br />
TOXINBURNER<br />
"--CARBONM(_NOXIDE iFF<br />
300<br />
,,',4<br />
........... I....... 1............<br />
6O 70 80 gO<br />
Figure 17-23. Methane and CO concentration during the NASA Langley Research<br />
Center/McDonnell Douglas 90-day test showing effects of toxin burner operation.<br />
(Jackson, 1971)<br />
Humidity Control<br />
Humidity control in spacecraft may be achieved by one of two methods:<br />
(1) condensation of atmospheric water vapor, followed by phase separation<br />
of condensate from the air, or (2)drying of cabin air by passage through a<br />
bed of granular material. The moisture in this case is either absorbed<br />
chemically, by, for example, sodium hydroxide, or adsorbed physically by<br />
silica gel or molecular sieves. However, because of the high penalty<br />
associated with drying air over granular material, this method is used only<br />
in low flow, essential applications, such as drying air prior to CO2<br />
adsorption on molecular sieves.<br />
Humidity control by condensation/water separation is now universally<br />
used in spacecraft. In this method, a heat exchanger cools the cabin air<br />
below its dew point, thus condensing water from the moist airstream. Most<br />
of the water droplets are then separated from the main airstream in a water<br />
separator and channeled to the water management equipment. The air, now<br />
reaching the saturation state, is returned to the cabin or routed to another<br />
subsystem for further processing. Airflow through the condenser is a<br />
function of (1)the inlet and outlet water concentrations in the process<br />
airstream; (2)the cabin pressure; and (3) the water'separator efficiency.<br />
Figure 17-24 is a graphic presentation of the flow requirement and heat<br />
load for a humidity control condenser utilized to collect 2.2 lb/man_tay of<br />
water and operating with a 35°F process airflow. Figure 17-24 also shows a<br />
sharp rise in flow requirement and cooling load at low cabin relative<br />
humidity with a flattening characteristic at about 60percent relative<br />
humidity. This points to the desirability of maintaining high cabin humidity.<br />
It also indicates the savings ensuing from low condenser outlet temperatures.<br />
The latter is, however, more difficult to satisfy than the former. Heat sink<br />
IOO<br />
F--
840 Bioastronauties Data Book<br />
temperatures lower than about 40° to 45°F normally impose very high<br />
weight penalties on space vehicle liquid cooling loops. These penalties result<br />
from the large radiator areas required to cool the heat _ransport fluid to<br />
the temperature level desired for operation of the humidity control system.<br />
>-<br />
< 4000<br />
q<br />
Z 3000<br />
<<br />
13<br />
2000<br />
1000<br />
800<br />
60o<br />
_" 500<br />
0<br />
.J<br />
LL<br />
_ ao0<br />
<<br />
U]<br />
uJ<br />
U<br />
o<br />
no..<br />
200<br />
10o<br />
(*) NOTES:<br />
30 40 50 60 70<br />
CABIN RELATIVE HUMIDITY (%)<br />
1. Condenser temperature = 35 OF<br />
2. _sep = Water Separator efficiency;<br />
3. Wg=Proces$ air flow, Lb. man-day.<br />
30000<br />
20000<br />
10000<br />
8000<br />
6000<br />
5000<br />
4000<br />
300O<br />
2000<br />
1000<br />
Figure 17-24. Flow requirement and heat load for humidity control.<br />
(Rousseau, 1963)<br />
Water separation may be accomplished in a number of ways. These<br />
indude wick condenser/separators, hydrophobic-hydrophilic types and<br />
centrifugal, porous plate, elbow, and vortex separators. Of these, the<br />
hydrophobic-hydrophilic and the wick condenser separators are considered<br />
superior.<br />
)-<br />
<<br />
o<br />
z<br />
<<br />
d<br />
6<br />
<<br />
o<br />
_J<br />
l-<br />
I
Hydrophobic-Hydrophilic Separator<br />
Atmosphere Control 841<br />
The hydrophobic-hydrophilic separator unit is based on two capillary<br />
concepts, the hydrophobic (non-wetting) and hydrophilic (wetting) liquid/gas<br />
separation phenomena. The moist gas stream contacts a conical-shaped screen,<br />
with the apex of the cone facing the gas stream. The screen cone is coated with a<br />
hydrophobic materinl. The free water droplets are deflected to the base of the<br />
cone while the gas flows through the screen. A hydrophilic sump is provided at<br />
the base of the cone around its circumference. A pressure differential maintained<br />
across the sump by a pressure-controlled pumping system transfers the water to<br />
storage tanks. A hydrophobic-hydrophilic water separator was tested in a 60-day<br />
chamber study where it operated for the full 60 days with free water separation<br />
of 99 percent or better (Lamparter, 1970).<br />
Wick.Type Condenser/Separator<br />
In wick-type condenser/separators, wicking material is located in the unit<br />
between layers of heat exchanger surfaces. Moisture condenses on the fins and<br />
coolant passage surfaces of the heat exchanger. The condensed water is<br />
transferred along the fins by surface tension forces to the wick material. The<br />
flow of water within the wick occurs by a combination of capillary action and<br />
pressure gradient. If the pressure gradient is kept below a certain value, there is<br />
no air leakage through the wick. If the pressure gradient is not large enough (i.e.,<br />
either the pressure source is too weak or the wick material is not dense enough),<br />
a cellular material may be installed at the wick-drain interface. The wick material<br />
acts in a manner similar to the hydrophilic screen. This type of water separator<br />
was used in Gemini and Apollo spacecraft.<br />
Table 17-10 presents an excellent compilation of data on the important<br />
characteristics of existing water separators including those already flight-tested<br />
in the Gemini and Apollo programs.<br />
Storage Systems for Atmospheric Constituents<br />
Three methods for storing atmosphere gases in the gaseous<br />
considered for spacecraft applications:<br />
1. High-pressure storage at ambient temperature<br />
2. Supercritical storage at cryogenic temperature<br />
3. Subcritical storage at cryogenic temperature<br />
phase are<br />
High-pressure gaseous storage is usually heavier than cryogenic storage<br />
because of the heavy vessels dictated by the high storage pressure (about<br />
6000psi). The primary advantages of high-pressure storage are that the<br />
equipment is relatively simple and the gas is readily available for the<br />
requirements of rapid repressurization and emergency operation.<br />
Storage of atmospheric constituents at cryogenic temperatures generally<br />
entails lower tankage weight. This reduction in weight is attributed mainly to<br />
two eCects: (1)smaller volumes because the gas is stored as a fluid, and<br />
487-858 0 - 73 - 54
842 Bioastronautics Data Book<br />
[-<br />
I<br />
s<br />
e_<br />
£ tD<br />
¢-<br />
2_<br />
"1"<br />
t-<br />
t-<br />
c .J<br />
0<br />
E<br />
-1-<br />
1<br />
1<br />
0..<br />
UJ<br />
I-<br />
X s,.<br />
0<br />
0<br />
c<br />
._o<br />
-i<br />
2<br />
g<br />
C<br />
.2<br />
CO<br />
gO<br />
.J<br />
_o<br />
U.<br />
, _ _<br />
-_ . _ .__<br />
_._." __<br />
*-- "0<br />
< _ E m -1-<br />
+<br />
o<br />
E<br />
_t<br />
X<br />
c_<br />
E E_ ,"<br />
8 g_ =-<br />
._: _ -x<br />
_ c n<br />
_.__ _'<br />
- _<br />
A<br />
,-- m<br />
og -o_<br />
,7 _ -<br />
Q_<br />
E<br />
v,.<br />
0<br />
U_<br />
x<br />
d<br />
_o<br />
_o<br />
co_<br />
x._<br />
t_ e_<br />
h<br />
g<br />
w.- _ E<br />
x<br />
o<br />
t_<br />
e-,<br />
.E
L_ v_<br />
J<br />
I<br />
m<br />
O<br />
c .J<br />
.g<br />
I<br />
t-<br />
O<br />
__<<br />
J_ ,_<br />
12<br />
¢¢<br />
" --I<br />
0<br />
I<br />
E<br />
3_<br />
¢-<br />
.lg<br />
c<br />
LLI<br />
¢.J<br />
n<br />
,5g_<br />
_-_ ._<br />
"_ u<br />
6_<br />
"rx _I o<br />
E<br />
o<br />
Atmosphere Control 843<br />
._- -E _ A<br />
t.q --<br />
¢q<br />
O<br />
_o o. 8<br />
0" 0 _-_ .._<br />
es _ O<br />
_ ._ . _<br />
©.__ mO_ _ _ - . _<br />
i<br />
Z"<br />
o_} ° o<<br />
r- "o 8<br />
0<br />
_._ _ _<br />
_o<br />
e- O<br />
E<br />
,E
844 Bioastronautics Data Book<br />
(2) lower working pressures which permit thinner pressure vessel walls. On the<br />
other hand, cryogenic systems have the relative disadvantages of more complex<br />
control systems, more sophisticated hardware, loss by boiloff, greater electrical<br />
power requirements, lower reliability and higher maintenance requirements.<br />
References<br />
Adlhart, O. J., & Hartner, A. J. Experimental evaluation of precious metal carbon dioxide<br />
catalysts. Report No. AFFDL-TR-67-80, Engelhard Industries, Inc., Newark, New<br />
Jersey, May 1967.<br />
Armstrong, R. C. Life support systems for space flight of extended time periods.<br />
NASA-CR-614, National Aeronautics and Space Administration, Washington, D.C.,<br />
November 1966.<br />
Babinsky, A. D., & O'Grady, T. P. Aircrew oxygen system development: Water electrolysis<br />
subsystem report. NASA-CR-73394, National Aeronautics and Space Administration,<br />
Washington, D.C., May 1970.<br />
Clark, L. G. Carbon dioxide reduction unit operation with Bosch reaction. Langley Working<br />
Paper No. LWP-387, Langley Research Center, Hampton, Virginia, 31 March 1967.<br />
Clifford, J. E. Water vapor electrolysis cell with phosphoric acid electrolyte. SAE Paper<br />
No. 670851, presented to Society of Automotive Engineers Aeronautic and Space<br />
Engineering Manufacturing Meeting, Los Angeles, California, 2 October 1967.<br />
Coe, C. S., Roseaux, J., & Shaffer, A. Analytical methods for space vehicle atmospheric<br />
control processes. Report No. ASD-TR-61-162, AiResearch Manufacturing Division, Los<br />
Angeles, California, November 1962.<br />
Gully, A. J., Bctha, R. M., Graham, R. R., & Meader, M. C. Removal of acid gases and<br />
oxides of nitrogen from spacecabin atmospheres. NASA-CR-1388. National Aeronautics<br />
and Space Administration, Washington, D.C., July 1969.<br />
tleubecher, R. G., & Babinsky, A. D. Aircrcw oxygen system development - carbon dioxide<br />
concentrator subsystem. NASA-CR-73397, National Aeronautics and Space Administration,<br />
Washington, D. C., 1970.<br />
Houck, O. K., Wilson, C. H., Clark, L. G., & Hypes, W. D. Recent development and tests of<br />
integrated systems hardware. ASME Paper No. 70-Av/SpT-13, American Society of<br />
Mechanical Engineers, New York, 21 June 1970.<br />
Jackson, J. K. Test results, operational ninety-day manned test of a regenerative life support<br />
system. NASA-CR-111881, National Aeronautics and Space Administration, Washington,<br />
D. C., May 1971.<br />
Jackson, J. K., & Blakely, R. L. Application of adsorption beds to spacecraft life support<br />
systems. SAE Paper No. NR-670-842, presented to Society of Automotive Engineers<br />
Aeronautic and Space Engineering Manfacturing Meeting, Los Angeles, California,<br />
2 October 1967.<br />
Lamparter, R. A. Development of zero gravity hydrophohic/hydrophilic bubble separators.<br />
NASA-CR-66922, National Aeronautics and Space Administration, Washington, D.C.,<br />
May 1970.<br />
Mader, P. P. Evaluation of desorbates from a regenerative carbon dioxide removal system<br />
used in a sixty-day manned test. NASA-CR-106214, National Aeronautics and Space<br />
Administration, Wa&ington, D.C., October 1969.<br />
Martin, IL B., & Brose, H. F. An amine polymer carbon dioxide concentrator for the<br />
ninety-day LRC/MDAC manned chamber test. Presented at the American Society of<br />
Mechanical Engineers Space Technology and Heat Transfer Conference, Los Angeles,<br />
California, 21 June 1970.
Atmosphere Control 845<br />
Nuttal, L. J., & Fiterington, W. A. Status of the General Electric solid polymer electrolyte<br />
water electrolysis system. ASME Paper No. 71-Av-9, presented at the American Society<br />
of Mechanical Engineers Conference on Environmental Control/Life Support, San<br />
Francisco, California, 12 July 1971.<br />
Olcott, T. O. Study and preliminary design of an isotope-heated catalytic oxidizer system.<br />
NASA-CR-66346, National Aer,mautics and Space Administration, Washington, D.C.,<br />
1970.<br />
Remus, G. A., et al. Catalytic reduction of carbon dioxide to methane and water. Report<br />
No. FDL-TR-65.12, Wright-Patterson AFB, Ohio, April 1965.<br />
Rousseau, J. Atmospheric control systems for space vehicles. Report No. ASD-TDR-62-527,<br />
AiRe_arch Manufacturing Division, Los Angeles, California, March 1963.<br />
Schubert, F. H. Long term operation of a water electrolysis module. SAE Paper<br />
No. 690643, Society of Automotive Engineers, New York, October 1969.<br />
Smith, R. W. Zero-G water separator selection: A performance trade-off. Report<br />
No. MDC-69-018, McDonnell Douglas Astronautics Company, Eastern Division,<br />
St. Louis, Missouri, October 1969.<br />
Stein, P. J. Research and development program for a combined carbon dioxide removal and<br />
reduction system. Contract No. NAS1-4154, National Aeronautics and Space<br />
Administration, Washington, D.C., October 1965.<br />
Tepper, F., Vancheri, F., Samuel, W., Udavacak, R. Development of a regenerable carbon<br />
dioxide removal system. NASA-CR-66571, National Aeronautics and Space Administration,<br />
Washington, D.C., January 1968.<br />
Thompson, g. B., Jr. Investigation of catalytic reactions for carbon dioxide reduction.<br />
Report No. FDL-TDR-64-22, Wright-Patterson AFB, Ohio, 1964-1967.<br />
Yakut, M. M., & Barker, R. S. Parametric study of life support systems. NASA-CR-73283,<br />
National Aeronautics and Space Administration, Washington, D.C., January 1969.<br />
Weissbart, J., & Smart, W. H. Development of a carbon dioxide-water solid electrolyte<br />
electrolysis system. Contract No. NAS2-4843, National Aeronautics and Space Administration,<br />
Washington, D.C., May 1970.<br />
Wynveen, R., & Quatrone, P. Electrochemical carbon dioxide concentrating system. Paper<br />
presented at the American Society of Mechanical Engineers Conference on Environmental<br />
Control/Life Support, San Francisco, California, 12 July 1971.
CHAPTER 18<br />
_WORK, HEAT, AND OXYGEN COST<br />
by<br />
Paul Webb, M.D.<br />
Webb Associates, Inc.<br />
Yellow Springs, Ohio<br />
Human energy exchange is discussed in this chapter in terms of the whole<br />
man. The physical work a man does, the heat he produces, and the quantity of<br />
oxygen he takes from the air to combine with food, the fuel source of his<br />
energy, are described. Work, heat, and oxygen all are closely tied together in<br />
animal energetics, as Kleiber (1961) has written in a historically interesting<br />
review, The Fire of Life. At the cellular level, not dealt with here, Lehninger's<br />
Bioenergetics (1965) is an excellent and readable introduction to the<br />
biochemistry involved.<br />
The human animal, like most machines which do work, oxidizes fuel to<br />
obtain energy. But unlike man-made engines that convert the heat of<br />
combustion into work, the body oxidizes fuel at a low temperature, 37°C, and<br />
converts chemical energy directly into work. In other words, humans are<br />
chemical engines.<br />
The work man does is not impressive. A man cannot generate a lot of power.<br />
Humans fancy themselves as thinkers and manipulators of tools. Machines do the<br />
heavy work. Nevertheless, man is a muscular animal, with some 40 percent of his<br />
weight in skeletal muscles. He moves about under his own muscle power, and<br />
does some mechanical (external) work in certain activities.<br />
Whether performing mechanical work or not, just staying alive requires<br />
energy. Cells do chemical work in biosynthesis; there is work involved in active<br />
transport of solutes across cell membranes; and there is osmotic work in<br />
concentrating solutes. Some cells, especially muscle, do mechanical work, much<br />
of which is internal and only visible from outside as heat. For example, the work<br />
done by heart muscle in pumping blood against the resistance of the vascular<br />
distribution network, and the work done by skeletal muscle in supporting<br />
ourselves upright in Earth's gravity field, are all internal.<br />
Reviewed by John B. West, Ph.D., University of California, San Diego.<br />
847
848 Bioastronautics DataBook<br />
Thereis continual energyexchange in livinganddoingthings.Quantifying<br />
energyexchange is importantin designing life supportequipment sinceit<br />
determines food supplies, the oxygento be carried,wasteproductsto be<br />
removed, andtheheatobedissipated. Thedesignofrespiratory equipment and<br />
oxygensuppliesmustallowthemanto dotheheaviest workamissionmay<br />
require, andthecoolingof protectiveclothing,e.g.aspacesuit,mustcarryoff<br />
thegreatest amount of heat he can generate.<br />
Heat is the dominant expression of human energy exchange. Heat is<br />
generated within the body while one sleeps and during all waking hours. The<br />
more active one is, the more heat there is to be dissipated. When a task is carried<br />
out in which mechanical work is done, 10to 30 percent of the energy<br />
expenditure is applied to the external load; the rest comes out as heat.<br />
The rate of energy exchange varies over a wide range. A man asleep may<br />
operate at a level as low as 1.1 kcal/min (77 watts, or 262 BTU/hr). When doing<br />
sustained hard work he may operate at 15kcal/min (1046watts, or<br />
3571 BTU/hr).<br />
Units for the description of energy exchange are varied. Physiologists think<br />
in terms of kilogram calories (kcal); the calories used in nutrition are kcals, and<br />
body heat production is generally expressed as kcal/min. In international<br />
convention the basic energy unit is the joule, or its rate derivative, the watt (W),<br />
which is 1 joule/see. Older units which have been in common use are the met<br />
(1 met = 50 kcal per square meter of body surface an hour), and the BTU, or<br />
BTU/hr.<br />
1 kcal = 4184 joules = 1.162 watt-hours = 3.968 BTU<br />
1 kcai/min = 69.7 watts = 238 BTU/hr<br />
100 watts = 1.43 kcal/min = 341 BTU/hr<br />
100 BTU/hr = 0.42 kcal/min = 29.3 watts<br />
In this chapter the energy unit will be the kcal, with rates expressed in both<br />
kcal/min and watts.<br />
It has been noted that living involves heat production as a major by-product<br />
of the oxidation of fuel to supply energy for "work." The work of staying alive<br />
is hard to measure since it takes place in a closed and hidden system-the<br />
body-but the total heat produced by all the separate activities is known and<br />
measurable. It is possible to estimate the internal work done individually by the<br />
heart, the kidneys, the brain, and other organs and tissues. Data of this kind<br />
based on measuring blood flow and oxygen use appear in table 18-1.<br />
Some organs, particularly the brain, oxidize fuel at a high and steady rate<br />
throughout the 24 hours; the liver is typical of organs which oxidize fuel at<br />
slowly changing levels depending on the work required; some tissues oxidize at a<br />
slow pace, like the skin. Skeletal muscle changes its level of fuel consumption<br />
and heat production manyfold between quiescent and active states. Since<br />
skeletal muscle is 40 percent of the body mass, this change in muscle heat<br />
production is the dominant factor when total heat production varies over a<br />
10:1 range.
Work,Heat, and Oxygen Cost<br />
Table 18-1<br />
Oxygen Consumption and Heat Production of Organs in _lan<br />
Organ OxygenConsumption Typical OrganWeight Heat Production<br />
(ml/min -- 100 gin) (gm) (kcal/min)<br />
Heart 9.5 (7.8 - 10.5) 320 0.15<br />
Brain 3.6 (3.3 -- 3.9) 1380 0.25<br />
Kidneys 10.2 (6.2 -- 16.0) 300 0.15<br />
Muscle<br />
Rest 0.17 28 000 0.24<br />
Exercise 11.2 28 000 15.7<br />
(Basedon averageddatafrom Altman& Dittmer, 1968)<br />
Measuring total body heat production is called direct calorimetry. The<br />
technique is complex and the machinery for doing it has always in the past<br />
confined and restrained the subject unnaturally. A new and less constraining<br />
method is evolving from research done with water cooled garments, about which<br />
more will be said later. But our body of knowledge about human work and<br />
energy exchange rests on a small number of direct calorimetric measurements,<br />
and a very large number of indirect calorimetric measurements.<br />
Indirect calorimetry measures energy exchange by seeing how much oxygen<br />
a man uses to burn fuel, and how much carbon dioxide, water, and nitrogen he<br />
excretes as the chemical residues of oxidation. By measuring these material<br />
exchanges in the respired air, and nitrogen in urine, one may estimate with<br />
reasonable accuracy the amount and type of fuel burned, hence the total energy<br />
being released.<br />
Given the three measured quantities of O2 consumed, CO 2 produced, and<br />
urinary N excreted, Consolazio et al. (1963) show that the three types of fuel,<br />
carbohydrate (CHO), fat (F), and protein (Pro), and the energy (H) released in<br />
their oxidation are directly calculable from:<br />
CHO = 2.909 02 + 4.115 CO 2 - 2.539 N<br />
F = 1.689 02 - 1.689 CO 2 - 1.943 N<br />
Pro = 6.25 N<br />
H = 3.78 02 + 1.16 CO 2 - 2.98 N<br />
It is also feasible to do an energy exchange analysis by counting fuel calories.<br />
One can measure food intake, and any residues in urine and feces which are not<br />
oxidized, and know a man's daily energy exchange. But the measurement does<br />
not discriminate in usefully short time intervals since a man eats only about<br />
three times a day, and he stores his fuel rather than burning it as consumed.<br />
849
850 Bioastronautics DataBook<br />
Thus a 24-hour period is the shortest time we use for this type of data (see<br />
figure 18-4). To further complicate matters, a man can store great quantities of<br />
fuel as fat, and can live and work for days without eating at all. Body weight<br />
reflects storage and expenditure of stores, but it reflects other things as well,<br />
such as dehydration, growth, and atrophy.<br />
The energetic equivalents of oxygen consumed and of carbon dioxide<br />
excreted are standard numbers in physiology. Every liter of oxygen consumed<br />
indicates that 5 kcal of energy has been released from stored fuel. The same<br />
5 kcal is the caloric equivalent of 1 liter of CO 2 produced. These caloric<br />
equivalents were first described in experiments in a direct calorimeter while 0 2<br />
and CO 2 exchange were also monitored. There are small variations of the caloric<br />
equivalents of 02 and CO 2 which reflect variations in the type of foodstuff being<br />
used. The range is from 4.7 to 5.0 kcal, but for most purposes 5 kcal is<br />
sufficiently accurate (Maxfield & Smith, 1967; Weir, 1949).<br />
One way to visualize these basic work and energy relationships is shown in<br />
figure 18-1.<br />
H H _:),<br />
20 - 1400 _ 4 0 !<br />
12e_ 4-<br />
_5 - 30.-<br />
100_ 4-<br />
80_ -I-<br />
10 - -- 20-=<br />
5-<br />
4<br />
600 --<br />
400--<br />
3 20U i<br />
2<br />
, ]<br />
i<br />
;0-<br />
04-<br />
O24<br />
w W W<br />
wJ:ts kg m/_. _T qt_ m_.<br />
280 _ 17oo -<br />
260 + -<br />
2:'0 _-<br />
1500- -<br />
OXYGEN _<br />
HEAT WORK AT 20%<br />
P R ODUC TH:_N CONSUMPTION<br />
EFFICIENCY<br />
I;' e0e<br />
! 1000 •<br />
10003,<br />
9000_<br />
mo_ _ _ 8oooq<br />
loo0- -<br />
• ?ooo-I<br />
6o0o-_<br />
_ k _ooo4<br />
"SOME ERGC_ME TEflS A,_E CALIBfl_,TEO I_ AND SGAI_DI_AWA,_ LITERATURE<br />
Figure 18-1. Rehtionship of heat production (H) to 0 2 consumption (_ro2), and of these<br />
to mechanical or external work (W), when amanpeffonms at 20%efficiency, tt and Ware<br />
shown in _'iom common _mRs.<br />
toe<br />
80.<br />
4o -<br />
20-<br />
5L_<br />
44)0<br />
3OO<br />
2O0<br />
IO0-<br />
3000 4<br />
_COe÷<br />
1000 if"<br />
I
Work, Heat, and Oxygen Cost 851<br />
Daily Energy Exchange<br />
Consider now the energetics of just staying alive, with no physical activity at<br />
all. This is, to use an old and imprecise term, the basal metabolism, or better, the<br />
cost of tissue maintenance. Figure 18-2 shows the oxygen cost and heat<br />
production for tissue maintenance. The ranges shown for periods of 4, 8, and<br />
24 hours show how size and biochemical individuality affect such data. The<br />
three diagonal lines on the graph show how particular dietary mixtures would<br />
alter the values.<br />
5O0 I ' I _ ' I ' _ _'-_.<br />
_ 400300 _24 hours<br />
Z FAT DIET<br />
MIXED DIET<br />
8<br />
Ot._" I<br />
CARBOHYDRATE DIET<br />
0 200 600 1000 1400 1800 2200<br />
HEAT OUTPUT (kcal)<br />
Figure 18-2. 0 2 cost and heat production of tissue maintenance, calculated for men of<br />
astronaut size and age under basal conditions. (Redrawn from Fletcher, 1964; based on<br />
standard values from Diem, 1962)<br />
The total daily energy level is the cost of tissue maintenance plus the cost of<br />
activities. Assuming standard activity, the smaller the person the smaller his daily<br />
oxygen need, his food requirement, and his heat production. This is shown in<br />
the figure 18-3, which gives total daily energy levels for normally active people<br />
of various sizes. These daily levels are about twice as high as the daily cost of<br />
tissue maintenance. Note that the values for men of astrOnaut size and age,<br />
(3400 to 3800 keal/day), imply considerable daily activity, whereas astronauts<br />
confined to simulated space cabin conditions (see figure 18-4) or in actual<br />
orbital flight (see table 18-2) show much lower values.<br />
To illustrate the range of activity, hence the range of energy exchange (i.e.,<br />
food consumed and heat plus external work output), which adult men exhibit,<br />
figure 18-4 shows that a day of "complete rest" involves the use of about<br />
1500 kcal in 24 hours, while a "very active day" calls for about 6500 kcal in<br />
24 hours. The four dassifications of work, from light through very heavy,
852 Bioastronautics Data Book<br />
represent values used in industry for 8hours a day, year round<br />
employment. These figures come from a study by Edholm and Fletcher<br />
(1955) of British Army recruits during a very active period of training.<br />
Between these two extremes are similar data for many other military and<br />
civilian activities. Notice that some of the data are based on counting the<br />
calories in the food eaten, and the rest based on estimates of energy<br />
exchange from oxygen consumption.<br />
1 I00,<br />
_- 900<br />
i<br />
z 700<br />
o<br />
8<br />
500<br />
x> 3oo<br />
0<br />
d<br />
100<br />
FAT DIET ....<br />
MIXED DIET ..... -_<br />
-- 25 YRS<br />
145 LBS<br />
WOMAN<br />
25 YRS<br />
-- 120 EBS<br />
CHILD<br />
1 3 YRS<br />
CARBO.YO__ i<br />
OF AST PON AU I"<br />
MAN SiZE AND AGE<br />
500 1000 1500 2000 2500 3000 3500 4000 4500 5000<br />
DAILY HEAT OUTPUT (kcal)<br />
Figure 18-3. Total daily 02 cost and heat production for normally active people, as<br />
affected by body size, calculated by method proposed by UN Food and Agricultural<br />
Organization (1957). (Redrawn from Fletcher, 1964)<br />
One quite low level of daily energy exchange in figure 184 is that<br />
labeled "Space Cabin Simulator" (Welch et al., 1961). The low rate was<br />
largely due to the confinement of the subjects. Flight data shown in<br />
table 18-2, from the American Gemini and the Russian Vostok orbital space<br />
flights (Berry & Catterson, 1967), confirm the low estimates from the<br />
simulator. In flight, weightlessness and confinement together can explain the<br />
low metabolic rates.<br />
In each of the three preceding figures there were three straight lines<br />
showing energy levels versus oxygen cost for three different types of diet.<br />
The oxygen used, and the carbon dioxide produced, vary slightly with the<br />
fuel oxidized. These dietary effects are relatively small, and it is an unusual<br />
diet which is purely one of the three types of food. The mixed diet is<br />
common in North America, and for most purposes we do not try to adjust<br />
energy estimates for a particular person's diet. There are more important<br />
sources of variation, particularly the specific activities one undertakes during<br />
the day.
1600<br />
1400<br />
A<br />
_> 1200<br />
-o<br />
0=<br />
oa<br />
z 1000<br />
0<br />
S<br />
800<br />
_ 600<br />
x<br />
0 400<br />
2O0<br />
Work, Heat, and Oxygen Cost 853<br />
f<br />
_ / \ /,<br />
I L_" _;;.Zsx" _ 'a_" f.t .........<br />
_ ] /fi',[. _*_. ...... ..:.._%%_<br />
0 100O 2000 3000 4000 5000 6000 7000<br />
ENERGY EXCHANGE - (kcal/day}<br />
Figure 18-4. 02 cost and energy exchange levels for daily activities. Values identified<br />
below three dietary lines are based on measurements of 02 consumption; those above are<br />
based on careful measurements of daily food consumption and weight change, if any.<br />
(Redrawn from Fletcher, 1964; based on data from Buskirk et al., 1956, Buskirk et al.,<br />
1957; Consolazio et al., 1956; Edholm & Fletcher, 1955; Fletcher, 1958; Iampietro et al.,<br />
1956; Kark et al., 1948; Karvonen & Turpeinen, 1954; Lawton, 1960; Luthman &<br />
Lundgren, 1947; Ramzin, 194,8; Richardson & Campbell, 1927; Rjabko & Agapov, 194,7;<br />
Welch et al., 1961)<br />
Table 18-2<br />
Energy Exchange Levels in Space Flight<br />
Duration Daily Energy Level *<br />
Flight (days) (kcal/24 hr)<br />
Gemini 4 4 2410<br />
5 8 2010<br />
7 14 2219<br />
Vostok 3 2400<br />
4 2100<br />
5 2100<br />
*Based on analysis of LiOH canisters for carbon<br />
dioxide.<br />
(Data from Berry & Catterson, 1967)
854 Bioastronautics Data Book<br />
Work and Heat Dissipation<br />
When a man begins muscular work, there is an immediate increase in energy<br />
release from the high energy phosphate bonds of adenosine triphosphate, and the<br />
breakdown of energy-rich phosphocreatine, followed by renewal from carbo-<br />
hydrate (glucose and glycogen) fuel stores. Some of the muscle energy may be<br />
applied to an external load, while the rest is expended in internal work, hence<br />
appearing only as heat. When a man walks or runs on a level surface, all the<br />
increased energy used appears as heat, that is, all the work is internal. This extra<br />
heat is stored, causing a rise in the temperature of the muscle, then is carried off by<br />
conduction to the skin and by convective cooling via the increased flow of blood<br />
through the muscle. As the work continues, the body begins to dissipate more heat<br />
to prevent an uncontrolled rise in general body temperature. This change in the rate<br />
of heat dissipation can be measured in a calorimeter, as illustrated in figure 18-5.<br />
Total heat loss, indicated in the figure, is the sum of respiratory heat loss, convec-<br />
tive heat loss and radiative heat loss from the body surface, and evaporative heat<br />
loss from sweating.<br />
E<br />
-20 - 10 0 10 20 30 40 SO 60 70<br />
Figure 18-5. Example of direct calorimetric measurement with subject doing mild work.<br />
Up to time O, the subject was resting in the supine position on a net hammock in the<br />
calorimeter box; starting at time O, he worked with a crank ergometer, still lying down,<br />
against an external load of .36 kcal/min, or about 25 watts. (Redrawn from Benzinger &<br />
Kitzinger, 1963)<br />
It is the skeletal muscles that produce the extra heat during increased physical<br />
activity. Some organs, like the heart, become more active; some, like the brain, do<br />
not change; and some, like the kidney, decrease their activity. None of these organs<br />
is of significant metabolic size compared to skeletal muscle (see table 18-1). As<br />
seen in figure 18-5, the increased heat production from muscular work is followed<br />
somewhat later by an increase in heat picked up by the calorimeter.<br />
Similar data have been obtained in experiments with men working in water<br />
cooled suits. The subjects involved in the study illustrated in figure 18-6 were thermally<br />
isolated in insulated, impermeable coveralls, with cooling controlled so that<br />
they neither felt cold nor did they sweat (i.e., their weight loss was less than<br />
100 gm/hr). The curves of figures 18-6and 18-7 show that metabolic heat<br />
production (M) calculated from oxygen consumption (V-o 2) increased soon after<br />
work began, and that heat loss (H) to the water cooled suit increased<br />
somewhat later.
c 7<br />
e<br />
3 s<br />
n-<br />
O<br />
z 4<br />
_o<br />
I---<br />
D 3<br />
O<br />
-r 1<br />
0<br />
Work, Heat, andOxygen Cost 855<br />
/f<br />
-- REST :: WALKING 2'_ mph<br />
i ii!!i !iii _ I<br />
_H<br />
0 30 60 90 120 150 180<br />
TIME (min)<br />
M<br />
\\<br />
REST<br />
[<br />
210 240<br />
Figure 18-6. Heat production curves (M), calculated from continuous measurement of 02<br />
oonsumption and of heat loss (H) to a water cooled suit, including a small increment from<br />
evaporative heat loss from the skin and respiratory tract. Averaged data for 6 experiments,<br />
4 subjects. [Discrepancy between M and H, espedally in the second hour when there was<br />
evidently a physiological steady state, was due in part to the heat storage which occurs<br />
naturally in the first part of the day (the first half of the circadian cycle), and in part to<br />
measurement error.] (Redrawn from Webb & Annis, 1968)<br />
From the experiments discussed above, it became evident that oxygen<br />
consumption and heat dissipation increased exponentially to their final values,<br />
and that each function had a characteristic time constant. Webb et al. (1970)<br />
gave numerical values to these metabolic time constants, in addition to time<br />
constants for some other physiological variables that change with work<br />
(table 18-3).<br />
To illustrate the point, the general shapes of the M and H curves, using their<br />
characteristic time constants, are given in figure 18-8.<br />
When the initial exponential transient has passed, and heat dissipation has been<br />
adjusted to match heat production, a more or less steady state persists<br />
throughout the rest of the work, as seen in figure 186. When work is over,<br />
exponential decays in M and H characterize the return to resting levels.<br />
Figure 18-9 shows heat dissipation during a single experiment lasting<br />
16 hours, during which the subject did muscular work (walked on a treadmill at<br />
4.8 km/hr or 3 mph for two 1-hour periods), and during the rest of the day<br />
carried out quiet activities like reading. The kind of near-calorimetric data<br />
depicted in the figure verify the general work, heat, and oxygen cost data<br />
discussed in this chapter. Calorimetric heat balances accurate to 1 percent have<br />
been made since this chapter was written. The technique is described by Webb et<br />
al., (1972) and a fundamental circadian rhythm of metabolism reported by<br />
Webb (1971).
856 Bioastronautics Data Book<br />
E<br />
x<br />
3<br />
Z<br />
_o<br />
D<br />
a<br />
0<br />
<<br />
12<br />
11<br />
10<br />
9<br />
8<br />
7<br />
6<br />
5<br />
4<br />
3<br />
2<br />
1<br />
0<br />
[<br />
I<br />
REST<br />
I<br />
3O<br />
_J<br />
/<br />
/<br />
/<br />
/<br />
l<br />
/<br />
/<br />
M<br />
H<br />
i \<br />
\<br />
\<br />
I<br />
\<br />
WAkKING 3 mph I<br />
UP AN 8% GRADE<br />
[ I<br />
60 90 120<br />
TIME (rnin)<br />
REST<br />
I<br />
150 180<br />
Figure 18-7. Heat production (M) from VO2 and heat loss (H) to a water cooled suit, as in<br />
figure 18-6 but with double the activity level for half the time. External work of walking<br />
uphill for 3 mi. was added to H curve. Averaged data for 6 experiments, 4 subjects.<br />
(Redrawn from Webb & Annis, 1968)<br />
Table 18-3<br />
Time Constants for Exponential Changes<br />
Following Onset of Work<br />
Physiological Measure Time Constant (rain)<br />
Heart rate 0.4<br />
M (from VO2) 0.5<br />
Mean skin temperature 1.0 (Estimated)<br />
Rectal temperature 10.0<br />
Heat loss 10.0<br />
These recent experiments with controlled water cooling in thermally<br />
i_lated men, along with tile comparable measurements in water cooled<br />
space suits shown in figures 18-25 and 18-26 at the end of the chapter, are<br />
essentially calorimetric. If continued, they should provide excellent design<br />
data for human cooling systems, and modernize our information about<br />
human energy exchange. Meanwhile, our best source is the extensive
Work, tleat, and Oxygen Cost 857<br />
literature on the oxygen co_s of specific activities, which translate into heat<br />
and work data by the methods already described.<br />
z<br />
100<br />
m<br />
o<br />
t=<br />
E<br />
?4<br />
C-- 3<br />
£3<br />
56 r_<br />
10<br />
_REST_-- WORK<br />
iV,."x OXYGEN __<br />
I I i I<br />
10 20 30 40<br />
TIME Imin)<br />
Figure 18-8. Pure shapes of exponential changes of two variables, V02 and H,<br />
based on their individual time constants, a.s given in table 18-3.<br />
2<br />
1<br />
o0 i<br />
[6OOAM]<br />
MEAL<br />
M-I<br />
H . H<br />
WORK<br />
i . E L L I ! [ L<br />
2 3 4 5 6 ? B<br />
TIME Ihours)<br />
WORK<br />
[ : L 1 ] I<br />
10 11 12 13 14 15 16<br />
[lOOOpM[<br />
Figure 18-9. Heat dissipation (H) in a water cooled suit, under conditio_ similar to<br />
those for figure 18-6. Data points are for heat production (M) from VO2-VCO2<br />
measured by collecting expired air and analyzing for 02 and C02. (Redrawn from<br />
Wehh et al., 1970)<br />
487-858 O 73 - 55<br />
50
858 Bioastronautics Data Book<br />
Oxygen Costs of Specific Activities<br />
To design life support equipment it is essential to be able to estimate<br />
heat production for the activities involved. There is a sizable body of data<br />
available for a large number of specific human activities, all based on<br />
oxygen cost, hence heat production. Tables 18-4 and 18-5 give this sort of<br />
data. The tabulated values have been adjusted for a man 175 cm (69 inches)<br />
tall who weighs 76 kg (167 Ib), which are the mean values for the original<br />
seven Mercury astronauts. The means for the 43 current astronauts<br />
are 177 cm (69-1/2 inches) in height and 74 kg (163-1/2 Ib) in weight.<br />
Important subject-to-subject differences exist even in men of the same<br />
size. These commonly give rise to variations as high as 60 percent when<br />
different men are performing the same task, as high as 30 percent when<br />
adjustments for body size are made, and as high as 10 to 15 percent when<br />
repeated measurements are taken on the same man.<br />
The efficiency with which external work is accomplished also varies<br />
widely. It is lowest in the work of respiration (less than 5 percent), is 10 to<br />
20 percent for common tasks, and highest in bicycling and walking on the<br />
inclined treadmill (up to 35 percent and occasionally 40 percent in trained<br />
men). Several apparent discrepancies in the tabulated values however, are<br />
indicative of the imprecision of such data. This sort of variation is to be<br />
expected. For example, "shoveling sand" occurs twice; once under<br />
"Moderate activity-standing," and again under "Heavy activity-standing,"<br />
with an appropriately higher level of energy cost. Both measurements shown<br />
have been reported in the literature, and both are probably valid for the<br />
subjects and activities measured. These disparities may be due to the wide<br />
range of subject-to-subject differences mentioned above, to differences in the<br />
rate of work, or to some variation in experimental technique.<br />
The oxygen cost of moving at different speeds over a firm level surface<br />
is shown graphically in figure 18-10. If a man walks or runs uphill, and if<br />
he is carrying extra weight, oxygen costs increase significantly. Figure 18-11<br />
shows data of this kind for treadmill work. The chart, which permits<br />
estimation of oxygen consumption, is based on extensive experiments in few<br />
subjects. The upper segment is based on two middle-distance runners, the<br />
lower segment, on 10 healthy male volunteer walkers. The hatched area<br />
indicates a range of values of the so-called "maximum aerobic capacity,"<br />
which is approximately equal to the highest oxygen consumption that can<br />
be maintained continuously. Its value depends primarily on the body build<br />
and degree of training of the subject. Considerable variation must be<br />
expected, both between subjects and from experiment to experiment. Since<br />
only well-trained men are capable of sustained climbing, few men will be<br />
capable of reproducing the most severe combinations depicted.<br />
Certain environmental stresses cause increases in oxygen cost. Three such<br />
conditions are vibration (figure 18-12), acceleration (figure 18-13), and heat<br />
(figure 18-14).
Asle£_J<br />
Activity<br />
Sleeping, men over 40<br />
Sleeping, men aged 30 -- 40<br />
Sleeping, men aged 20 -- 30<br />
Sleeping, men aged 15 -- 20<br />
Resting<br />
Lying fully relaxed<br />
Lying moderately relaxed<br />
Lying awake, after meals<br />
Sitting at rest<br />
Very light activity --seated<br />
Writing<br />
Riding in automobile<br />
Typing<br />
Polishing<br />
Very light activity--standing<br />
Relaxed<br />
Drafting<br />
Taking lecture notes<br />
Peeling potatoes<br />
Light activity--seated<br />
Playing musical instruments<br />
Repairing boots and shoes<br />
At lecture<br />
Assembling weapons<br />
Light activity--standing<br />
Entering ledgers<br />
Washing clothes<br />
Ironing<br />
Scrubbing<br />
Light activity--moving<br />
Slow movement about room<br />
Vehicle repairs<br />
Slow walking<br />
Wash ing<br />
Work, Heat, and Oxygen Cost 859<br />
Table 18-4<br />
Oxygen Cost of Everyday Activities<br />
Oxygen<br />
Consumption<br />
(liters/min)<br />
0.22<br />
0.24<br />
0.24<br />
0.25<br />
0.24<br />
0.26<br />
0.28<br />
0.34<br />
0.36<br />
0.40<br />
0.46<br />
0.48<br />
0.36<br />
0.38<br />
0.40<br />
0.42<br />
0.58<br />
0.60<br />
0.60<br />
0.72<br />
0.52<br />
0.74<br />
0.88<br />
0.94<br />
0.50<br />
0.68<br />
0.76<br />
0.84<br />
Equivalent<br />
Heat Production<br />
(kcal/min)<br />
1.1<br />
1.2<br />
1.2<br />
1.3<br />
1.2<br />
1.3<br />
1.4<br />
1.7<br />
1.8<br />
2.0<br />
2.3<br />
2.4<br />
1.8<br />
1.9<br />
2.0<br />
2.1<br />
2.9<br />
3.0<br />
3.0<br />
3.6<br />
2.6<br />
3.7<br />
4.4<br />
4.7<br />
2.5<br />
3.4<br />
3.8<br />
4.2
860 Bioastronautics Data Book<br />
Moderate activity-lying<br />
Activities<br />
Creeping, crawling, prone resting maneuvers<br />
Crawling<br />
Swimming breaststroke at 1 mph<br />
Swimming crawl at 1 mph<br />
Moderate activity--sitting<br />
Rowing for pleasure<br />
Cycling at 6 - 11 mph<br />
Cycling rapidly<br />
Trotting on horseback<br />
Moderate activity--standing<br />
Gardening<br />
Chopping wood<br />
Baseball pitching<br />
Shoveling sand<br />
Moderate activity-moving<br />
Golf<br />
Table tennis<br />
Tennis<br />
Army drill<br />
Heavy activity--lying<br />
Leg exercises, average<br />
Swimming breaststroke at 1.6 mph<br />
Swimming backstroke at 1.0 mph<br />
Lying on back, head raising<br />
Heavy activity--sitting<br />
Cycling rapidly, own pace<br />
Cycling at 10 mph, heavy bicycle<br />
Cycling in race (100 mi in 4 hr 22 rain)<br />
Trotting on horseback<br />
Heavy activity--standing<br />
Chopping wood<br />
Shoveling sand<br />
Sawing wood by hand<br />
Digging<br />
Table 18 -4 (Continued)<br />
Oxygen Cost of Everyday Activities<br />
Oxygen<br />
Consumption<br />
(liters/min)<br />
1.14<br />
1.22<br />
1.36<br />
1.40<br />
1.00<br />
1.14<br />
1.38<br />
1.42<br />
1.16<br />
1.24<br />
1.30<br />
1.36<br />
1.08<br />
1.16<br />
1.26<br />
1.42<br />
1.50<br />
1.64<br />
1.66<br />
1.76<br />
1.66<br />
1.78<br />
1.96<br />
1.96<br />
1.50<br />
1.54<br />
1.60<br />
1.78<br />
Equivalent<br />
Heat Production<br />
(kcal/min)<br />
5.7<br />
6.1<br />
6.8<br />
7.0<br />
5.0<br />
5.7<br />
6.9<br />
7.1<br />
5.8<br />
6.2<br />
6.5<br />
6.8<br />
5.4<br />
5.8<br />
6.3<br />
7.1<br />
7.5<br />
8.2<br />
8.3<br />
8.8<br />
8.3<br />
8.9<br />
9.8<br />
9.8<br />
7.5<br />
7.7<br />
8.0<br />
8.9
Heavy activity--moving<br />
Skating at 9 mph<br />
Playing soccer<br />
Activities<br />
Skiing at 3 mph on level<br />
Climbing stairs at 116 steps/rain<br />
Very heavy activity-sitting<br />
Cycling at 13.2 mph<br />
Rowing with two oars at 3.5 mph<br />
Galloping on horseback<br />
Sculling (97 strokes/min)<br />
Very heavy activity-moving<br />
Fencing<br />
Playing squash<br />
Playing basketball<br />
Climbing stairs<br />
Extreme activity<br />
Wrestling<br />
Marching at double<br />
Endurance marching<br />
Harvard Step Test<br />
Work, Heat, and Oxygen Cost<br />
Table 18-4 (Continued)<br />
Oxygen Cost of Everyday Activities<br />
Oxygen<br />
Consumption<br />
(liters/min)<br />
1.56<br />
1.66<br />
1.80<br />
1.96<br />
2.00<br />
2.20<br />
2.28<br />
2.52<br />
2.10<br />
2.10<br />
2.28<br />
2.40<br />
2.60<br />
2.66<br />
2.96<br />
3.22<br />
Equivalent<br />
Heat Production<br />
(kcal/min)<br />
7.8<br />
8.3<br />
9.0<br />
9.8<br />
10.0<br />
11.0<br />
11.4<br />
12.6<br />
10.5<br />
10.5<br />
11.4<br />
12.0<br />
13.0<br />
13.3<br />
14.8<br />
16.1<br />
861
862 Bioastronautics Data Book<br />
Engineering tasks<br />
Medium assembly work<br />
Welding<br />
Sheet metal work<br />
Machining<br />
Punching<br />
Machine fitting<br />
Activities<br />
Heavy asseml:dy work--noncontinuous<br />
Driving vehicles and piloting aircraft<br />
Driving a car in light traffic<br />
Night flying-DC-3<br />
Piloting DC-3 in level flight<br />
Piloting helicopters<br />
Instrument landing-DC-4<br />
Piloting light aircraft in rough air<br />
Taxiing DC-3<br />
Piloting bomber aircraft in combat<br />
Driving car in heavy traffic<br />
Driving truck<br />
Driving motorcycle<br />
Moving over rough terrain on foot<br />
Flat, firm road<br />
Grass path<br />
Stubble field<br />
Deeply plowed field<br />
Steep 45 ° slope<br />
Plowed field<br />
Soft snow, with 44 Ib load<br />
Load carrying<br />
Walking on level with 58 Ib load,<br />
trai ned men<br />
Walking on level with 67 Ib load,<br />
trai ned men<br />
Walking on level with 75 Ib load,<br />
trained men<br />
Walking up 36% grade with 43 Ib<br />
load, sedentary men<br />
Table 18-5<br />
Oxygen Cost of Special Activities<br />
Oxygen<br />
Consumption<br />
(Iiters/min )<br />
0.58<br />
0.60<br />
0.62<br />
0.66<br />
0.70<br />
0.90<br />
1.02<br />
0.26<br />
0.32<br />
0.34<br />
0.36<br />
0.50<br />
0.54<br />
0.58<br />
0.58<br />
0.64<br />
0.66<br />
0.70<br />
2.5 mph 0.56 -- 0.98<br />
2.5 0.64 -- 1.02<br />
2.5 0.80 -- 1.22<br />
2.0 0.98 -- 1.38<br />
1.5 0.98 -- 1.38<br />
3.3 1.56<br />
2.5 4.2<br />
2.1 mph 0.38<br />
2.7 0.58<br />
3.4 0.92<br />
4,1 1.66<br />
2.1 mph 0.46<br />
2.7 0.58<br />
3.4 1.02<br />
4.1 1.58<br />
2.1 mph 0.50<br />
2.7 0.68<br />
3.4 1.64<br />
4.1 1.72<br />
0.5 mph 1.34<br />
1.0 2.46<br />
1.5 3.20<br />
Equ ivalen t<br />
Heat Production<br />
(kcal/min )<br />
2.9<br />
3.0<br />
3.1<br />
3.3<br />
3.5<br />
4.5<br />
5.1<br />
1.3<br />
1.6<br />
1.7<br />
1.8<br />
2.5<br />
2.7<br />
2.9<br />
2.9<br />
3.2<br />
3.3<br />
3.5<br />
2.8 --4.9<br />
3.2 --5.1<br />
4.0 -- 6.1<br />
4.9 -- 6.9<br />
4.9 -- 6.9<br />
7.8<br />
21.0<br />
1.9<br />
2.9<br />
4.6<br />
8.3<br />
2.3<br />
2.9<br />
5.1<br />
8.4<br />
2.5<br />
3A<br />
5.2<br />
8.6<br />
6.7<br />
12.3<br />
16.0
Swimming on surface<br />
Work, Heat, and Oxygen Cost<br />
Table 18-5 (Continued)<br />
Oxygen Cost of Special Activities<br />
Oxygen Equivalent<br />
Activities Consumption Heat Production<br />
(liters/min) (kcal/min)<br />
Breaststroke 1 mph<br />
2<br />
Crawl 1 mph<br />
2<br />
Butterfly 1 mph<br />
2<br />
Wal king under water<br />
Walking in tank minimal rate<br />
Walking on muddy bottom minimal rate<br />
Walking in tank maximal rate<br />
Walking on muddy bottom maximal rate<br />
Movement in snow<br />
Skiing in loose snow 2.6 mph<br />
Sled pulling--hard snow 2.2<br />
Snowshoeing (bearpaw) 2.5<br />
Skiing on level 3.0<br />
Sled pulling--low drag, reed. snow 2.0<br />
Snowshoeing--trail type 2.5<br />
Walking, 12--18 in. snow, 2.5<br />
breakable crust<br />
Skiing on loose snow 5.2<br />
Snowshoeing--trail type 3.5<br />
Skiing on loose snow 8.1<br />
Measured work at different altitudes<br />
Bicycle ergometer<br />
Workload Altitude<br />
430 kg-m/min 720 mm Hg<br />
430 620<br />
430 520<br />
Mountain climbing<br />
880- 1037 kg-m/min 610 mm Hg<br />
566- 786 425<br />
393- 580 370<br />
3<br />
3<br />
3<br />
1.40<br />
5.80<br />
19.40<br />
1.80<br />
3.60<br />
9.60<br />
2.40<br />
5.80<br />
15.00<br />
0.58<br />
1.10<br />
1.44<br />
1.68<br />
1.62<br />
1.72<br />
1.74<br />
1.80<br />
1.94<br />
2.06<br />
2.54<br />
2.92<br />
2.96<br />
4.12<br />
1.02<br />
0.98<br />
1.08<br />
1.84 - 2.20<br />
1.54 -- 1.90<br />
1.28 - 2.10<br />
7.0<br />
29.0<br />
97.0<br />
9.0<br />
18.0<br />
48.0<br />
12.0<br />
29.0<br />
75.0<br />
2.9<br />
5.5<br />
7.2<br />
8.4<br />
8.1<br />
8.6<br />
8.7<br />
9.0<br />
9.7<br />
10.3<br />
12.7<br />
14.6<br />
14.8<br />
20.6<br />
5.1<br />
4.9<br />
5,4<br />
9.2 -- 11.0<br />
7.7- 9.5<br />
6.4 -- 10.5<br />
Data for tables 18--4 and 18--5 were drawn from both published and unpublished sources.<br />
The principal references consulted were: Altman at al. (1958), Billings et el. (1962), Buskirk<br />
et al. (1956), Cathcart et el. (1923), Christensen (1953), Christensen end Hogberg (1950),<br />
Garry et el. (1955), Glasow and M011er (1951), Karpovich (1953), Lit-tell and Joy (1969),<br />
Mayer (1959), Morehouse end Cherry (1945), Morehouseand Miller (1959), Passmoreet el.<br />
(1952), Passmore and Durnin (1955), Pollack et el. (1944), Pugh (1958), Ramzin (1948),<br />
Rose (1944), Turner (1955), and U.S. Navy (1956).<br />
863
864 Bioastronautics Data Book<br />
oo<br />
50<br />
20<br />
SPEED Ikm/hr)<br />
3 4 S 6 7 8 9 10 12 15 20 25 30<br />
25 3 4 $ 6 B 10 12 14 T61820<br />
SPEE D [mph)<br />
Figure 18-10. Oxygen cost of walk-<br />
ing and running at various speeds on<br />
level surfaces with no "extra load.<br />
[Compilation by Altman et al., 1958;<br />
straight line for slow running<br />
(4-15 km/hr), from Sliephard,<br />
1969]<br />
o<br />
0° 2"<br />
ANGLE OF INCLINE - _0t,ll<br />
4 o 6° 9 °<br />
I I I<br />
fjo,, |<br />
j o.3<br />
5 10 15<br />
GRADE-%<br />
Figure 18-11. Chart for estimating<br />
02 consumption of men walking or<br />
running uphill wearing heavy equip-<br />
ment. To use: estimate percent grade<br />
from height of rise in 100 ft., or<br />
estimate angle of incline from the<br />
tangent, derived from vertical rise<br />
and horizontal distance. Note that<br />
above hatched area, work is exhaust-<br />
ing, and the greater the oxygen con-<br />
sumption, the oshorter the running<br />
time. (From Astxand, 1952, with<br />
permission of Ejnar Munksgaard,<br />
publisher; Goldman & lampietro,<br />
1962, Margaria et al., 1963)<br />
O.2 _<br />
OI<br />
0<br />
I
X<br />
_><br />
c<br />
8 °<br />
IO0<br />
8o<br />
6O<br />
_0<br />
2O<br />
-20<br />
o<br />
Work, Ileal, and Oxygen Cost 865<br />
OXYGEN CONSUMPTION<br />
!<br />
0 4<br />
S:!! iiiI<br />
FREQUENCY (Hz)<br />
._::'L':C:'_'.6Z<br />
!<br />
12 16<br />
Figure 18-12. Change in 02 consumption for 4 male subjects during vibration, shown<br />
as a percentage change from control value. Subjects were exposed to 20m in. of<br />
vibration at an amplitude of 0.132in. while seated on a chair and entirely<br />
unrestrained. (Adapted from Gaeuman et al., 1962)<br />
A<br />
z<br />
o<br />
}-<br />
Z<br />
o<br />
o<br />
z<br />
w<br />
o<br />
>x<br />
o<br />
1.2<br />
1.0<br />
0.8<br />
0.6<br />
0.4<br />
0.2 --<br />
5 8 10 12<br />
FORWARD ACCELERATION (G)<br />
Figure 18-13. Increase in 02 consumption with increasing levels of acceleration.<br />
Subjects were exposed to forward acceleration (+Gx) on a centrifuge, with onset time<br />
of I G/see. Clear areas show control value of 02 consumption; hatched areas show<br />
additional 02 consumption for 1 min. of acceleration. (Data from Zechman et ai.,<br />
1959)
866 Bioastronautics Data Book<br />
37 38 39<br />
0.7 r _ ,<br />
0.6<br />
0.5<br />
0.4<br />
0.3<br />
37<br />
_MIN<br />
_G .-'_0_/_'AD<br />
SUit3 _' _ _ ST<br />
,,NO P'g"<br />
A AFTER (<br />
[ I _ i •<br />
38 39<br />
RECTAL TEMP (°C)<br />
Figure 18-14. Increase in 02 consumption as body temperature rises during heat<br />
exposure, at rest and during the light activity of operating a flight simulator. (Adapted<br />
from Jones & Taylor, 1956)<br />
Work Capacity<br />
Although most regular activities are designed to use less than a man's<br />
maximum effort, an effort which can be sustained for only a short time,<br />
nevertheless in an emergency a man may use his greatest power, and designs<br />
of respiratory and cooling equipment must allow for highest peak rates.<br />
Figure 18-15 shows how a man's peak rates depend on the duration of<br />
the effort. The harder the effort, the shorter the time for which it can be<br />
sustained. For 30 to 60 seconds, men can work against an external load<br />
developing a power of around 500 W (about two-thirds of a horsepower),<br />
while at the same time, assuming 20percent efficiency, he will produce<br />
excess heat at the rate of 2000 g_ and burn fuel at the rate of<br />
2500 W (36 kcal/min). Brief periods of maximal exertion, those lasting less<br />
than 2 minutes, are done at levels of oxygen demand which cannot be met<br />
by the man's capacity to consume oxygen, hence this kind of work is<br />
called anaerobic and produces oxygen debt (see figures 18-21 to 18-23). The<br />
data shown in figure 18-15 are special in that: (1)the types of work<br />
(running, rowing, cycling, and cranking) were chosen to yield highest power,<br />
and at efficiencies above 20percent, and (2)the "healthy men" were<br />
young, physically active and fit, and accustomed to doing the work, while<br />
the champion athletes were unusual physical specimens highly trained and<br />
highly motivated to work at maximum effort.
1700<br />
Work, Heat, and Oxygen Cost 867<br />
iloo 5<br />
looo<br />
goo<br />
_ a<br />
800 3L<br />
7oo<br />
_oo0 _<br />
g g<br />
500 _U<br />
400<br />
_oo _<br />
_oo<br />
loo<br />
0 0 1 1 I Lo_ 5 J1 I2 _ I I5 it[ Ik 10 i 2O i ] I/OI [i_ll5 100 I[ 2O0I [ IH 5OO<br />
TIME (rninsl I 1 I I 1 ! I i i1<br />
v, % I 2 3 4 5<br />
TIME (hours)<br />
Figure l8-15. Maximum efforts of healthy fit men and ehampion a_hletcs. (After<br />
Fletcher, 1964; from Abbott and Bigland, 1953; Asmussen, 1950; Astrand, 1952;<br />
Bannister & Cunningham, 1954; Benedict & Catheart, 1913; Benedict & Mursehhauser,<br />
1915; Henderson & Haggard, 1925; Nielsen & Hanson, 1937; Robinson, 1938; Wilkie,<br />
1957)<br />
The maximum effort of durations longer than 2 or 3 minutes is limited<br />
by a given individual's greatest ability to consume oxygen-his aerobic<br />
power. Healthy fit men can consume 50 ml/kg of body weight each minute.<br />
Less fit men consume 30or 40ml/kg-min. Extremely fit athletes can<br />
onsume 60 or 70 ml/kg-min, the record figure being.85 ml/kg-min (Saltin &<br />
strand, 1967. This maximal oxygen consumption (Vo2-max) is often used<br />
to evaluate the effect of physical conditioning programs.<br />
If one looks at '¢o2-max in men of various ages, it can be seen that<br />
this measure reaches its greatest values in the late teens and twenties, then<br />
declines slowly as the decades go by. Figures 18-16, 18-17, and 18-18 show<br />
mean data of this kind from several studies. These children and men were<br />
all healthy, not obese, and reasonably fit. Notice in figure 18-18 that the<br />
data are different for different populations. Several comparative studies have<br />
been reported, one of which is shown in table 18-6, from Cumming (1967)<br />
Determining a man s Vo2-max is an important measurement in work<br />
physiology. The pure form of the procedure is illustrated in figure 18-19.<br />
Note that as work increases, oxygen cost increases until further work loads<br />
cause no further increase in VO2: 250 W brought the oxygen uptake up to<br />
the subject's maximum and 300W did not further increase the oxygen<br />
O
868 Bioastronautics Data Book<br />
uptake. The increased work load was possible thanks to anaerobic processes<br />
(maximal aerobic power = 3.5 liters/min).<br />
_ 40<br />
60 •<br />
so<br />
D 30<br />
_ 20<br />
O • ATHLETES<br />
/_. • TRAINED STUDENTS<br />
THIN LINES = +2 x O<br />
i '<br />
o L__L ___.L__ _L _ _ J L__ _-- --J<br />
0 t 0 20 30 40 50 60 70<br />
AGE Iyears)<br />
Figure 18-16. Mean values for maximal 02 uptake during exercise on treadmills or<br />
licyde ergorneters in 350 Swedish boys and girls and men and women from 4 to<br />
65 years of age. Included due values for 3 athletes and 86 trained students of physical<br />
education. (Redrawn from Astrand & Rodahl, 1970; used by permission of Pergamon Press,<br />
Oxford)<br />
c<br />
5.O --<br />
E 4.0-<br />
v<br />
4.0<br />
v 30<br />
uJ<br />
z<br />
)-<br />
×<br />
0<br />
×<br />
<<br />
20<br />
10<br />
P<br />
Work, Heat, and Oxygen Cost 869<br />
i ",. TRAINED YMCA<br />
# 'o..,+ HEALTH CLUB<br />
• *'_,+ MEMBERS<br />
,; 'I.+Q /<br />
• III_i '+'- _ BOSTON<br />
_ "_ @ "'"... ROBINSON 1938<br />
UNIVERSITY //_1 Ii '<br />
POL ICEMEN PHI LADE LPH IA<br />
PUBLIC SCHOOLS 1959<br />
I I I 1 I I I J<br />
2O 40 60 B0<br />
AGE (veers)<br />
Figure 18-18. Maximal 02 consumption for American and women in relation to age, from<br />
several studies. (Redrawn from Astrand & Rodahl, 1970, by permission of McGraw-Hill<br />
Book Company)<br />
Table 18-6<br />
Maximal Oxygen Uptake of Men 20 to 40 Years of Age (Mean Values)<br />
Average Caucasian males<br />
Oxygen Uptake<br />
Subjects (ml/kg -- min)<br />
Stockholm 52<br />
Boston 53<br />
Dallas 45<br />
Norway 44<br />
Winnipeg 44<br />
Army recruits<br />
U.S.A. 48<br />
South Africa 48<br />
Primitive populations<br />
Bantu mining recruits 41<br />
Bantu miners 48<br />
Kalahari bushmen 47<br />
U.S.A. Negro sharecroppers 50<br />
Lapps 53<br />
Arctic Indians 49<br />
Eskimos 41<br />
Athletes<br />
Sweden-physical education students 59<br />
Sweden --athletes 67<br />
Sweden-cross-country skiers 80<br />
Norway--athletes 71<br />
Landy (runner) 77<br />
Winnipeg-water-polo players 53<br />
Winnipeg--track 72<br />
(Cumming, 1970)
870 Bioastronautics Data Book<br />
tu<br />
_20<br />
D<br />
40_----<br />
3.0<br />
1.0<br />
r -- ] - f ] r<br />
WATTS<br />
_/300<br />
A 200<br />
/If 01501<br />
i I 1 i i<br />
0 1 2 3 4 5<br />
+ 50<br />
MIN WATTS<br />
T --r--_ _ r-_oq4 -<br />
2 / ,4,;311o<br />
s_<br />
,'<br />
E / / "d,,<br />
./ ,/ 101_2 S<br />
z:__:-,tti<br />
100 200 300<br />
Figure 18-19. Schematic of maximum oxygen uptake (_rO 2 max) determinations. Left:<br />
increase in 02 uptake during exercise on bicycle ergometer with various work loads<br />
performed during 5 to 6 min_ of work. Right: 02 uptake after 5 min., plotted in relation to<br />
work load. Peak oblood lactic acid concentrations for each experiment are included.<br />
(Redrawn from Astrand & Rodahl, 1970; used by permission of McGraw-Hill Book<br />
Co mpany )<br />
The effect of physical conditioning programs on untrained but otherwise<br />
healthy men is to increase their Vo2-max by 10 to 20 percent, as shown in<br />
figure 18-20. Notice also that a trained person can endure a prolonged<br />
period of work at a greater proportion of his maximum capacity than can<br />
an untrained person.<br />
A<br />
C<br />
t*<br />
v<br />
tit<br />
V<br />
I--<br />
o"<br />
5-<br />
4-<br />
3--<br />
2-<br />
14<br />
! I<br />
0 1<br />
\<br />
OWER<br />
PERCENTAGE OF MAXIMAL<br />
AEROBIC POWER WHICH<br />
MAY BE TAXED DURING<br />
PROLONGED WORK<br />
1 t 1<br />
2 3 4<br />
PERIOD OF TRAINING (months)<br />
I 1<br />
5 6<br />
lrlgure 18-20. Effect of training on maximal 02 uptake. With training, subject is also<br />
able to use a goreater percentage of his maximal 02 uptake during prolonged work.<br />
(Redrawn from Astrand & Rodahl,1970, by permission of McGraw-Hill Book Company)
Work, Heat, and Oxygen Cost 871<br />
It seems reasonable to suppose that quite sedentary, hence unfit, people<br />
could show greater than 20 percent changes in Vo2-max following a physical<br />
conditioning program. An example is given by Rodahl and Issekutz (1962), who<br />
observed a 25 percent change in women who trained by skipping rope daily for<br />
4 weeks. Saltin et al. (1968) reported a 33 percent increase in three sedentary<br />
young men who trained vigorously for 55 days, while two other men who were<br />
previously active showed little change in Vo2-max from the same program.<br />
Anaerobic Work<br />
If _ro2-max data are compared with the maximum power data from<br />
figure 18-19, converting watts of external work into V02 (assuming 25 percent<br />
efficiency), then the high rates of heat production in efforts lasting less than<br />
1 minute show heat production above 20 kcal/min at an apparent oxygen cost of<br />
more than 4 liters per minute. These call for oxygen at rates greater than a<br />
healthy man's ability to consume oxygen. He is working anaerobically. For brief<br />
maximal efforts lasting only up to 1 or 2 minutes, his muscles get energy by<br />
splitting energy rich phosphates and glycogen, as contrasted with the aerobic<br />
oxidation of carbohydrates and fat used in the muscle work which can be<br />
sustained for 10 minutes or more.<br />
At the beginning of hard work, circulation and oxygen supply increase<br />
exponentially, hence some of the work is anaerobic and an oxygen deficit<br />
occurs. After the work, oxygen consumption decays exponentially, and the<br />
excess oxygen is used to oxidize the end products of anaerobic glycolysis, e.g.,<br />
lactic acid. Figure 18-21 shows acquisition of oxygen deficit early in hard work<br />
and its repayment (oxygen debt) after the work is finished.<br />
A<br />
.E<br />
E<br />
z<br />
O<br />
z<br />
0<br />
z<br />
uJ<br />
_D<br />
0<br />
3O<br />
20<br />
t 2 3 4 5 6 7 8m,n<br />
WORKTIM E (min)<br />
Figure 18-21. Stylized presentation of 02 uptake during strenuous but submaximal work<br />
for 3-1/2 min., followed by the 02 uptake during recovery. Note that the work hasan 02<br />
cost of 43 ml/kg-min, but that this level of 02 consumption is reached exponentially (of.<br />
table 18-3 and figure 18-8), so that there is an 02 deficit before the final value is reached,<br />
paid hack during recovery period. (Hermansen, 1969; used with permission)
872 Bioastronautics Data Book<br />
The highest values for oxygen debt are found when a maximum<br />
(exhausting) effort is made over a 2 or 3 minute period. Figure 18-22 shows<br />
oxygen debt as a function of work load, and figure 18-23 shows the course<br />
of oxygen consumption, oxygen debt, and hctic acid accumulation during a<br />
maximal effort lasting 3 minutes.<br />
I-<br />
uJ<br />
$0<br />
6D<br />
4.0<br />
20<br />
Bicycle subject exercise] T.T. /"<br />
I I I I<br />
25 50 75 loo%<br />
MAX. 0 2 UPTAKE ('/.}<br />
Figure 18-22. 02 debt increasing as the work becomes more severe, expressed as<br />
percentage of subject's maximal 02 uptake. (Hermansen, 1969, used with permission)<br />
_Blood _<br />
lactate<br />
50 1"25.0<br />
/<br />
o_ 0_0_ /" 0<br />
E _.0 _20,0 / / OMygen deb!<br />
,m.O<br />
3,0 S,O t'/o<br />
.......... .8,o<br />
1.0<br />
l'° o<br />
I 2<br />
WONK-TIME (mini<br />
J<br />
-211<br />
-4.0<br />
Figure 18-23. Cumulative increases in 02 debt and lactic acid in the Mood, shown<br />
during a maximal work effort lasting 3nfinutes. (Hermansen, 1969; used with<br />
permission)
Work, Heat, and Oxygen Cost 873<br />
Working in Space Suits<br />
While ordinary clothing is no great burden, there is sizable extra effort<br />
involved in moving about and working in a pressurized space suit. Roth<br />
(1966) prepared a thorough analysis of this problem, as well as the<br />
mechanics of gait, the effects of variations in terrain, and the probable<br />
effect of walking in one-sixth gravity. Table 18-7 gives figures for the<br />
primary problem, the added metabolic cost (oxygen cost) of normal<br />
activities in space suits.<br />
Table 18-7<br />
Metabolic Cost of Space Suits<br />
(Worn in 1 g in 1 Atm Pressure)<br />
Activity<br />
Walking on treadmill at 1.6 km/hr (0.8 mph)<br />
Light clothing<br />
Space suit unpressurized<br />
Space suit pressurized at 180 mm Hg (3.5 psi)<br />
Space suit pressurized at 258 mm Hg (5.0 psi)<br />
Sitting in spacecraft mockup operating switches every 5 sec<br />
Space suit unpressurized<br />
Space suit pressurized at 180 mm Hg (3.5 psi)<br />
(Adapted from LaChance, 1964)<br />
Heat Production<br />
kcal/min watts<br />
2.2 152<br />
3.6 252<br />
6.4 445<br />
7.7 592<br />
t .8 123<br />
2.5 173<br />
Data on the energy cost of moving at various speeds in Earth gravity<br />
and a simulated lunar gravity of 1/6 g are summarized in figure 18-24. This<br />
figure shows clearly that a pressurized space suit makes walking a strenuous<br />
exercise, and that walking speeds above 2 to 3 km/hr (1.2 to 1.9 mph) are<br />
probably too difficult to maintain for long. However, by the various<br />
techniques used for simulating the 1/6 g lunar gravity, it appears that<br />
progression across the moon's surface at 5 km/hr (3 mph) should be possible<br />
at reasonable cost. Further details may be found in Wortz et al. (1969) and<br />
Robertson and Wortz (1970).<br />
Actual experience with lunar progression in Apollo 11 and 12 confirmed<br />
that the astronaut can move about without high metabolic cost. Various<br />
hopping and bouncing movements were devised to replace the usual earthly<br />
stride. During one 20-minute period late in Apollo ll, Astronaut Neil<br />
Armstrong showed a heart rate of 140 to 150 as he hurried to complete a<br />
collection of surface samples, but generally the heart rates of the four men<br />
who worked on the moon in these missions were 90to llObeats/min,<br />
which indicates relatively low effort.<br />
487-858 0 - 73 - 56
874 Bioastronautics Data Book<br />
10-<br />
9--<br />
ti-<br />
T-<br />
6-<br />
5-<br />
4-<br />
3-<br />
- _o0<br />
I I<br />
1 2<br />
I I I I I<br />
3 4 5 6<br />
WALKING SPEED (km/hr)<br />
Figure 18-24. Energy expenditure for walking in space suits at various speeds, based<br />
on 02 consumption measurements in laboratory and in _mulators which partially<br />
produce effects of lunar gravity (1/6g). (Data from Hewes, 1967; Kincaide, 1966;<br />
Rohertson & Wortz, 1968)<br />
Energy exchange data are available from the Apollo 11 mission. They are<br />
based on three different observations-heart rate, oxygen depletion from a<br />
portable reservoir, and temperature data from the water cooled garment<br />
worn under the space suit. These data are shown in figures 18-25 and 18-26.<br />
Berry (1970) suggests that the energy data from analysis of the water<br />
cooled garment are the most reliable of the three measurements. The<br />
technique is close to direct calorimetry, and the data are similar to those<br />
shown in figures 18-6, 18-7, and 18-9 earlier in this chapter.
800<br />
_ 600--<br />
I.-<br />
400 --<br />
200 --<br />
Work, Heat, and Oxygen Cost 875<br />
/<br />
_,p,'_-/<br />
30 60 90 120 150<br />
TIME (min)<br />
Figure 18-25. Cumulative totals of heat produced in walking and working on the moon for<br />
Apollo 11 commander, showing three simultaneous estimates from analyzing temperature<br />
data from water cooled suit, from depletion of 0 2 from storage cylinder, and from known<br />
heart rate response of this man as a function of 0 2 consumption. (Redrawn from Berry,<br />
1970)<br />
1000 I<br />
800<br />
600<br />
'_ 400<br />
I.-<br />
200<br />
oO_O_°_'_ :_°_<br />
30 60 90 120 150<br />
TIME ImJr,)<br />
Figure18-26. Data similar to those in figure 18-25, for the lunar module pilot,<br />
during his time on the lunar surface. (Redrawn from Berry, 1970)<br />
/<br />
/<br />
/<br />
/<br />
180<br />
180
876 Bioastronautics Data Book<br />
References<br />
Abbot, B. C., & Bigland, B. The effects of force and speed changes on the rate of oxygen<br />
consumption during negative work. Journal of Physiology, 1953, 120, 319-325.<br />
Altman, P. L., & Dittmer, D. S. (Eds.) Metabolism. Be/hesda, Maryland: Federation of<br />
American Societies for Experimental Biology, 1968.<br />
Altman, P. L., Gibson, J. F., Jr., & Wang, C. C. Handbook of respiration. WADC TR<br />
58-352, Aero Medical Laboratory, Wright Air Development Center, Wright-Patterson<br />
AFB, Ohio, August 1958.<br />
Asmussen, E. Blood pyruvate and ventilation in heavy work. Acta Physiologiea<br />
Scandinavica, 1950, 20,133-136.<br />
_tstrand, P. -O. Experimental studies of physical working capacity in relation to sex and<br />
age. Copenhagen: Ejnar Munksgaard, 1952.<br />
O<br />
Astrand, P.-O. & Rodahl, K. Textbook of Work Physiology. New York: McGraw-Hill,<br />
1970.<br />
Bannister, R. G., & Cunningham, D. J. C. The effects on the respiration and performance<br />
during exercise of adding oxygen to the inspired air. Journal of Physiology, 1954, 125,<br />
118-137.<br />
Benedict, F. G., & Ca/heart, E.P. Muscular work. A metabolic study with special reference<br />
to/he study of the human body as a machine, Publication No. 187, Carnegie Institute,<br />
Washington, D.C., 1913.<br />
Benedict, F. G., & Murschhanser, H. Energy transformations during horizontal walking.<br />
Carnegie Institute, Washington, D.C., 1915.<br />
Benzinger, T. H., & Kitzinger, C. Gradient layer calorimetry and human calorimetry. In J.<br />
D. Hardy (Ed.), Temperature: Its measurement and control in science and industry.<br />
Vol. II1, Part 3, Chapter 9, Biology and medicine. New York: Reinhold Publishing<br />
Corp., 1963.<br />
Berry, C. A. Summary of medical experience in the Apollo 7 through 11 manned<br />
spaceflights. Aerospace Medicine 1970, 41,500-519.<br />
Berry, C. A., & Catterson, A. D. Pre-Gemini medical predictions versus Gemini flight<br />
results. Gemini Summary Conference, NASA SP-138. National Aeronautics and Space<br />
Administration, Washington, D.C. 1967, pp. 197-218.<br />
Billings, C: E., Jr., Johnson, P. K., Hoover, G. N., & Mathews, D. K. The effect of moderate<br />
altitude on exercise. Report No. 1, Aviation Medicine Research Laboratory, The Ohio<br />
State University, Columbus, Ohio, 1962.<br />
Buskirk, E. R., lampietro, P. F., Welch, B. E., & Marcinek, J. G. Caloric intake and energy<br />
expenditure of eight men in a temperate environment. TR EP-52, Hq., Quartermaster<br />
Research and Development Command, U.S. Army, Natick, Mass., March 1957.<br />
Buskirk, E. R., Kreider, M., Brebbia, R., Morana, N., Daniels, F., Welch, B. E., Mann, J. B.,<br />
lnsull, W., Jr., & Friedemann, T. E. Caloric intake and energy expenditure in a subarctic<br />
environment. TR EP-33, Hq., Quartermaster Research and Development Command, U.S.<br />
Army, Natick, Mass., March 1956.<br />
Cathcart, E. P., Richardson, D. T., & Campbell, W. On the maximum load to be carried by<br />
the soldier. Journal of the Royal Army Medical Corps, 1923, 40,443, and 41, 12-24,<br />
87-98, and 161-178.<br />
Christensen, E. H. Ergonomics research society symposium on fatigue. London: H. K.<br />
Lewis, Ltd., 1953.<br />
Christensen, E. H., & Hogberg, P. Physiology of skiing. Arbeitsphysiologie, 1950, 14, 292.<br />
Consolazio, C. F., Johnson, R. E., & Pecora, L.J. Physiological measurements of metabolic<br />
functions in man. New York: McGraw-Hill, 1963.
Work, tteat, and Oxygen Cost 877<br />
Consolazio, C. F., Pollack, H., & Crowley, L. V. Studies on nutrition in the Far East. V.,<br />
Calorie cost of work and energy balance studies. Metabolism, 1956, 5,259-271.<br />
Cumming, G. R. Current levels of fitness. Journal of the Canadian Medical Association,<br />
1967, 96,868-877.<br />
Diem, K. (Ed.) Documenta geigy scientific tables. (6th ed.) Ardsley, N.Y.: Geigy Pharmaceuticals,<br />
1.962.<br />
Edholm, O. G., & Fletcher, J. G. The energy expenditure and food intake of individual<br />
men. British Journal of Nutrition, 1955, 9,286-300.<br />
Fletcher, J. G. Daily energy expenditure in young men. Ph. D. thesis, University of London,<br />
January 1958.<br />
Fletcher, J. G. Section 10, Energy costs. In P. Webb (Ed.), Bioastronauties data book.<br />
NASA SP-3006. Washington, D.C.: National Aeronautics and Space Administration,<br />
1964.<br />
Food and Agriculture Organization of the United Nations. Calorie requirements. Report of<br />
the second committee on calorie requirements, FAO nutritional studies No. 15,<br />
Rome, 1957.<br />
Gaeuman, J. V., Hoover, G. N., & Ashc, W. F. Oxygen consumption during human<br />
vibration exposure. Aerospace Medicine, 1962, 33,469-474.<br />
Garry, R. C., Paasmore, R., Warnock, G. M., & Durnin, J. V. G. A. Studies on expenditure<br />
of energy and consumption of food by miners and clerks, Fife, Scotland, 1952. Special<br />
report series No. 289, Medical Research Council, Her Majesty's Stationery Office,<br />
London, 1955.<br />
Glasow, W., & Muller, E. A. Arbeitsphysiologie, 1951, 14,319-321.<br />
Goldman, R. F., & Iampietro, P. F. Energy cost of load carriage. Journal of Applied<br />
Physiology, 1962, 17,675-676.<br />
Henderson, Y., & Haggard, H.W. The maximum of human power and its fuel. American<br />
Journal of Physiology,, 1925, 72, 264-282.<br />
Hermansen, L. Anaerobic energy release. Medicine and Science in Sports, 1969, 1,32-38.<br />
Hewes, D. E. Analysis of self-locomotive performance of lunar explorers based on<br />
experimental reduced-gravity studies. NASA TN-D-3934, National Aeronautics and<br />
Space Administration, Washington, D.C., May 1967.<br />
lampietro, P. F., Vanghan, J. A., MaeLeod, A. R., Welch, B. E., Marcinek, J. G., Mann, J. B.,<br />
Grothecr, M. P., & Friedemann, T. E. Caloric intake and energy expenditure of eleven<br />
men in a desert environment. TR EP-40, Hq., Quartermaster Research and Development<br />
Command, Natick, Mass., October 1956.<br />
Jones, R., & Taylor, C. L. Metabolic effects of work and heat in a simulated pilot's task.<br />
WADC TR 56-2, Acro Medical Laboratory, Wright Air Development Center,<br />
Wright-Patterson AFB, Ohio, April 1956.<br />
Kark, R. M., Croome, R. R. M., Cawthorpe, J., Bell, D. M., Bryans, A., MacBeth, R. J.,<br />
Johnson, R. E., Consolazio, C. F., Poulin, J. L., Taylor, F. H. L., & Cogswell, R.<br />
C. Observations on a mobile Arctic force. The health, physical fitness, and nutrition of<br />
Exercise "Musk Ox"-February-May, 1945. Journal of Applied Physiology, 1948,1,<br />
73-92.<br />
Karpovich, P. V. Phys/otogy of muscular activity. (4th ed.) Philadelphia: W. B.<br />
Saunders, 1953.<br />
Karvonen, M. J., & Turpeinen, O. Consumption and selection of food in competitive<br />
lumber work. Journal o[Applied Physiology, 1954, 6,602-612.<br />
Kincaide, W. C. In Apollo Lunar Symposium. NASA Manned Spacecraft Center, Houston,<br />
Texas, 1966. Pp. 25-27.
878 Bioastronautics Data Book<br />
Kleiber, M. The titre of life: An introduction to animal energetics. New York: Wiley, 1961.<br />
LaChanee, P. A. Nutrition and stresses of short term space flight. In: Conference on<br />
Nutrition in Space and Related Waste Problems, NASA SP-70, National Aeronautics and<br />
Space Adminislxation, Washington, D.C., 1964. Pp. 71-78.<br />
Lawton, R. W. Food reserves on space trips. Paper 42, Proceedings of Xlth International<br />
Astronautical Congress, Stockholm 1960.<br />
Lehninger, A. L. Bioenergetics: The molecular basis of biological energy transformations.<br />
New York: W.A. Benjamin, 1965.<br />
Littell, D. E., & Joy, R. J. T. Energy cost of piloting fixed- and rotary-wing aircraft. Journal<br />
of Applied Physiology, 1969, 26, 282-285.<br />
Luthman, G., & Lundgren, N. Studies of working methods in Swedish forestry. In<br />
Proceedings of VIIIth International Management Congress, Stockholm, 1947.<br />
Margaria, R., Ccretelli, P., Aghemo, P., & Sassi, G. Energy cost of running. Journal of<br />
Applied Physiology, 1963, 18,367-370.<br />
Maxfield, M. E., & Smith, P. Abbreviated methods for the measurement of oxygen<br />
consumption in work physiology. Human Factors, 1967, 9,587-594.<br />
Mayer, J. Exereise and weight control. In: Exercise and fitness. A collection of papers<br />
presented at the Colloquium on Exercise and Fitness, University of Illinois College of<br />
Physical Education and The Athletic Institute, Monticello, Illinois, December 1959.<br />
Morehouse, L. E., & Cherry, R. B. Energy cost of progression. Harvard Fatigue Laboratory<br />
report to the National Academy of Sciences Committee on Quartermaster Problems,<br />
July 1945.<br />
Morehouse, L. E., & Miller, A. T., Jr. Physiology of exercise, (3rd ed.) St. Louis: C.V.<br />
Mosby Co., 1959.<br />
Nielsen, M., & Hanson, O. Maximale k_rperliche arbeit bei atmung O2-reich luft.<br />
Skandinatlan Archives of Physiology, 1937, 76, 37.<br />
Passmore, R., & Durnin, J.V.G.A. ttuman energy expenditure. Physiological Reviews, 1955,<br />
35,801-839.<br />
Passmore, R., Thomson, J. G., & Warnock, G. M. A balance sheet of the estimation of<br />
energy intake and energy expenditure as measured by indirect calorimetry, using the<br />
Kofranyi-Michaelis calorimeter. British Journal of Nutrition, 1952, 6,253-264.<br />
Pollack, H., French, C. E., & Berryman, G. H. Calories expended in military activities.<br />
Bulletin of the U.S. Army Medical Department, 1944, 74,110-1 ]4.<br />
Pugh, L. G. C. E. Muscular exercise on Mount Everest. Journal of Physiology, 1958,141,<br />
233-261.<br />
Ramzin, S. Study of the energy balance in soldiers of the Yugoslav Army. Vojno-Sanit.<br />
Pregled., 1948, 5, 131-144.<br />
Richardson, D. T., & Campbell, W. Report on the investigation of the energy expenditure<br />
of the British soldier in India. Government of India Press, Calcutta, 1927.<br />
Rjabko, N. A., & Agapov, N. I. Experiences in organizing control of physical condition and<br />
feeding in the forces. Vojenno-medicinskij Zurnai, 1947, 10,3-6.<br />
Robertson, W. G., & Wortz, E. C. Effect of hmar gravity on metabolic rates. Aerospace<br />
Medicine, 1968, 39,799-805.<br />
Robertson, W. G., & Wortz, E. C. Evaluation of the metabolic cost of locomotion in an<br />
Apollo space suit. NASA CR-102154, National Aeronautics and Space Administration,<br />
Washington, D.C., 1970.<br />
Robinson, S. Experimental studies of physical fitness in relation to age. Arbeitsphysiologie,<br />
1938, 10,251-323.
Work, Heat, and Oxygen Cost 879<br />
Rodahl, K., & Issekutz, B., Jr. Physical performance capacity of the older individual. In K.<br />
Rodahl & S. M. Horvath (Eds.) Muscle as a tissue. New York: McGraw-Hill Book Co.,<br />
Inc., 1962.<br />
Rose, M. S. The foundations of nutrition. (4th ed.) London: Macmillan, 1944.<br />
Roth, E. M. Bioenergeties of space suits for lunar exploration. NASA SP-84, National<br />
Aeronautics and Space Administration, Washington, D.C., 1966.<br />
O<br />
Saitin, B., & Astrand, P. O. Maximal oxygen uptake in athletes. Journal of Applied<br />
Physiology, 1967, 23,353-358.<br />
Saltin, B., Blomquist, G., Mitchell, J. H., Johnson, R. L., Jr., Wildenthal, K., and Chapman,<br />
C. B. Response to exercise after bedrest and after training. Circulation, 1968, 38,<br />
Supplement 7.<br />
Shephard, R. J. A nomogram to calculate the oxygen-cost of running at slow speeds.<br />
Journal of Sports Medicine and Physical Fitness, 1969, 9,10-16.<br />
Turner, D. The energy cost of some industrial operations. British Journal of Industrial<br />
Medicine, 1955, 12, 237-239.<br />
U.S. Navy. Bureau of Medicine and Surgery. Submarine medical practice. Wa_ington,<br />
D.C., 1956.<br />
Webb, P., Metabolic heat balance data for 24-hour periods. International Journal of<br />
Biometeorology , 1971, 15,151-155.<br />
WelJb, P., & Annis, J. F. Cooling required to suppress sweating during work. Journal of<br />
Applied Physiology, 1968, 25,489-493.<br />
Webb, P., Annis, J. F., & Troutman, S. J., Jr. Human calorimetry with a water-cooled<br />
garment. Journal of Applied Physiology, 1972, 33, 412418.<br />
Webb, P., Troutman, S. J., Jr., & Annis, J. F. Automatic cooling in water cooled space suits.<br />
Aerospace Medicine, 1970, 41,269-277.<br />
Weir, J. B. deV. New methods for calculating metabolic rate with special reference to<br />
protein metabolism. Journal of Physiology, 1949, 109, 1-9.<br />
Welch, B. E., Morgan, T. E., Jr., & Ulvedal, F. Sealed cabin experimentation. Journal of<br />
Agricultural Research Service, 1961, 31, 1541-1544.<br />
Wilkie, D. R. The production of mechanical work by man. MAPAC Communication,<br />
(England) 1957.<br />
Wortz, E. C., Robertson, W. G., Browne, L. E., & Sanborn, W. G. Man's capability for<br />
self-locomotion on the moon. Vol. I, Detailed report, NASA CR-1402. Vol. II,<br />
Summary report, NASA CR-1403, National Aeronautics and Space Administration,<br />
Washington, D.C., 1969.<br />
Zechman, F. W., Chemiak, N. S., & Hyde, A. S. Ventilatory response to forward<br />
acceleration. WADC TR 59-584, Aerospace Medical Laboratory, Wright Air<br />
Development Center, Wright-Patterson AFB, Ohio, September 1959.
CHAPTER 19<br />
COMBINED ENVIRONMENTAL STRESSES<br />
by<br />
Raymond H. Murray, M.D.<br />
Indiana UniversiW School of Medicine<br />
and<br />
Michael McCally, M.D., Ph.D.<br />
Aerospace Medical Research Laboratory<br />
Wright-Patterson Air Force Base<br />
Man lives and functions in a physical environment that includes thermal,<br />
electromagnetic, and mechanical energies as well as chemical agents which affect<br />
the function of his body. In certain life situations and occupations, the physical<br />
environment may produce significant subjective responses, or strain. The<br />
energies and agents responsible for these effects are referred to as environmental<br />
stresses. Many environmental stresses, such as altitude, temperature, acceleration,<br />
vibration, noise, hypoxia, and radiation have been well studied in the<br />
laboratory and are the classic subject matter of environmental physiology. In<br />
most instances, a single environmental stress is studied as a controlled dependent<br />
variable in a specialized laboratory facility. Yet in normal circumstances, one<br />
rarely experiences exposure to a single environmental stress, but rather to an<br />
intricate interplay of several stresses. An astronaut is especially likely to<br />
experience complex environmental interactions. During reentry, he may be<br />
exposed to vibration which may alter his visual acuity; his visual performance<br />
might also be affected by simultaneous exposure to acceleration, noise, heat, and<br />
hyperoxic breathing gas mixtures, as well as prior exposure to the decondition-<br />
ing effects of prolonged confinement, inactivity, and weightlessness.<br />
Relatively few laboratory studies have described the tolerance levels,<br />
physiological effects, or performance degradation during simultaneous or<br />
sequential exposures to two environmental stresses, and fewer still have involved<br />
three or more simultaneous stresses. The available literature on combined<br />
environmental stress is summarized and discussed in this chapter. Although a<br />
Reviewed by John P. Meehan, M.D., University of California School of Medicine.<br />
881
882 Bioastronautics DataBook<br />
moderately largebibliography<br />
on combined stress can be accumulated, few<br />
studies have actually been addressed to the question of combined stress<br />
interactions (Broadbent, 1963; Dean & McGiothlen, 1964). Most studies of<br />
combined environmental stress are accidents of experimental design or are concerned<br />
with ancillary problems.<br />
A number of obvious factors have limited the study of combined environmental<br />
stress in spite of the obvious operational importance of such work. First,<br />
experimental design is excee_tingly complex. The possible number of combina-<br />
tions and permutations of even a small set of environmental stresses is very large.<br />
Economy dictates that one select for study in the laboratory only stress<br />
combinations of particular scientific interest and relevance to a given mission,<br />
occupation, or life style. Second, this type of research requires complex experimental<br />
facilities not generally available. Finally, to assure valid conclusions, large<br />
numbers of subjects are required.<br />
This chapter is limited to laboratory or exceptionally well-defined field<br />
studies. A number of studies of "combined stress" are available that report<br />
subject responses in an operational or field situation. The inflight data for<br />
astronauts is a case in point. These data describe the physiological responses of<br />
men exposed to a combination of weightlessness, confinement, noise, hyperoxia,<br />
radiation, and various acceleration forces. Unfortunately, in the operational<br />
setting, appropriate experimental design and controls are usually not possible, so<br />
that a response (decrease in red cell mass, for example) must be taken as a<br />
response to the environment as a whole. It is rarely possible to know which<br />
stress, or which combination of stresses, is responsible for the observed response.<br />
Operational or field studies may be useful to measure accurately the environment<br />
and so define the conditions to be simulated and studied in the laboratory.<br />
Such studies may also point up stress combinations of operational concern and<br />
thereby complement laboratory work. However, the majority of operational or<br />
field studies of environmental stress must be excluded from a consideration of<br />
combined stress interactions. Stress interaction, at present, can only be<br />
examined in specific laboratory situations where the necessary experimental<br />
design can be applied and tight control of conditions assured.<br />
Combined Stress Interactions<br />
The underlying hypothesis of combined stress research is that environmental<br />
factors interact in a systematic fashion which can be measured and/or predicted.<br />
Characterization of Interaction<br />
Environmental stress combinations may be characterized by four descriptors:<br />
(1) order of occurrence, (2) duration of exposure, (3) severity of exposure,<br />
and (4) type of interaction.<br />
Order of Occurrence. Definitions of the pattern or temporal order of<br />
exposure to combined stresses are straightforward. Stresses are simultaneous<br />
when two or more stresses are applied concurrently; they are sequential when<br />
applied in order, one after another. Note that differing sequences may give
Combined Environmental Stresses 883<br />
different effects, and that the rate and duration of intermittency will sometimes<br />
alter effects. Stresses are complex when the pattern of application is not clearly<br />
simultaneous or sequential; this includes combinations that are both simultaneous<br />
and sequential, time varying, intermittent patterns, and other complex<br />
profiles.<br />
Duration of Exposure. Arbitrary definitions and categorizations of combined<br />
stress durations cannot be made because of the complexities of the individual<br />
stresses as well as their interactions. The following functional definitions arc<br />
suggested. Stresses may be referred to as transient when a steady-state subject<br />
response is never achieved or where physiological compensatory mechanisms are<br />
inadequate. The term sustained applies when a steady state is achieved and<br />
compensation is adequate. This refers to exposures of generally less than 24<br />
hours. It must be understood that certain physiological responses to environ-<br />
mental stress, and probably to interactions involving these stresses, may take<br />
much longer periods to achieve a steady state; for example, acclimatization to<br />
heat and altitude. The terra chronic denotes exposures lasting longer than 24<br />
hours and includes continuing day-to-day exposures, such as occupational<br />
stresses.<br />
Severity of Exposure. The determination of the severity or intensity of<br />
combined stress exposure is complicated by differing and often incompatible<br />
units of measurement of subject response. Such measurements must begin with<br />
the identification of an appropriate index (or indices) of body response, or<br />
strain. Subjective assessment can also be used as a quantitative measure of stress<br />
response. In this case, the subject is asked to describe how severe the environment<br />
was, using descriptors such as noticeable, mild, moderate, severe, very<br />
severe, and intolerable. Although simple in concept, such data are often of great<br />
utility and considerable validity. Stevens (1951) has shown that reliable and<br />
valid scales, particularly ratio scales, can be derived as a result of subjective<br />
assessment. The Cooper pilot opinion rating scale of aircraft handling and ride<br />
quality is an excellent example of the value of the subjective rating scale<br />
(Cooper, 1957). Modifications of this technique may be an important tool with<br />
which to rank the relative severity of combined stress environments. The use of<br />
criteria based upon diminished ability to perform a particular task which is<br />
relevant to the mission under study is also a particularly sensitive and useful<br />
index of response.<br />
Type of Interaction. Environmental stresses may, hypothetically, interact in<br />
three general ways. When stresses act by addition, the physiological effect of a<br />
combination of environmental stresses is equal to the linear sum of the single<br />
effects of the stresses when presented separately. When synergism is involved,<br />
the effect of the combination is greater than the simple sum of the effects of<br />
each stress alone. Antagonism provides a total effect which is less than the linear<br />
sum of the single effects. Dean and McGlothlen (1964) describe in detail the<br />
complexities of the analysis of such interactions, including the use of analysis of<br />
variance models.<br />
The criteria used to define a stress effect or endpoint must always be<br />
specified. A combination of stressors that is synergistic by one criterion might be
884 Bioastronautics DataBook<br />
antagonistic byanother. Forexample, +Gz acceleration andGy.rotationmight<br />
besynergistic oradditivewithregardto heartratebutantagonistic withregard<br />
to peripheral lightloss.Antagonistic interactions shouldbeconsidered forthe<br />
development of newprotective devices.<br />
Thedefinitionsofthe words interactive and additive are tied to experimental<br />
design and analysis. For example, using three stresses, altitude (A), noise (N),<br />
and heat (H), assume the likely use of an experimental design based on Analysis<br />
of Variance (ANOVAR).<br />
ADDITION<br />
SYNERGISM<br />
EA, N,H = E A + E N + E H<br />
E A,N,H, >E A + E N + E H<br />
ANTAGONISM < EA, N, H<br />
EA, N,H<br />
Where:<br />
E A, N, H<br />
EA<br />
EN<br />
EH<br />
= Total effect of altitude, heat, noise<br />
: effect altitude alone<br />
= effect noise alone<br />
= effect of heat alone<br />
Such a hypothetical ANOVAR model (after Dean & McGlothlen, 1964) implies<br />
that a set of scores by a single subject will be made up of the grand mean, the<br />
three main effects of the individual stresses, four interaction terms, and an error<br />
term. Groups of subjects and time or order are additional sources of variance and<br />
add additional terms to the equation. The hypothesis of additivity is checked by<br />
testing the interaction terms of the ANOVAR model for statistical significance.<br />
ANOVAR assumes additivity, and, if this assumption is met, the interaction<br />
effects will be zero, that is, there will be no interaction. Thus, in an ANOVAR<br />
model, when addition of effects is present, there is no interaction. Presence of<br />
statistically significant interaction terms contradicts the addition of effects<br />
hypothesis, and the remaining possibilities of synergism or antagonism are tested<br />
by examining the effect of the single stresses not in combination.<br />
Tolerance to Combined Stress<br />
In exposure to most environmental stresses, tolerance is defined by certain<br />
unique subjective or objective criteria which determine the endpoint of the
Combined Environmental Stresses 885<br />
exposure; for example, central light loss during +G z acceleration or rapidly rising<br />
body temperature in heat. In general, a review of the available literature<br />
(discussed later) suggests that tolerance to a particular stress combination is<br />
determined essentially by that stress which, if taken alone, would be the most<br />
severe. Rather than define a new tolerance endpoint, it has usually been found<br />
easier to ask, "How does a second stress alter the tolerance to a primary stress?"<br />
This approach provides a useful construct for organizing the available literature<br />
into sets of combined environmental stresses; primarily acceleration, or primarily<br />
heat, etc. It is usually possible to ascertain in a combined stress study which<br />
stress was the most severe and which stress was the one of primary interest to<br />
the authors. The literature review presented in this chapter is organized in this<br />
manner.<br />
Interactions of Environmental Stresses with Host Factors<br />
Environmental physiology describes the interaction of physical environments<br />
with the subject or host in terms of the response or modification of the host. It<br />
is ordinarily understood that the initial condition of the host is that of complete<br />
normality: a healthy young adult (male) with average physical characteristics,<br />
unacclimatized and physically fit, rested, relaxed, lightly clothed, unrestrained,<br />
without protective equipment, drugs or other countermeasures, and without task<br />
assignments. In real life situations, this is rarely the case, and in space missions,<br />
few, if any, of these conditions may obtain. However, any deviation from this<br />
"normal" state will modify the host and potentially alter, and perhaps<br />
determine, the effects of environmental stress. It is important to separate clearly<br />
what factors are considered to reside in the host. For example, exercise, though<br />
often considered to be an environmental stress, is in fact a subject state or host<br />
factor. Exercise is part of a continuum of activity ranging from strict inactivity,<br />
as in plaster cast immobilization, to maximal rhythmic exertion. Other factors<br />
often considered environmental stresses, but which should be considered host<br />
factors, are changes in blood or body fluid volume, change in sleep pattern, and<br />
changes in mental set, as in anxiety. The distinction between host and environmental<br />
factors are necessary for a correct definition of the subject matter of<br />
combined environmental stress.<br />
The subject or host can be represented as the summation of all the<br />
physiological and psychological factors which are relevant to the environmental<br />
conditions under consideration. The descriptors in figure 19-1 are a set of factors<br />
which must be defined to characterize the host. Some of these are relatively<br />
fixed, such as height, weight, and age. Others, such as physiological, psychological,<br />
and social factors, may vary over wide ranges and profoundly alter the<br />
response of the human organism to its environment.<br />
Of special importance for space flight problems is "task loading," which<br />
includes all of those demands for sensory, higher mental, and motor performance<br />
required for a particular mission. The requirement to perform a<br />
complex maneuver in a high performance vehicle while responding to multiple<br />
communication channels and simultaneously monitoring several visual displays,<br />
for example, may alter the response to environmental stress. Task loading is<br />
arbitrarily included for the purposes of this discussion under reciprocative
886 Bioastronautics Data Book<br />
factors. It represents a segment of the continuous interaction between a subject<br />
and his environment.<br />
\\\.<br />
\<br />
\<br />
\ \<br />
\\<br />
\<br />
\\<br />
\<br />
\<br />
REClPROCATIVE<br />
\ \<br />
FACTORS \ \<br />
\<br />
Task Loading_ \<br />
Clothing _\<br />
Seating-Restraint_<br />
Incentives<br />
HOST<br />
FACTORS<br />
ENVIRONMENTAL<br />
FACTORS<br />
Electromagnetic<br />
Thermal<br />
Atmospheric<br />
Biodynamic<br />
Chemical-Toxic<br />
Temporo-Spatial<br />
Miscellaneous<br />
Figure 19-1. Three dimerrsional representation of the variables which must be controlled or<br />
otherwise defined and specified when conducting environmental research. (Modified from<br />
Rohles, 1965)<br />
Complexity of the Problem<br />
A study of combined environmental stresses is complex in all its aspects.<br />
Definition of each of the environments of concern is sometimes difficult; inde-<br />
pendent and simultaneous measurements of each environment of the pertinent<br />
combination may prove impossible under field conditions. The temperature,<br />
humidity, noise, acceleration, and vibration loads to be encountered by the pilot<br />
of a particular aircraft on a specific mission are usually not available to either the<br />
research scientist or systems designer. The problem of combined environmental<br />
stress can only be approached operationally, by studying the specific subsets or<br />
combinations which are peculiar to specific mission phases.<br />
A related problem is the limitation of simulator capability. The production<br />
of combined stress environments in the laboratory requires the use of complex<br />
simulators, available, in general, only in large governmental or industrial facili-<br />
ties. Such facilities are complicated and expensive to operate and limit the scope<br />
of potential work in this field. Presently operating combined stress facilities are<br />
discussed later.
Combined Enviromental Stresses 887<br />
Another related complexity in the area of combined stress research is the<br />
problem of simulation versus representation. For example, a study of heat,<br />
noise, and vibration devised to simulate a real vehicle-mission combination<br />
would usually generate specific data which are not often representative of the<br />
general problem of heat, noise, and vibration. Specificity reduces generalizability.<br />
Combined stress studies are generally so large in scope, expensive to<br />
conduct, and difficult to replicate that this aspect of the problem becomes very<br />
complex. It is obvious that no general body of scientific information about<br />
combined stress interactions will develop until relatively nonspecific "representational"<br />
simulations are examined.<br />
Another difficult problem in this area is in the selection of measures. A<br />
physiological measure appropriate to one environment may be relatively<br />
meaningless in another. For example, peripheral light loss, useful in acceleration<br />
research, has relatively little meaning in thermal stress. It can be fairly stated<br />
that, until a major group of environmental stresses is examined in all possible<br />
combinations using the same measures (preferably in the same subjects or<br />
comparable populations), no significant progress will be made in combined stress<br />
physiology. Only two or three such programs have ever been considered. A<br />
closely related problem concerns human performance measures. Do environmental<br />
stresses in combination affect the subject's performance more severely<br />
than when applied singly? To answer this question, a battery of performance<br />
tests is required which is specific, valid, and equally pertinent to a number of<br />
stresses. A task which is sensitive and specific for vibration may be insensitive to<br />
heat stress. The development of such a performance battery is difficult and<br />
apparently has not yet been successfully achieved. Another important problem<br />
with the use of performance measures is the variability between and among<br />
subjects, which tends to make tests insensitive to small effects. Performance<br />
measurements must be developed that relate directly and monotonically to stress<br />
intensity, that are generalizable to multiple environments, and that are valid and<br />
sensitive measures of operationally relevant tasks. Recent work suggests that<br />
certain parameters of a linear human operator model, including the describing<br />
function and the remnant term, may represent such measures (Jex & Allen,<br />
1970).<br />
The Use of Models<br />
The use of mathematical and analog models has recently been adapted from<br />
engineering practice to the study of physiological systems and offers a number<br />
of advantages in handling the complexities involving combined stress studies.<br />
Modeling activities allow for the explicit definition of simplifying assumptions of<br />
the system in question, incorporate the best available information concerning<br />
the system, and, when operated, point out data needed to further refine the<br />
model, thereby suggesting new experiments. Good electrical analog models are<br />
available for human thermal regulation and for cardiovascular responses to<br />
positive acceleration. Attempts to combine such models should allow predictions<br />
to be made and hypotheses phrased concerning the interaction of heat and<br />
acceleration (particularly on the cardiovascular system). Human psychomotor<br />
performance is now being modeled with similar techniques.
888 Bioastronautics DataBook<br />
Units<br />
Approachto the Study of Combined Environmental Stress<br />
Each environmental stress must be defined and quantified in appropriate<br />
measurement units and its pattern and time profile described in detail. A<br />
complex environment can sometimes be described by correlating secondary<br />
factors with the primary stress, and an integrated unit of stress devised which<br />
represents the complete environment. For example, in considering heat stress,<br />
temperature can be weighted with humidity and airflow to give an "effective<br />
temperature." Unfortunately, practical, comprehensive stress units have not<br />
been standardized for most environments.<br />
Simple Relationships<br />
When the effect of an environmental stress is defined in terms of the evoked<br />
physiologic response or strain, various degrees of severity of another stress can<br />
be evaluated by their effect on the primary stress-strain pattern. These effects<br />
can be represented in two general ways.<br />
1. Change in the amplitude of response of the index of strain. For example,<br />
an increase in effective temperature of 90°F will be associated with a certain<br />
increase of heart rate. Increments of +Gz stress will alter this heart rate response,<br />
and the interaction of heat and acceleration can be presented in terms of<br />
increments of heart rate above control values. This can also be represented by<br />
percent change above control heart rate rise.<br />
2. Alteration of the rate of change of a physiological variable, but not the<br />
final amplitude. A temporal relationship can also be shown by demonstrating<br />
alteration in time to reach a definitive or arbitrary endpoint; the time-toperipheral<br />
light loss during +G z stress is shortened as effective temperature<br />
increases.<br />
Scaling<br />
Study of the interaction of environments is complicated by the inability to<br />
relate the different units and scales used to quantify the various environments.<br />
Effects of environmental stress can, however, be added or related to each other<br />
quantitatively by appropriate sealing or normalization procedures. Each stress<br />
carl be represented in terms of the degree of strain or physiologic response it<br />
produces in a subject. The scaling of a particular set of environmental stresses is<br />
a unique characterization of these individual stresses, and demands the detailed<br />
quantification of each environment being considered, and careful definition of<br />
the index of strain to be used. Because physiological systems are independent<br />
and nonlinear, strain values will hold only for the particular interactions which<br />
have been defined.<br />
Choice of Indices of Strain<br />
There are two prime considerations determining the choice of suitable<br />
indices of strain for evaluatilrg environmental interactions. First, the
Combined Environmental Stresses 889<br />
physiological or performance measure tobcusedmustbeaffectedmeasurably<br />
byeachof theenvironments understudy.Secondly, the measurement methods<br />
must be technically compatible with the constraints imposed by particular<br />
conditions in which the study will be carried out. In applied studies, indices<br />
would be chosen to provide operationally pertinent information regarding<br />
tolerance limits and performance decrements. The indices to be used must be<br />
individualized for each environmental interaction and for the test conditions in<br />
which the study will be done. Consideration must be given to defining common<br />
physiological pathways in the mecbanism of action of each stress. This concept<br />
is illustrated in figure 19-2. For example, the interaction of heat and vibration<br />
can be evaluated by using peripheral vascular responses as well as by changes in<br />
respiration, since each environment affects both of these indices. Under space<br />
flight conditions, peripheral vascular responses may not be determinable but<br />
ventilation changes could be measured accurately. On the other hand, sweat rate<br />
would not be a suitable index since it is probably not affected by short-term<br />
vibration.<br />
Combined Stress Data<br />
The data on physiological and performance responses of man and animals to<br />
combinations of environmental stress which are available in the literature are<br />
presented in tables 19-1 through 19-9. In search for an organizing principle, it<br />
was felt that in most instances the authors expressed a clear interest in one of<br />
the stresses or that one of the stresses was clearly prepotent. For example,<br />
Martin and Henry (1951) asked how heat exposure affects +G z acceleration<br />
tolerance, as defined by peripheral light loss. These authors' primary interest in<br />
acceleration stress is revealed in their choice of tolerance measures. If interested<br />
primarily in heat, they might have used rate of rise of rectal temperature as their<br />
criterion; if interested in combined stress effects, they would have chosen both<br />
peripheral light loss and rectal temperature responses, and discussed their results<br />
with regard to both criteria. For this reason, the tables are organized by<br />
reference to the "primary" stress, for example, COMBINED STRESS,<br />
PRIMARILY ACCELERATION.<br />
In a subject as complex as this, no literature survey is complete. There is no<br />
generally recognized descriptor for combined or multiple environmental stresses.<br />
The authors, therefore, urge that, in the future, investigators use the keywords<br />
"multiple environmental stres_s" or "combined stress" in the title or in the list<br />
of index or keywords of any relevant paper. At present, it is impossible to<br />
retrieve, by hand or computer, studies dealing with combinations of environmental<br />
stres_s. For example, heat and acceleration combinations are found by<br />
screening references dealing with cacb stre_ singly, a large retrieval.<br />
Facilities for Study of Combined Stress<br />
Facilities available in the United States for combined environment simula-<br />
tion have recently been surveyed and reviewed by Tierney (1969). In his article,<br />
primary attention is given to engineering tests of systems and hardware. In the<br />
last tO years, Tierney was able to find about 100 papers published on combined<br />
497-858 O 73 57
89O Bioastronautics Data Book<br />
E<br />
lP,<br />
QI<br />
,<<br />
k:<br />
"0<br />
c<br />
<<br />
II)<br />
c<br />
o<br />
t--<br />
8<br />
c<br />
o<br />
0.<br />
-.I<br />
t-.<br />
$<br />
.o_ o .I<br />
rr<br />
i<br />
E<br />
vt<br />
oJ<br />
e-<br />
e-<br />
e_<br />
O<br />
0<br />
_> ¢-<br />
i'_ .m<br />
o<br />
u ._<br />
,< ,.<br />
0 E<br />
,
Combined Environmental Stresses 891<br />
environment testing from numerous facilities throughout the United States.<br />
Only a limited number of man-rated or potentially man-rated combined stress<br />
facilities are available. All arc in government laboratories or in the research<br />
divisions of major aircraft companies. A number of single stress human facilities<br />
are available to which additional environments have been or could be added. For<br />
example, small shakers (vibration devices) have been added to human centrifuges<br />
at the National Aeronautics and Space Administration Ames Research Center,<br />
the Naval Air Development Center, Johnsville, Penn_lvania, and Deutsches<br />
Forschungs und Versuchsanstalt ftir Luft und Raumfabrt, Bad Godesbcrg,<br />
Federal Republic of West Germany. However, in none of these cases was the<br />
original centrifuge arm designed for the added vibration capability, and the<br />
shaker forces and displacements on these devices are very limited and well below<br />
most human tolerance levels. Many human thermal stress facilities include<br />
control of humidity and air motion in addition to temperature and are not<br />
included in this enumeration of combined strcs_ facilities. Table 19-10 is a<br />
summary of the major combined environmental stre_ test facilities presently<br />
operating in this country.<br />
It must be notcd regarding the table that the authors did not conduct a<br />
survey, and there may be other facilities with combined stress capabilities<br />
unknown to them. To the best of the authors' knowledge, however, only two<br />
facilities presently operating were established for the sole purpose of studying<br />
combined environmental stress: the Combincd Stress Test Facility, Boeing<br />
Corporation, Seattle, Washington, and the Dynamic Environment Simulator,<br />
Aerospace Medical Research Laboratory, Wright-Patterson Air Force Base, Ohio.<br />
These arc the only two facilities including moving-base (acceleration and/or<br />
vibration) capabilities.
892 Bioastronautics Data Book<br />
I<br />
e.<br />
o<br />
.<<br />
0<br />
L_<br />
c-<br />
O<br />
e"<br />
1.1.1<br />
I-" e-<br />
.<<br />
"0<br />
"0<br />
.<<br />
4-<br />
)<<br />
0<br />
O.<br />
T<br />
.ca<br />
0 --<br />
z < <<br />
e-<br />
0<br />
e=<br />
q_<br />
g<br />
5<br />
o<br />
L_<br />
g __<br />
8<br />
g<br />
o<br />
× 2<br />
0<br />
I "r<br />
>.<br />
z<br />
_-g<br />
,_ g,., "_ ,._ o- ¢0 _- ._<br />
e"<br />
o<br />
-s e- .--<br />
4)<br />
|<br />
0<br />
"1-<br />
0<br />
<br />
"0<br />
.<<br />
°_<br />
"0 "<br />
(o "-<br />
A<br />
.c r-<br />
_°- !<br />
co -- m
._t2<br />
1<br />
N i 8 _<br />
t: .c<br />
-4- 0,'- _ C:'Ct<br />
_ _ .s__<br />
o 'g g =<br />
,._ .- _<br />
m 0<br />
e_ ! N-o<br />
6<br />
z: z= c<br />
° _o= }o= _g<br />
t._ 1 -- Q- ",_<br />
t-- t- e'- t_ e" X<br />
.._ '_ -,_ --<br />
0 _ _ •<br />
_7 7 U_g _<br />
Combined Environmental Stresses 893<br />
d<br />
0<br />
E<br />
0<br />
t;<br />
£<br />
_m<br />
t_<br />
t_<br />
,_<br />
o<br />
E<br />
z
894 Bioastronautics Data Book<br />
,-'9<br />
rx_<br />
(/'2<br />
o<br />
8t.<br />
C<br />
O<br />
6 ,=<br />
t-<br />
lit<br />
I,-<br />
<<br />
v<br />
v- v<br />
< z < < <<br />
SE o<br />
° _ _-<br />
- _<br />
•-- _'d<br />
'-_ _ 8 CO<br />
c _ c<br />
,_ ,_ _o _ .o_<br />
0 '- ¢'_<br />
_,-_ _._<br />
_ - _r_ - _._ C<br />
_.-<br />
_,_<br />
_'g<br />
_÷<br />
¢-<br />
8<br />
_m<br />
_.-_<br />
_ _._ _ _ _._<br />
0<br />
u ,-.9.<br />
c<br />
0<br />
Z<br />
.__" _ 8 =<br />
E,
v-<br />
g<br />
c<br />
Q<br />
0<br />
Z<br />
e-<br />
¢o s.<br />
E_<br />
.-- ¢.j<br />
"0 _ c-<br />
A m ¢o<br />
rr "_<br />
t.D ¢_ e-<br />
...J C e_<br />
E<br />
p_<br />
v==<br />
v<br />
g<br />
'E<br />
e=<br />
X<br />
0J<br />
"-_1_ O _<br />
g<br />
"O<br />
g<br />
c<br />
O<br />
O<br />
z <<br />
tlJ<br />
UJ<br />
¢f_ rs<br />
> e-<br />
¢1.<br />
e" p._<br />
'E<br />
_ v<br />
_E<br />
_8<br />
_g<br />
_E<br />
e- i-<br />
8_<br />
Combined Environmental Stresses 895<br />
e=<br />
E c<br />
I_.._ _ ",,_<br />
g<br />
g<br />
°m<br />
lyl ._<br />
5;c<br />
O<br />
I1:<br />
_ A<br />
896 Bioastronautics Data Book<br />
Z<br />
¢0<br />
O<br />
c-<br />
O<br />
t.<br />
-- i<br />
m 0)<br />
g<br />
g<br />
L.<br />
O<br />
l<br />
m<br />
iLl C<br />
A<br />
z<br />
¢0<br />
v<br />
m<br />
•_ ._ o ._<br />
"I" c c -_ ",_ c<br />
¢,_<br />
g._<br />
A<br />
'E<br />
c<br />
O<br />
A<br />
r_<br />
..2"<br />
¢0<br />
g<br />
t I I<br />
r- c<br />
I<br />
..-2<br />
•" g g_<br />
O<br />
I-<br />
e-<br />
E<br />
z<br />
X<br />
I-<br />
t-<br />
._ O<br />
g<br />
g<br />
•- O<br />
_._,<br />
._._<br />
:3 ¢-_<br />
|.__ :<br />
.,_<br />
>
Combined Environmcntal Stresses 897<br />
0<br />
ll.I<br />
0<br />
0z<br />
8 ><br />
_- E<br />
0 "-<br />
I--- t._ tlJ<br />
-- 0<br />
0 0<br />
Z Z rr<br />
_ __<br />
"I" Z CO "_<br />
E__<br />
8_<br />
_o<br />
_o<br />
E<br />
E _<br />
0 0<br />
,_ E<br />
" r,<br />
m 0<br />
II m
898 Bioastronautics Data Book<br />
0<br />
(13<br />
I<br />
.=.<br />
0<br />
t/)<br />
0<br />
LIJ<br />
t_ to<br />
A<br />
f,,,<br />
tO r-<br />
_ ,_<br />
.J _o --" .J iSifi<br />
,__ _<br />
:*2_- _ "_<br />
,<<br />
I<br />
,< z z<br />
I<br />
,- _ _ _<br />
•- _<br />
CL ,_ "_ ¢"<br />
_ .-<br />
t_<br />
• - A<br />
_ _,.-._ _ _<br />
-_- __ _- --_ _-!<br />
_-_- -_ -_ _<br />
=I__<br />
Z<br />
c-<br />
O<br />
o,,,<br />
e-,<br />
_ c -
I<br />
.J<br />
E<br />
O<br />
q.2<br />
o<br />
t-<br />
O<br />
.i<br />
t-<br />
I<br />
UJ<br />
i_<br />
E .=_<br />
?<br />
n<br />
f.cJ<br />
,<br />
6<br />
8_<br />
t.n<br />
G_<br />
Combined Environmental Stresses 899<br />
.2.'<br />
V _ CO<br />
o_ o _<br />
.E_ o<br />
_ 2<br />
__o<br />
8_<br />
0 _<br />
V_<br />
.E .__<br />
Z Z Z Z<br />
_,._ £<br />
_- 0<br />
_ o<br />
o J=_ E<br />
A<br />
_o_<br />
x ¢_ _<br />
.-- t- 0<br />
_0 _'o .- o<br />
x% 20 - -<br />
° _% - ;-<br />
o_ _ o_<br />
•,_ -_<br />
.o _ _o o<br />
'6<br />
_._ .E o<br />
_0<br />
O0 O0 OU<br />
_'_ _'_ _<br />
0
900 Bioastronautics Data Book<br />
"a<br />
0", tU<br />
..=<br />
0<br />
L)<br />
1 ¢0<br />
_.__<br />
_-,_<br />
,-2<br />
r,,<br />
ffl .c _ o<br />
¢-<br />
0<br />
C<br />
1<br />
_ "_2"<br />
7<br />
1<br />
"6<br />
,_'r g g $<br />
.-2 _ _ g<br />
O_<br />
e-<br />
t_<br />
g<br />
t¢X<br />
z < z<br />
t3<br />
o<br />
_D f-<br />
0<br />
v £I<br />
el" m<br />
W<br />
I.U<br />
:Tg<br />
e_<br />
==<br />
1¢<br />
-r-_<br />
,,s<br />
><br />
A<br />
"0<br />
0<br />
0<br />
_ 0<br />
Iz e_<br />
_ l<br />
_ E<br />
g =._=<br />
c<br />
=o<br />
"O<br />
g<br />
-r<br />
Eo<br />
,h<br />
..z"<br />
1¢<br />
g<br />
c<br />
e-<br />
I.--v<br />
Z<br />
el,<br />
's e-<br />
E<br />
e_ r<br />
E_<br />
t"q<br />
I 'r.<br />
x.$<br />
0<br />
E'_<br />
"O<br />
g<br />
_g<br />
•"r ._
).<br />
v m<br />
.__o_ -6o_3 _<br />
z z _<br />
_o<br />
_ _o<br />
o . o 8<br />
o omo<br />
_ - _o<br />
"_ ._ _ _ _<br />
- ,E o<br />
E _ _<br />
_ _ o rro _<br />
"->_ .__ E _<br />
_ . _> _<br />
=__ .>_ -<br />
o o _ V _ _ ._-_<br />
0 ,a<br />
_<br />
•._ .__<br />
_ 0<br />
Combined Environmental Stresses 901
9O2<br />
O<br />
_J<br />
Bioast_onaUt;'cs Data _ook<br />
o<br />
o<br />
J:
_v<br />
dO<br />
..I ill ts_<br />
0<br />
(0<br />
O'J<br />
Combined Environmental Stresses 903<br />
_ _ E .-<br />
_ ._ o<br />
"; "; '._ IE iz'_ i_ ";<br />
.0<br />
_O<br />
"0<br />
_8<br />
O_<br />
_o_o<br />
_8<br />
8<br />
=_ .<br />
_+<br />
o<br />
.__<br />
0<br />
E<br />
e_<br />
C<br />
0 _<br />
X e,_<br />
0 _<br />
.__ _'_<br />
_ __<br />
,- _ _ .__<br />
o -<br />
o g<br />
E o ._-<br />
(¢} _)_,- "I"<br />
___, _.. _ _<br />
- _ ._ ._._<br />
c<br />
_:SE<br />
_,'_<br />
•_- _<br />
E_<br />
.__'o_<br />
0 e-<br />
_o _<br />
t-<br />
O<br />
m<br />
u.__<br />
'_o='__8_ _<br />
-r_ _° "r _ 8E "r_<br />
_8
904 Bioastronautics Data Book<br />
g¢<br />
°_<br />
O<br />
OQ<br />
e-<br />
°_<br />
c<br />
c__<br />
gE<br />
c-<br />
O<br />
ew<br />
IJJ<br />
L.<br />
g ®<br />
o<br />
".- g g<br />
_"a z<br />
.$<br />
o o<br />
0<br />
"- _<br />
m _ __ C<br />
0<br />
,-- "_ "_<br />
._-_ _ i-_<br />
{ ""<br />
e. o o o<br />
rO'_ z_<br />
"0<br />
C<br />
,o<br />
_E<br />
g o ®<br />
°<br />
e_<br />
c-<br />
O<br />
Z<br />
eo<br />
o<br />
o<br />
e-<br />
o<br />
"0<br />
0<br />
0<br />
g<br />
P,<br />
0<br />
4_<br />
"0<br />
X ,_-<br />
0 a_
Combined Enviromental Stresses 905<br />
to O. _ ¢o r-,<br />
> c E o<br />
_i_ _ - _:i_ _-_<br />
,,_ ,u 0<br />
z < _> < > _ - ._-<br />
"0 "0<br />
t_<br />
r- c-<br />
O .o ._m<br />
487-858 0 - 73 - 58<br />
A<br />
_ _!<br />
>" 0<br />
>,<br />
"0<br />
•._ ._
906 Bioastronautics Data Book<br />
t-.<br />
o<br />
v<br />
e_<br />
o_<br />
o_<br />
o_<br />
o<br />
8L.<br />
O<br />
¢.n<br />
g<br />
o<br />
ew<br />
UJ<br />
L..<br />
..'3 E_I<br />
_-_<br />
-g<br />
g<br />
o<br />
c es<br />
O<br />
es >,<br />
E_<br />
.$<br />
_.__<br />
_,<br />
E'__<br />
o<br />
e- es<br />
g<br />
_ o<br />
E o<br />
r- ',_<br />
_ .-_<br />
o 3_<br />
_ .__,<br />
0<br />
o-<br />
0<br />
0 0 _.,<br />
_ -ge<br />
_ _._<br />
-_<br />
_ 5z
I<br />
q_<br />
.=.<br />
.-=<br />
E-_<br />
3<br />
=<br />
e.<br />
0_<br />
o<br />
L_<br />
_r<br />
Combined Enviromental Sresses 907<br />
uo!z!sodtuoo MeJC)<br />
_.ue_d! nb:l/6U !4J,OlO X<br />
o!xo.IJleO!LuoqO X<br />
deal S X<br />
ZseEIpOOM X<br />
_u !eJ_sel:l/ZUeUJeU!jUOO X X X<br />
uop!sodtuoO X X X X<br />
eJnsseJd X X X X<br />
sseussop,q6!eM<br />
es!oN X X<br />
_,selB<br />
uo!zeJq! A X X<br />
uo!ze_ol4 X<br />
uo!:l.eJet_o V "u!l X<br />
A_!oOlOA pu!M X<br />
A_!p!Lun H X X X X<br />
ploo x x x<br />
ZeOH x X x<br />
,46rI x<br />
o0.ouSelN<br />
o!J:l.Oal3<br />
6u!z!uol<br />
OAeMOJO!I/_<br />
g<br />
--I<br />
c<br />
0<br />
e-<br />
0<br />
a;<br />
E<br />
f0<br />
z<br />
!i°<br />
E<br />
_<br />
UJ -<br />
o _._<br />
,." _._.<br />
2<<br />
CD _-<br />
u _<br />
•_ _ _
908 Bioastronautics Data Book<br />
References<br />
Alexander, W. C., Sever, R. J., & Hoppin, F. G., Jr. Hypoxemia induced in man by sustained<br />
forward acceleration while breathing pure oxygen in a five pounds per square inch<br />
absolute environment. Aerospace Medicine, 1966, 37, 372-378.<br />
Andersen, K. L., Hellstrom, B., & Lorentzen, F. V. Combined effect of cold and alcohol on<br />
heat balance in man. Journal of Applied Physiology, 1963, 18, 975-982.<br />
Armstrong, H: G. Principles and practices of aviation medicine. (3rd ed.) Baltimore:<br />
Williams and Wilkins Co., 1952.<br />
Arseneva, M. A., Beliaeva, L. A., & Golobkina, A. V. Effects of combined action of<br />
acceleration, vibration and radiation on cell nuclei of the bone marrow in mice.<br />
Problemy Kosinicheskoi Biologii, 1965, 4, 373.<br />
Ashton, R., & Roberts, V. L. Effects of drugs on vibration tolerance. Arch. Int.<br />
Pharmacology, 1965, 155, 289-299.<br />
Benjamin, F. B., & Peyser, L. Effect of 0 2 on radiation resistance in mice. Aerospace<br />
Medicine, 1964, 35, 1147.<br />
Benson, V. G., Beckman, E. L., Coburn, K. R., & Chambers, R. M. Effects of weightlessness<br />
as simulated by total body immersion upon human response to positive acceleration.<br />
Aerospace Medicine, 1962, 33, 198-203.<br />
Bemadini, A. T. Effect of reduced pressure and varied gaseous environment on the osmotic<br />
fragility of rat red blood cells. Federation Proceedings, 1969, 28, 1165-1169.<br />
Bietti, G. B., & Giardini, A. The effect of anoxia on eye movements: I1. Comparative study<br />
of the action of anoxia and alcohol separately and together. Quarterly Journal of<br />
Studies on Alcohol, 1950, 11, 492.<br />
Blockley, W. V. Combined physiological stresses. In H. Haber (Ed.), Proceedings of a<br />
symposium on frontiers of man-controlled ]//ght. Los Angeles: The Institute of<br />
Transportation and Traffic Engineering, University of California, 3 April 1953.<br />
Bommarito, C. L., & Ramsey, N. K. Effects of combined environmental stress on humans.<br />
Proceedings of the Institute of Environmental Science, 1963, 577-585.<br />
Brady, J. F., & Newsom, B. D. Effect of positive pressure breathing on the vibration<br />
tolerance of the mouse. Aerospace Medicine, 1966, 37, 40.<br />
Broadbent, D. E. Differences and interactions between stresses. Quarterly Journal of<br />
Experimental Psychology, 1963, 15, 205.<br />
Brown, A. L., Vawter, F. G., & Marberger, J. P. Temperature changes in human subjects<br />
during exposure to lowered oxygen tension in a cool environment. Journal of Aviation<br />
Medicine, 1952, 23, 456.<br />
Bullard, R. W. Effects of hypoxia on shivering in man. Aerospace Medicine, 1961, 32,<br />
1143-1147.<br />
Bullard, R. W., & Crise, J. R. Effects of carbon dioxide on cold-exposed human subjects.<br />
Journal of Applied Physiology, 1961, 16, 633-638.<br />
Burgess, B. F. The effect of hypoxia on tolerance to positive acceleration. Journal of<br />
Aviation Medicine, 1958, 29, 754-757.<br />
Burgess, B. F. The effect of temperature on tolerance to positive acceleration. Aerospace<br />
Medicine, 1959, 30, 567-571.<br />
Carker, M. C., & Close, P. The effect of prior x-irradiation in the survival of mice in<br />
explosive decompression. Aerospace Medicine, 1963, 24, 774.<br />
Casey, H. W., Cordy, D., Goldman, M., & Smith, A. H. The influence of chronic acceleration<br />
on the effects of whole body irradiation in rats. Aerospace Medicine, 1967, 38, 451.
Combined Enviromental Stresses 909<br />
Chae, E. U. The influence of temperature upon the tolerance of mice to positive radial<br />
acceleration, Republic of Korea. Journal of Aviation Medicine, 1957, 5, 51.<br />
Clarke, N. P., Taub, H., Seherer, H. F., & Temple, W. E. Preliminary study of dial reading<br />
performance during sustained acceleration and vibration. AMRL-TR-65-110, Wright-<br />
Patterson Air Force Base, Ohio, 1965.<br />
Clemedson, C. J., & Nelson, A. Effect of combined whole body roentgen irradiation and<br />
high explosive blast injury in mice. Aeta. Radiol., 1955, 43, 161-172.<br />
Cooper, G. E. Understanding and interpreting pilot opinion. Aeronautical Engineering<br />
Review, 1957, 16, 47-56.<br />
Davydov, B. I. Endurance of external acceleration increased as a result of exposure to<br />
ionizing radiation. NASA-TT-F-10349, National Aeronautics and Space Administration,<br />
Washington, D.C., October 1966, Translation of Doklady Akademii Nnak SSSR, 1966,<br />
168(3), 691-693.<br />
Davydov, B. I., Antipov, V. V., & Saksonov, P. P. Reaction of irradiated organism when<br />
affected by acceleration of critical magnitude. Cosmic Research, 1965, 3(2), 256-268.<br />
Dean, R. D., MeGlothlen, C. L., & Monroe, J. L. Effects of combined heat and noise on<br />
human performance, physiology and subjective estimates of comfort and performance.<br />
Boeing Company Technical Report D2-90540, Seattle, Washington, 1964. (a)<br />
Dean, R. D., MeGlothlen, C. L., & Monroe, J. L. Performance and physiological effects of<br />
CH-46A noise and vibration. Boeing Company Technical Report D2-90583, Seattle,<br />
Washington, 1964. (b)<br />
Demin, Y. S. The effect of whole body vertical vibration and x-rays on the nucleus of ceils<br />
of bone marrow cells of mammals. Effect of ionizing radiation and dynamic factors of<br />
the function of the central nervous system; Problems in space physiology. N68-33288,<br />
Foreign Technology Division, Wright-Patterson Air Force Base, Ohio, September 1967,<br />
Pp. 13-27.<br />
Devik, F. Protective effects of combined hypoxia and cysteine treatment on whole body<br />
irradiation of mice. British Journal of Rediology, 1954, 27, 463-466.<br />
DiGiovanni, G., Jr., & Birkhead, N. C. Effect of minimal dehydration on orthostatie<br />
tolerance following short term bed rest. Aerospace Medicine, 1964, 35, 225-228.<br />
Dolkas, C. B., & Stewart, J. D. Effect of combined linear and oscillatory acceleration on<br />
pilot attitude-control capabilities. NASA TN-2710, National Aeronautics and Space<br />
Adminis_ation, Washington, D.C., March 1965.<br />
Furry, D. E. Tolerance of mice x-irradiated in an oxygen rich environment to explosive<br />
decompression. Aerospace Medicine, 1964, 35, 459.<br />
Gambino, J. J., Bennett, L. R., Billings, M. S., & Lawson, B. G. Biological effect of stress<br />
following ionizing radiation. Aerospace Medicine, 1964,35, 220.<br />
Ganshina, N. N. Combined effect of radiation and vibration on animals. Med. Radiologiya,<br />
1961, 6, 71-75.<br />
Gauer, O. The physiological effects of prolonged acceleration. In German aoiation medicine<br />
in Wodd WarlL Washington, D.C.: U.S. Government Printing Office, 1950.<br />
Gaydamakin, N. A., Pelrukhin, V. G., Saksanov, V. V., Saksanov, P. P., & Shashkov, V. C.<br />
Pathomorphologic changes in hemopoietic organs of mice exposed to the combined<br />
effect of several kinds of ionizing radiation and dynamic space flight factors. Studies in<br />
physiological reactions of humans and animals to space fl_ght. N66-34322, National<br />
Aeronautics and Space Administration, Joint Publications Research Service, Washington,<br />
D.C., 29 July 1966, Pp. 22-23.<br />
Gillies, J. A. (Ed.)A textbook of aviation phyziology. London: Pergamon Press, 1965.<br />
Gold, A. J., & Kosenitzky, I. Effects of cold and heat on survival and pulmonary changes in<br />
oxygen-exposed mice. Aeroapace Medicine, 1968, 39, 980.
910 Bioastronautics Data Book<br />
Gold, A. J., Silver, E. C., & Hance, H. E. Influence of environmental temperature on the<br />
toxicity of oxygen. Aerospace Medicine, 1964, 35, 563.<br />
Graybicl, A., & Clark, B. Symptoms resulting from prolonged immersion in water: The<br />
problem of zero G asthenia. Aerospace Medicine, 1%1, 32, 81-96.<br />
Graveline, D. E., et al. Psychobiological effects of water immersion induced hypodynamics.<br />
Aerospace Medicine, 1961, 32, 387.<br />
Greeley, P. O., Jorgenson, 1t., Clark, W. G., e! al. Effect of anoxia on G tolerance.<br />
NAS-NRC-CAM-480, National Academy of Sciences-National Research Council,<br />
Washington, D.C., October 1945.<br />
Greenleaf, J. E., Matter, M., Jr., Bosco, J. S., et al. Effects of hypohydration on work<br />
performance and tolerance to +G z acceleration in man. Aerospace Medicine, 1966, 37,<br />
34-39.<br />
Hale, tt. B. Human cardioaccelerative responses to hypoxia in combination with heat.<br />
Aerospace Medicine, 1960, 31, 276-287.<br />
Harris, C. S., & Shoenberger, R. W. Combined effects of noise and vibration on<br />
psychomotor performance. AMRL-TR-70-14, Wright-Patterson Air Force Base., Ohio,<br />
1970.<br />
Harris, D. A., Pegram, G. V., & Ilartman, B. O. Performance and fatigue in experimental<br />
double-crew transport missions. Aerospace Medicine, 1971, 42, 980-985.<br />
Hcndler, E. Physiological effects of a simulated space flight profile. Federation Proceedings,<br />
1963, 22, 1060-1063.<br />
lvanov, K. M., Zhukov, M. K., & Melchanova, M. G. Effect of accelerations produced during<br />
irradiation of animals on the course of acute radiation sickness. Patholng. fiziol, i eksper.<br />
temp., 1962, 5, 74-75. Abstracted in English in Soviet literature on life support systems.<br />
Bioseiences AID Report P-63-91, Library of Congress, Washington, D.C., 1%3.<br />
Jex, H. R., & Allen, R. W. Research on a new human dynamic response test battery.<br />
Proceedings of the Sixth Annual Conference on Manual Control, Wright-Patterson Air<br />
Force Base, Ohio, April 1970, P. 743.<br />
Klein, K. E., Brunet, H., Voigt, E. D., & Wegmann, H. M. Comparative studies on<br />
physiological indices of fitness in man under exercise, low pressure and acceleration. In<br />
H. Yoshimura, & J. S. Wciner (Eds.), Human adaptability and its methodology. Tokyo,<br />
1966, Pp. 234-249.<br />
Konstantinova, M. M. Effect of duration of moderate hypothermia on the oxygen tension in<br />
tissues and the radio _nsitivity of mice. Dokledy Akademii Nauk SSSR, 1%2, 145,<br />
436.<br />
Lamb, L. E. Hypoxia - An anti-deconditioning factor for manned space flight. Aerospace<br />
Medicine, 1965, 36, 97.<br />
Lehlanc, J. Stress and interstress adaptation. Federation Proceedings, 1969, 28, 996-1000.<br />
Lind, A. R., Leithead, G. S., & MeNicol, G. W. Cardiovascular changes during syncope<br />
induced by tilting men in the heat. Journal of Applied Physiology, 1968, 25, 268-276.<br />
Lindop, P. J., & Rotblat, J. Life-shortening in mice exposed to radiation: Effects of age and<br />
hypoxia. Nature, 1965, 208, 1070.<br />
Livshits, N. N. Combined effects of ionizing radiation and other factors. NASA-TT-F-354.<br />
Translated from Effects of Ionizing Radiation and Dynamic Factors on the Functions of<br />
the Central Nervous System - Problems of Space Physiology. Moscow: Science<br />
Publishing House, 1964, Pp. 1-23.<br />
Livshits, N. N. The effect of space flight factors on central nervous system functions:<br />
Summary of data. DDC AD 642 186, Library of Congress, Washington, D.C., 4 August<br />
1966.
Combined Enviromental Stresses 911<br />
Luft, U. German aviation medicine. Washington, D.C.: U.S. Government Printing Office,<br />
1950, Pp. 316-319.<br />
Lynch, T. N., Jensen, R. L., Stevens, P. M., Johnson, R. L., & Lamb, L. E. Metabolic effect<br />
of prolonged bed rest: Their modification by simulated altitude. Aerospace Medicine,<br />
1967, 38, 10.<br />
Martin, E. E., & Henry, J. P. The effects of time and temperature upon tolerance to positive<br />
acceleration. Journal of Aviation Medicine, 1951, 22, 382.<br />
Megel, H., Keating, E M., & Stern, J. A. Effects of elevated ambient temperature and<br />
vibration on rectal temperature of the restrained rat. Aerospace Medicine, 1961, 32,<br />
1135-1139.<br />
Megel, H., Wozniak, H., Frazier, E., & Mason, H. C. Effect of altitude upon tolerance of rats<br />
to vibration stress. Aerospace Medicine, 1963, 34, 319-361.<br />
Megel, H., Wozniak, H., Sun, L., Frazier, E., & Mason, H. C. Effects on rats of exposure to<br />
heat and vibration. Journal of Applied Physiology, 1962, 17, 759-762.<br />
Michaelson, S. M., Thomsen, IL A. E., & Howtand, J. W. Biologic effects of microwave<br />
exposure. RADC-TR-67-461, Rome Air Development Center, Griffiss Air Force Base,<br />
New York, September 1967.<br />
Michaelson, S. M., Thomsen, R. A. E., & Odland, O. T. The influence of microwaves on<br />
ionizing radiation exposure. Aerospace Medicine, 1963, 34, 111-115.<br />
Miller, P. B., & Leverett, S. D. Tolerance to transverse (+Gx) and headward (+Gz)<br />
acceleration after prolonged bed rest. Aerospace Medicine, 1965, 36, 13.<br />
Montgomery, P. O. B., Rosenblum, E., & Stapp, B. Gravity radiation and growth. Aerospace<br />
Medicine, 1964, 35, 731.<br />
Newberry, P. D., Johnson, W. H., & Smiley, J. R. Effect of hypoxia and nystagmus induced<br />
by angular acceleration. Aerospace Medicine, 1965, 36, 1090-1093.<br />
Newman, H. W. Effect of altitude on alcohol tolerance. Quarterly Journal of Studies on<br />
Alcohol, 1949, 10, 398.<br />
Newsom, B. D., & Kimeldorf, D. J. Alterations in physiological accommodation to stress<br />
induced by irradiation. Aerospace Medicine, 1963, 34, 226-230.<br />
Newsom, B. D., & Kimeldorf, D. J. Increased tolerance to hypoxia in irradiated and in<br />
food-deprived rats. American Journal of Physiology, 1954, 177, 390-394.<br />
Newsom, B. D., & Kimeldorf, D. J. Tolerance of irradiated animals to prolonged hypoxia.<br />
American Journal of Physiology, 1960, 199, 445-448.<br />
Pinchuk, V. M., & Sheherban °, E. I. Effect of moderate physical acceleration, applied just<br />
before irradiation, on the course of acute radiation sickness. In Radiation Sickness and<br />
Combined Lesions of the Organism, Leningrad, lzd-vo Tsentr. Nauchno-Issled. In-ta<br />
Rentgenol. i Radiol. Min. Zdrav. USSR, 1958, Pp. 318-325.<br />
Rohles, F. H. Considerations for environmental research in human factors. Journal of<br />
Environmental Sciences, 1965, 8, 18-19.<br />
Rosketh, R., & Lorenzen, F. V. Alcohol and altitude. Journal of Applied Physiology, 1954,<br />
6, 559-565.<br />
Short, L. L., Newsom, B. D., & Brady, J. F. X-radiation effects on vibration tolerance of<br />
rats. Aerospace Medicine, 1967, 38, 140-144.<br />
Stevens, P. M., Miller, P. B., Lynch, T. N., et al. Effects of lower body negative pressure on<br />
physiologic changes due to four weeks of hypoxic bed rest. Aerospace Medicine, 1966,<br />
37, 466-474.<br />
Stevens, S. S. Effects of noise and vibration on psychomotor effieiencies. OSRN #32,<br />
National Research Council, Harvard Psycho-Acoustics Laboratory, 1941.
912 Bioastronautics Data Book<br />
Stevens, S. S. (Ed.) Handbook of experimental psychology. New York: John Wiley and<br />
Sons, 1951.<br />
Stiehm, E. R. Different effects of hypothermia on two syndromes of positive acceleration.<br />
Journal of Applied Physiology, 1963, 18, 387.<br />
Taliaferro, E. H., Wempen, R. R., & White, W. J. Thecffects of minimal dehydration upon<br />
human tolerance to positive acceleration. Aerospace Medicine, 1965, 36, 922-926.<br />
Taylor, J. W. X-irradiation and acceleration stress. NADC MA 6033, Naval Air Development<br />
Center, Johnsville, Pennsylvania, 1960.<br />
Thomsen, R. A. E., Michaelson, S. M., & Howland, J. W. Microwave radiation and its effect<br />
on response to x-radiation. Aerospace Medicine, 1967, 38, 252.<br />
Thomsen, R. A. E., Michaelson, S. M., & Quinlan, W. J. Thermal regulation in x-irradiated<br />
dogs subjected to heat stress. Aerospace Medicine, 1969, 40, 283-286.<br />
Tierney, W. L. Combined environment space simulation in the 1970s. Environmental<br />
Quarterly, 1969, 15, 16-18.<br />
Torphy, D. E. Effects of short term bed rest and water immersion on plasma volume and<br />
catecholamine response to lilting. Aerospace Medicine, 1966, 37, 383-387.<br />
Tn,jillo, T. T., Spalding, J. F., & Langham, W. H. A study of radiation induced aging:<br />
Resporrse of irradiated and non-irradiated mice to cold stress. Radiation Research, 1962,<br />
16, 144-150.<br />
Tsysar, A. 1. The effect of joint action of noise and vibration on the vibration sensitivity of<br />
adolescents. Gig. i. Sanit., (USSR), 1965, 6, 30-36.<br />
Viteles, M. S., & Smith, K. R. An experimental investigation of the effect of change in<br />
atmospheric conditions and noise upon performance. Transactions of the American<br />
Society of Heating and Ventilating Engineers, 1946, 52, 167-182.<br />
Vykukal, H. C. Dynamic response of the human body to vibration when combined with<br />
various magnitudes of linear acceleration. Aerospace Medicine, 1968, 39, 1163-1166.<br />
Wcbb, P. (Ed.) Bioastronaufics data book. NASA SP-3006, National Aeronautics and Space<br />
Administration, Washington, D.C., 1964.<br />
Wezler, K., & Frank, E. O2-Mangel bei wechselnden klimabedingungen. Unpublished report<br />
discussed in German aviation medicine in World War I1. Washington, D.C.: U.S.<br />
Government Printing Office, 1950, Pp. 819-821.<br />
Wilkinson, R. T. The interaction of noise with Io_ of sleep and knowledge of the results.<br />
Journal of Experimental Psychology, 1963, 66, 332-337.<br />
Wright, E. A., & Shewell, J. Modification of radiation "cerebral death" by hypoxia. Nature,<br />
1965, 208, 904.<br />
Young, W. A., Shaw, D. B., Navaek, J., Shizgal, H., & Kowalsky, N. Effect of CO2 and<br />
wholc body vibration on ventilation. Journal of Applied Physiology, 1965, 20, 844-848.<br />
Zellmcr, R. W., Granville, J. W., McNce, R. C., & Allen, IL G., Jr. Significance of combined<br />
stresses of G forces and irradiation. Aerospace Medicine, 1963, 34, 626-629.<br />
Additional Reading<br />
Adey, W. R., Kado, R. T., & Walter, D. O. Results of clectroencephalographic examinations<br />
under the influence of vibration and centrifuging in the monkey. In L. Widen (Ed.),<br />
Recent advances in clinical neurophysiology, Electroenceph. Clin. Neurophysiol.<br />
AFOSR-67-1857, Suppl. 25, Amsterdam: Elsevier Publishing Co., 1967, Pp. 227-245.<br />
Altland, P. D., Brubaeh, H. F., & Parker, M. G. Effects of inert gases on tolerance of rats to<br />
hypoxia. Journal of Applied Physiology, 1968, 24, 778-781.
Combined Enviromental Stresses 913<br />
Arkad'yenskii, A. A. Combined effect of vibration and noise on the human organism. G/g. i.<br />
San/t, 1962, 10, 25-28.<br />
Berry, C. A., Coons, D. O., Catterson, A. D., et al. Man's response to long-duration flight in<br />
the Gemini spacecraft. In Gemini Midprogram Conference, NASA SP-121, Manned<br />
Spacecraft Center, Houston, Texas, 23-25 February 1966, Pp. 235-261.<br />
Berry, C. A., & gastwood, H. K. Helicopter problems: Noise, cockpit contamination and<br />
disorientation. Aerospace Medicine, 1960, 31, 170-190.<br />
Bjurstedt, H., Rosenhamer, G., & Wigertz, O. High-G environment and responses to graded<br />
exercise. Journal of Applied Physiology, 1968, 25, 713-719.<br />
Cassuto, Y., & Chafee, R. R. J. Cold adaptation and heat. American Journal of Physiology,<br />
1966, 210, 223.<br />
Chetverikov, D. A., Gasteva, S. V., Ivanov, K. P., Vastek, A., & Pospishel, M. Mechanisms of<br />
raised resistance of rats to hypoxia in acute radiation injury. Folie. B/ologica, 1964, 10,<br />
386.<br />
Coreoran, D. W. Noise and loss of sleep. Quarterly Journal of Experimental Psychology,<br />
1962, 14, 178-182.<br />
Damon, E. G., Gaylord, C. S., Yelverton, J. T., Richmond, D. R,, Bowen, I. G., Jones, ILK.,<br />
& White, C. S. Effects of ambient pressure on tolerance of mammals to air blast.<br />
Aerospace Medicine, 1968, 39, 1039.<br />
Damon, E. G., Richmond, D. R., & White, C. S. Effects of ambient pressure on the tolerance<br />
of mice to air Hast. Aerospace Medicine, 1966, 37, 341.<br />
Davidovid, J., Debijadi, R., Elcie, S., & Davidovic, V. Effects of noise on resistance to acute<br />
hypoxia. Vojnomnitetdd Pregled, 1965, 22, 625.<br />
Dean, R. Human stress in space. Science Journal, 1966, 2, 70-75.<br />
Dean, R. D. The use of environmental stress in conjunction with simulation testing. IEEE<br />
Transactions, Aerospace and Electronic Systems, 1967, 3, 688-696.<br />
Grcenleaf, J. E., Grcenleaf, C. J., Card, D. H., & Saitin, B. Exercise-temperature regulation<br />
in man during acute exposure to simulated altitude. ]ournal of Applied Physiology,<br />
1969, 26, 290-296.<br />
Gyurdzhian, A. A. The effect of prolonged acceleration on gas exchange and resistance of<br />
rats to hypoxia. N67-26573, National Aeronautics and Space Administration,<br />
Washington, D.C., November 1966.<br />
Hall, C. E., Schneider, M., & Hall, O. Increased sensitivity to x-irradiation exhibited by<br />
stressed rats. Radiation Research, 1962, 17, 118-128.<br />
Ioseliani, K. K. The effect of vibration and noise on the mental faculty of man under time<br />
stress. Koamichedmya Biol. & Med. (USSR), 1967, 1, 79-82.<br />
Kachler, R. C. Human pilot performance during boost and atmospheric reentry. Aerospace<br />
Medicine, 1959, 30, 481-486.<br />
Kelly, G. F., Coons, D. O., & Carpenfier, W. R. Medical aspects of Gemini extravehicular<br />
activities. Aerospace Medicine, 1968, 39, 611.<br />
Kotovskaia, A. R., Vartbaronov, R. A., & Simpura, S. F. Human physiological reactions<br />
under the action of transverse accelerations after preceding hypodynamia. In Problems<br />
of Space B/ology 6, Moscow, 1967, Pp. 106-117.<br />
Lamb, T. W., et al. Mechanical and chemical ventilator,/ stimulus interaction. Journal of<br />
Applied Physiology, 1966, 21, 399-403.<br />
Loeb, M. Further investigations of the influence of whole body vibration and noise on<br />
tremor and visual acuity. AMRL-TR-55-165, Wright-Patterson Air Force Base, Ohio,<br />
1955.
914 Bioastronautics Data Book<br />
Morfison, P. Responses of mountaineers to multiple stressors. Archives of Environmental<br />
Hea/th, 1968, 17, 599-602.<br />
Mukhamedov, T. Effect of combined action of radioiodine-131 and noise on the cardiac<br />
activity in dogs. BiuUetin Eksperimental 'nod Biologii i Meditsiny, 1965, 59, 43.<br />
Newsom, B. D., & Kimeidorf, D. J. The resistance of animals to acute cold following<br />
x-irradiation. International Journal of Radiation B/Olo/D', 1961, 4, 143.<br />
Newsom, B. D., & Kimeldorf, D. J. Tolerance of rats to a cold environment during multiple<br />
exposures to a low dose of x-rays. American Journal of Physiolosy, 1961, 200, 1039.<br />
Peplcr, R. D. Warmth and lack of sleep: Accuracy or activity reduced. Journal of<br />
Comparative Physiological Psychology, 1959, 52, 446-450.<br />
Phillips, R. D., & Kimeldoff, D. J. An immediate irradiation effect on resistances of rats to<br />
low temperature. Journal of Applied Physiology, 1962, 24, 768-772.<br />
Pugh, L. G. C. E. Tolerance to extreme cold at altitude in a Nepalese pilgrim, Special<br />
communications. Journal of Applied Physlo/ngy, 1963, 18, 1234-1238.<br />
Riley, M. B., & BemardinL A. T. Animal and human studies of the effects of low frequency<br />
oscillation combined with transverse acceleration. WADC-TN-59-62, Wright-Patterson<br />
Air Force Base, Ohio, 1962.<br />
Sadoff, M., & Dolkas, C. B. Acceleration stress effects on pilot performance. IEEE<br />
Transactions, Human Factors in Electronics, 1967, 8, 103-112.<br />
Shebalin, V. A. Change in conditioned reflexes in human beings exposed to carbon<br />
monoxide and vibration. ByuU. Eksperim. Biologii i. Meditsiny, 1962, 53, 45-48.<br />
Suliday, S. M., & Schohan, B. Performance and physiological responses of pilots in<br />
simulated low altitude high speed flight. Aerospace Medicine, 1965, 36, 100-104.<br />
Sorokina, Y. I. The interaction of a series of indices of the oxygen regime of an organism<br />
under the influence of reduced barometric pressure and long acting accelerations. In<br />
Problems in Aerospace Medicine. Joint Publications Research Service, Washington, D.C.,<br />
21 October 1966, Pp. 452-453.<br />
Wegmann, H. M., Bruner, H., & Klein, K. E. Enzymatic and hormonal responses to exercise,<br />
lowered pressure and acceleration in human plasma and their correlation to individual<br />
tolerances. Federation Proceedings, 1966, 25, 1405-1408.<br />
Wunder, C. C., Herrin, W. F., & Crawford, C. R. Combined influence of gravity and<br />
temperature upon growth of fruit fly larvae. Growth, 1959, 23, 349-357.<br />
Young, W. A., Sha_, D. B., Buckles, L. J., Outerbridge, J. S., Reeves, C. E., & Truman, J. C.<br />
Effect of CO on hyperventilation produced by vibration. Journal of Applied<br />
Physiology, 1963,18, 349.<br />
Zharova, E., Khrustalev, A., Protasova, T. G., Davydov, B. I., Antipov, V. V., Saksonov, P.<br />
P., & Rausherdiakh, M. O. Remote responses of the hemopoietic tissue to the proton<br />
and x-irradiation combined with acceleration, lzvestiia Akademii Nauk SSSR Seriia<br />
Biologichcskaia, March/April 1967, 2, 29.
CHAPTER 20<br />
AEROSPACE VEHICLE WATER-WASTE MANAGEMENT<br />
by<br />
Joseph N. Pecoraro<br />
National Aeronautics and Space Administration<br />
The collection and disposal of human wastes, such as urine and feces, in a<br />
spacecraft environment, must be performed in an aesthetic and reliable manner<br />
to prevent degradation of crew performance. This is a difficult task because the<br />
equipment must be designed for use by a human operator in a weightless state,<br />
and biological contamination must be prevented. The design of this equipment is<br />
further complicated by the usual requirement for minimum size, weight, and<br />
power. An artificial force must be created to direct the feces and urine to the<br />
appropriate collection receptacles, thus preventing possible spacecraft<br />
contamination. One method of providing the force required for waste collection<br />
consists of drawing air from the cabin into the collection device so that flatus<br />
and fecal odors will not escape into the spacecraft.<br />
The waste management system controls, transfers, and processes materials<br />
such as feces, emesis, food residues, used expendables, and other wastes. Control<br />
and transfer of urine, condensate, and water from personal hygiene and its<br />
reclamation is considered a waste management function.<br />
Aerospace vehicle waste management systems do not exist as separate<br />
entities; they are a combination of various techniques designed into hardware for<br />
the collection of urine, feces, and waste preservation and disposal and/or<br />
recovery of materials such as water, air, etc. For any system, the chosen<br />
technique must be physiologically and psychologically acceptable to the crew<br />
and provide maximum equipment effectiveness.<br />
Research and development of waste management systems for aerospace<br />
vehicles began in 1958 (Ingrain, 1958; Des Jardins et al., 1960). This work<br />
demonstrated the performance of various techniques for collecting, transporting,<br />
storing, and disposal of wastes on missions up to 120 days. The Project Mercury,<br />
Reviewed by Robert A. Barnbenek, Arngto Corporation, Chicago, minois, and J. D. Zeff, General<br />
American Transportation Corporation, Niles, minoi_<br />
915
916 Bioastronautics Data Book<br />
Gemini, and Apollo astronauts were provided with relatively simple equipment,<br />
which was adequate for these relatively short missions. Since 1966, emphasis has<br />
been placed upon the development of equipment for longer missions, which may<br />
require the collection and recovery of usable products from human wastes.<br />
Requirements<br />
Aerospace waste includes all of the items that must be separated from the<br />
crew to prevent biological contamination. The items generally classified as<br />
wastes are: urine, feces, wipes, wash water, food containers, and debris. The<br />
composition and quantity of these wastes are not constant; they are a function<br />
of variables such as the individual, his diet, and the mission. Fortunately, the<br />
exact composition is less important than the quantity-at least from a design<br />
standpoint. The typical composition and nominal quantity of these wastes is<br />
presented in table 20-1.<br />
Sol ids<br />
Table 20-1<br />
Nominal Crewman Metabolic Balance 1<br />
(lb/man-day)<br />
|nput Output<br />
Food 1.36 Urine solids 0.13<br />
Liquids (water)<br />
Oxygen 0.44 Feces solids 0.07<br />
Hydrogen 0.08 Sweat solids 2 0.04<br />
Carbon 0.60<br />
Other 0.24<br />
Drink 3 4.09 Urine 3.31<br />
Food preparation 1.58 Content 4.02<br />
Cold 3 0.79 Sweat 2.02<br />
Hot 3 0.79 Insensible 4 2.00<br />
"rutal input 6.77 Total recoverable 7.33<br />
Feces 0.20<br />
Gases Total output 7.53<br />
Oxygen 1.84 Carbon dioxide 2.20<br />
1Assumes metabolic rate = 11,200 BTU/man-day and RO = 0.87<br />
21% of sweat (Roth, 1964)<br />
3From potable water supply<br />
4Composed of lung, latent loss (10% of total metabolic rate) plus<br />
skin diffusion.
Aerospace Vehicle Water-WasteManagement 917<br />
Wastes must be collected and transported to storage and/or recovery process<br />
equipment in such a manner that they do not contaminate the crew and the<br />
internal environment of the vehicle. In most cases wastes must also be treated<br />
during collection to avoid the production of noxious gases and microorganisms<br />
in the collector, transport lines, and storage vessels. If the wastes are to be stored<br />
onboard for an extended period of time, they should be sterilized to avoid<br />
contamination if the storage vessel fails.<br />
Since at times the aerospace vehicle may be in a weightless state, certain<br />
techniques for collection of wastes will have to employed. These include the<br />
application of pressure, drag, and/or manual forces. This applies to such waste as<br />
urine, feces, vomitus, and debris. Furthermore, for human waste collection, foot<br />
restraints and a body restraining belt appear to be needed to enable zero gravity<br />
operation.<br />
Collection and Transport<br />
Solid wastes, such as wipes, used food containers and refuse, are easily<br />
collected and transported by hand to a storage/disposal unit. The most difficult<br />
problem is collecting liquid wastes in a weightless state. This task is especially<br />
complicated by the fact that gas is usually collected with the liquids, and it must<br />
be separated to avoid gas loss and oversizing liquid storage containers.<br />
Specifically, the collection and transport subsystem must provide the<br />
following functions:<br />
1. Collect, treat, and store all solid and liquid wastes and collect and transfer<br />
raw urine to the water and waste disposal subsystem.<br />
wastes.<br />
2. Eliminate odors, aerosols, and existing gases.<br />
3. Sterilize waste matter to:<br />
a. Inhibit or eliminate microorganism production.<br />
b. Prevent production of such gases as CO2, CH4, H2, H2S, in the<br />
c. Prevent crew contamination if wastes escape into the living areas.<br />
The variety of wastes and the differences in physical characteristics (volume,<br />
density, composition, etc.) and microorganism activity requires that the<br />
subsystem be flexible enough to handle wet wastes such as feces, urine, unused<br />
food, and wet cloths, as well as food containers, urine sludge (from the water<br />
reclamation subsystem), fingernail clippings, hair, vomitus, and miscellaneous<br />
debris. The nature of waste products requires that psychological and<br />
physiological factors be considered. Urine is rapidly colonized by<br />
microorganisms that degrade urea and uric acid components to toxic ammonia<br />
gas. Immediate treatment of the urine is required to eliminate the production of<br />
ammonia and to insure potability when urine is processed through the water<br />
reclamation subsystem. Other waste materials must be collected to reduce<br />
particulate matter in the atmosphere. Solid waste matter must be sterilized or<br />
treated to inhibit the growth of microorganisms so that health hazards do not
918 Bioastronautics DataBook<br />
developandgasesarenot generated anddispersed into theatmosphere or<br />
withinstoragecontainers.<br />
Urineand Liquid Waste<br />
The objective of the urine and liquid waste collection and transport<br />
sub,stem is to provide a means for collecting and transporting these wastes<br />
to the water management subsystem where treating and processing are<br />
performed. The major liquid waste includes condensate water from<br />
equipment and crew and personal hygiene of body wash.<br />
Urine. The urine collection unit must be capable of being operated<br />
either by itself or simultaneously with defecation. Acceptable seal-type<br />
urinals which provide for dumping overboard have been developed (Des<br />
Jardins et al., 1960; Miner et al., 1961). A nonsealing urinal can be used<br />
without gas loss overboard by employing a centrifugal fan to draw cabin gas<br />
into the urinal. A urine-gas separator is necessary to collect the urine and<br />
protect the fan. Tests have demonstrated that the gas flow rate required<br />
should be at least 1 cfm and the fan must be capable of developing a<br />
minimum pressure differential of 5 inches of water.<br />
The Project Mercury and Gemini astronauts used seal-on urinals and<br />
bladder pressure to transfer urine to plastic bags, and saved it for postflight<br />
analysis. Since these were relatively short duration missions, there was no<br />
major concern about personal or vehicle contamination. The Project Apollo<br />
Command Module was provided with a urinal that resembles an aircraft<br />
relief tube, with an overboard vacuum used to assist in collection and<br />
transfer. Since the gas flow rate required to operate a relief tube is on the<br />
order of 1 cfm, the mass of gas lost overboard was substantially less than<br />
the mass penalty of a reliable urine-gas separator. Vehicles designed for<br />
mission durations longer than several weeks must minimize overboard gas<br />
loss, and therefore, can advantageously utilize a pneumatic-type urinal with<br />
a urine-gas separator.<br />
Two types of urine-gas separators have been developed, passive<br />
separators that utilize surface tension and viscous flow to retain liquids and<br />
active separators that utilize centrifugal forces. The passive separator uses a<br />
sponge-type hydrophilic material so that the inlet mixture must flow a<br />
tortuous path, which causes the urine to collide with the sponge material.<br />
After the separation process is complete, the sponge can be (1) squeezed to<br />
transfer the urine to a storage vessel or overboard or (2) evacuated to<br />
vaporize and/or sublimate water from the urine leaving the residue in the<br />
sponge. Typical of the problems associated with passive separators are:<br />
1. Droplets smaller than 50/.t in diameter will tend to pass through the<br />
sponge with the gas. The separator should therefore, be provided with either an<br />
agglomerating device at the inlet or a final filter at the outlet.<br />
2. Urine, a source of many gases, requires an odor filter downstream of the<br />
separator to remove gases generated by urine on the sponge surfaces.
Aerospace Vehicle Water-WasteManagement 919<br />
3. Urine residue will tend to accumulate in the sponge. The sponge must<br />
therefore, be oversized or replaceable to compensate for this loss in capacity.<br />
Wick-type separators are not recommended for application with mixtures<br />
containing heavy solutes that can precipitate and restrict capillary action. The<br />
passive or sponge-type separators do not require electric power, but they do lose<br />
interstitial gas when urine is transferred to storage or overboard.<br />
The active or centrifugal-type separator can be designed to lose a minimum<br />
of gas with separated urine, but they require an electric motor, gas turbine, or<br />
manual drive. In these devices, separation is achieved by inducing rotational flow<br />
in a urine-gas mixture. Rotating vanes, screens, and sponges can be used for this<br />
purpose. Another approach is to impinge the mixture against the inner wall of a<br />
rotating bowl so that urine is forced against the wall. Viscous and centrifugal<br />
forces will then cause the urine to rotate with the bowl, so that a stationary<br />
impact tube can be used to pump urine out of the bowl. The gas is drawn or<br />
forced out of the bowl by pressure differences, preferably through a rotating<br />
entrainment separator or "final" filter. If the urine outlet is provided with a<br />
back pressure regulator, the separator automatically stops "pumping" when the<br />
urine-gas interface reaches the tube inlet. The urine remaining in the bowl will<br />
stay at the wall when the separator is shut off, if the wall is a hydrophilic<br />
material.<br />
Centrifugal separators are most attractive for application where urine must<br />
be forced into a pressurized storage vessel. Theoretically, the urine or bowl<br />
velocity required is then X/2 g Ap/p. In practice, however, a higher velocity is<br />
required because probe drag creates a velocity profile between the wall and the<br />
urine-gas interface. The shaft power required to operate a centrifugal-type<br />
urine-gas separator is determined primarily by probe drag. An extremely small<br />
diameter probe will minimize peak power demand, but requires long periods of<br />
operation to empty the bowl. For minimum expenditure of energy, the probe<br />
should be sized to minimize depth of submergence, i.e., pumping rate should<br />
equal urination rate. A 0.125 inch diameter probe is sufficient for this purpose<br />
when pumping urine into a tank at 5 psig. Provisions should be made for<br />
sterilization on a regularly scheduled basis as well as water flushing after each<br />
micturition.<br />
Liquid Waste. Liquid-gas separation is required for many different functions<br />
within the environmental control subsystem. Condensate collection is required<br />
for separation of carbon dioxide concentrator water from the carbon dioxide in<br />
the concentrator. A porous plate condenser/separator has been found to fulfill<br />
the requirements of the carbon dioxide concentrator. A three-passage<br />
configuration (stacked unit) is used, the first and second passages being gas and<br />
condensate, respectively (separated by a porous plate). The condensate passage is<br />
initially filled with water and maintained at a negative pressure with respect to<br />
the gas flow passages. A centrifugal pump is employed to transfer condensate to<br />
the water management system. The third passage contains a flowing coolant to<br />
maintain the whole unit at a uniform temperature sufficient to condense water<br />
vapor on the gas side of the porous plate. The nature of the fluids being processed,<br />
the water and carbon dioxide flow rates, and equivalent weight considerations<br />
usually dictate the selection of the porous plate condenser/separator.
920 Bioastronautics Data Book<br />
The use of cabin air/water separators with face wick heat exchangers is one<br />
of the more attractive techniques to condense and separate water vapor from the<br />
cabin air. These separators are essentially conventional heat exchangers with the<br />
addition of face wicking in the air outlet face. Use of a hydrophobic coating on<br />
the air side fins minimizes gas pressure drop. Water droplets transported to the<br />
heat exchanger oudet face will come into contact with strips of wicking, enter<br />
the wick, and be transported to a hydrophilic transfer disk. Capillary forces, in<br />
conjunction with a pressure differential across the disk, transfer liquid to the<br />
collection system.<br />
Wash Water<br />
In the Gemini and Apollo flights, cleaning of exposed body surfaces was<br />
accomplished by use of lintless wet and dry pads dispensed with each meal. The<br />
pads were made from rayon, terry-pile cloth, and measured 3.5 x 4.0 x 3/32<br />
inches. The wet pads are treated with 5 ml of cleaning solution composed of one<br />
part Hyamine 1620, a quaternary ammonium antiseptic, to 60,000 parts distilled<br />
water. Larger pads were provided for body cleaning.<br />
On long duration missions, whole body cleaning will be required, using a<br />
shower or bath. Such cleaning must remove the residual materials adhering to<br />
the skin from sources external to the body, as well as natural body products.<br />
Upon completion, the body must be dried to avoid losing water to the internal<br />
environment. Some early tests under weightless conditions (in USAF<br />
RC-135 zero "G" aircraft) demonstrated the wetting characteristics of water on<br />
skin to be satisfactory: sprayed water wets and adheres to the skin. In fact,<br />
water actually builds up on the skin and clings in sheets, if the droplets are not<br />
large. The use of airflow for the collection of water in a shower stall does not<br />
satisfactorily remove water from the body; only a suction system or sponge can<br />
be used for this purpose. It is estimated that a weightless shower would require<br />
the collection and processing of 1.5 liters of water.<br />
Feces and Debris<br />
The objective of the feces and debris collection and transport subsystem is to<br />
provide a means for collecting and transporting these wastes to the solid waste<br />
management subsystem where treating and processing are performed. Collection<br />
and transfer must be accomplished under zero gravity conditions, while the<br />
escape of solid waste to the cabin is positively prevented. The principal solid<br />
wastes include body wasfes, unused food, and food containers.<br />
Feces Collection. There are basically two techniques for collecting feces in a<br />
weightless state; namely, manual collection with a glove or bag, and pneumatic<br />
collection with the use of forced cabin gas for detachment and transfer. The<br />
glove method, as developed for Project Gemini, is a simple, low-weight technique<br />
but is psychologically objectionable and does not provide a means for preventing<br />
flatus from entering the cabin atmosphere. The technique, however, is desirable<br />
for use as an emergency fecal collector or where a pneumatic collector cannot be<br />
provided. On missions of durations longer than several days, fecal collection
Aerospace Vehicle Water-WasteManagement 921<br />
equipment is required to maintain the physiological and psychological<br />
well-being of the crew.<br />
Feces can be detached from the anus in a weightless state by gas<br />
impingement, and then carried into a collection bag or processing device by the<br />
same gas flow (e.g. Des Jardins et al., 1960; Charanian et al., 1965. & Rollo et<br />
al., 1967. The gas flow rate required is a function of equipment design;<br />
experience has shown that it should be in the range of 2 to 10 cfm. The gas is<br />
drawn through the device by a centrifugal blower and passed through a filter<br />
with activated carbon before being returned to the cabin. Recent laboratory<br />
tests have shown that:<br />
1. Separation of feces from perineal surface was best accomplished by short<br />
duration impulse from a 30 to 40 psig air stream aimed at the fecal mass; water<br />
or air-water streams are not as effective as air alone.<br />
2. Only small amounts of air are needed to effect separation, e.g. 0.1 to<br />
0.2 std. 3 ft. at 30 to 40 psig, flowing at 6 cfm for 2 seconds.<br />
Many types of fecal collection bags have been devised. None of these bags<br />
has all the characteristics desired; namely,<br />
High permeability for gases<br />
Impermeable to liquids<br />
High tear strength<br />
Low weight.<br />
The two materials proven to be most successful so far are porous cellulose and a<br />
polyethylene; both are fabricated from 10 mil material and treated to prevent<br />
passage of liquids with pressure differentials less than 4 inches of water.<br />
Recently, these materials have been laminated with cloth to provide the tear<br />
strength desired.<br />
Experiments have demonstrated that man can reliably defecate into a 4 inch<br />
diameter opening--provided this opening is indexed with respect to the anal<br />
perimeter. This is the minimum size recommended for a fecal collection bag or<br />
the opening in a fecal storage container.<br />
Pneumatic collection provides for more natural defecation. In addition, it<br />
also entrains any flatus excreted. To minimize odors, the fecal collection gas<br />
should be passed through a bed of activated charcoal. If a catalytic oxidation<br />
unit is used for contamination control, the fecal collection gas should be<br />
directed to this unit for removal of any H2, CH4, and H2S. Also pneumatic<br />
collection provides a suitable means for collecting vomitus.<br />
Overboard Dump. Wastes can be disposed of overboard in gaseous or liquid<br />
form. Dumping of solids is not permitted to avoid imparting the wastes on the<br />
ground and/or the aerospace vehicle. Urine, of course, can be dumped as a liquid<br />
directly from a urinal or from a urine-gas separator if it is permissible to<br />
contaminate the external environment with microorganisms. Solids, however,<br />
should be incinerated or thermally decomposed.<br />
487-858 0 - 73 - 59
922 Bioastronautics Data Book<br />
A detailed investigation of waste incineration/decomposition is described in<br />
Dodson and Wallman (1964). This study concluded that incineration requires<br />
(1) an ignition temperature of 1000°F, (2) an energy input of at least<br />
1 kilowatt-hours per man-day, and (3) an oxygen input of up to 0.2 pounds per<br />
man-day. Under these conditions the ash remaining is less than 10 grams per<br />
man-day and can be easily blown overboard by venting.<br />
If oxygen is not available for incineration, the wastes can be gasified by<br />
thermal decomposition. However, this technique requires approximately<br />
4000 BTU/Ib of wastes at a temperature level of 1200°F. In addition, the<br />
overboard vent line must be maintained at this temperature to avoid<br />
condensation and plugging.<br />
Incineration and thermal decomposition have not appeared to be practical<br />
for aerospace vehicles in the absence of a nuclear heat source. However, when<br />
these heat sources are available, it will most likely be advantageous to recover<br />
usable products from wastes.<br />
Waste Processing<br />
Since any unit capable of handling fecal matter should also dispose of the<br />
other wastes, this discussion will be primarily concerned with human waste<br />
treatment methods. Currently considered methods are: (l) biodegradation,<br />
(2) vacuum/thermal drying, and (3) incineration.<br />
The biological treatment of wastes requires a blending device for feces since<br />
bacteria rapidly degrade only soluble and finely dispersed matter. The biological<br />
treatment process also requires waste storage facilities so that wastes of<br />
reasonably uniform composition and concentration can be treated. Thus, a<br />
minimum of two tanks are required for alternate use as storage and feed units. A<br />
pump is required to feed the waste to the activated sludge system at some fixed<br />
rate. The activated sludge system requires a minimum of one tank with<br />
components for gas-liquid contact, gas-liquid separation, and liquid-solid<br />
separation. Instrumentation must be provided for control and monitoring of the<br />
process. Other components are required for absorbing gases when storage tanks<br />
are vented and for heat rejection. This process is being used commercially in<br />
sewage treatment plants on a large scale. There has been some minor adaptation<br />
of this process for zero-gravity spacecraft use.<br />
The basis for the vacuum drying method is that drying fecal matter to<br />
50 percent of its water content by weight will stop microorganismic activity and<br />
allow safe storage. Two methods have been developed for drying waste matter to<br />
a bacteriostatic condition. They are:<br />
1. Systems in which the collection and treatment (drying) functions are<br />
separated, with manual transfer required from the collection unit to the<br />
treatment unit, and thence to storage when drying is complete.<br />
2. Systems in which the collection, treatment, and storage functions are<br />
integrated.
Aerospace Vehicle Water-Waste Management 923<br />
In the vacuum drying method, the fecal bags used for collection do not<br />
include chemicals for treatment, as is the case for Apollo mission fecal bags. The<br />
bags are placed directly into individual vacuum dryers. The number of vacuum<br />
drying containers is determined by crew size and waste processing time. If power<br />
is available, drying can be reduced by heating the wastes to 240°F and<br />
evacuating the evaporated matter to space. Fecal water is lost in this process.<br />
Upon completion of drying, the permeable bags can be removed from the<br />
drying chambers, placed in a "Saran" bag with 1 gm of silica gel to maintain<br />
dryness, and put into a sealed storage container sized for the number of<br />
man-days required. If fecal water is to be saved, drying is accomplished by<br />
heating only. The recovered waste water is then sent to the water recovery<br />
subsystem.<br />
Several techniques featuring integration of the collection, treatment, and<br />
storage processes are available. Two are currently being advanced to the state<br />
that will be considered prequalification for system test. A subsystem known as<br />
the "Super John" based on an earlier version of the "Dry John" has been<br />
designed and fabricated and has been extensively tested. The concepts include<br />
(1) fecal collection, and a means of direct sterilization of the seat area; and<br />
(2) dynamic phase separation by means of a rotating slinger which shreds and<br />
then spreads the feces and toilet tissue in a thin layer over the inner surface of<br />
the collection vessel where sterilization then takes place. Initial sterilization<br />
takes place at approximately 250°F for 30minutes; then, processing is<br />
accomplished by means of thermal decomposition. Initial test results indicate<br />
approximately 3 hours at 800°F plus are required to reduce the original volume<br />
by 85 percent. At the end of this time the resultant ash closely resembles<br />
charcoal. Tests are being planned to study this ash in order to determine the<br />
feasibility of reuse of this material as a back-up regenerative filter source.<br />
Another subsystem referred to as "Hydro John" involves similar hardware<br />
except for substitution of calrod heaters with a slurry collection area. In<br />
addition to using air, the system uses wash water for cleaning. The water also<br />
provides for development of the slurry. The water is collected for thermal<br />
decomposition of the solid waste and is returned to the waste management<br />
system after its recovery from the waste water reclamation subsystem.<br />
It is recognized that on long-term space missions, there must be systems<br />
onboard for disposing of wet waste materials, such as feces. The feasibility of<br />
adapting the principle of high pressure wet oxidation to perform these combined<br />
operations is under consideration (Jagow & Saunders, undated).<br />
The incineration and/or wet oxidation techniques are operated by adding<br />
waste materials, including feces, papers, and plastic food containers, to the<br />
incinerator. The waste materials can be dried and sterilized by using electrical<br />
resistance heaters and then burned with pure oxygen or oxygen diluted with<br />
nitrogen. The residue remaining is a dry, gray powder which could be easily<br />
removed.
924 Bioastronautics Data Book<br />
Water Reclamation Subsystems<br />
The water management subsystem interfaces with all of the waste<br />
management systems. Its objective is to purify waste water and to store<br />
and deliver potable water for use on demand. Water is collected for<br />
processing from the cabin heat exchanger, atmospheric condensate, and<br />
from the waste control subsystem in the form of urine, flush water, and<br />
used wash water.<br />
The water management subsystem is constrained by biocontamination<br />
control requirements as follows: (1) the water produced must be<br />
essentially sterile and free of organic and inorganic toxic material;<br />
(2) stored water must remain sterile; (3)it must be possible to service<br />
equipment routinely without contaminating the stored water; (4)service<br />
operations, such as changing filters and removing sludge, should not<br />
contaminate the crewman or the atmosphere; (5) in the event of<br />
contamination of the water supply, there must be a means of complete<br />
and rapid system sterilization.<br />
The major engineering criteria used in evaluating a water management<br />
subsystem are reliability, weight, power expendability requirements,<br />
recover)" efficiency, and ease of integration with the thermal/humidity<br />
control and solid waste subsystems. There are many water recover)'<br />
methods in various stages of development. This discussion will be limited<br />
to those which appear to be candidate subsystems for space application.<br />
Others can be assumed to be either too heavy, require too much power,<br />
or are of unproven feasibility.<br />
Vapor Distillation Pyrolysis. In the vapor distillation and pyrolysis<br />
process waste water is catalytically oxidized in the vapor phase prior to<br />
condensation. A schematic diagram of a typical system which was used<br />
during a 90 day manned test conducted for the National Aeronautics and<br />
Space Administration by the McDonnell-Douglas Aircraft Corporation is<br />
shown in figure20-1. Waste water is admitted into a zero gravity<br />
evaporator. The evaporator has a membrane at one end through which<br />
only vapor passes, which achieves liquid/gas separation. Residue is removed<br />
periodically from the evaporator to be further treated or stored. From<br />
the evaporator, the vapor passes into a regenerative heat exchanger where<br />
it is heated to about 1360°F. This vapor, along with some air and/or<br />
oxygen that is bled in, passes into the pyrolysis chamber where ammonia<br />
and volatile organics are oxidized. A platinum g'auzc catalyst and a<br />
resistive heating element are used to bring the vapor to a temperature of<br />
1500°F. Vapor leaving the pyrolysis chamber passes to a heat exchanger.<br />
The relatively cool vapor then enters the condenser where cooling fluid<br />
condenses the vapor. Condensable and noncondensable gases, mainly<br />
nitrogen, are forced out of the condenser periodically by a piston<br />
activated by compressed air or nitrogen. Nonconden_ble gases are<br />
separated from the existing liquid by a static liquid/gas separator,<br />
preferably a nonwettable membrane.
Aerospace Vehicle Water-Waste Management 925<br />
Figure 20-1. Vapor distillation pyrolysis waste water recovery system.
926 Bioastronautics Data Book<br />
Vapor Compression. Vapor compression, or compression distillation, is a<br />
process in which the latent heat of vaporization of the liquid feed is conserved.<br />
Heat transfer from the condensing vapor is accomplished by compressing the<br />
vapor so that it condenses at a high pressure and thus, a higher temperature. As a<br />
result, a temperature difference is created between the evaporator and condenser<br />
which makes the process possible. Even though the maximum vapor temperature<br />
can be as high as IO0°F, the extent of breakdown of urea and other organics is<br />
low. Condensate from this process must therefore be further treated to render it<br />
potable. Filtration through activated charcoal and ion-exchange resins, and a<br />
bacteria filter sufficiently purify the condensate to make it potable.<br />
A schematic diagram of one type of a vapor compression system is shown in<br />
figure 20-2. Urine containing a chemical disinfectant is fed to the rotating evaporator<br />
where heat from the condcnser vaporizes the liquid at about 0.35 psia. The<br />
rotating evaporator-condenser is a cylinder: the inside is the evaporating surface<br />
and the outside, the condensing surface. The compressor motor, enclosed in the<br />
evapor-condenser shell, gives up heat which is utilized as makeup heat for vaporization.<br />
This replaces the heat given up by the condensing vapor to the surroundings.<br />
Vapor from the evaporating surface is compressed to about 0.70 psia and delivered<br />
to the condenser side of the drum. When condensed, a cam-activated pump forces<br />
the condensate water back to ambient pressure and out of the condensing chamber.<br />
A vacuum pump removes noncondensable gases from the condenser chamber to<br />
prevent a buildup in pressure. These gases are passed through an activated charcoal<br />
filter to the atmosphere. The urine residue collecting in the evaporator is removed<br />
periodically and stored.<br />
_AT_ SVPPL_<br />
VAPO_ COMPR_-SS_ON L_NIT<br />
V_pO.ATOR<br />
"H ¢l iLJ L_<br />
Figure 20-2. Vapor compression system for urine processing.
Waste Recovery Subsystem<br />
Aerospace Vehicle Water-Waste Management 927<br />
One of the first solid waste receivers to be extensively tested was the "Dry<br />
John." This device was used by a four-man crew in a sixty day chamber test.<br />
Figure 20-3 is a schematic of hardware developed for NASA. The unit consisted<br />
of a seat, a mechanical vacuum valve, a receiving chamber, a motorized slinger<br />
rotor, exhaust lines, and bacteria and odor control (charcoal) filters.<br />
DISINF STOI4AGE ECT, ]<br />
* 1<br />
i TIX_:U XO/71_<br />
(_ It K DIS( ONNF:C3 /<br />
FE_ _S<br />
t .... , 1"-......<br />
,k.j. SPill<br />
I<br />
_ c_x'i AIN_I_<br />
5_{ OND_RY _ _( I I N_<br />
SOI F:N(]II)N<br />
BI OWEI_ I _]TH Sf:Ai \ _[ \ )-<br />
WI] II ODOR<br />
FI[ TFI_ I<br />
A'It RFTI [IN<br />
r[) CABIN<br />
Figure 20-3. "Dry John" solid waste processing unit.<br />
The Dry John test reduced the water content of feces and vomitus to less<br />
than 30 percent water. At this point, there appears to bc no further bacterial<br />
action, no odor, and no danger of infection. No attempt was made to salvage the<br />
water removed from the waste matter.<br />
In actual use of the Dry John device, positive control of fecal material was<br />
obtained by a control-air flow drawn through the seat by suction created by the<br />
control-air fan. The air was directed towards the anal opening, where it turns and<br />
sweeps vertically down past the mechanical vacuum valve. In use, the fecal<br />
matter was carried down by the airstream to make contact with the spinning<br />
slinger. The slinger shredded the fecal matter and centrifuged it, in a thin layer,<br />
against the drying chamber's inner surface. The control-air flow passed the<br />
slinger, and the slinger motor, into the exhaust line, through the vacuum valve,<br />
blower, bacteria filter, charcoal filter, and back to the cabin.
928 Bioastronautics Data Book<br />
The toilet tissue used by the crew was dropped into the drying<br />
chamber. The tissue was centrifuged and mixed with the fecal matter. After<br />
use, the mechanical vacuum valve below the seat was closed and the slinger<br />
motor turned off, tile vacuum valve leading to the cabin air blower closed,<br />
the cabin air blower shut off and the vacuum valve leading to the simulated<br />
space vacuum source was opened. This caused the pressure in the drying<br />
chamber to drop to nearly vacuum and to evaporate the water in the waste<br />
matter. Evaporation was relatively fast, because the wet fecal matter had<br />
spread in a thin layer over a large area. Heat was drawn into the dryer by<br />
conduction through the walls to prevent freezing before all the water was<br />
removed. The relatively large drying chamber surface area and the thin<br />
waste layer resulted in good heat transfer.<br />
Bacterial and charcoal filters were provided on the vacuum line since the<br />
vacuum pump discharged to the atmosphere. Approximately 4 hours were<br />
required to dry a man's daily fecal matter. The single unit had the capacity<br />
to handle the wastes of the four-man test crew.<br />
When a second crewman used the Dry John, he did not have to wait<br />
until the wastes of the previous user had completely dried, tie used it<br />
immediately by shutting the high vacuum valve, starting the cabin air<br />
blower, opening the cabin air vacuum valve, starting the slinger motor and<br />
opening the mechanical vacuum valve under the seat.<br />
A vomitus collection adapter was provided for the Dry John. This<br />
device inserts into the seat opening so that the control airflow ducts are<br />
blocked off. This causes air to be drawn through holes in the adapter for<br />
zero-g collection. The vomitus is spread along the drying chamber wall and<br />
is dried in the same manner as fecal material.<br />
Debris<br />
The crews of any aerospace vehicle will generate particulate matter from<br />
their bodies and their clothing. Equipment also releases particulates. In a<br />
weightless state this debris will float in the cabin until it is entrained by<br />
the ventilation gas or is separated and captured by a surface (such as a<br />
crewman's lungs). Of course, the ventilation gas and filters will remove most<br />
of the debris; however, some spaces in the cabin will tend to accumulate<br />
floating debris due to a lack of sufficient ventilation. Therefore, on long<br />
duration missions (of one or more weeks) a vacuum cleaner should be<br />
provided to collect this material--which may include viable microorganisms<br />
and the media necessary for growth.<br />
If the vehicle is provided with a pneumatic collection system for urine<br />
and/or feces, the fan used for this purpose can also be used to draw gas into a<br />
small debris collection bag. This bag can be made from the same material as the<br />
fecal collection bag. A gas flow rate of 5 ft3/min is adequate for this<br />
purpose.
Aerospace Vehicle Water-WasteManagement 929<br />
A personal grooming device-vacuum cleaner is provided on a branch of<br />
the control air circuit of the waste management unit. This collects hair, nail<br />
clippings, shaving clippings, etc. Collection bags are provided to dry and<br />
store the wastes. There are three key problem areas associated with the Dry<br />
John integrated waste management system at the present time. They are:<br />
1. The vacuum seals in the fecal receiver are critical in minimizing the<br />
loss of cabin atmosphere.<br />
2. Lubrication of the fecal slinger motor may be required after long<br />
exposure to hard vacuum.<br />
3. The adsorbent beds in the fecal collector must be properly sized for<br />
odor control.<br />
Disposal and Processing<br />
Collected wastes must be either stored in an aesthetic and sanitary<br />
manner or dumped overboard to protect the crew from microorganisms and<br />
noxious gases. The best technique for a specific vehicle depends upon the<br />
mission duration and the onboard equipment to support a waste disposal<br />
subsystem.<br />
Storage Onboard. Wastes can be stored satisfactorily by merely scaling them<br />
in a container. However, if the wastes contain microorganisms, water and<br />
nutrients, biological activity call occur and produce undesirable gases. Tire<br />
pressure developed is a function of the container ullage, water and nutricnt<br />
available, types of microorganisms active, gas available, and storage tcmperature.<br />
Under ideal conditio ns, each gram of waste material could produce 10 ft 3 of gas. s<br />
For safe storage of wastes such as urine, feces, vomitus, unused food, and debris<br />
processing prior to storage is needed to prevent or minimize biological activity.<br />
Processing methods include: (1) killing the microorganisms, (2) freezing the<br />
wastes, and/or (3) removing the water.<br />
The urine and liquid waste collection subsystem should be disinfccted<br />
periodically to prevent biological growth and production of noxious gases in this<br />
area. Several disinfectants are satisfactory for this purpose; for example,<br />
Wescodyne, a mixture containing iodine complexed with surface active<br />
agents. In most cases, the quantity of disinfectant required is less than<br />
0.1 percent. If a disinfectant is provided for tire urine collection subsystem<br />
it will also serve to stabilize the urine for onboard storage or water<br />
reclamation.<br />
Di_nfectants or germicides have also been used to prepare feces and<br />
debris for onboard storage ill plastic bags. Tests tlave becn performed to demon-<br />
"ate that a 15 ml mixture of germicide, water and humectant is capable of induc-<br />
',d sterility in feces; however, only 10 ml of this mixture is required to con-<br />
',_ction. In practice, the germicidal mixture is usually supplied in a<br />
"_ collection bag; it is then distributed by breaking tile small bag<br />
¢,_r ten minutes to uniformly distribute the germicide.
930 Bioastronautics Data Book<br />
The most positive and reliable method for killing microorganisms is heating<br />
the wastes to a temperature above 250°F, and holding at this temperature for at<br />
lcast ten minutes. This technique is attractive when waste heat is available; if<br />
electric power n,ust be used, this method usually imposes a higher weight<br />
penalty than other storage techniques. Also, heat sterilization has the<br />
disadvantages of (1) producing internal pre_ures higher than 30 psia, and<br />
(2) generating obnoxious odors.<br />
Biological activity can be retarded by freezing wastes. For maximum effect,<br />
a storage temperature of O°F is recommended. Conveutional refrigeration<br />
techniques can be utilized to cool and maintain wastes at this temperature-but<br />
at the expen_ of electric power. Another approach is to freeze-dry the wastes in<br />
an insulated storage container, using the latent heat of water sublimation to<br />
remove the heat transferred through the insulation (Zeff et at., 1961; Rollo &<br />
Popoff 1965). This technique is very attractive for missions without water<br />
recovery because the wastes are also dried, which serves to backup the freezing<br />
teehnique. The disadvantages of this technique are that (1) a vacuum storage<br />
ves_el is required and (2) an appreciable quantity of cabin gas is lost overboard<br />
unless a waste loading lock is provided.<br />
The simplest and most versatile method for storing all types of waste is<br />
vacuum drying-to remove the water necessary for biological mobility and<br />
growth. This technique does not "kill" the microorganisms, but it does<br />
inactivate them s, fficiently to permit storage in a plastic bag for periods of<br />
120 days or more. The drying pressure recommended is 0.3 psia or less, so that<br />
cabin heat can be utilized for vaporization of water and other low molecular<br />
weight constituents.<br />
References<br />
Charanian, T. R., Rollo, J., Glueekert, A. J., & Hurley, T. L. Extended mission Apollo<br />
study on water reclamation, waste management and personal hygiene. GARD Rept.<br />
1276-6070, November 1965.<br />
Des Jardins, Zeff, J. D., & Bambenek, R. A. Waste collection unit for a space vehicle.<br />
WADD, TR.60-290, May 1960.<br />
Dodson, J., & Wallman, H. Research on a waste system for aerospace stations.<br />
AMRL-TDR-64-33, May 1964.<br />
hq_'am, W. 1'. The engineering biotechnology of handling wastes resulting from a dosed<br />
ecological _Tstem. AFOSR-TR-58-148, February 1958.<br />
Jagow, R. B., & Saunders, C. G. The processing of human wastes by wet oxidation for<br />
manned spacecraft. ASME Rept. 70-AV1 SPT-1, undated.<br />
Miner, H. C., Sanford, H. L., Segal, M. R., & Wallman, H. Collection unit for wastes during<br />
space travel. ASD TR-61-314, July 1961.<br />
Rollo, E. J., & Popoff, W. A. Waste management system. GARD Rept. 1252-7080,<br />
December 1965.<br />
Rollo, E. J., llonegger, R. J., & Candes, R. A. Apollo applications program w.,<br />
malutgement system. G ARD Rept. 1276-9598, March 1967.<br />
Zeff, J. D., Neveril, R. B., et al. Storage unit for waste materials. ASD<br />
1961.<br />
U. S. GOVERNMENT PRINTING OFFICE : 1973 O - 487-858