

Magnitude 7.2 EASTERN TURKEY - IRIS
Magnitude 7.2 EASTERN TURKEY - IRIS
Magnitude 7.2 EASTERN TURKEY - IRIS

You also want an ePaper? Increase the reach of your titles
YUMPU automatically turns print PDFs into web optimized ePapers that Google loves.
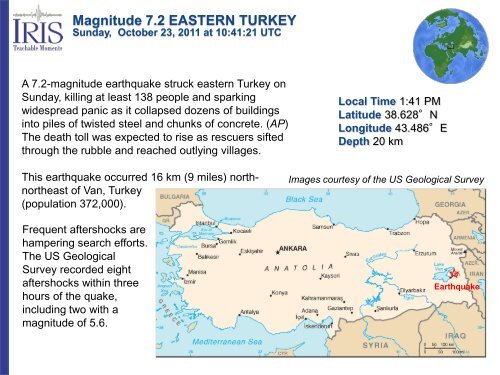
<strong>Magnitude</strong> <strong>7.2</strong> <strong>EASTERN</strong> <strong>TURKEY</strong><br />
Sunday, October 23, 2011 at 10:41:21 UTC<br />
A <strong>7.2</strong>-magnitude earthquake struck eastern Turkey on<br />
Sunday, killing at least 138 people and sparking<br />
widespread panic as it collapsed dozens of buildings<br />
into piles of twisted steel and chunks of concrete. (AP)<br />
The death toll was expected to rise as rescuers sifted<br />
through the rubble and reached outlying villages.<br />
Local Time 1:41 PM<br />
Latitude 38.628°N<br />
Longitude 43.486°E<br />
Depth 20 km<br />
This earthquake occurred 16 km (9 miles) northnortheast<br />
of Van, Turkey<br />
(population 372,000).<br />
Frequent aftershocks are<br />
hampering search efforts.<br />
The US Geological<br />
Survey recorded eight<br />
aftershocks within three<br />
hours of the quake,<br />
including two with a<br />
magnitude of 5.6.<br />
Images courtesy of the US Geological Survey<br />
Earthquake
<strong>Magnitude</strong> <strong>7.2</strong> <strong>EASTERN</strong> <strong>TURKEY</strong><br />
Sunday, October 23, 2011 at 10:41:21 UTC<br />
Shaking intensity scales were developed to standardize the measurements and ease<br />
comparison of different earthquakes. The Modified-Mercalli Intensity scale is a twelve-stage<br />
scale, numbered from I to XII. The<br />
lower numbers represent<br />
imperceptible shaking levels while<br />
XII represents total destruction. A<br />
value of IV indicates a level of<br />
shaking that is felt by most people.<br />
Modified Mercalli Intensity<br />
Perceived<br />
Shaking<br />
Extreme<br />
Violent<br />
Severe<br />
Very Strong<br />
Strong<br />
Moderate<br />
Light<br />
Weak<br />
Not Felt<br />
Image courtesy of the US Geological Survey<br />
USGS Estimated shaking Intensity from M <strong>7.2</strong> Earthquake
<strong>Magnitude</strong> <strong>7.2</strong> <strong>EASTERN</strong> <strong>TURKEY</strong><br />
Sunday, October 23, 2011 at 10:41:21 UTC<br />
The USGS PAGER map shows the population<br />
exposed to different Modified-Mercalli Intensity<br />
(MMI) levels. MMI describes the severity of an<br />
earthquake in terms of its effect on humans<br />
and structures and is a rough measure of the<br />
amount of shaking at a given location.<br />
USGS PAGER<br />
Population Exposed to Earthquake Shaking<br />
Overall, the population in this region resides in<br />
structures that are a mix of vulnerable and<br />
earthquake resistant construction. The<br />
predominant vulnerable building types are<br />
unreinforced brick masonry and nonductile<br />
reinforced concrete frame construction.<br />
Image courtesy of the US Geological Survey
<strong>Magnitude</strong> <strong>7.2</strong> <strong>EASTERN</strong> <strong>TURKEY</strong><br />
Sunday, October 23, 2011 at 10:41:21 UTC<br />
Turkey is a tectonically active country that<br />
experiences frequent destructive earthquakes.<br />
This earthquake is a reminder of the many<br />
deadly seismic events that Turkey has suffered<br />
in the recent past.<br />
Izmit earthquake of 1999 (M7.6), 1000 km to the<br />
west, 17,000 people killed, injured 50,000, and<br />
left 500,000 homeless.<br />
Within about 70 km of the November 1976 M7.3<br />
earthquake that destroyed several villages near<br />
the Turkey and Iran border and killed several<br />
thousand people.<br />
A M7.8 earthquake struck Erzincan in 1939,<br />
killing an estimated 33,000 people.<br />
Image courtesy of the US Geological Survey<br />
The map shows earthquakes recorded from 1990 to<br />
present in this region with this earthquake<br />
represented as an orange star.
<strong>Magnitude</strong> <strong>7.2</strong> <strong>EASTERN</strong> <strong>TURKEY</strong><br />
Sunday, October 23, 2011 at 10:41:21 UTC<br />
In the area of the earthquake, the Arabian Plate is colliding with Eurasia, and has built a<br />
complex mosaic of mountains by thrust and strike-slip faulting. Collision of the Arabian and<br />
Eurasian plates occurs in Eastern Turkey along the East Anatolian Fault Zone (EAFZ) and the<br />
Bitlis Suture, a large thrust fault, on which the October 23 earthquake occurred.<br />
According to the USGS NEIC, “Large,<br />
translational fault systems extend across<br />
much of central and western Turkey and<br />
accommodate the western motion of the<br />
Anatolian block as it is being squeezed by<br />
the converging Arabian and Eurasian plates.”<br />
Earthquake<br />
Summary tectonic map of eastern Turkey. The large arrows are the approximate directions of motion of Turkey, Arabia, and<br />
central Iran relative to Eurasia. NAF=North Anatolian Fault; EAF=East Anatolian Fault; DSF=Dead Sea Fault (Sandvol et al.)
<strong>Magnitude</strong> <strong>7.2</strong> <strong>EASTERN</strong> <strong>TURKEY</strong><br />
Sunday, October 23, 2011 at 10:41:21 UTC<br />
Reverse (or Thrust) Fault<br />
The October 23, 2011 earthquake occurred in a broad<br />
region of convergence beyond the eastern extent of<br />
Anatolian strike-slip tectonics. The focal mechanism<br />
of today's earthquake is consistent with oblique-thrust<br />
faulting similar to mapped faults in the region.<br />
In the area of Van, Turkey<br />
and further east,<br />
tectonics are dominated<br />
by the Bitlis Suture Zone<br />
(in eastern Turkey) and<br />
Zagros fold and thrust<br />
belt (toward Iran).<br />
Image courtesy of the US Geological Survey<br />
Earthquake<br />
USGS WPhase Centroid<br />
Moment Tensor Solution<br />
Shaded areas show quadrants of the focal sphere in which the P-wave first-motions are away from<br />
the source and unshaded areas show quadrants in which the P-wave first-motions are toward the<br />
source. The dots represent the axis of maximum compressional strain (in black, called the "pressure<br />
[P] axis") and the axis of maximum extensional strain (in white, called the ”tension [T] axis") resulting<br />
from the earthquake.
<strong>Magnitude</strong> <strong>7.2</strong> <strong>EASTERN</strong> <strong>TURKEY</strong><br />
Sunday, October 23, 2011 at 10:41:21 UTC<br />
Back Projections are movies created from an<br />
automated data processing sequence that<br />
stacks up P wave energy recorded on many<br />
seismometers on a flat grid around the source<br />
region. This grid is meant to be a fault surface<br />
and creates a time and space history of the<br />
earthquake.<br />
In the animated back projections, warmer<br />
colors indicate greater displacement on the<br />
fault.<br />
The graph below the map shows the time<br />
distribution of rupture during the earthquake.
<strong>Magnitude</strong> <strong>7.2</strong> <strong>EASTERN</strong> <strong>TURKEY</strong><br />
Sunday, October 23, 2011 at 10:41:21 UTC<br />
The above map shows the predicted (theoretical) travel times, in minutes, of the first<br />
compressional (P) wave from the earthquake to points around the globe.<br />
The heavy black lines shown are the approximate distances to the P-wave shadow<br />
zone (103 -140 degrees)<br />
Image courtesy of the US Geological Survey
<strong>Magnitude</strong> <strong>7.2</strong> <strong>EASTERN</strong> <strong>TURKEY</strong><br />
Sunday, October 23, 2011 at 10:41:21 UTC<br />
USArray: A Continental-Scale Seismic Observatory<br />
USArray is a<br />
transportable grid of<br />
400 high-quality<br />
broadband<br />
seismometers that are<br />
moving (every two<br />
years) across the<br />
United States from west<br />
to east.<br />
The grid will move to<br />
Alaska after sweeping<br />
across the lower 48<br />
states.<br />
Resulting data are used<br />
to image the structure<br />
of the North American<br />
continent and the<br />
underlying mantle.<br />
Operating USArray Stations. The 400 active transportable array stations<br />
are plotted in red. Permanent stations are plotted in blue.
<strong>Magnitude</strong> <strong>7.2</strong> <strong>EASTERN</strong> <strong>TURKEY</strong><br />
Sunday, October 23, 2011 at 10:41:21 UTC<br />
As earthquake waves travel along the<br />
surface of the Earth, they cause the ground<br />
to move. With the 400 earthquake<br />
recording stations in EarthScope’s<br />
Transportable Array, the ground motions<br />
can be captured and displayed as a movie,<br />
using the actual data recorded from the<br />
earthquake.<br />
When circles turn red, the station is moving<br />
up; when circles turn blue, the station is<br />
moving down.<br />
The seismogram along the bottom is from<br />
the station at the yellow circle.<br />
As seismic waves sweep across USArray,<br />
the relative velocities of the fast P, slower<br />
S, and slowest surface waves can be<br />
observed.
<strong>Magnitude</strong> <strong>7.2</strong> <strong>EASTERN</strong> <strong>TURKEY</strong><br />
Sunday, October 23, 2011 at 10:41:21 UTC<br />
Quick Time Required<br />
Animation of the<br />
generalized paths of<br />
seismic waves traveling<br />
from Turkey to three<br />
stations at varied<br />
distances around the<br />
globe.<br />
Seismic Wave Propagation


