A Scorecard on gender equality and girls ... - unesdoc - Unesco
A Scorecard on gender equality and girls ... - unesdoc - Unesco
A Scorecard on gender equality and girls ... - unesdoc - Unesco

Create successful ePaper yourself
Turn your PDF publications into a flip-book with our unique Google optimized e-Paper software.
United Nati<strong>on</strong>s Educati<strong>on</strong>al, Scientific<br />
<strong>and</strong> Cultural Organizati<strong>on</strong><br />
UNESCO Bangkok<br />
Advocacy Brief<br />
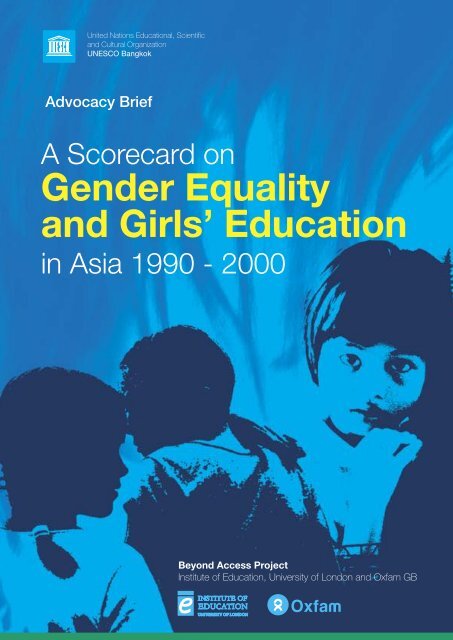
A <str<strong>on</strong>g>Scorecard</str<strong>on</strong>g> <strong>on</strong><br />
Gender Equality<br />
<strong>and</strong> Girls’ Educati<strong>on</strong><br />
in Asia 1990 - 2000<br />
Report prepared for UNESCO Bangkok, September 2004<br />
By<br />
Elaine Unterhalter<br />
Rajee Rajagopalan<br />
Chloe Challender<br />
Bey<strong>on</strong>d Access Project<br />
Institute of Educati<strong>on</strong>, University of L<strong>on</strong>d<strong>on</strong> <strong>and</strong> Oxfam GB
A scorecard <strong>on</strong> <strong>gender</strong> <strong>equality</strong> <strong>and</strong> <strong>girls</strong>’ educati<strong>on</strong> in Asia 1990-2000. Bangkok: UNESCO<br />
Bangkok, 2005.<br />
25 pp.<br />
1. Gender <strong>equality</strong>. 2. Girls’ educati<strong>on</strong>. 3. Access to educati<strong>on</strong>.<br />
4. Educati<strong>on</strong>al discriminati<strong>on</strong>. 5. Educati<strong>on</strong>al opportunities. 6. Asia.<br />
ISBN 92-9223-041-7<br />
© UNESCO 2005<br />
Published by the<br />
UNESCO Asia <strong>and</strong> Pacific Regi<strong>on</strong>al Bureau for Educati<strong>on</strong><br />
920 Sukhumvit Rd., Prakan<strong>on</strong>g<br />
Bangkok 10110, Thail<strong>and</strong><br />
Printed in Thail<strong>and</strong><br />
The designati<strong>on</strong>s employed <strong>and</strong> the presentati<strong>on</strong> of material throughout the publicati<strong>on</strong> do not imply<br />
the expressi<strong>on</strong> of any opini<strong>on</strong> whatsoever <strong>on</strong> the part of UNESCO c<strong>on</strong>cerning the legal status of any<br />
country, territory, city or area or of its authorities, or c<strong>on</strong>cerning its fr<strong>on</strong>tiers or boundaries.<br />
APL/05/OS/121-250
Table of C<strong>on</strong>tents<br />
A <str<strong>on</strong>g>Scorecard</str<strong>on</strong>g> <strong>on</strong> Girls’ Educati<strong>on</strong> in Asia 1990 - 2000 1<br />
The 1990 <strong>and</strong> 2000 <str<strong>on</strong>g>Scorecard</str<strong>on</strong>g>s 5<br />
C<strong>on</strong>clusi<strong>on</strong> 9<br />
Appendix 1<br />
Calculating the Girls’ Access <strong>and</strong> Retenti<strong>on</strong> in Educati<strong>on</strong> <str<strong>on</strong>g>Scorecard</str<strong>on</strong>g> for 2000 10<br />
Table A: Selected indicators of <strong>girls</strong>’ access to <strong>and</strong> retenti<strong>on</strong> in school for 2000 10<br />
Table B: Criteria for scoring achievements with regard to access <strong>and</strong> achievement<br />
in <strong>girls</strong>’ educati<strong>on</strong> 12<br />
Table C: Scores <strong>and</strong> indicators 13<br />
Table D: Raw country score measurements for 2000 13<br />
Table E: Final 2000 <str<strong>on</strong>g>Scorecard</str<strong>on</strong>g>: Four measurements 15<br />
Table F: 2000 <str<strong>on</strong>g>Scorecard</str<strong>on</strong>g> ranking 16<br />
The 2000 <str<strong>on</strong>g>Scorecard</str<strong>on</strong>g> 17<br />
Table G: Gender Equality <strong>and</strong> Educati<strong>on</strong> 2000 <str<strong>on</strong>g>Scorecard</str<strong>on</strong>g> 17<br />
Appendix 2<br />
Calculating the Girls’ Educati<strong>on</strong> 1990 <str<strong>on</strong>g>Scorecard</str<strong>on</strong>g> 18<br />
Table A: Selected indicators of <strong>girls</strong>’ access to <strong>and</strong> retenti<strong>on</strong> in educati<strong>on</strong> c.1990 18<br />
Table B: Raw country scores in 4 areas of measurement c.1990 20<br />
Table C: Weighted scores in four measures <strong>and</strong> final scorecard c.1990 21<br />
Table D: 1990 <str<strong>on</strong>g>Scorecard</str<strong>on</strong>g> ranking 22<br />
Table E: An alternative estimate of Sri Lanka’s score 23<br />
References 24
A <str<strong>on</strong>g>Scorecard</str<strong>on</strong>g> <strong>on</strong> Girls’ Educati<strong>on</strong> in Asia 1990 - 2000 1<br />
This briefing reports <strong>on</strong> results derived from applying to Asian countries a methodology for measuring<br />
<strong>gender</strong> <strong>equality</strong> in schooling <strong>and</strong> educati<strong>on</strong> used by the Bey<strong>on</strong>d Access project, <strong>and</strong> first documented<br />
in a report to the Comm<strong>on</strong>wealth Secretariat <strong>on</strong> Comm<strong>on</strong>wealth countries in Africa (Unterhalter<br />
et al, 2004). The methodology takes some ideas of measurement associated with Amartya Sen’s<br />
capability approach <strong>and</strong> utilizes these in relati<strong>on</strong> to existing data sets regarding <strong>girls</strong>’ access to<br />
<strong>and</strong> c<strong>on</strong>tinuati<strong>on</strong> in school, as well as to their survival into adult life. (Sen, 1999; Unterhalter <strong>and</strong><br />
Brighouse, 2003).<br />
The ideas that have driven the c<strong>on</strong>structi<strong>on</strong> of this scorecard are multi-faceted. Existing measures<br />
for access to <strong>and</strong> efficiency in the school system are very limited as measures of <strong>gender</strong> <strong>equality</strong>,<br />
even though there have been marked improvements in sex-disaggregated of data. These access<br />
<strong>and</strong> retenti<strong>on</strong> measures cannot, in their raw form, point to a wider underst<strong>and</strong>ing of <strong>gender</strong> <strong>equality</strong><br />
in schooling nor, as a result, in the area of educati<strong>on</strong> more generally. Thus, the idea for developing a<br />
scorecard that weighs enrolment, participati<strong>on</strong> <strong>and</strong> survival into adulthood originated from c<strong>on</strong>cern<br />
over the need to find a publicly accountable measure that could distil some general comp<strong>on</strong>ents of<br />
human flourishing linked to educati<strong>on</strong> <strong>and</strong> schooling. This has been d<strong>on</strong>e using insights from the<br />
UNDP’s Gender Development Index (GDI), <strong>and</strong> linking these with the data <strong>on</strong> schooling collected by<br />
UNICEF <strong>and</strong> UNESCO.<br />
We are aware of the many pitfalls associated with this approach to measurement <strong>and</strong> with the<br />
c<strong>on</strong>structi<strong>on</strong> of scorecards: The risk of an over-summarized representati<strong>on</strong> of complex historical<br />
processes diminishing a thorough underst<strong>and</strong>ing of the situati<strong>on</strong>. The approach also suggests the<br />
interrelati<strong>on</strong>ship between countries or regi<strong>on</strong>s as competitive – a culture of winners <strong>and</strong> losers –<br />
when, in actuality, they are deeply interrelated <strong>and</strong> in need of each other’s support. It sets up an<br />
arbitrary board of scorers, who generally have little experience with delivery, to judge performance.<br />
It tends to extinguish the processes entailed in working towards achievement, scoring <strong>on</strong>ly ‘results.’<br />
In additi<strong>on</strong>, because of highly aggregated data, a scorecard presents inflated versi<strong>on</strong>s of some<br />
countries’ achievements <strong>and</strong> deflated versi<strong>on</strong>s of others, particularly countries where there are wide<br />
regi<strong>on</strong>al variati<strong>on</strong>s in relati<strong>on</strong> to the selected indicators of <strong>gender</strong> <strong>equality</strong>. Because of the extensive<br />
reliance <strong>on</strong> government data, which is not always of high quality, countries that inflate enrolment or<br />
retenti<strong>on</strong> ratios, possibly to attract d<strong>on</strong>ors, might appear as high scorers, while countries that take<br />
care with the validity of data are penalized <strong>and</strong> appear as low scorers. Any of these are compelling<br />
reas<strong>on</strong>s not to proceed down this path of analysis, with regard to either scorecards or measures of<br />
<strong>gender</strong> equity.<br />
However, aside these arguments lies the c<strong>on</strong>fusi<strong>on</strong> that results from not knowing which countries<br />
or districts are improving their <strong>gender</strong> equity in educati<strong>on</strong>. Bey<strong>on</strong>d the very limited insights provided<br />
by enrolment <strong>and</strong> retenti<strong>on</strong> data, the questi<strong>on</strong>s of which areas need resources (understood more<br />
broadly than desks <strong>and</strong> classrooms), in what form <strong>and</strong> why remain difficult to answer without hard<br />
informati<strong>on</strong>. Insight into how countries can learn from each other must also be sought. Hence,<br />
with an emphasis <strong>on</strong> taking the Millennium Development Goal 2 (MDG) seeking <strong>gender</strong> <strong>equality</strong> in<br />
educati<strong>on</strong> by 2005 seriously, the Bey<strong>on</strong>d Access project outlook focuses <strong>on</strong> harnessing all available<br />
energies to work together in support of the MDG (Aikman, Challender <strong>and</strong> Unterhalter, 2003). This<br />
has led to the development of a methodology that can measure a problem of global significance. Our<br />
view is that this pressing need mitigates to some extent against the negative aspects of scorecards<br />
as outlined above.<br />
1 Our thanks to Joseph Crawford <strong>and</strong> Jacob Steel for help with working out the formulae used in the scorecard<br />
<strong>and</strong> assessing the usability of some of the data.<br />
2 Millennium Development Goal 3: Eliminate <strong>gender</strong> disparity in primary <strong>and</strong> sec<strong>on</strong>dary educati<strong>on</strong> preferably by<br />
2005, <strong>and</strong> at all levels by 2015.<br />
A <str<strong>on</strong>g>Scorecard</str<strong>on</strong>g> <strong>on</strong> Gender Equality <strong>and</strong> Girls’ Educati<strong>on</strong> in Asia 1990–2000 1
It is in this spirit that the scorecards discussed here have been developed; however, c<strong>on</strong>structing<br />
them has not been a simple matter. Despite the excellent data put together by UNESCO <strong>and</strong> UNICEF,<br />
there are gaps in their tables. Where these have occurred, we have searched for the missing data<br />
in country reports, UNDP <strong>and</strong> World Bank reports or other published output (see Appendices 1<br />
<strong>and</strong> 2). We have also interviewed various people with in-depth country knowledge (see Appendix<br />
3). Inevitably, though, gaps remain. Some countries, notably Afghanistan, Bhutan <strong>and</strong> Brunei, have<br />
no publicly available data for 2000 c<strong>on</strong>cerning key areas of <strong>gender</strong> <strong>equality</strong> used in this scorecard.<br />
We have, therefore, had to omit them from the analysis. Other countries - Cambodia, Viet Nam <strong>and</strong><br />
Myanmar - have incomplete data for the 1990 table, <strong>and</strong> they have been omitted from the comparative<br />
discussi<strong>on</strong>. There is a particular problem that relates to the countries of Central Asia which in 1990<br />
were part of the USSR. While the tables in Appendices 1 <strong>and</strong> 2 are, themselves, not assembled from<br />
data sources of equal quality, we have compiled the fullest statement of measurements in these four<br />
areas so far put together, <strong>and</strong> we hope they will be of use to other researchers whether or not they<br />
draw <strong>on</strong> the <str<strong>on</strong>g>Scorecard</str<strong>on</strong>g>’s approach.<br />
Given all these difficulties of c<strong>on</strong>ceptualizati<strong>on</strong>, measurement, quality <strong>and</strong> accessibility of data, the<br />
<str<strong>on</strong>g>Scorecard</str<strong>on</strong>g> On Gender Equality <strong>and</strong> Girls’ Educati<strong>on</strong> in Asia is intended to exp<strong>and</strong> underst<strong>and</strong>ing<br />
<strong>and</strong> facilitate comparis<strong>on</strong> with regard to achievements of <strong>gender</strong> equity in <strong>and</strong> through schooling.<br />
Measures have not been based <strong>on</strong> the Gender Parity Index (GPI), but <strong>on</strong> measures of <strong>girls</strong>’ participati<strong>on</strong><br />
in <strong>and</strong> benefits from schooling. This is partly because the GPI gives scant insight into the qualitative<br />
dimensi<strong>on</strong>s of schooling for <strong>girls</strong> <strong>and</strong> boys, as well as into the intersecti<strong>on</strong> of schooling with other<br />
areas of social policy. A sec<strong>on</strong>d reas<strong>on</strong> for not drawing <strong>on</strong> the GPI is that an emerging c<strong>on</strong>sensus<br />
from a number of country studies suggests that when the quality of educati<strong>on</strong> improves for <strong>girls</strong>, it<br />
generally improves for boys, too (Mlama, 2003; Muito 2003; Global Campaign for Educati<strong>on</strong>, 2003;<br />
Pattman <strong>and</strong> Chege, 2003). However, in some regi<strong>on</strong>s of the world, there are problems with boys<br />
not c<strong>on</strong>tinuing in school, <strong>and</strong> an interesting extensi<strong>on</strong> of this study might cover a scorecard <strong>on</strong> boys’<br />
schooling, as well.<br />
<str<strong>on</strong>g>Scorecard</str<strong>on</strong>g> tables are based <strong>on</strong> a number of key indicators with regard to <strong>girls</strong>’ schooling <strong>and</strong><br />
educati<strong>on</strong> in Asia. Technical informati<strong>on</strong> c<strong>on</strong>cerning the c<strong>on</strong>structi<strong>on</strong> of the scorecards is to be found<br />
in Appendix 1 for the 2000 <str<strong>on</strong>g>Scorecard</str<strong>on</strong>g> <strong>and</strong> Appendix 2 for the 1990 <str<strong>on</strong>g>Scorecard</str<strong>on</strong>g>. The scorecards have<br />
been developed to look at access <strong>and</strong> retenti<strong>on</strong> in broader ways than analysed heretofore. They look<br />
not <strong>on</strong>ly at numbers of <strong>girls</strong> who attend <strong>and</strong> remain in primary school, but also at whether those <strong>girls</strong><br />
are able to translate their attendance <strong>and</strong> retenti<strong>on</strong> into future sec<strong>on</strong>dary-level schooling <strong>and</strong> healthy,<br />
income-earning lives. Four widely-used measures have been employed to develop the score for <strong>girls</strong>’<br />
access to <strong>and</strong> retenti<strong>on</strong> in school. These measures are:<br />
• Girls’ net attendance rate at primary school<br />
• Girls’ survival rate over 5 years in primary schooling<br />
• Girls’ sec<strong>on</strong>dary Net Enrolment Ratio (NER)<br />
• Country <strong>gender</strong> development index (GDI)<br />
These measures were selected because they point to access into primary schooling (net attendance<br />
rate) derived from household surveys, retenti<strong>on</strong> in primary schooling (survival rates), potential of<br />
the educati<strong>on</strong> system to generate teachers <strong>and</strong> managers who care about <strong>gender</strong> <strong>equality</strong> (<strong>girls</strong>’<br />
sec<strong>on</strong>dary NER), <strong>and</strong> the possibilities for these women to survive <strong>and</strong> flourish as adults (GDI). We<br />
are aware of the c<strong>on</strong>siderable difficulties in using NER because of the inadequacy of birth registrati<strong>on</strong><br />
informati<strong>on</strong>, but, as discussed below, when no attendance rate was available for a country, NER<br />
has been used as a proxy for attendance. The Gender Empowerment Measure 3 (GEM) would have<br />
been a str<strong>on</strong>ger indicator of <strong>gender</strong> equility in a country than the GDI, but the GEM has not been<br />
3 Gender Empowerment Measure, used by UNDP in its Human Development Report, is based <strong>on</strong> the percentage<br />
of seats in parliament occupied by women, the proporti<strong>on</strong> of jobs in senior management <strong>and</strong> professi<strong>on</strong>s<br />
held by women, <strong>and</strong> the proporti<strong>on</strong> of income earned by women. It is a better measure than GDI because it<br />
indicates how women put their educati<strong>on</strong> to use in relati<strong>on</strong> to decisi<strong>on</strong>-making <strong>and</strong> earning.<br />
2<br />
A <str<strong>on</strong>g>Scorecard</str<strong>on</strong>g> <strong>on</strong> Gender Equality <strong>and</strong> Girls’ Educati<strong>on</strong> in Asia 1990–2000
calculated for many countries in Asia, <strong>and</strong> comparative data from 1990 to 2000 was not available<br />
<strong>on</strong> the GEM. As a result, the GDI has been used to give comparative trends for all countries. An<br />
interesting follow up project might entail working with the GEM in selected countries to see if different<br />
trends emerge.<br />
The measures were weighted so that primary attendance (or enrolment when attendance figures<br />
were not available, notably for the 1990 data set) was <strong>on</strong>ly half as important as survival through five<br />
years of primary schooling. Sec<strong>on</strong>dary NER was scored somewhat more important than primary<br />
attendance, while a society’s health <strong>and</strong> wealth dimensi<strong>on</strong>s as reflected through the GDI were<br />
c<strong>on</strong>sidered twice as important as primary attendance.<br />
The 2000 <str<strong>on</strong>g>Scorecard</str<strong>on</strong>g> data has been largely based <strong>on</strong> government data collected by the UNESCO<br />
Institute for Statistics for the EFA Global M<strong>on</strong>itoring Report 2003, the UNICEF Report <strong>on</strong> the State<br />
of the World’s Children <strong>and</strong> each country’s own EFA assessments (UNESCO, 2003; UNICEF,<br />
2004). The data for the 1990 <str<strong>on</strong>g>Scorecard</str<strong>on</strong>g> comes from much more dispersed sources, <strong>and</strong> for some<br />
countries, <strong>on</strong>ly some very questi<strong>on</strong>able measures were available. Sex-disaggregated data was not<br />
systematically collected in 1990; school attendance rates were not surveyed <strong>and</strong> <strong>on</strong>ly some countries<br />
collected net enrolment rates at the primary <strong>and</strong> sec<strong>on</strong>dary levels. In additi<strong>on</strong>, eight countries in Asia<br />
did not exist in 1990 because they were part of the USSR.<br />
As described in Appendix 2, we have tried to overcome some of these very difficult problems with<br />
the data by using a variety of proxies. Thus, the earliest available sex-disaggregated primary school<br />
NER in the 1990s has been used as a proxy for <strong>girls</strong>’ school attendance rate in 1990. While NER<br />
cannot give informati<strong>on</strong> about how many children attend school <strong>on</strong> a given day, it provides some<br />
measure relating to <strong>girls</strong>’ access to school. This measurement has been used for 20 countries in<br />
Table A, Appendix 2. For the remaining seven countries for which we had nearly full datasets, we<br />
were not even able to find NER values for the early 1990s. For these countries, five of which were<br />
then part of the USSR, we have <strong>on</strong>ly been able to find sex-disaggregated GER data. Thus, for these<br />
<strong>and</strong> other reas<strong>on</strong>s related to informati<strong>on</strong> from the former USSR, we c<strong>on</strong>sider the data <strong>on</strong> the former<br />
Soviet Republics for 1990 to be unsafe.<br />
Using GER data inflates a country’s score because it measures all the children in school as a<br />
proporti<strong>on</strong> of a large age group, rather than NER, which measures children enrolled as a proporti<strong>on</strong><br />
of the appropriate age group, All seven countries for which GER is substituted for NER (Armenia,<br />
Azerbaijan, Kazakhstan, Sri Lanka, Tajikisatan, Uzbekistan, <strong>and</strong> Viet Nam) have high scores in the<br />
primary school enrolment column (see Table B, Appendix 2).<br />
We have not been able to complete a full dataset for Viet Nam in 1990 due to the absence of figures<br />
for primary school survival rates. Therefore, despite documenting <strong>girls</strong>’ GER in Viet Nam for the early<br />
1990s, we have drawn no c<strong>on</strong>clusi<strong>on</strong>s about the country’s positi<strong>on</strong> <strong>on</strong> the scorecard. However, if we<br />
include the GER for Sri Lanka in 1992, we do have a full dataset for that country. Using data based<br />
<strong>on</strong> the GER gives Sri Lanka quite a high positi<strong>on</strong> <strong>on</strong> the scorecard. In Table E, Appendix 2, we have<br />
d<strong>on</strong>e an alternative calculati<strong>on</strong> for Sri Lanka based <strong>on</strong> an estimated NER of 70%. We have estimated<br />
this based <strong>on</strong> accounts by Little (1999) <strong>and</strong> Gunarwardena (2003) of state educati<strong>on</strong>’s expansi<strong>on</strong> for<br />
<strong>girls</strong> <strong>and</strong> boys during the 1980s. Two scores for Sri Lanka are entered in Table 2.<br />
Data <strong>on</strong> the children’s survival rate in schooling was not disaggregated by sex until the late 1990s.<br />
However, a comparis<strong>on</strong> of the sex-disaggregated data in 2000 <strong>and</strong> the aggregated data for 1990<br />
indicates that there is at most <strong>on</strong>ly 5% difference either way for any <strong>on</strong>e country. This supports <strong>on</strong>e<br />
of the main findings of the UNESCO EFA Global M<strong>on</strong>itoring Report 2003: Once <strong>girls</strong> get into school,<br />
they remain there <strong>and</strong> do well (UNESCO, 2003). In light of this, <strong>and</strong> in order to have a measurement<br />
of <strong>girls</strong>’ school survival for the scorecard representing the early 1990s, we have used the period’s<br />
sex-disaggregated informati<strong>on</strong> for survival rates assuming that the level of error would not be too<br />
large.<br />
A <str<strong>on</strong>g>Scorecard</str<strong>on</strong>g> <strong>on</strong> Gender Equality <strong>and</strong> Girls’ Educati<strong>on</strong> in Asia 1990–2000 3
Virtually no sec<strong>on</strong>dary NERs were collected for <strong>girls</strong> in the 1990s. As Appendix 2 shows, we have<br />
largely had to use sec<strong>on</strong>dary GERs in this field of measurement. While we were initially c<strong>on</strong>cerned<br />
that this would artificially inflate country scores (the 2000 <str<strong>on</strong>g>Scorecard</str<strong>on</strong>g> used sec<strong>on</strong>dary NER), most<br />
countries - with the excepti<strong>on</strong> of the former Soviet Central Asian republics - had sec<strong>on</strong>dary GERs<br />
that did not look hugely inflated compared with the NERs recorded a decade later. Once again, in<br />
order to have proxy data, these measures were used; however, those c<strong>on</strong>sidered particularly unsafe<br />
are highlighted in the appendix (see Appendix 2, Tables A <strong>and</strong> B).<br />
As noted above, those less reliable figures are largely for the former Soviet states. For these countries,<br />
namely Armenia, Azerbaijan, Georgia, Kazakhstan, Kyrgyzstan, Tajikistan <strong>and</strong> Uzbekistan, no primary<br />
or sec<strong>on</strong>dary sources we c<strong>on</strong>sulted had sex-disaggregated regi<strong>on</strong>al figures for these areas in the<br />
1990s (although measures have been collected for 2000). We had to decide whether to omit these<br />
countries from the comparative 1990 Table altogether, or seek some proxy measure for 1990. We<br />
were interested to see what results would be achieved if the figure for the USSR was utilized in the<br />
areas of measurement for which there was no regi<strong>on</strong>al measure (primary <strong>and</strong> sec<strong>on</strong>dary NER <strong>and</strong><br />
primary retenti<strong>on</strong>). These figures, themselves, were not easy to obtain, but the results have been<br />
presented in Appendix 2. Indeed, the problems of aggregati<strong>on</strong> are enormously distorting for these<br />
countries, much more so than in India, where the nati<strong>on</strong>al figure has been arrived at through an open<br />
process of data collecti<strong>on</strong>. Therefore, the 1990 scores for these countries are c<strong>on</strong>sidered unsafe.<br />
While they are included to provide as full a data set as possible, any interpretati<strong>on</strong>s based <strong>on</strong> these<br />
figures need to be formulated with cauti<strong>on</strong>.<br />
4<br />
A <str<strong>on</strong>g>Scorecard</str<strong>on</strong>g> <strong>on</strong> Gender Equality <strong>and</strong> Girls’ Educati<strong>on</strong> in Asia 1990–2000
The 1990 <strong>and</strong> 2000 <str<strong>on</strong>g>Scorecard</str<strong>on</strong>g>s<br />
Table 1 reflects <strong>gender</strong> <strong>equality</strong> in school figures for Asia during 2000.<br />
Table 1 Gender Equality <strong>and</strong> Educati<strong>on</strong> <str<strong>on</strong>g>Scorecard</str<strong>on</strong>g> 2000<br />
Gender <strong>equality</strong> <strong>and</strong><br />
educati<strong>on</strong> score %<br />
Japan, Korea, Singapore 100 1<br />
Armenia, Fiji, Kyrgyzstan, Malaysia,<br />
Sri Lanka<br />
94 2<br />
Kazakhstan 91 3<br />
China 89 4<br />
Georgia 88 5<br />
Thail<strong>and</strong> 86 6<br />
Maldives 85 7<br />
Azerbaijan, Tajikistan, Viet Nam 84 8<br />
M<strong>on</strong>golia, Uzbekistan 81 9<br />
Ind<strong>on</strong>esia 76 10<br />
Philippines 68 11<br />
Bangladesh 48 12<br />
India 41 13<br />
Cambodia, Nepal 36 14<br />
Myanmar 34 15<br />
Lao PDR 26 16<br />
Pakistan 20 17<br />
Afghanistan, Bhutan, Brunei, Turkmenistan<br />
Source: Derived from Appendix 1.<br />
INCOMPLETE DATA<br />
Rank<br />
A number of interesting issues arise from the 2000 <str<strong>on</strong>g>Scorecard</str<strong>on</strong>g>. Firstly, the table divides into two very<br />
distinct halves. There is a large group of high scoring countries, predominantly in South-East Asia<br />
<strong>and</strong> Central Asia, but it is notable that Sri Lanka, China, Viet Nam <strong>and</strong> the Maldives - which are<br />
not high-income countries - are in this group. There is also a large group of low scoring countries,<br />
including the very populous India <strong>and</strong> Bangladesh. There is a big gap between the lowest ranking<br />
‘high scorer’ Philippines (68%) <strong>and</strong> the highest ranking ‘low scorer’ Bangladesh (48%). This outcome<br />
is quite different to that found in Africa, for example, where there are a large number of low scoring<br />
countries, but no apparent regi<strong>on</strong>al disjuncture (Unterhalter et al, 2004).<br />
Sec<strong>on</strong>dly, while it is no surprise that countries such as Japan, Korea <strong>and</strong> Singapore, which have a<br />
high GDP per capita, come at the scorecard’s top end, it is notable that countries with relatively low<br />
GDP per capita, such as Sri Lanka <strong>and</strong> China, also score so highly. This result seems to highlight<br />
the achievements of policies <strong>on</strong> <strong>gender</strong> <strong>equality</strong> in access to educati<strong>on</strong>, health <strong>and</strong>, to some extent,<br />
employment over many decades, regardless of levels of income <strong>and</strong> wealth in the country. Indeed, the<br />
example of Sri Lanka bears this out: It is <strong>on</strong> a par with the much richer Malaysia, <strong>and</strong> has a far higher<br />
score than Thail<strong>and</strong>. This high score has been achieved despite many decades of war, underlining<br />
observati<strong>on</strong>s that, despite the war, aspirati<strong>on</strong>s for educati<strong>on</strong> are widespread (Little, 1998).<br />
A <str<strong>on</strong>g>Scorecard</str<strong>on</strong>g> <strong>on</strong> Gender Equality <strong>and</strong> Girls’ Educati<strong>on</strong> in Asia 1990–2000 5
Thirdly, countries which have or have had Communist governments for l<strong>on</strong>g periods (China, the<br />
former Soviet republics, M<strong>on</strong>golia <strong>and</strong> Viet Nam) or countries which have had many decades of<br />
government commitment to the expansi<strong>on</strong> of educati<strong>on</strong> (South Korea) score much more highly than<br />
countries that have had less co-ordinated policies <strong>on</strong> mass educati<strong>on</strong>, such as India <strong>and</strong> Pakistan.<br />
A country like Bangladesh, which has mobilized huge local <strong>and</strong> internati<strong>on</strong>al resources to improve<br />
educati<strong>on</strong>, scores much more highly than other countries in South Asia, where policy <strong>on</strong> educati<strong>on</strong><br />
has been less clearly directed.<br />
Fourthly, countries that have suffered l<strong>on</strong>g periods of war <strong>and</strong> repressive government (Lao PDR,<br />
Cambodia <strong>and</strong> Myanmar) have particularly low scores. This bears out a similar trend observed<br />
in Africa (Unterhalter et al, 2004). However, some caveats are needed. Viet Nam suffered many<br />
decades of war, <strong>and</strong> yet its score is double that of Cambodia <strong>and</strong> Lao PDR. The reas<strong>on</strong>s for this<br />
might be that the war in Viet Nam ended in 1974, <strong>and</strong> was followed by a c<strong>on</strong>certed rec<strong>on</strong>structi<strong>on</strong><br />
<strong>and</strong> reunificati<strong>on</strong> effort with focused five-year plans. By c<strong>on</strong>trast, the war in Cambodia ended in<br />
1979 with virtually the whole infrastructure of the country destroyed. For nearly a decade, there<br />
was no clear government rec<strong>on</strong>structi<strong>on</strong> effort in educati<strong>on</strong>. Although the war in Lao PDR ended in<br />
the 1970s, a low intensity war c<strong>on</strong>tinued for years, marked by sharp ethnic tensi<strong>on</strong>s. Thus, while a<br />
history of c<strong>on</strong>flict does point to great difficulties in achieving a high <strong>gender</strong> equity in educati<strong>on</strong> score,<br />
these difficulties are not insurmountable. Once again, this was a trend observed in Africa where<br />
South Africa, Namibia <strong>and</strong> Ug<strong>and</strong>a, despite histories of war <strong>and</strong> repressi<strong>on</strong>, were high scorers. We<br />
believe this could be linked to very focused rec<strong>on</strong>structi<strong>on</strong> programmes in educati<strong>on</strong>. An excepti<strong>on</strong><br />
to this general observati<strong>on</strong> is Sri Lanka, where, despite many decades of war, the country scores<br />
highly <strong>on</strong> our <strong>gender</strong> <strong>equality</strong> <strong>and</strong> schooling index. There is clearly a need for more investigati<strong>on</strong> into<br />
issues of <strong>gender</strong> <strong>equality</strong>, educati<strong>on</strong> <strong>and</strong> violent c<strong>on</strong>flicts.<br />
Fifthly, there are some interesting issues that arise when the scores of India, Bangladesh <strong>and</strong> Pakistan<br />
are compared. Bangladesh scores more highly than India, <strong>and</strong> c<strong>on</strong>siderably more highly than Pakistan.<br />
It is likely the problem of aggregated data reduces India’s score <strong>and</strong> increases Bangladesh’s. In most<br />
southern Indian states, <strong>gender</strong> equity measures are high, while in most northern states, they are low<br />
(Dreze <strong>and</strong> Sen, 2000). The very large numbers of districts where enrolment <strong>and</strong> achievement are<br />
low c<strong>on</strong>tributes to India’s low score. In Bangladesh, by c<strong>on</strong>trast, aggregati<strong>on</strong> of data hides problems<br />
of the smaller number of thanas (districts) where <strong>gender</strong> equity measures are low. In these very<br />
populous countries, the scorecard methodology may be less useful for the country as a whole than<br />
for particular districts.<br />
The 2000 <str<strong>on</strong>g>Scorecard</str<strong>on</strong>g> indicates that twenty countries in Asia are relatively high scorers. They have<br />
achieved the 2005 MDG, or are very close to doing so. However, seven countries are low scorers,<br />
<strong>and</strong> will not achieve the MDG by this measure. There is no informati<strong>on</strong> for another four countries, two<br />
of which - Afghanistan <strong>and</strong> Bhutan - are likely <strong>on</strong> the basis of the informati<strong>on</strong> in Appendices A <strong>and</strong><br />
B to be low scorers. This scorecard, hence, emphasizes the importance of paying c<strong>on</strong>siderable <strong>and</strong><br />
urgent attenti<strong>on</strong> to <strong>gender</strong> <strong>equality</strong> issues in these countries.<br />
6<br />
A <str<strong>on</strong>g>Scorecard</str<strong>on</strong>g> <strong>on</strong> Gender Equality <strong>and</strong> Girls’ Educati<strong>on</strong> in Asia 1990–2000
Table 2 presents the <strong>gender</strong> equity scorecard for the early 1990s.<br />
Table 2 Gender Equality <strong>and</strong> Schooling <str<strong>on</strong>g>Scorecard</str<strong>on</strong>g> 1990<br />
NB - Some figures, especially for former USSR, are very unsafe.<br />
Gender <strong>equality</strong> <strong>and</strong><br />
educati<strong>on</strong> score %<br />
Korea, Japan, Singapore 100 1<br />
Brunei 97 2<br />
Kazakhstan, Turkmenistan 91 3<br />
Malaysia 89 4<br />
Georgia, Kyrgyzstan 88 5<br />
Armenia, Azerbaijan 84 6<br />
Fiji 83 7<br />
Uzbekistan 81 8<br />
China 79 9<br />
M<strong>on</strong>golia, Tajikistan 78 10<br />
Philippines 75 11<br />
Sri Lanka 74 (68)* 12<br />
Ind<strong>on</strong>esia 68 13<br />
India 28 14<br />
Bangladesh, Pakistan 23 15<br />
Afghanistan, Lao PDR, Nepal 20 16<br />
Cambodia, Bhutan, Maldives, Myanmar, Thail<strong>and</strong>, Viet Nam<br />
* 68% more likely estimated score; see calculati<strong>on</strong>s Table E, Appendix 2<br />
Source: Derived from Appendix 2<br />
INCOMPLETE<br />
Rank1<br />
Interestingly, Table 2 indicates that the sharp divisi<strong>on</strong> between high scorers <strong>and</strong> low scorers observed<br />
in 2000 for the regi<strong>on</strong> is l<strong>on</strong>g established. All the countries in the low scoring group in 2000 were in<br />
that group in 1990. This implies that a huge amount of additi<strong>on</strong>al effort is needed to move up the<br />
table from a low score. However, there have, indeed, been spectacular achievements by some lowbased<br />
countries, as is discussed below.<br />
High-income countries, such as Japan, Korea <strong>and</strong> Singapore, scored highly at the beginning of the<br />
1990s (unsurprisingly). However, the scorecard also indicates the length of time for which Sri Lanka<br />
has had high <strong>gender</strong> equity in schooling scores, even though these may be slightly inflated (see above<br />
<strong>and</strong> Table E, Appendix 2). In the 1990s, Sri Lanka was a low-income country, but the very significant<br />
investments in educati<strong>on</strong> show up with generally high <strong>gender</strong> equity scores. The striking c<strong>on</strong>trast is<br />
between Sri Lanka’s score in comparis<strong>on</strong> with that of India, despite India’s far larger ec<strong>on</strong>omy.<br />
The correlati<strong>on</strong> noted between war, repressi<strong>on</strong> <strong>and</strong> low <strong>gender</strong> equity in educati<strong>on</strong> is evident here,<br />
too. Afghanistan <strong>and</strong> Lao PDR come at the bottom of the table. Unfortunately, the data for Viet Nam<br />
is incomplete for 1990, so it is unclear whether at that date it was a relatively high scorer, or whether<br />
its major advance took place during the 1990s.<br />
A <str<strong>on</strong>g>Scorecard</str<strong>on</strong>g> <strong>on</strong> Gender Equality <strong>and</strong> Girls’ Educati<strong>on</strong> in Asia 1990–2000 7
Table 3 presents details of countries that moved up or down the scoreboard over the course of the<br />
1990s.<br />
Table 3 Change in Scores 1990-2000<br />
Improvers<br />
Scores in<br />
19890<br />
Scores in<br />
2000<br />
Percentage<br />
improvement<br />
of score<br />
1990-2000<br />
Rank in<br />
order of<br />
improvement<br />
Bangladesh 23 48 109% 1 138<br />
Nepal 20 36 80% 2 140<br />
India 28 41 46% 3 127<br />
Lao PDR 20 26 30% 4 135<br />
Sri Lanka 74 (68) * 94 27% (38) 5 (4) 96<br />
China 79 89 13% 6 94<br />
Fiji 83 94 13% 6 81<br />
Armenia 84 94 12% 7 82<br />
Ind<strong>on</strong>esia 68 76 12% 7 111<br />
Tajikistan 78 84 8% 8 116<br />
Kyrgyzstan 88 94 7% 9 110<br />
Malaysia 89 94 6% 10 59<br />
M<strong>on</strong>golia 78 81 4% 11 117<br />
Human<br />
Development<br />
Index (HDI)<br />
rank<br />
* Figure in brackets denotes score using estimated NER <strong>and</strong> calculati<strong>on</strong>s in Table E, Appendix 2<br />
Fallers<br />
Score in 1990 Score in 2000 Percentage<br />
decrease of<br />
score<br />
Rank in order<br />
of who has<br />
fallen most<br />
Pakistan 23 20 13% 1 142<br />
Philippines 75 68 9% 2 83<br />
Change in score 1990-2000-Static<br />
Korea, Japan,<br />
Singapore<br />
Score in 1990 Score in 2000 Percentage<br />
decrease of<br />
score<br />
Rank in order<br />
of who has<br />
fallen most<br />
100 100 0 28<br />
Kazakhstan 91 91 0 78<br />
Georgia 88 88 0 97<br />
Azerbaijan 84 84 0 91<br />
Uzbekistan 81 81 0 107<br />
HDI rank<br />
HDI rank<br />
8<br />
A <str<strong>on</strong>g>Scorecard</str<strong>on</strong>g> <strong>on</strong> Gender Equality <strong>and</strong> Girls’ Educati<strong>on</strong> in Asia 1990–2000
Table 3 indicates a spectacular rise up the scorecard for Bangladesh <strong>and</strong> Nepal by 2000 (although<br />
Nepal still has a very low score). Both, however, started the decade from a very low base. These are<br />
two of the three lowest Asian countries <strong>on</strong> the UNDP’s Human Development Index (HDI), yet they are<br />
at the top of the Improvers list. Pakistan, meanwhile, saw a 13% decrease in score between 1990<br />
<strong>and</strong> 2000. India improved by nearly 50%, yet still remained in the lower scoring part of the scorecard.<br />
Bangladesh <strong>and</strong> India both have important women’s mobilizati<strong>on</strong> efforts, associated <strong>on</strong> the Africa<br />
<strong>and</strong> Latin America scorecards with higher ranks, <strong>and</strong> this might well be a c<strong>on</strong>tributory factor in the<br />
c<strong>on</strong>siderable gains both countries have made. The absence of women’s mobilizati<strong>on</strong> in this form<br />
may c<strong>on</strong>tribute, together with large expenditure <strong>on</strong> arms, to Pakistan’s fall down the scoreboard.<br />
Sri Lanka maintained a high rank, improving by 27% (or possibly as much as 36% if the lower<br />
score is used). Am<strong>on</strong>gst the higher scoring countries, a small group who were already high scorers<br />
maintained their high positi<strong>on</strong> with either no or relatively little change over the decade (Japan,<br />
Singapore, Korea, M<strong>on</strong>golia, Malaysia). However, a number of other high scorers (Ind<strong>on</strong>esia, China,<br />
Thail<strong>and</strong> <strong>and</strong> Sri Lanka) made quite substantial moves up the scorecard from middle to high ranks,<br />
possibly dem<strong>on</strong>strating the benefits of the earlier investments in <strong>gender</strong> equity in educati<strong>on</strong>. This<br />
is particularly pertinent when c<strong>on</strong>sidering future directi<strong>on</strong>s for middle scoring countries like the<br />
Philippines <strong>and</strong> Bangladesh over the next ten years. However, the Philippines’ score fell by 9% over<br />
the decade, perhaps as a result of the country’s southern war <strong>and</strong> the impact of displacement <strong>on</strong><br />
educati<strong>on</strong>. Its falling score indicates that gains in <strong>gender</strong> <strong>equality</strong> can be fragile.<br />
In additi<strong>on</strong>, there is a significant move up the scorecard by Lao PDR, although again from a very<br />
low base. Like Nepal, the move does not take the country out of the low scoring group of countries;<br />
however, it is important to note that countries - even those who have experienced terrible turmoil - do<br />
improve <strong>and</strong> that educati<strong>on</strong> is a process where gains for well-being can be noted.<br />
C<strong>on</strong>clusi<strong>on</strong><br />
The Asian scorecards, for all the difficulties with data quality <strong>and</strong> this form of measurement, do<br />
point to some useful insights with regard to Millenium Deveopment Goal achievements. Firstly, coordinated<br />
government policies with str<strong>on</strong>g local champi<strong>on</strong>s within government, NGOs or a women’s<br />
movement can lead to significant increases in score. Good scores, <strong>on</strong>ce attained, yield value over<br />
decades. Sec<strong>on</strong>dly, little acti<strong>on</strong> <strong>on</strong> <strong>gender</strong> equity in educati<strong>on</strong>, coupled with large internal inequalities,<br />
can lead to a fall in score. Thirdly, the effects of war linger for many decades after fighting officially<br />
ends. Rec<strong>on</strong>structi<strong>on</strong> requires very sustained programmes. While the MDG may seem unattainable<br />
for some countries, gains are evident in some of the poorest countries. These deserve celebrati<strong>on</strong>,<br />
<strong>and</strong> sustain hope that all countries will, indeed, attain their MDGs by 2015.<br />
A <str<strong>on</strong>g>Scorecard</str<strong>on</strong>g> <strong>on</strong> Gender Equality <strong>and</strong> Girls’ Educati<strong>on</strong> in Asia 1990–2000 9
Appendix 1<br />
Calculating the Girls’ Access <strong>and</strong> Retenti<strong>on</strong> in Educati<strong>on</strong> <str<strong>on</strong>g>Scorecard</str<strong>on</strong>g> for 2000<br />
The scorecard was c<strong>on</strong>structed using four measures deemed useful as indicators of <strong>girls</strong>’ access to<br />
<strong>and</strong> retenti<strong>on</strong> in schooling. The indicators selected were <strong>girls</strong>’ primary attendance rate, <strong>girls</strong>’ survival<br />
rate over five years of primary schooling, <strong>girls</strong>’ sec<strong>on</strong>dary NER <strong>and</strong> the GDI. The data is extremely<br />
scattered <strong>and</strong>, as the tables note, attendance rates <strong>and</strong> sec<strong>on</strong>dary NER were not available for all<br />
countries. When these have not been found, either primary NER or sec<strong>on</strong>dary GER have been<br />
used. For the 1990 Table, virtually all measures of sec<strong>on</strong>dary school enrolment are sec<strong>on</strong>dary GER<br />
<strong>and</strong>, thus, data is comparable within this time frame (but there are difficulties in comparing with the<br />
later time period as is discussed <strong>on</strong> p. 3). For the 2000 Table, sec<strong>on</strong>dary NER was not available<br />
for four countries <strong>and</strong> GER has been used. This may overstate the ranking of these five countries<br />
(Kyrgyzstan, Pakistan, Sri Lanka, Uzbekistan <strong>and</strong> Viet Nam).<br />
Sex-disaggregated data for survival rate over five years in primary school was not available for the<br />
beginning of the 1990s, nor for some countries in 2000. However, the data sets <strong>on</strong> boys’ <strong>and</strong> <strong>girls</strong>’<br />
survival in 2000 show that there is generally <strong>on</strong>ly 5% difference between the sexes. 4 This reflects a<br />
finding borne out in the general c<strong>on</strong>clusi<strong>on</strong> of UNESCO’s global educati<strong>on</strong> report that <strong>on</strong>ce <strong>girls</strong> enter<br />
school, they are able to remain over five years (UNESCO, 2003). On the assumpti<strong>on</strong> that there was a<br />
largely similar pattern in the early 1990s, ie. that there were no major initiatives <strong>on</strong> retenti<strong>on</strong> for <strong>girls</strong> in<br />
the 1990s, the aggregated figures for the 1990s have been used. (For further discussi<strong>on</strong>, see p. 3.)<br />
Table A provides the informati<strong>on</strong> with regard to all these measures for the countries in Asia using<br />
data from UNESCO EFA reports for 2003 <strong>and</strong> 2004, the UNDP Human Development Report 2003,<br />
countries’ own EFA assessments <strong>and</strong> some World Bank datasets.<br />
Table A: Selected indicators of <strong>girls</strong>’ access to <strong>and</strong> retenti<strong>on</strong> in school for 2000<br />
Net <strong>girls</strong>’<br />
primary school<br />
attendance %<br />
1992-2002<br />
Girls’ survival<br />
rate over<br />
5 years in<br />
primary<br />
schooling %<br />
2000*<br />
Afghanistan 14 (e) 35.1 + (c)<br />
Armenia 98 (e) 95.6 (g) (to last<br />
grade)<br />
Azerbaijan 88 (e) 99 (g) (to last<br />
grade)<br />
Girls’<br />
sec<strong>on</strong>dary NER<br />
2000*<br />
Gender<br />
Development<br />
Index (GDI) -<br />
HDR 2003<br />
(unless<br />
otherwise<br />
stated)<br />
65.4 (b) 0.727<br />
74.7 (k) 0.691 (HDR<br />
-1999)<br />
Bangladesh 78 (e) 70.1 (a) 43.7 (b) 0.495<br />
Bhutan<br />
92.2 (a)<br />
Brunei Darussalam 91.8 (a) 0.867<br />
Cambodia 65 (e) 62.7 (a) 12.3** (b) 0.551<br />
China 93.0** ++ (d) 95.8 (g) ** 58.4 0.718<br />
Fiji 99.0** ++ (d) 92.4 + (c -1998) 79.2 (b) 0.743<br />
4 Table 5, State of the World’s Children, UNICEF, 2003<br />
10<br />
A <str<strong>on</strong>g>Scorecard</str<strong>on</strong>g> <strong>on</strong> Gender Equality <strong>and</strong> Girls’ Educati<strong>on</strong> in Asia 1990–2000
Georgia 100 (e) 93.7 (g) (to last<br />
grade)<br />
India 73 (e) 41.7** (a - data<br />
for 1999/2000)<br />
73.4** (b - data<br />
for 1999/2000)<br />
40 (e) (GER<br />
1997-2000)<br />
Ind<strong>on</strong>esia 86 (e) 100** (a) 46.4** (b - data<br />
for 1999/2000)<br />
Japan 100 (g) (2001) 100 (m) 103 (e) (GER<br />
1997-2000)<br />
Kazakhstan 88 (e) 94.8 (g) (to last<br />
grade)<br />
Kyrgyzstan 94 (e) 91.3 (g) (to last<br />
grade)<br />
Lao Peoples’ Dem.<br />
Rep.<br />
0.630 (HDR<br />
-1997)<br />
0.574<br />
0.677<br />
0.926<br />
81.8 (b) 0.763<br />
86 (e) (GER<br />
1997-2000)<br />
59 (e) 53.9 (a) 26.9 (b) 0.518<br />
Malaysia 98.7++ (d) 99 (l) 73.9 (b) 0.784<br />
0.715 (NHDR<br />
-2001)<br />
Maldives 99.3 (d) 98 (l) 48 (2002) (i) 0.735 (HDR<br />
-2001)<br />
M<strong>on</strong>golia 77 (e) 95 (f) 70.4 (b) 0.659<br />
Myanmar 68 (e) 55.2 (a) 35.5** (b) 0.547 (HDR<br />
– 2001)<br />
Nepal 66 (e) 70.1 (a) 23.9 (2002) (j) 0.479<br />
Pakistan 51 (e) 50 (l) 19 (e) (GER<br />
1997-2000)<br />
0.469<br />
Philippines 83 (e) 66.3 (l) 57.1 (b) 0.748<br />
Rep. of Korea 99.9 (d) 98.7+ (c)<br />
(1997/1998)<br />
90.9 (b) 0.873<br />
Singapore 92 (n) x 00 (l) y 77 (e) (GER<br />
1997-2000) x<br />
Sri Lanka 100 (g - 2001) 97(l) 75 (e) (GER<br />
1997-2000)<br />
0.880<br />
0.726<br />
Tajikistan 81 (e) 93.1 (m) 69.2 (b) 0.673<br />
Thail<strong>and</strong> 84.1** + (d) 96.0** (a -data<br />
for 1999/2000)<br />
56.5(b - data for<br />
1999/2000)<br />
0.766<br />
Turkmenistan 84 e) 0.748 (HDR<br />
-2002)<br />
Uzbekistan 78(e) 89 (f) 87 (e) (GER<br />
1997-2000)x<br />
Viet Nam 86 (e) 94 (f) 64 (e ) (GER<br />
1997-2000)<br />
0.727<br />
0.687<br />
x<br />
y<br />
indicates data that refers to years or periods other than those specified (i.e. 1997-2000) differ<br />
from the st<strong>and</strong>ard definiti<strong>on</strong> or refer to part of the country<br />
indicates data that differ from the st<strong>and</strong>ard definiti<strong>on</strong> or refer to <strong>on</strong>ly part of a country, but are<br />
included in the calculati<strong>on</strong> of regi<strong>on</strong>s <strong>and</strong> global averages<br />
** UNESCO Institute of Statistics estimate<br />
A <str<strong>on</strong>g>Scorecard</str<strong>on</strong>g> <strong>on</strong> Gender Equality <strong>and</strong> Girls’ Educati<strong>on</strong> in Asia 1990–2000 11
++ The <strong>girls</strong>’ primary NER for 2000 has been used as figure <strong>on</strong> primary school attendance is not<br />
available<br />
+ Figure taken from UNESCO Country Reports<br />
a - Survival rate to Grade 5 1999 (UNESCO 2003)<br />
b - Girls’ sec<strong>on</strong>dary NER 2000 (UNESCO 2003)<br />
c - Country report<br />
d - NER 2000 (UNESCO 2003)<br />
e - UNICEF, 2004<br />
f - UNICEF, 2004 survey data <strong>on</strong> % of primary school entrants reaching Grade 5 from 1995 to<br />
2001 (aggregated)<br />
g - UNESCO 2004<br />
h - Department of Educati<strong>on</strong> – Philippines<br />
i - Ministry of Educati<strong>on</strong>, Maldives<br />
j - Ministry of Educati<strong>on</strong>, Nepal<br />
k - World Bank, 2004<br />
l - UNICEF, 2003 - % of primary school entrants reaching Grade 5 – 1995-1999 (aggregated)<br />
m - The Status of Women <strong>and</strong> Children, Multiple Indicator Cluster Survey (disaggregated)<br />
n - Primary school enrolment rate (1997-2000 net) (UNESCO 2004)<br />
On the basis of the informati<strong>on</strong> c<strong>on</strong>tained in Table A, a scoring system was developed <strong>on</strong> a scale of<br />
1-5 with regard to the four different measures. The thinking with regard to the scoring system was<br />
related to the 2015 MDG <strong>and</strong> the Beijing Declarati<strong>on</strong> of 1995 as follows:<br />
Table B: Criteria for scoring achievements with regard to access <strong>and</strong> achievement in<br />
<strong>girls</strong>’ educati<strong>on</strong><br />
Score<br />
Criteria to achieve the score<br />
5 Excellent c<strong>on</strong>diti<strong>on</strong>s. Already at or extremely well-positi<strong>on</strong>ed to achieve <strong>gender</strong> equity in<br />
2015 <strong>and</strong> fulfil the aspirati<strong>on</strong>s of the Beijing Declarati<strong>on</strong><br />
4 Very good c<strong>on</strong>diti<strong>on</strong>s. Substantial achievement with regard to <strong>gender</strong> equity, <strong>and</strong> well <strong>on</strong><br />
the path to achieving 2015 goal with regard to access, some gains needed with regard<br />
to improving retenti<strong>on</strong><br />
3 Good c<strong>on</strong>diti<strong>on</strong>s. Achievement towards 2015 evident, but further work necessary with<br />
regard to access <strong>and</strong> retenti<strong>on</strong><br />
2 Poor c<strong>on</strong>diti<strong>on</strong>s. Achievement towards 2015 slow. C<strong>on</strong>siderable <strong>and</strong> intensive work<br />
needed with regarded to access <strong>and</strong> retenti<strong>on</strong><br />
1 Very poor c<strong>on</strong>diti<strong>on</strong>s. 2015 unlikely to be reached without massive mobilizati<strong>on</strong> to secure<br />
access <strong>and</strong> achievement<br />
Using the criteria outlined in Table B, the following scoring system (Table C) was developed with<br />
regard to the indicators in Table A.<br />
12<br />
A <str<strong>on</strong>g>Scorecard</str<strong>on</strong>g> <strong>on</strong> Gender Equality <strong>and</strong> Girls’ Educati<strong>on</strong> in Asia 1990–2000
Table C: Scores <strong>and</strong> indicators<br />
Score<br />
Net <strong>girls</strong> primary<br />
attendance<br />
Girls primary<br />
survival rate<br />
Girls sec<strong>on</strong>dary<br />
NER<br />
5 90% <strong>and</strong> above 90% <strong>and</strong> above 60% <strong>and</strong> above 0.800 <strong>and</strong> above<br />
4 80-89% 80-89 50-59 0.700-0.799<br />
3 70-79 70-79 40-49 0.600-0.699<br />
2 60-69 60-69 30-39 0.500-0.599<br />
1 59% <strong>and</strong> below 59% <strong>and</strong> below 29% <strong>and</strong> below Below 0.499<br />
On the basis of the scores developed in Table C, all the countries were given raw scores in the four areas<br />
of measurement (Table D).<br />
Table D: Raw country score measurements for 2000<br />
Net <strong>girls</strong>’<br />
primary school<br />
attendance %<br />
1992-2002<br />
Afghanistan 1 1<br />
Girls’ survival<br />
rate over 5<br />
years in primary<br />
schooling %<br />
2000<br />
Girls’ sec<strong>on</strong>dary<br />
NER 2000<br />
Armenia 5 5 5 4<br />
Azerbaijan 4 5 5 3<br />
Bangladesh 3 3 3 1<br />
Bhutan 5<br />
Brunei<br />
Darussalam<br />
5 5<br />
Cambodia 2 2 1 2<br />
China 5 5 4 4<br />
Fiji 5 5 5 4<br />
Georgia 5 5 5 3<br />
India 3 1 3 2<br />
Ind<strong>on</strong>esia 4 5 3 3<br />
Japan 5 5 5 5<br />
Kazakhstan 4 5 5 4<br />
Kyrgyzstan 5 5 5 4<br />
Lao Peoples’<br />
Dem. Rep.<br />
1 1 1 2<br />
Malaysia 5 5 5 4<br />
Maldives 5 5 3 4<br />
M<strong>on</strong>golia 3 5 5 3<br />
Myanmar 2 1 2 2<br />
Nepal 2 3 1 1<br />
Pakistan 1 1 1 1<br />
GDI<br />
Gender<br />
Development<br />
Index (GDI)<br />
A <str<strong>on</strong>g>Scorecard</str<strong>on</strong>g> <strong>on</strong> Gender Equality <strong>and</strong> Girls’ Educati<strong>on</strong> in Asia 1990–2000 13
Philippines 4 2 4 4<br />
Rep. of Korea 5 5 5 5<br />
Singapore 5 5 5 5<br />
Sri Lanka 5 5 5 4<br />
Tajikistan 4 5 5 3<br />
Thail<strong>and</strong> 4 5 4 4<br />
Turkmenistan 4 4<br />
Uzbekistan 3 4 5 4<br />
Viet Nam 4 5 5 3<br />
The raw scores in Table D were then weighted in order to develop an overall percentage score. The<br />
weighting was designed to reflect the relative importance of the measures with regards to indicating<br />
improvements in access <strong>and</strong> retenti<strong>on</strong>. The following modifiers were applied:<br />
Girls’ primary attendance x 1.25<br />
Girls’ survival rate in first five years of primary schooling x 2.5 (twice as important as attendance)<br />
Girls’ sec<strong>on</strong>dary NER x 1.75 (slightly more important than primary attendance as an indicator of<br />
progressi<strong>on</strong> <strong>and</strong> potential to educate future women teachers <strong>and</strong> administrators with c<strong>on</strong>cerns for<br />
<strong>gender</strong> <strong>equality</strong>)<br />
GDI x 2.5 (twice as important as primary attendance as an indicator of women’s status in the<br />
society)<br />
14<br />
A <str<strong>on</strong>g>Scorecard</str<strong>on</strong>g> <strong>on</strong> Gender Equality <strong>and</strong> Girls’ Educati<strong>on</strong> in Asia 1990–2000
Table E: Final 2000 <str<strong>on</strong>g>Scorecard</str<strong>on</strong>g>: Four measurements<br />
Net <strong>girls</strong>’<br />
primary<br />
school<br />
attendance<br />
(Score Table<br />
D x 1.25)<br />
Girls’<br />
survival rate<br />
over 5 years<br />
in primary<br />
schooling<br />
(Score Table<br />
D x 2.5)<br />
Girls’<br />
sec<strong>on</strong>dary<br />
NER 2000<br />
(Score Table<br />
D x 1.75)<br />
Gender<br />
Development<br />
Index (GDI)<br />
score table<br />
D x 2.5<br />
<str<strong>on</strong>g>Scorecard</str<strong>on</strong>g><br />
total (sum<br />
of weighted<br />
measures<br />
divided by 4)<br />
Afghanistan 1.25 2.5 n/a<br />
Armenia 6.25 12.5 8.75 10 9.375<br />
Azerbaijan 5 12.5 8.75 7.5 8.4375<br />
Bangladesh 3.75 7.5 5.25 2.5 4.75<br />
Bhutan 12.5 n/a<br />
Brunei 12.5 12.5 n/a<br />
Cambodia 2.5 5 1.75 5 3.5625<br />
China 6.25 12.5 7 10 8.9375<br />
Fiji 6.25 12.5 8.75 10 9.375<br />
Georgia 6.25 12.5 8.75 7.5 8.75<br />
India 3.75 2.5 5.25 5 4.125<br />
Ind<strong>on</strong>esia 5 12.5 5.25 7.5 7.5625<br />
Japan 6.25 12.5 8.75 12.5 10.00<br />
Kazakhstan 5 12.5 8.75 10 9.0625<br />
Kyrgyzstan 6.25 12.5 8.75 10 9.375<br />
Lao PDR 1.25 2.5 1.75 5 2.625<br />
Malaysia 6.25 12.5 8.75 10 9.375<br />
Maldives 6.25 12.5 5.25 10 8.5<br />
M<strong>on</strong>golia 3.75 12.5 8.75 7.5 8.125<br />
Myanmar 2.5 2.5 3.5 5 3.375<br />
Nepal 2.5 7.5 1.75 2.5 3.5625<br />
Pakistan 1.25 2.5 1.75 2.5 2.00<br />
Philippines 5 5 7 10 6.75<br />
Republic of<br />
Korea<br />
6.25 12.5 8.75 12.5 10.00<br />
Singapore 6.25 12.5 8.75 12.5 10<br />
Sri Lanka 6.25 12.5 8.75 10 9.375<br />
Tajikistan 5 12.5 8.75 7.5 8.4375<br />
Thail<strong>and</strong> 5 12.5 7 10 8.625<br />
Turkmenistan 5 10 n/a<br />
Uzbekistan 3.75 10 8.75 10 8.125<br />
Viet Nam 5 12.5 8.75 7.5 8.4375<br />
A <str<strong>on</strong>g>Scorecard</str<strong>on</strong>g> <strong>on</strong> Gender Equality <strong>and</strong> Girls’ Educati<strong>on</strong> in Asia 1990–2000 15
Table F: 2000 <str<strong>on</strong>g>Scorecard</str<strong>on</strong>g> ranking<br />
Rank<br />
<str<strong>on</strong>g>Scorecard</str<strong>on</strong>g> total<br />
Afghanistan<br />
INCOMPLETE<br />
Armenia 2 9.375<br />
Azerbaijan 8 8.4375<br />
Bangladesh 12 4.75<br />
Bhutan<br />
INCOMPLETE<br />
Brunei<br />
INCOMPLETE<br />
Cambodia 14 3.5625<br />
China 4 8.9375<br />
Fiji 2 9.375<br />
Georgia 5 8.75<br />
India 13 4.125<br />
Ind<strong>on</strong>esia 10 7.5625<br />
Japan 1 10.00<br />
Kazakhstan 3 9.0625<br />
Kyrgyzstan 2 9.375<br />
Lao PDR 16 2.625<br />
Malaysia 2 9.375<br />
Maldives 7 8.5<br />
M<strong>on</strong>golia 9 8.125<br />
Myanmar 15 3.375<br />
Nepal 14 3.5625<br />
Pakistan 17 2.00<br />
Philippines 11 6.75<br />
Rep. of Korea 1 10.00<br />
Singapore 1 10.00<br />
Sri Lanka 2 9.375<br />
Tajikistan 8 8.4375<br />
Thail<strong>and</strong> 6 8.625<br />
Turkmenistan<br />
INCOMPLETE<br />
Uzbekistan 9 8.125<br />
Viet Nam 8 8.4375<br />
16<br />
A <str<strong>on</strong>g>Scorecard</str<strong>on</strong>g> <strong>on</strong> Gender Equality <strong>and</strong> Girls’ Educati<strong>on</strong> in Asia 1990–2000
The 2000 <str<strong>on</strong>g>Scorecard</str<strong>on</strong>g><br />
Table G: Gender Equality <strong>and</strong> Educati<strong>on</strong> 2000 <str<strong>on</strong>g>Scorecard</str<strong>on</strong>g><br />
Gender <strong>equality</strong> <strong>and</strong><br />
educati<strong>on</strong> score %<br />
Japan, Korea, Singapore 100 1<br />
Armenia, Fiji, Kyrgyzstan,<br />
Malaysia, Sri Lanka<br />
94 2<br />
Kazakhstan 91 3<br />
China 89 4<br />
Georgia 88 5<br />
Thail<strong>and</strong> 86 6<br />
Maldives 85 7<br />
Azerbaijan, Tajikistan, Viet Nam 84 8<br />
M<strong>on</strong>golia, Uzbekistan 81 9<br />
Ind<strong>on</strong>esia 76 10<br />
Philippines 68 11<br />
Bangladesh 48 12<br />
India 41 13<br />
Cambodia, Nepal 36 14<br />
Myanmar 34 15<br />
Lao PDR 26 16<br />
Pakistan 20 17<br />
Afghanistan, Bhutan, Brunei,<br />
Turkmenistan<br />
INCOMPLETE<br />
Rank<br />
A <str<strong>on</strong>g>Scorecard</str<strong>on</strong>g> <strong>on</strong> Gender Equality <strong>and</strong> Girls’ Educati<strong>on</strong> in Asia 1990–2000 17
Appendix 2<br />
Calculating the Girls’ Educati<strong>on</strong> 1990 <str<strong>on</strong>g>Scorecard</str<strong>on</strong>g><br />
The same methodology outlined in Appendix 1 was used; however, because of the lack of sec<strong>on</strong>dary<br />
NER data (except for three countries), sec<strong>on</strong>dary GER has been used. This inflates a country’s<br />
overall score. For all countries, there is no <strong>gender</strong> disaggregated survival rate at the primary level,<br />
<strong>and</strong> the scores in this area may also be inflated.<br />
Table A: Selected indicators of <strong>girls</strong>’ access to <strong>and</strong> retenti<strong>on</strong> in educati<strong>on</strong> c.1990<br />
Girls’<br />
primary<br />
school<br />
enrolment<br />
(NER)<br />
Survival rate<br />
over 5 years<br />
in primary<br />
schooling %<br />
Girls’ sec<strong>on</strong>dary<br />
NER<br />
Afghanistan 14 (a) 52 (f) 7.4 (NER 1993) (l) 0.196<br />
Armenia 89 (p) 94 (q) 93.4 (l) (GER 1991) 0.677<br />
Azerbaijan 89 (p) 94 (q) 89.9 (l) (GER 1991) 0.661<br />
Bangladesh 66 (a) 26.7 (m) 12 (k) 0.336<br />
Bhutan 84 (g)<br />
Brunei<br />
Darussalam<br />
86 (a) 95(r) 64 (k) 0.808<br />
Cambodia 42 (g) 20.7 (l) (GER 1991)<br />
China 95 (a) 92 (g) 45.2 (l) (GER 1991) 0.601<br />
Fiji 100 (a) 84 (f) 59.8 (l) (GER 1991) 0.734<br />
Georgia 91 (b) 98 (r) 68.7 NER 1994 (l) 0.646<br />
India 61 * (j) 59 (g) 33.5 (l) (GER 1991) 0.410<br />
Ind<strong>on</strong>esia 95 (a) 81 (g) 34 (k) 0.616<br />
Japan 100 (n) 100 (r) 1000 (r) 0.897<br />
Kazakhstan<br />
87.9 (l) (GER<br />
1991)<br />
94 (q) 97.7 (l) (GER 1991) 0.732<br />
Kyrgyzstan 93 (c) 92 (r) 99.7 (l) (GER 1991) 0.661<br />
Lao Peoples’<br />
Dem. Rep.<br />
57 (a) 50 (f) 13 (k) 0.387<br />
Malaysia 92 (d) 98 (f) 58.6 (l) (GER 1991) 0.772<br />
Maldives 94 (g) 45.4 (l) (GER 1991) 0.599<br />
M<strong>on</strong>golia 81 (d) 92 (h) 64.8 (NER 1994) (i) 0.572<br />
Myanmar 85 (j) 24.8 (l) (GER 1991) 0.447<br />
Nepal 41 (e) 52 (f) 21.7 (l) (GER 1991) 0.308<br />
Pakistan 62 (j) 48 (f) 17.3 (l) (GER 1991) 0.383<br />
Philippines 100 (e) 70 (i) 74.3 (l) (GER 1991) 0.644<br />
Gender<br />
Development<br />
Index (GDI)<br />
1993 (Source:<br />
HDR 1996<br />
unless otherwise<br />
indicated)<br />
18<br />
A <str<strong>on</strong>g>Scorecard</str<strong>on</strong>g> <strong>on</strong> Gender Equality <strong>and</strong> Girls’ Educati<strong>on</strong> in Asia 1990–2000
Rep. of Korea 99 (d) 100 (f) 85 (k) 0.816<br />
Singapore 100 (e) 100 (r) 100 (r) 0.833<br />
Sri Lanka<br />
104 (o) (GER<br />
1992)<br />
93 (f) 39 (s) 0.679<br />
Tajikistan 89 (p) 94 (q) 100.6 (l) (GER 1991) 0.575 (1994)<br />
- HDR 1997<br />
Thail<strong>and</strong> 88 (r) 32.8 (l) (GER 1991) 0.811<br />
Turkmenistan 80* (j) 94 (q) 107.3 (l) (GER 1991) 0.712 (1994)<br />
Uzbekistan<br />
Viet Nam<br />
75.6 (i) (GER<br />
1991)<br />
101.3 (l) (GER<br />
1991)<br />
- HDR 1997<br />
94 (q) 93.7 (l) (GER 1991) 0.655 (1994)<br />
- HDR 1997<br />
30.6 (l) (GER 1991) 0.539<br />
a) NER Primary 1992 - UNESCO 1995<br />
b) NER Primary 1996 - UNESCO 2000<br />
c) NER Primary 1996 - UNESCO 2000<br />
d) NER Primary 1995 - UNESCO 1998<br />
e) NER Primary 1990 - UNESCO 1993<br />
f) Percentage of 1991 cohort reaching Grade 5 - UNESCO 1995 (disaggregated)<br />
g) Percentage of 1994 cohort reaching Grade 5 - UNESCO 1998 (disaggregated)<br />
h) Percentage of 1995 cohort reaching Grade 5 - UNESCO 2000 (disaggregated)<br />
i) Percentage of 1989 cohort reaching Grade 5 - UNESCO 1993 (disaggregated)<br />
j) NER primary school attendance 1993-1997- UNICEF 1999<br />
(* indicates data that refer to years or periods other than specified, differ from the st<strong>and</strong>ard definiti<strong>on</strong>,<br />
or refer to <strong>on</strong>ly part of a country)<br />
k) Sec<strong>on</strong>dary NER 1992 – UNESCO 1995<br />
l) http://devdata.worldbank.org/edstats/ThematicDataOnEducati<strong>on</strong>/GenderDisaggregatedProfile/<br />
m) Chowdry et al, 1999<br />
n) UNICEF 1999 – primary school enrolment ratio (net) (1993-1995)<br />
o) UNESCO 1995 (GER 1992)<br />
p) UNESCO 1993 (GER 1990 for USSR)<br />
q) UNESCO 1989, primary school completi<strong>on</strong> aggregated for USSR<br />
r) Percentage of primary school entrants reaching Grade 5 (1990-1995) aggregated – UNICEF 1999<br />
s) UNESCO, 1998a<br />
A <str<strong>on</strong>g>Scorecard</str<strong>on</strong>g> <strong>on</strong> Gender Equality <strong>and</strong> Girls’ Educati<strong>on</strong> in Asia 1990–2000 19
Table B: Raw country scores in 4 areas of measurement c.1990<br />
Girls’ School<br />
enrolement<br />
Girls’ survival<br />
rate over<br />
5 years in<br />
primary<br />
schooling<br />
Girls’<br />
sec<strong>on</strong>dary<br />
NER<br />
Afghanistan 1 1 1 1<br />
Armenia 4 5 5 3<br />
Azerbaijan 4 5 5 3<br />
Bangladesh 2 1 1 1<br />
Bhutan 4<br />
Brunei Darussalam 4 5 5 5<br />
Cambodia 1 1<br />
China 5 5 3 3<br />
Fiji 5 4 4 4<br />
Georgia 5 5 5 3<br />
India 2 1 2 1<br />
Ind<strong>on</strong>esia 5 4 2 3<br />
Japan 5 5 5 5<br />
Kazakhstan 4 5 5 4<br />
Kyrgyzstan 5 5 5 3<br />
Lao PDR 1 1 1 1<br />
Malaysia 5 5 4 4<br />
Maldives 5 3 2<br />
M<strong>on</strong>golia 4 5 5 2<br />
Myanmar 4 1 1<br />
Nepal 1 1 1 1<br />
Pakistan 2 1 1 1<br />
Philippines 5 3 5 3<br />
Republic of Korea 5 5 5 5<br />
Sri Lanka 5 5 2 3<br />
Singapore 5 5 5 5<br />
Tajikistan 4 5 5 2<br />
Thail<strong>and</strong> 4 2 5<br />
Turkmenistan 4 5 5 4<br />
Uzbekistan 3 5 5 3<br />
Viet Nam 5 2 2<br />
Gender<br />
Development<br />
Index (GDI)<br />
20<br />
A <str<strong>on</strong>g>Scorecard</str<strong>on</strong>g> <strong>on</strong> Gender Equality <strong>and</strong> Girls’ Educati<strong>on</strong> in Asia 1990–2000
Table C: Weighted scores in four measures <strong>and</strong> final scorecard c.1990<br />
Net <strong>girls</strong><br />
primary<br />
school<br />
enrolment<br />
score x1.25<br />
Girls’ survival<br />
rate over<br />
5 years in<br />
primary<br />
schooling<br />
(Score Table<br />
D x 2.5)<br />
Girls’<br />
sec<strong>on</strong>dary<br />
NER 2000<br />
(Score Table<br />
D x 1.75)<br />
Gender<br />
Development<br />
Index (GDI)<br />
score table D<br />
x 2.5<br />
Afghanistan 1.25 2.5 1.75 2.5 2<br />
<str<strong>on</strong>g>Scorecard</str<strong>on</strong>g><br />
total (sum<br />
of weighted<br />
measures<br />
divided by 4)<br />
Armenia 5 12.5 8.75 7.5 8.4375<br />
Azerbaijan 5 12.5 8.75 7.5 8.4375<br />
Bangladesh 2.5 2.5 1.75 2.5 2.3125<br />
Bhutan 10 n/a<br />
Brunei 5 12.5 8.75 12.5 9.6875<br />
Cambodia 2.5 1.75 n/a<br />
China 6.25 12.5 5.25 7.5 7.875<br />
Fiji 6.25 10 7 10 8.3125<br />
Georgia 6.25 12.5 8.75 7.5 8.75<br />
India 2.5 2.5 3.5 2.5 2.75<br />
Ind<strong>on</strong>esia 6.25 10 3.5 7.5 6.8125<br />
Japan 6.25 12.5 8.75 12.5 10<br />
Kazakhstan 5 12.5 8.75 10 9.0625<br />
Kyrgyzstan 6.25 12.5 8.75 7.5 8.75<br />
Lao PDR 1.25 2.5 1.75 2.5 2<br />
Malaysia 6.25 12.5 7 10 8.9375<br />
Maldives 12.5 5.25 5 n/a<br />
M<strong>on</strong>golia 5 12.5 8.75 5 7.8125<br />
Myanmar 5 1.75 2.5 n/a<br />
Nepal 1.25 2.5 1.75 2.5 2<br />
Pakistan 2.5 2.5 1.75 2.5 2.3125<br />
Philippines 6.25 7.5 8.75 7.5 7.5<br />
Rep. of Korea 6.25 12.5 8.75 12.5 10<br />
Singapore 6.25 12.5 8.75 12.5 10<br />
Sri Lanka 6.25 12.5 3.5 7.5 7.4375<br />
Tajikistan 5 12.5 8.75 5 7.8125<br />
Thail<strong>and</strong> 12.5 3.5 12.5 n/a<br />
Turkmenistan 5 10 8.75 10 9.0625<br />
Uzbekistan 3.75 12.5 8.75 7.5 8.125<br />
Viet Nam 6.25 3.5 5 n/a<br />
A <str<strong>on</strong>g>Scorecard</str<strong>on</strong>g> <strong>on</strong> Gender Equality <strong>and</strong> Girls’ Educati<strong>on</strong> in Asia 1990–2000 21
Table D: 1990 <str<strong>on</strong>g>Scorecard</str<strong>on</strong>g> ranking<br />
Rank<br />
<str<strong>on</strong>g>Scorecard</str<strong>on</strong>g> total<br />
Afghanistan 16 2<br />
Armenia 6 8.44<br />
Azerbaijan 6 8.44<br />
Bangladesh 15 2.3<br />
Bhutan<br />
INCOMPLETE<br />
Brunei 2 9.69<br />
Cambodia<br />
INCOMPLETE<br />
China 9 7.88<br />
Fiji 7 8.3<br />
Georgia 5 8.75<br />
Japan 1 10<br />
India 14 2.75<br />
Ind<strong>on</strong>esia 13 6.8<br />
Kazakhstan 3 9.06<br />
Kyrgyzstan 5 8.75<br />
Lao Peoples’ Dem. Rep. 16 2<br />
Malaysia 4 8.94<br />
Maldives INCOMPLETE<br />
M<strong>on</strong>golia 10 7.81<br />
Myanmar INCOMPLETE<br />
Nepal 16 2<br />
Pakistan 15 2.3<br />
Philippines 11 7.5<br />
Rep. of Korea 1 10<br />
Singapore 1 10<br />
Sri Lanka 12 7.44<br />
Tajikistan 10 7.81<br />
Thail<strong>and</strong> INCOMPLETE<br />
Turkmenistan 3 9.06<br />
Uzbekistan 8 8.1<br />
Viet Nam<br />
INCOMPLETE<br />
22<br />
A <str<strong>on</strong>g>Scorecard</str<strong>on</strong>g> <strong>on</strong> Gender Equality <strong>and</strong> Girls’ Educati<strong>on</strong> in Asia 1990–2000
Table E: An alternative estimate of Sri Lanka’s score<br />
Data compiled<br />
from Table A<br />
Table A data with<br />
adjusted NER<br />
Raw scores using<br />
adjusted NER<br />
(row 2)<br />
Weighted scores<br />
using adjusted<br />
NER (row 2)<br />
Girls’ primary<br />
school<br />
enrolment<br />
(NER)<br />
Survival rate<br />
over 5 years<br />
in primary<br />
schooling %<br />
Girls’<br />
sec<strong>on</strong>dary<br />
NER<br />
104 93 39 0.679<br />
70* 93 39 0.679<br />
3 5 2 3<br />
3.75 12.5 3.5 7.5<br />
Gender Development<br />
Index (GDI)<br />
1993 (Source: HDR<br />
1996 unless otherwise<br />
indicated)<br />
Sril Lanka estimated scorecard (sum of weighted measures) divided by 4: 6.81, ie. 68%.<br />
* Estimated NER based <strong>on</strong> historical <strong>and</strong> qualitative studies (Little, 1999; Gunawardena, 2003)<br />
A <str<strong>on</strong>g>Scorecard</str<strong>on</strong>g> <strong>on</strong> Gender Equality <strong>and</strong> Girls’ Educati<strong>on</strong> in Asia 1990–2000 23
References<br />
Aikman, S., Challender, C. <strong>and</strong> Unterhalter, E. (2003) ‘Letter from the editors,’ Equals. No. 1, L<strong>on</strong>d<strong>on</strong>:<br />
Institute of Educati<strong>on</strong>. (Online at www.<strong>girls</strong>educati<strong>on</strong>.org Bey<strong>on</strong>d Access Newsletters link, accessed<br />
September 2004)<br />
Chowdry, M., Chowdry et al. (1999) State of Primary Educati<strong>on</strong> in Bangladesh. Dhaka: The University<br />
Press Limited.<br />
Gunawardena, C. (2003) ‘Gender equity in higher educati<strong>on</strong> in Sri Lanka: A mismatch between<br />
access <strong>and</strong> outcomes,’ McGill Journal of Educati<strong>on</strong>. Vol. 38, No 3, pp. 437- 452.<br />
Little, A. (2000) ‘Qualificati<strong>on</strong>s, Quality <strong>and</strong> Equality: A political ec<strong>on</strong>omy of Sri Lanka educati<strong>on</strong><br />
1971-1993,’ in Welch A R (ed) Third World Educati<strong>on</strong>: Quality <strong>and</strong> <strong>equality</strong>. New York <strong>and</strong> L<strong>on</strong>d<strong>on</strong>:<br />
Garl<strong>and</strong> Publishing.<br />
Little, A. (1999) Labouring to Learn: Towards a political ec<strong>on</strong>omy of plantati<strong>on</strong>s, people <strong>and</strong> educati<strong>on</strong><br />
in Sri Lanka. L<strong>on</strong>d<strong>on</strong>: Macmillan.<br />
Maldives, Ministry of Educati<strong>on</strong>. (2004) Informati<strong>on</strong> supplied by Ministry to JICA representatives.<br />
Mlama, P. (2004) ‘Changing teaching for <strong>gender</strong> <strong>equality</strong>.’ Paper delivered at 2nd Bey<strong>on</strong>d<br />
Access seminar, Nairobi, Kenya. Online at http://www.<strong>girls</strong>educati<strong>on</strong>.org/PGE_Active_Pages/<br />
NetworkMembers/Bey<strong>on</strong>dAccess/Active_Pages/events<strong>and</strong>activities.asp?Acti<strong>on</strong>=DisplaySessi<strong>on</strong>Lis<br />
t&Title=Seminar+2%2C+2%2D3+February+2004+ (accessed March 2004)<br />
Muito, M. (2004) ‘Gender <strong>equality</strong> in the classroom: reflecti<strong>on</strong>s <strong>on</strong> practice.’ Paper delivered at 2nd<br />
Bey<strong>on</strong>d Access seminar, Nairobi, Kenya. Online at http://www.<strong>girls</strong>educati<strong>on</strong>.org/PGE_Active_<br />
Pages/NetworkMembers/Bey<strong>on</strong>dAccess/Active_Pages/events<strong>and</strong>activities.asp?Acti<strong>on</strong>=DisplaySe<br />
ssi<strong>on</strong>List&Title=Seminar+2%2C+2%2D3+February+2004+ (accessed March 2004)<br />
Nepal, Ministry of Educati<strong>on</strong>. (2004) Informati<strong>on</strong> supplied by Ministry to JICA representatives.<br />
Pattman, R. <strong>and</strong> Chege, F. (2003) Finding our Voices: Gendered <strong>and</strong> Sexual Identities <strong>and</strong> HIV/AIDS<br />
in Educati<strong>on</strong>., Nairobi: UNICEF.<br />
Philippines, Department of Educati<strong>on</strong>. (2000) Informati<strong>on</strong> supplied by Department to JICA<br />
representatives.<br />
Sen, A. (1999) Development as Freedom. Oxford: Oxford University Press.<br />
UNDP. (1997) Human Development Report. New York: UNDP.<br />
UNDP. (1998) Human Development Report. New York: UNDP.<br />
UNDP. (1999) Human Development Report. New York: UNDP.<br />
UNDP. (2000) Human Development Report. New York: UNDP.<br />
UNDP. (2001) Human Development Report. New York: UNDP.<br />
UNDP. (2002) Human Development Report. New York: UNDP.<br />
UNDP. (2003) Human Development Report. New York: UNDP.<br />
UNICEF. (1999) The State of the World’s Children 1999. New York: UNICEF.<br />
UNICEF. (2004) The State of the World’s Children 2003. New York: UNICEF.<br />
UNESCO. (1989) World Educati<strong>on</strong> Report. Paris: UNESCO.<br />
UNESCO. (1993) World Educati<strong>on</strong> Report. Paris: UNESCO.<br />
UNESCO. (1994) World Educati<strong>on</strong> Report. Paris: UNESCO.<br />
UNESCO. (1995) World Educati<strong>on</strong> Report. Paris: UNESCO.<br />
24<br />
A <str<strong>on</strong>g>Scorecard</str<strong>on</strong>g> <strong>on</strong> Gender Equality <strong>and</strong> Girls’ Educati<strong>on</strong> in Asia 1990–2000
UNESCO. (1996) World Educati<strong>on</strong> Report. Paris: UNESCO.<br />
UNESCO. (1997) World Educati<strong>on</strong> Report. Paris: UNESCO.<br />
UNESCO. (1998) World Educati<strong>on</strong> Report. Paris: UNESCO.<br />
UNESCO. (1998a) The Challenge of Achieving Gender Parity in Basic Educati<strong>on</strong> – A Statistical<br />
Review 1990 -1998. Paris: UNESCO.<br />
UNESCO. (1999) World Educati<strong>on</strong> Report. Paris: UNESCO.<br />
UNESCO. (2000) World Educati<strong>on</strong> Report. Paris: UNESCO.<br />
UNESCO. (2003) Educati<strong>on</strong> for All Global M<strong>on</strong>itoring Report 2003-4: Gender <strong>and</strong> Educati<strong>on</strong> for All.<br />
Paris: UNESCO.<br />
UNESCO. (2004) Educati<strong>on</strong> for All Global M<strong>on</strong>itoring Report 2005: The quality challenge. Paris:<br />
UNESCO.<br />
Unterhalter, E. <strong>and</strong> Brighouse, H. (2003) ‘Distributi<strong>on</strong> of what? How will we know if we have Educati<strong>on</strong><br />
for All by 2015?’ Paper presented at the 3rd C<strong>on</strong>ference <strong>on</strong> the Capability Approach, Pavia: Univeristy<br />
of Pavia, September.<br />
Unterhalter et al. (2004) ‘Scaling Up Girls’ Educati<strong>on</strong>: Towards a <str<strong>on</strong>g>Scorecard</str<strong>on</strong>g> <strong>on</strong> Girls’ Educati<strong>on</strong> in the<br />
Comm<strong>on</strong>wealth.’ (Online at http://k1.ioe.ac.uk/schools/efps/GenderEducDev/Where%20are%20w<br />
e%20scaling%20up%20from%20FINAL%20FINAL.pdf )<br />
World Bank. (2004) Educati<strong>on</strong> Statistics (Online at http://devdata.worldbank.org/edstats/Thematic<br />
DataOnEducati<strong>on</strong> )<br />
A <str<strong>on</strong>g>Scorecard</str<strong>on</strong>g> <strong>on</strong> Gender Equality <strong>and</strong> Girls’ Educati<strong>on</strong> in Asia 1990–2000 25