ICT Applications in Merchant Ship Fleet - Global Business Dialogue ...
ICT Applications in Merchant Ship Fleet - Global Business Dialogue ...
ICT Applications in Merchant Ship Fleet - Global Business Dialogue ...

Create successful ePaper yourself
Turn your PDF publications into a flip-book with our unique Google optimized e-Paper software.
<strong>ICT</strong> <strong>Applications</strong> <strong>in</strong> <strong>Merchant</strong> <strong>Ship</strong> <strong>Fleet</strong><br />
- Expectation for Ubiquitous Network at Sea -<br />
Yutaka YASUNAGA<br />
NYK L<strong>in</strong>e<br />
1
NYK Corporate Profile 1/2<br />
NYK LINE (Nippon Yusen Kabushiki<br />
Kaisha)<br />
– Head Office: Tokyo, Japan<br />
– Founded: September 29, 1885<br />
– Bus<strong>in</strong>ess Scope<br />
• L<strong>in</strong>er (Conta<strong>in</strong>er) Service<br />
• Tramp and Specialized Carrier Services<br />
• Tankers and Gas Carrier Services<br />
• Logistics Service<br />
• Term<strong>in</strong>al and Harbor Transport Services<br />
• Air Cargo Transport Service<br />
• Cruise <strong>Ship</strong> Service<br />
NYK Head office <strong>in</strong> Tokyo<br />
2
NYK Corporate Profile 2/2<br />
• Employee<br />
– Head Office : 1,643 (Land 1,268 / Sea 375)<br />
– NYK Group : about 51,000<br />
• F<strong>in</strong>ancial Highlights<br />
Consolidated (Total NYK Group)<br />
Revenues USD 22,418 M<br />
Net Profit USD 990 M<br />
Total Asset USD 19,828 M<br />
[ Consolidated Revenue ]<br />
(Fiscal Year ended 3/31/2008)<br />
3
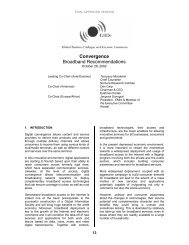
<strong>Fleet</strong> and Non-<strong>Fleet</strong> Investment Plans<br />
Ma<strong>in</strong>ly bulk<br />
carriers<br />
Tankers and<br />
LNG carriers<br />
March 2005<br />
Actual size<br />
of fleet on<br />
March 31,2005<br />
April 2005 - March 2008 (Actual)<br />
▶Newly acquired<br />
vessels<br />
▶Procurement total<br />
▶110 ships<br />
▶¥520 billion<br />
Anticipated size<br />
of fleet on<br />
March 31, 2008<br />
371 ships 492 ships<br />
April 2008 - March 2011<br />
▶Newly acquired<br />
vessels<br />
▶Procurement total<br />
▶132 ships<br />
▶¥740 billion<br />
Anticipated size<br />
of fleet on<br />
March 31, 2011<br />
630 ships<br />
April 2011 - March 2014<br />
▶Newly acquired<br />
vessels<br />
▶Procurement total<br />
▶150-200 ships<br />
▶¥1,100-¥1,200 billion<br />
Anticipated size<br />
of fleet on<br />
March 31, 2014<br />
750-800<br />
ships<br />
Car<br />
carriers<br />
▶24 ships<br />
▶¥120 billion<br />
98 ships 113 ships<br />
▶39 ships<br />
▶¥250 billion<br />
150 ships<br />
▶20-30 ships<br />
▶¥140-¥200 billion<br />
160-170<br />
ships<br />
Ma<strong>in</strong>ly<br />
l<strong>in</strong>ers<br />
▶41 ships<br />
▶¥260 billion<br />
177 ships 201 ships<br />
▶47 ships<br />
▶¥380 billion<br />
220 ships<br />
▶30-40 ships<br />
▶¥300-¥400 billion<br />
240-250<br />
ships<br />
Total<br />
▶175 ships<br />
▶¥900 billion<br />
646 ships 806 ships<br />
▶218 ships<br />
▶¥1,370 billion<br />
1,000 ships<br />
▶200-270 ships<br />
▶¥1,540-¥1,800 billion<br />
1,150-1,220<br />
ships<br />
Nonfleet Investment (Logistics, Air Cargo Transportation, Other)<br />
April 2005 - March 2008<br />
⇒ ¥290 billion<br />
April 2008 - March 2011<br />
⇒ ¥290 billion<br />
4
<strong>Global</strong> trends of shipp<strong>in</strong>g bus<strong>in</strong>ess<br />
• Background<br />
– Steady growth of sea trades<br />
• Problems to be solved<br />
– Lack of seafarers resources<br />
• Especially experienced officers<br />
– Environmental issues<br />
• CO2 emission reduction<br />
5
and drawn up by NYK research Group Data source: Fearnleys Review and various Compiled<br />
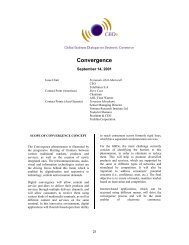
Trends of Bulk trade<br />
Billion ton-mile<br />
10,000<br />
9,000<br />
8,000<br />
7,000<br />
6,000<br />
5,000<br />
4,000<br />
3,000<br />
2,000<br />
1,000<br />
0<br />
Bulk Trade and Bulker <strong>Fleet</strong> Development<br />
1972-2006<br />
Average annual growth rate 1972-2006<br />
3 major bulk cargo 4.3%<br />
Bulker fleet 4.7%<br />
Bulk Cargo (ton-mile)<br />
iron ore/coal/gra<strong>in</strong><br />
Bulker <strong>Fleet</strong> (dwt)<br />
7273747576777879808182838485868788899091929394959697989900010203040506<br />
Million dwt<br />
400<br />
350<br />
300<br />
250<br />
200<br />
150<br />
100<br />
50<br />
0<br />
6
(mil.TEU)<br />
Trends of Conta<strong>in</strong>er trade<br />
500<br />
450<br />
400<br />
350<br />
300<br />
250<br />
200<br />
150<br />
100<br />
50<br />
0<br />
9.3%<br />
9.6%<br />
8.9% 9.0% 9.2%<br />
7.3%<br />
4.8% 4.2%<br />
3.7%<br />
146<br />
106<br />
88<br />
29<br />
14.7%14.7% 442<br />
13.1%<br />
401<br />
13.0%<br />
11.7%<br />
11.1%<br />
10.1% 10.0%<br />
10.4% 317<br />
10.0%<br />
9.3%<br />
9.5%<br />
8.0%<br />
236<br />
6.7% 211<br />
6.5%<br />
5.1% 4.8%<br />
5.2%<br />
4.2% 4.6%<br />
3.8% 3.5%<br />
131<br />
116<br />
57<br />
69<br />
-0.6%<br />
90 92 94 96 98 00 02 04 06<br />
16%<br />
14%<br />
12%<br />
10%<br />
8%<br />
6%<br />
4%<br />
2%<br />
0%<br />
-2%<br />
(Prelim<strong>in</strong>ary)<br />
World conta<strong>in</strong>er traffic<br />
Growth rate of conta<strong>in</strong>er traffic<br />
World port total Handl<strong>in</strong>g<br />
Growth rate of world export<br />
Compiled and drawn on by NYK Research Group<br />
Data:Drewry, WTO<br />
7
Supply-demand trends of seafarers<br />
(Unit: 1,000 persons)<br />
2000<br />
2005<br />
2010<br />
2015<br />
Officer<br />
supply<br />
404<br />
466<br />
467<br />
472<br />
demand<br />
420<br />
476<br />
488<br />
499<br />
difference<br />
-16<br />
-10<br />
-21<br />
-27<br />
Staff<br />
supply<br />
823<br />
721<br />
740<br />
774<br />
demand<br />
599<br />
586<br />
598<br />
607<br />
difference<br />
224<br />
135<br />
142<br />
167<br />
(Ref. BIMCO/ISF MANPOWER2005 UPDATE)<br />
8
<strong>Global</strong> CO 2 emissions from shipp<strong>in</strong>g<br />
1) S<strong>in</strong>ce 1990<br />
CO2 emission from ships <strong>in</strong> 2004 is<br />
40% more than 1990.<br />
2) At present and future<br />
<strong>Global</strong> CO 2 emissions from<br />
International shipp<strong>in</strong>g<br />
2007<br />
847 mil tons<br />
2050<br />
1,950~2,960 mil tons<br />
2.3~3.5 times<br />
9
GHG Reduction for 2050<br />
<br />
1. The growth of International Trade Volume: 3% p.a. (326% <strong>in</strong> 2050)<br />
2. The target of reduc<strong>in</strong>g CO2 by 2050 : 50% less than current level<br />
The emission of CO2/Ton・Mile must be 85% less <strong>in</strong> 2050<br />
Some Rules/Guidel<strong>in</strong>es will be decided <strong>in</strong> 2009<br />
10
<strong>ICT</strong> will change work at sea<br />
• Sea-shore communication network<br />
– Current ships are too isolated. Broadband network<br />
between sea and shore is expected<br />
– Work style and life style onboard will change<br />
• More computation will be onboard<br />
– Computation has <strong>in</strong>creased safety level<br />
• ARPA (automatic radar plott<strong>in</strong>g), ECDIS (electronic charts)<br />
and AIS (automatic identification system)<br />
– More and more simulation technology will be onboard<br />
<strong>in</strong> com<strong>in</strong>g decade for safety, economy and ecology<br />
11
<strong>Ship</strong> IT network now<br />
• Available network (global coverage)<br />
– Inmarsat F … max 128 Kbps<br />
• Currently available for worldwide shipp<strong>in</strong>g<br />
– Inmarsat BGAN/<strong>Fleet</strong> Broadband … max 432 Kbps<br />
• Worldwide coverage will start from Feb 2009<br />
– Iridium … 10 Kbps/2.4 Kbps<br />
12
Expect<strong>in</strong>g <strong>ICT</strong> solutions (<strong>in</strong> 5 years)<br />
(1/2)<br />
• Improvement of seafarer’s amenity<br />
– Communications to shore by VoIP<br />
– TV / Video on demand stream<strong>in</strong>g<br />
– Broadband connection at ports<br />
• Sea-Shore <strong>in</strong>formation shar<strong>in</strong>g<br />
– Collaboration between capta<strong>in</strong> and shore experts<br />
– Data/<strong>in</strong>formation shar<strong>in</strong>g … weather and status<br />
13
Available ship <strong>in</strong>formation from shore<br />
• Noon reports<br />
– <strong>Ship</strong>s are report<strong>in</strong>g position, speed, weather, fuel<br />
consumption daily basis by e-mail<br />
– All <strong>in</strong>puts are manual and data reliability is limited<br />
• Position track<strong>in</strong>g system<br />
– <strong>Ship</strong>’s position can be monitored by GPS and satellite<br />
communication<br />
• Auto-logg<strong>in</strong>g and monitor<strong>in</strong>g system<br />
– Monitor<strong>in</strong>g eng<strong>in</strong>e and ship performances. These are<br />
com<strong>in</strong>g technologies<br />
14
Weather forecast is the critical<br />
<strong>in</strong>formation for navigation<br />
Example)<br />
December 2007. High wave was developed by storm <strong>in</strong> the pacific ocean.<br />
Capta<strong>in</strong> made voyage plan to avoid high wave area. (Yellow L<strong>in</strong>e)<br />
15
Expect<strong>in</strong>g <strong>ICT</strong> solutions (<strong>in</strong> 5 years)<br />
(2/2)<br />
• Remote ma<strong>in</strong>tenance<br />
– Preventive ma<strong>in</strong>tenance of high risk mechanical<br />
components (eng<strong>in</strong>es and turb<strong>in</strong>es)<br />
– Remote diagnosis of software and navigational<br />
equipments.<br />
• Emergency responses<br />
– Aga<strong>in</strong>st seajacks and terrorisms<br />
– Remote medical treatment<br />
16
Technology <strong>in</strong> the future<br />
• Accurate weather forecast and weather rout<strong>in</strong>g<br />
– Optimize route and speed based on accurate weather<br />
forecast is the key technology to reduce CO2 emission<br />
• Wave measurement and forecast<br />
– Wave is the most important <strong>in</strong>formation <strong>in</strong> terms of<br />
safety and performance of ships<br />
• CO2 emission monitor<strong>in</strong>g and management<br />
17
Accurate weather forecast and<br />
weather rout<strong>in</strong>g<br />
Expect<strong>in</strong>g technology<br />
• Accurate weather<br />
forecast<br />
• <strong>Global</strong> sea current<br />
<strong>in</strong>formation<br />
• Weather rout<strong>in</strong>g for<br />
optimum route and<br />
speed<br />
Kuroshio current simulation image.<br />
• Wave forecast<br />
18
Wave affects safety and performance<br />
Expect<strong>in</strong>g technology<br />
• X-band radar wave sensor<br />
• <strong>Ship</strong> onboard motion simulator<br />
• <strong>Ship</strong> structure health<br />
monitor<strong>in</strong>g<br />
Rough sea affects ship’s safety<br />
and performance<br />
• Wave resistance simulation<br />
19
Summary<br />
• <strong>Ship</strong>p<strong>in</strong>g <strong>in</strong>dustry requires more <strong>ICT</strong><br />
technologies <strong>in</strong> ship operation as we are<br />
fac<strong>in</strong>g lack of experienced human resources<br />
• Ubiquitous network at sea is the key<br />
• CO2 emission reduction is also expected to<br />
be strongly addressed by <strong>ICT</strong> technologies<br />
20