Vote 36 Trade and Industry - National Treasury
Vote 36 Trade and Industry - National Treasury
Vote 36 Trade and Industry - National Treasury

Create successful ePaper yourself
Turn your PDF publications into a flip-book with our unique Google optimized e-Paper software.
vote <strong>36</strong> <strong>Trade</strong> <strong>and</strong> <strong>Industry</strong><br />
<strong>National</strong> <strong>Treasury</strong><br />
estimates of national expenditure<br />
national treasury<br />
Department:<br />
<strong>National</strong> <strong>Treasury</strong><br />
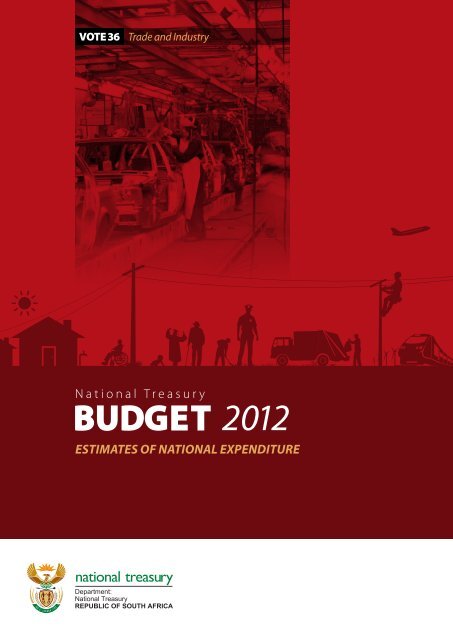
REPUBLIC OF SOUTH AFRICA
Estimates of<br />
<strong>National</strong> Expenditure<br />
2012<br />
<strong>National</strong> <strong>Treasury</strong><br />
Republic of South Africa<br />
22 February 2012
ISBN: 978-0-621-40578-1<br />
RP: 01/2012<br />
The Estimates of <strong>National</strong> Expenditure 2012 e-publications are compiled with the latest available information from<br />
departmental <strong>and</strong> other sources. Some of this information is unaudited or subject to revision.<br />
The Estimates of <strong>National</strong> Expenditure e-publications for individual votes are available on www.treasury.gov.za.<br />
Compared to the abridged version of the Estimates of <strong>National</strong> Expenditure, these publications contain more<br />
comprehensive coverage of goods <strong>and</strong> services, transfers <strong>and</strong> subsidies, <strong>and</strong> public entities. Additional tables are included<br />
containing information on the main <strong>and</strong> adjusted appropriation, with revised spending estimates for the current financial<br />
year, on skills training, conditional grants to provinces <strong>and</strong> municipalities, public private partnerships <strong>and</strong> information on<br />
donor funding. Expenditure information at the level of service delivery is also included, where appropriate.
Foreword<br />
The current global economic context is characterised by high levels of uncertainty. Against this backdrop, South<br />
Africa’s development depends largely on government improving its level <strong>and</strong> quality of service delivery in<br />
support of the inclusive <strong>and</strong> equitable economic roadmap, as contained in the new growth path. The 2012 Budget<br />
is an important tool of government for giving effect to these objectives, <strong>and</strong> this Budget allocates resources to<br />
specific interventions that will be actioned over the period of the medium term expenditure framework (MTEF).<br />
Growth in spending focuses particularly on infrastructure development, job creation, enterprise support <strong>and</strong> the<br />
enhancement of local government delivery.<br />
South Africa’s fiscal stance <strong>and</strong> public spending programmes are focused on long term structural transformation.<br />
Over the next three years of the MTEF period, government priorities will continue to be realised within a<br />
sustainable fiscal trajectory, which balances current needs with intergenerational equity. In line with this,<br />
spending baselines have undergone rigorous review, areas of inefficiency <strong>and</strong> lower priority have been identified,<br />
<strong>and</strong> funds have been redirected towards government’s key priorities, both new <strong>and</strong> existing. This has been done in<br />
recognition of the relationship between the composition of spending <strong>and</strong> fiscal sustainability over the long term.<br />
Here, the balance between consumption <strong>and</strong> investment is extremely important. Even the distribution of<br />
consumption spending between wages, goods <strong>and</strong> services <strong>and</strong> transfers is significant, as is the balance between<br />
the functional categories expenditure (such as education, health <strong>and</strong> economic services). Underspending on key<br />
priorities undermines the aims of the spending proposed within MTEF Budgets.<br />
Since introducing the functional approach to budget decision-making in 2009, transparency <strong>and</strong> coordination in<br />
budgeting has been enhanced, largely due to the participation by the stakeholders responsible for delivery across<br />
all spheres of government. South African budget reforms, especially the intensified focus on budget trade-offs <strong>and</strong><br />
the composition of expenditure, will lead to greater accountability <strong>and</strong> improved control.<br />
It is not enough to demonstrate a change in the composition of budgeted expenditure; nor is it enough to pinpoint<br />
the specific actions required <strong>and</strong> proposed within the Budget. Success will only be achieved when we can<br />
demonstrate that a shift in the composition of actual expenditure has taken place, together with the achievement of<br />
improved delivery targets.<br />
This year, the layout of this publication has been altered substantially. The focus is on linking more closely<br />
expenditure planned with targeted performance. Specific focus is on the outcomes to which institutions contribute<br />
<strong>and</strong> the output <strong>and</strong> other performance measures supporting them. The sections covering employee numbers,<br />
personnel budgets <strong>and</strong> the purpose <strong>and</strong> key activities of each subprogramme within a vote are now more<br />
prominent, giving expression to the budget <strong>and</strong> service delivery. This publication still indicates details per vote of<br />
the allocation of new monies, monies reprioritised between or within budget programmes, <strong>and</strong> Cabinet approved<br />
budget reductions over the period ahead. Compared to the abridged version of the Estimates of <strong>National</strong><br />
Expenditure, the e-publications for each vote contain more comprehensive coverage of goods <strong>and</strong> services,<br />
transfers <strong>and</strong> subsidies, <strong>and</strong> public entities. Additional tables are included, containing information on: the main<br />
<strong>and</strong> adjusted appropriation, with revised spending estimates for the current financial year; skills training;<br />
conditional grants to provinces <strong>and</strong> municipalities; public private partnerships; <strong>and</strong> donor funding. Expenditure<br />
information at the level of service delivery is also included, where appropriate.<br />
The expenditure estimates of departments are the outcome of a rigorous administrative <strong>and</strong> executive process.<br />
<strong>Treasury</strong> budget analysts, under the guidance of the Ministers’ Committee on the Budget, follow a wide-ranging<br />
intergovernmental consultative process, working closely with the policy <strong>and</strong> budget teams of departments <strong>and</strong><br />
entities to ensure that government priorities are appropriately funded within the available resource envelope. The<br />
<strong>Treasury</strong> is grateful for the contribution of these teams. Appreciation is also due to the people in the <strong>Treasury</strong><br />
team, who worked with great diligence to produce a high quality document that provides a comprehensive account<br />
of government’s spending <strong>and</strong> performance plans.<br />
Lungisa Fuzile<br />
Director General: <strong>National</strong> <strong>Treasury</strong>
Introduction<br />
The Estimates of <strong>National</strong> Expenditure publications<br />
The Estimates of <strong>National</strong> Expenditure publications are important accountability documents, which set out the<br />
details in relation to planned expenditure <strong>and</strong> planned performance at the time of the tabling of the Budget.<br />
Estimates of <strong>National</strong> Expenditure publications continue to make a significant contribution to the changes<br />
relating to budgeting by programme. As part of these ongoing efforts, several changes have been made to the<br />
2012 Estimates of <strong>National</strong> Expenditure publications. Departments still provide information on the key<br />
objectives of each subprogramme within a programme, <strong>and</strong> note the activities carried out, the number of<br />
personnel responsible for undertaking these activities <strong>and</strong> the funding allocations supporting this. This year in<br />
the 2012 publications, information on expenditure <strong>and</strong> performance is more closely linked under the<br />
’expenditure trends’ section, with a brief discussion on the impact of budget allocations on the achievement of<br />
outputs over the seven-year period. In addition, an explanation of the personnel trends, per programme by salary<br />
level, over the seven years in relation to compensation of employees has also been included. Finally,<br />
information on Cabinet approved cost reduction measures <strong>and</strong> other budget reprioritisation has been included<br />
per programme.<br />
The 2012 abridged Estimates of <strong>National</strong> Expenditure publication, <strong>and</strong> the separate Estimates of <strong>National</strong><br />
Expenditure e-publications for each vote are the product of an extensive consultative review process of budgets<br />
<strong>and</strong> policy, <strong>and</strong> policy implementation by programme, <strong>and</strong> include the latest improvements in non-financial<br />
performance information. These publications provide the details of the spending estimates for the next three<br />
financial years (2012/13 to 2014/15), expenditure outcomes for the past three years (2008/09 to 2010/11) <strong>and</strong><br />
revised estimates for the current financial year (2011/12). Information is provided on performance targets over<br />
the seven year period as well as changes in these, as they relate to trends in planned expenditure.<br />
The e-publications for individual votes contain more comprehensive coverage of goods <strong>and</strong> services, transfers<br />
<strong>and</strong> subsidies, <strong>and</strong> public entities. Additional tables are included containing information on: the main <strong>and</strong><br />
adjusted appropriation, with revised spending estimates for the current financial year; skills training; conditional<br />
grants to provinces <strong>and</strong> municipalities; public private partnerships; <strong>and</strong> donor funding. Expenditure information<br />
at the level of service delivery is also included, where appropriate.<br />
A consolidated account, summarising the Estimates of <strong>National</strong> Expenditure publication information across<br />
votes, is provided in the form of a narrative <strong>and</strong> summary tables in the Introduction chapter, which is included in<br />
the front pages of the abridged version of the Estimates of <strong>National</strong> Expenditure. A write-up containing the<br />
explanation of the information that is contained in each section of the publications has also been included in the<br />
abridged version of the Estimates of <strong>National</strong> Expenditure. Like the separate Estimates of <strong>National</strong> Expenditure<br />
e-publications for each vote, the abridged Estimates of <strong>National</strong> Expenditure publication is also available on<br />
www.treasury.gov.za.
<strong>Trade</strong> <strong>and</strong> <strong>Industry</strong><br />
<strong>National</strong> <strong>Treasury</strong><br />
Republic of South Africa
Contents<br />
Budget summary ................................................................................................... 1<br />
Aim ......................................................................................................................... 1<br />
Programme purposes ........................................................................................... 1<br />
Strategic overview: 2008/09 – 2014/15 ................................................................ 2<br />
Selected performance indicators......................................................................... 4<br />
Expenditure estimates .......................................................................................... 6<br />
Expenditure trends ............................................................................................... 7<br />
Personnel information .......................................................................................... 9<br />
Departmental receipts ......................................................................................... 10<br />
Programme 1: Administration ............................................................................. 11<br />
Programme 2: International <strong>Trade</strong> <strong>and</strong> Economic Development ..................... 13<br />
Programme 3: Broadening Participation ........................................................... 15<br />
Programme 4: Industrial Development: Policy Development ......................... 19<br />
Programme 5: Consumer <strong>and</strong> Corporate Regulation ....................................... 22<br />
Programme 6: Industrial Development: Incentive Administration ................... 25<br />
Programme 7: <strong>Trade</strong> <strong>and</strong> Investment South Africa ........................................... 29<br />
Public entities <strong>and</strong> other agencies ..................................................................... 32<br />
Additional tables .................................................................................................. 77
<strong>Trade</strong> <strong>and</strong> <strong>Industry</strong><br />
Budget summary<br />
R thous<strong>and</strong><br />
MTEF allocation<br />
Total to be<br />
appropriated<br />
Current<br />
payments<br />
<strong>Vote</strong> <strong>36</strong><br />
2012/13 2013/14 2014/15<br />
Transfers <strong>and</strong><br />
subsidies<br />
Payments for<br />
capital assets Total Total<br />
Administration 608 742 597 405 1 927 9 410 690 473 722 213<br />
International <strong>Trade</strong> <strong>and</strong> Economic Development 133 462 97 762 35 400 300 137 804 149 851<br />
Broadening Participation 879 891 89 913 789 398 580 928 <strong>36</strong>2 985 588<br />
Industrial Development: Policy Development 1 482 856 105 915 1 376 221 720 1 535 873 1 673 178<br />
Consumer <strong>and</strong> Corporate Regulation 244 713 70 653 173 <strong>36</strong>0 700 259 580 248 490<br />
Industrial Development: Incentive Administration 5 437 565 158 196 5 278 319 1 050 6 472 083 6 960 512<br />
<strong>Trade</strong> <strong>and</strong> Investment South Africa 304 826 183 522 119 954 1 350 328 173 378 302<br />
Total expenditure estimates 9 092 055 1 303 <strong>36</strong>6 7 774 579 14 110 10 352 348 11 118 134<br />
Executive authority Minister of <strong>Trade</strong> <strong>and</strong> <strong>Industry</strong><br />
Accounting officer Director General of <strong>Trade</strong> <strong>and</strong> <strong>Industry</strong><br />
Website address www.thedti.gov.za<br />
Aim<br />
Lead <strong>and</strong> facilitate access to sustainable economic activity <strong>and</strong> employment for all South Africans through its<br />
underst<strong>and</strong>ing of the economy, its knowledge of economic opportunities <strong>and</strong> potential, <strong>and</strong> its anticipation of<br />
future economic trends. The department also aims to catalyse economic transformation <strong>and</strong> development, <strong>and</strong> to<br />
provide a predictable, competitive, equitable <strong>and</strong> socially responsible environment for investment, enterprise<br />
<strong>and</strong> trade for economic citizens. In this way, the department will contribute to achieving government’s vision of<br />
an adaptive <strong>and</strong> restructured economy, characterised by accelerated economic growth, employment creation<br />
<strong>and</strong> greater equity by 2014.<br />
Programme purposes<br />
Programme 1: Administration<br />
Purpose: Provide strategic leadership to the department <strong>and</strong> its entities, to ensure the successful implementation<br />
of the department’s m<strong>and</strong>ate through sustainable <strong>and</strong> integrated resource solutions <strong>and</strong> services that are<br />
customer driven.<br />
Programme 2: International <strong>Trade</strong> <strong>and</strong> Economic Development<br />
Purpose: Build an equitable global trading system that facilitates development by strengthening trade <strong>and</strong><br />
investment links with key economies <strong>and</strong> by fostering African development, including regional <strong>and</strong> continental<br />
integration <strong>and</strong> development cooperation in line with the New Partnership for Africa’s Development.<br />
Programme 3: Broadening Participation<br />
Purpose: Lead the development of policies <strong>and</strong> strategies that create an enabling environment for small,<br />
medium <strong>and</strong> micro enterprises, <strong>and</strong> enhance the competitiveness of local <strong>and</strong> provincial economies, to achieve<br />
inclusive shared equity, growth <strong>and</strong> job creation.<br />
1
2012 Estimates of <strong>National</strong> Expenditure<br />
Programme 4: Industrial Development: Policy Development<br />
Purpose: Design <strong>and</strong> implement policies, strategies <strong>and</strong> programmes to develop manufacturing <strong>and</strong> related<br />
sectors of the economy; in order to contribute to the creation of decent jobs, value addition <strong>and</strong> competitiveness<br />
in both domestic <strong>and</strong> export markets.<br />
Programme 5: Consumer <strong>and</strong> Corporate Regulation<br />
Purpose: Develop <strong>and</strong> implement coherent, predictable <strong>and</strong> transparent regulatory solutions that facilitate easy<br />
access to redress <strong>and</strong> efficient regulation for economic citizens.<br />
Programme 6: Industrial Development: Incentive Administration<br />
Purpose: Stimulate <strong>and</strong> facilitate the development of sustainable, competitive enterprises through the efficient<br />
provision of effective <strong>and</strong> accessible incentive measures that support national priorities.<br />
Programme 7: <strong>Trade</strong> <strong>and</strong> Investment South Africa<br />
Purpose: Increase export capacity <strong>and</strong> support direct investment flows through strategies for targeted markets,<br />
<strong>and</strong> an effectively managed network of foreign trade offices.<br />
Strategic overview: 2008/09 – 2014/15<br />
The scope of the Department of <strong>Trade</strong> <strong>and</strong> <strong>Industry</strong>’s m<strong>and</strong>ate is governed by a broad legislative framework that<br />
includes: the Broad-Based Black Economic Empowerment Act, (2003); the Companies Act, (2008), the<br />
Consumer Protection Act, (2008), the <strong>National</strong> Small Enterprise Act, (1996), <strong>and</strong> the Small Business<br />
Development Act, (1981).<br />
The department strives to contribute to a dynamic <strong>and</strong> globally competitive industrial economy, that is<br />
characterised by inclusive growth <strong>and</strong> development, together with decent employment <strong>and</strong> equity, built on the<br />
full potential of all citizens. The department contributes to realising this vision by promoting structural<br />
transformation, through the provision of a predictable, competitive, equitable <strong>and</strong> socially responsible<br />
environment, which is conducive to investment, trade <strong>and</strong> enterprise development. The department will also<br />
broaden participation in the economy to strengthen economic development, <strong>and</strong> continually improve its internal<br />
skills <strong>and</strong> capabilities to effectively deliver on its m<strong>and</strong>ate, <strong>and</strong> respond to the needs of South Africa’s economic<br />
citizens.<br />
The department has 15 listed public entities that report to the minister.<br />
The department’s strategic objectives are to: facilitate the transformation of the economy to promote industrial<br />
development, investment, competitiveness <strong>and</strong> employment creation; build mutually beneficial regional <strong>and</strong><br />
global relations to advance South Africa’s trade, industrial policy, <strong>and</strong> economic development objectives;<br />
facilitate broad based economic participation through targeted interventions to achieve more inclusive growth;<br />
create a fair regulatory environment that enables investment, trade <strong>and</strong> enterprise development in an equitable<br />
<strong>and</strong> socially responsible manner; <strong>and</strong> promote a professional, ethical, dynamic, competitive <strong>and</strong> customer<br />
focused working environment that ensures effective <strong>and</strong> efficient service delivery.<br />
Strategic priorities over the medium term<br />
The department will build on its industrial development efforts through the industrial policy action plan <strong>and</strong> the<br />
new growth path. The action plans take forward government interventions in support of industrial development<br />
<strong>and</strong> employment creation. In some cases, other actions <strong>and</strong> programmes have been transferred to departments<br />
best suited to undertake these responsibilities. These include functions that will fall under the departments of<br />
tourism, science <strong>and</strong> technology, <strong>and</strong> agriculture, forestry <strong>and</strong> fishing. Plans for skills development, innovation<br />
<strong>and</strong> technology, have been added. Sector specific programmes on boatbuilding, oil <strong>and</strong> gas, <strong>and</strong> green<br />
industries, have been introduced.<br />
As part of an economic competiveness <strong>and</strong> support package that was announced in the Medium-term Budget<br />
Policy Statement, R8 billion over the medium term has been allocated to the Department of <strong>Trade</strong> <strong>and</strong> <strong>Industry</strong><br />
to stimulate the economy in two main areas:<br />
2
<strong>Vote</strong> <strong>36</strong>: <strong>Trade</strong> <strong>and</strong> <strong>Industry</strong><br />
• The manufacturing competitiveness enhancement programme<br />
• The department’s proposed manufacturing competitiveness enhancement programme receives R5.8 billion<br />
that is earmarked for manufacturers that are in distress from the effects of the financial crisis.<br />
• Due to thinner export markets <strong>and</strong> other adverse conditions arising from the financial crisis, this may take<br />
the form of: production support mechanisms, loans, equity injection, working capital support, restructuring<br />
assistance, support for the acquisition of fixed assets, <strong>and</strong> investment initiatives to enable the firms to<br />
address improved sales, job preservation <strong>and</strong> expansion, income support to employees, layoffs support, <strong>and</strong><br />
similar measures.<br />
• The manufacturing competitiveness enhancement programme aims to provide a credible support package<br />
to stabilise <strong>and</strong> grow output, employment <strong>and</strong> confidence in the manufacturing sector in the face of<br />
uncertain local <strong>and</strong> export market conditions arising from the global economic crisis. The programme<br />
seeks to encourage firms to innovate <strong>and</strong> invest in activities that will enhance their productivity <strong>and</strong> bolster<br />
their competitiveness. It will target firms in downstream manufacturing sectors that are characterised by<br />
high employment intensity <strong>and</strong> exposure to intense international competition.<br />
• Industrial development zones <strong>and</strong> proposed special economic zones<br />
• Over the medium term, R2.3 billion has been allocated to the industrial development zones <strong>and</strong> proposed<br />
special economic zones. The department has undertaken a comprehensive review of the zones with a view<br />
to improving the infrastructure in the zones, attracting foreign <strong>and</strong> domestic investors, developing<br />
structured financing products <strong>and</strong> incentive measures to achieve the outcomes of the industrial policy<br />
action plan <strong>and</strong> the new growth path. The draft strategy <strong>and</strong> draft bill have been published for public<br />
comment, for which the deadline is late March 2012.<br />
The South African renewables initiative shall examine low interest loans <strong>and</strong> guarantee instruments. Funding<br />
shall be sourced from international <strong>and</strong> domestic sources. The initiative aims to assist in meeting the emissions<br />
reductions targets of 34 per cent below business as usual by 2020, <strong>and</strong> to 42 per cent by 2025. It further aims to<br />
establish the financing arrangements, optimise job creation <strong>and</strong> exp<strong>and</strong> South Africa’s manufacturing base.<br />
Broadening participation in the economy<br />
In broadening participation in the economy, the focus will be on the amendment of the Cooperative Act (2005)<br />
to enable the establishment of the Cooperatives Agency, an institution that will provide adequate financial <strong>and</strong><br />
non-financial support to cooperatives, to ensure that they are sustainable <strong>and</strong> self-sufficient. Cabinet has<br />
approved the Cooperatives Amendment Bill <strong>and</strong> strategy for public comment.<br />
Refining the legislative <strong>and</strong> regulatory environment<br />
The Consumer Protection Act (2008) came into effect in April 2011. The act aims to improve consumer<br />
confidence levels in the South African market by providing consumers with protection on issues such as<br />
agreements, product quality, rights to refund <strong>and</strong> repairs. This will complement the <strong>National</strong> Credit Act (2005),<br />
which has made good progress in curbing reckless lending <strong>and</strong> spending. The <strong>National</strong> Consumer Commission<br />
has been established to protect consumers.<br />
• The Companies Act (2008), which came into effect on 1 May 2011, simplifies business registration<br />
processes, reduces red tape <strong>and</strong> enhances the transparency of companies. It establishes the following<br />
institutions: the Companies <strong>and</strong> Intellectual Property Commission, to enforce company <strong>and</strong> intellectual<br />
property legislation; the Companies Tribunal, providing for dispute resolution <strong>and</strong> reviews of administrative<br />
decisions made by the Companies <strong>and</strong> Intellectual Property Commission; the Take-Over Regulation Panel,<br />
prescribing regulations on company takeovers; <strong>and</strong> the Financial Reporting St<strong>and</strong>ards Council, which<br />
advises the minister on regulations on financial reporting st<strong>and</strong>ards, <strong>and</strong> companies’ financial records <strong>and</strong><br />
statements.<br />
3
2012 Estimates of <strong>National</strong> Expenditure<br />
Selected performance indicators<br />
Table <strong>36</strong>.1 <strong>Trade</strong> <strong>and</strong> <strong>Industry</strong><br />
Indicator Programme Past Current Projections<br />
Total number of projects<br />
implemented under the<br />
national industrial<br />
participation programme<br />
since its inception 1<br />
Total value of investment<br />
<strong>and</strong> export credits under<br />
the national industrial<br />
participation programme<br />
since its inception 1<br />
Total number of direct<br />
jobs created under the<br />
national industrial<br />
participation programme<br />
since its inception 1<br />
Number of projects<br />
supported under the<br />
support programme for<br />
industrial innovation per<br />
year<br />
Value of support for<br />
industrial innovation<br />
projects per year<br />
Number of technology<br />
incubators supported per<br />
year<br />
Number of technology<br />
transfer interventions<br />
supported per year<br />
Number of students<br />
supported by the<br />
technology <strong>and</strong> human<br />
resources for industry<br />
programme per year<br />
Number of researchers<br />
supported by technology<br />
<strong>and</strong> human resources for<br />
industry programme per<br />
year<br />
Number of companies<br />
financially assisted per<br />
year through:<br />
- export market <strong>and</strong><br />
4<br />
investment assistance<br />
Industrial Development:<br />
Policy Development<br />
Industrial Development:<br />
Policy Development<br />
Industrial Development:<br />
Policy Development<br />
2008/09 2009/10 2010/11 2011/12 2012/13 2013/14 2014/15<br />
225 250 275 290 0 0 0<br />
US$13bn US$14bn US$15.4bn US$16bn 0 0 0<br />
17 500 18 500 19 000 20 000 0 0 0<br />
Broadening Participation 85 100 110 20 20 20 25<br />
Broadening Participation R120m R160m R110m R20m R20m R20m R22m<br />
Broadening Participation 29 29 34 39 44 49 49<br />
Broadening Participation 30 40 40 40 40 40 40<br />
Broadening Participation 2 500 2 500 2 000 2100 2200 2200 2200<br />
Broadening Participation 730 750 798 700 700 700 700<br />
Industrial Development:<br />
Incentive Administration<br />
1 203 1 500 1 753 664 870 909 1 120<br />
- black business supplier<br />
development<br />
programme<br />
1 320 1 600 1 104 1 086 1 600 1 760 1 930<br />
- enterprise development<br />
programme<br />
3 200 1 800 600 300 200 120 100<br />
- enterprise investment<br />
programme<br />
50 300 759 530 750 296 315<br />
- cooperatives 150 220 232 115 135 145 145<br />
Number of film <strong>and</strong><br />
television productions<br />
assisted per year<br />
Number of bilateral <strong>and</strong><br />
regional trade <strong>and</strong><br />
investment agreements<br />
signed per year<br />
Number of successful<br />
technical <strong>and</strong> business<br />
missions to foreign<br />
countries <strong>and</strong> companies<br />
undertaken per year<br />
Number of governmentto-government<br />
platforms<br />
per year<br />
Industrial Development:<br />
Incentive Administration<br />
International <strong>Trade</strong> <strong>and</strong><br />
Economic Development<br />
International <strong>Trade</strong> <strong>and</strong><br />
Economic Development<br />
International <strong>Trade</strong> <strong>and</strong><br />
Economic Development<br />
60 80 49 40 63 70 73<br />
12 12 – 12 – – –<br />
15 15 23 15 15 15 15<br />
18 18 18 18 18 18 –
<strong>Vote</strong> <strong>36</strong>: <strong>Trade</strong> <strong>and</strong> <strong>Industry</strong><br />
Table <strong>36</strong>.1 <strong>Trade</strong> <strong>and</strong> <strong>Industry</strong> (continued)<br />
Indicator Programme Past Current Projections<br />
Number of target internal<br />
<strong>and</strong> external events <strong>and</strong><br />
exhibitions per year<br />
Key performance<br />
indicators for Coega<br />
industrial development<br />
zone:<br />
- total value of investment<br />
per year<br />
- number of jobs facilitated<br />
per year<br />
- number of further<br />
investors expected per<br />
year<br />
Key performance<br />
indicators for East London<br />
industrial development<br />
zone:<br />
- number of foreign<br />
investors per year<br />
- value of investments per<br />
year<br />
- number of jobs facilitated<br />
per year<br />
Key performance<br />
indicators for Richards Bay<br />
industrial development<br />
zone:<br />
- number of foreign<br />
investors per year<br />
- value of investments per<br />
year<br />
- number of jobs facilitated<br />
per year<br />
Key performance<br />
indicators for the critical<br />
infrastructure programme:<br />
- number of new projects<br />
per year<br />
- value of investments per<br />
year<br />
- number of jobs facilitated<br />
per year<br />
Number of direct jobs<br />
facilitated per year<br />
- enterprise investment<br />
programme<br />
2008/09 2009/10 2010/11 2011/12 2012/13 2013/14 2014/15<br />
Administration 50 100 68 150 60 60 60<br />
Industrial<br />
Development:<br />
Incentive<br />
Administration<br />
Industrial<br />
Development:<br />
Incentive<br />
Administration<br />
Industrial<br />
Development:<br />
Incentive<br />
Administration<br />
Industrial<br />
Development:<br />
Incentive<br />
Administration<br />
Industrial<br />
Development:<br />
Incentive<br />
Administration<br />
- business process<br />
services<br />
<strong>and</strong> off-shoring<br />
Number of quarterly<br />
Industrial<br />
reports on industrial policy Development:<br />
action plan tabled at<br />
Policy Development<br />
Cabinet<br />
Number of templates<br />
submitted to <strong>National</strong><br />
<strong>Treasury</strong> for designation of<br />
sectors or sub-sectors per<br />
year2 Industrial<br />
Development:<br />
Policy Development<br />
Number of students<br />
enrolled in the tool making<br />
apprenticeship programme<br />
per year2 Industrial<br />
Development:<br />
Policy Development<br />
Number of workers trained<br />
through the industrial skills<br />
upgrading programme per<br />
year2 Industrial<br />
Development:<br />
Policy Development<br />
1. Indicators have been revised as a result of the shift in focus of programmes.<br />
2. New indicators introduced.<br />
R22.07bn R800m R402m R3bn R800m R1bn R1.5bn<br />
4 906 2 775 193 1 200 800 1 000 1 200<br />
2 4 6 6 5 6 7<br />
7 4 7 2 3 3 3<br />
R347m R96m R531m R350m R500m R750m R750<br />
525 192 521 700 100 400 400<br />
–<br />
4<br />
1<br />
2<br />
– R1.9bn R250m R300m R200m R200m R400m<br />
140 375 150 100 200 200 300<br />
5 12 12 6 12 13 13<br />
R12bn R6bn R34.7bn R4bn R6bn R6.5bn R6.5bn<br />
3 910 2 510 9 271 3 520 3 600 4 000 4 000<br />
– 1 025 15 018<br />
6 875 11 582<br />
9 417 9 8<br />
6<br />
7<br />
5 950 2 340 806 800 6 000 7 000 10 000<br />
– – 4 4 4 4 4<br />
– – – 6 3 3 3<br />
– – – 150 420 490 150<br />
– – – 150 200 300 350<br />
1<br />
1<br />
2<br />
5
2012 Estimates of <strong>National</strong> Expenditure<br />
Expenditure estimates<br />
Table <strong>36</strong>.2 <strong>Trade</strong> <strong>and</strong> <strong>Industry</strong><br />
Programme<br />
Adjusted Revised<br />
Audited outcome<br />
appropriation estimate Medium-term expenditure estimate<br />
R thous<strong>and</strong> 2008/09 2009/10 2010/11 2011/12 2012/13 2013/14 2014/15<br />
Administration 421 721 443 203 479 989 659 286 641 586 608 742 690 473 722 213<br />
International <strong>Trade</strong> <strong>and</strong> Economic<br />
Development<br />
108 573 122 998 106 949 144 805 144 805 133 462 137 804 149 851<br />
Broadening Participation 1 065 127 1 160 601 798 077 865 695 885 695 879 891 928 <strong>36</strong>2 985 588<br />
Industrial Development: Policy<br />
Development<br />
418 740 425 470 1 145 129 1 311 047 1 <strong>36</strong>9 747 1 482 856 1 535 873 1 673 178<br />
Consumer <strong>and</strong> Corporate Regulation 111 610 133 825 145 021 229 671 231 671 244 713 259 580 248 490<br />
Industrial Development: Incentive<br />
Administration<br />
2 400 699 3 338 234 2 792 994 3 320 862 3 250 862 5 437 565 6 472 083 6 960 512<br />
<strong>Trade</strong> <strong>and</strong> Investment South Africa 310 233 298 979 328 582 345 147 352 147 304 826 328 173 378 302<br />
Total 4 8<strong>36</strong> 703 5 923 310 5 796 741 6 876 513 6 876 513 9 092 055 10 352 348 11 118 134<br />
Change to 2011 Budget estimate 89 617 89 617 1 725 151 2 779 911 3 091 351<br />
Economic classification<br />
Current payments 907 178 935 076 990 040 1 299 193 1 292 493 1 303 <strong>36</strong>6 1 433 085 1 512 866<br />
Compensation of employees 383 077 437 710 514 935 621 344 621 344 713 995 798 624 825 321<br />
Goods <strong>and</strong> services<br />
of which:<br />
524 101 497 <strong>36</strong>6 474 830 677 849 671 149 589 371 634 461 687 545<br />
Administrative fees 3 549 5 060 3 139 6 939 6 939 5 683 3 852 4 105<br />
Advertising 23 783 15 478 14 276 30 196 35 196 25 206 32 291 34 143<br />
Assets less than the capitalisation<br />
2 025 903 818 1 606 1 606 1 057 1 205 1 223<br />
threshold<br />
Audit cost: External 4 751 7 639 8 641 7 787 7 787 5 257 9 875 8 348<br />
Bursaries: Employees 587 1 078 1 353 2 485 2 485 1 424 1 477 1 566<br />
Catering: Departmental activities 3 762 2 814 3 108 6 540 6 540 5 377 5 455 5 799<br />
Communication 15 732 18 737 11 602 13 396 13 396 17 905 20 974 22 777<br />
Computer services 10 951 14 474 13 973 17 973 17 973 17 654 16 997 18 016<br />
Consultants <strong>and</strong> professional services:<br />
Business <strong>and</strong> advisory services<br />
55 598 39 754 39 872 93 473 93 473 87 693 87 201 99 678<br />
Consultants <strong>and</strong> professional services:<br />
Infrastructure <strong>and</strong> planning<br />
114 43 – – – – – –<br />
Consultants <strong>and</strong> professional services:<br />
Legal costs<br />
24 320 26 767 11 303 8 744 8 744 7 540 7 855 8 237<br />
Contractors 19 045 8 308 7 508 12 093 12 093 13 089 13 661 15 295<br />
Agency <strong>and</strong> support / outsourced<br />
services<br />
2 243 9 624 4 727 7 308 7 308 3 874 1 702 1 804<br />
Entertainment 1 091 1 002 1 101 2 022 2 022 5 024 5 097 5 404<br />
Fleet services (including government<br />
motor transport)<br />
– – 245 303 303 590 764 820<br />
Inventory: Fuel, oil <strong>and</strong> gas – – – 95 95 210 261 276<br />
Inventory: Learner <strong>and</strong> teacher<br />
63 – 92 – – – – –<br />
support material<br />
Inventory: Materials <strong>and</strong> supplies 23 115 544 206 206 560 630 678<br />
Inventory: Medical supplies – – – 1 1 – – –<br />
Inventory: Medicine – – 55 – – – – –<br />
Inventory: Other consumables 29 381 416 744 744 654 801 691<br />
Inventory: Stationery <strong>and</strong> printing 9 504 10 549 12 929 15 856 15 856 13 2<strong>36</strong> 14 380 16 283<br />
Lease payments 157 695 179 400 191 423 206 971 192 971 171 884 189 804 202 121<br />
Property payments 8 825 14 372 16 556 <strong>36</strong> 428 <strong>36</strong> 428 23 388 24 470 24 828<br />
Transport provided: Departmental<br />
– – – 20 20 100 – –<br />
activity<br />
Travel <strong>and</strong> subsistence 99 696 74 749 78 749 121 307 121 307 109 709 114 282 128 764<br />
Training <strong>and</strong> development 3 592 8 927 9 371 13 608 15 908 13 971 13 566 14 063<br />
Operating expenditure 22 208 15 4<strong>36</strong> 16 794 23 807 23 807 20 099 26 193 29 700<br />
Venues <strong>and</strong> facilities 54 915 41 756 26 235 47 941 47 941 38 187 41 668 42 926<br />
Interest <strong>and</strong> rent on l<strong>and</strong> – – 275 – – – – –<br />
Transfers <strong>and</strong> subsidies 3 903 542 4 961 921 4 789 206 5 533 381 5 551 081 7 774 579 8 908 954 9 594 654<br />
Departmental agencies <strong>and</strong> accounts 1 117 238 1 200 886 838 980 1 004 125 1 026 125 1 060 178 1 190 526 1 281 173<br />
Higher education institutions 10 500 15 500 14 793 3 504 3 504 10 004 12 834 15 751<br />
Foreign governments <strong>and</strong> international<br />
organisations<br />
34 169 31 402 <strong>36</strong> 642 40 420 40 420 37 038 39 020 41 228<br />
Public corporations <strong>and</strong> private<br />
2 730 <strong>36</strong>0 3 703 958 3 859 334 4 470 245 4 458 945 6 648 182 7 646 189 8 198 077<br />
enterprises<br />
Non-profit institutions 6 075 7 597 37 800 14 700 21 700 17 900 18 885 56 835<br />
Households 5 200 2 578 1 657 387 387 1 277 1 500 1 590<br />
6
Table <strong>36</strong>.2 <strong>Trade</strong> <strong>and</strong> <strong>Industry</strong> (continued)<br />
<strong>Vote</strong> <strong>36</strong>: <strong>Trade</strong> <strong>and</strong> <strong>Industry</strong><br />
Adjusted Revised<br />
Audited outcome<br />
appropriation estimate Medium-term expenditure estimate<br />
R thous<strong>and</strong><br />
Economic classification<br />
2008/09 2009/10 2010/11 2011/12 2012/13 2013/14 2014/15<br />
Payments for capital assets 22 077 23 160 15 189 43 939 32 939 14 110 10 309 10 614<br />
Machinery <strong>and</strong> equipment 14 847 20 440 12 875 25 315 14 315 11 422 10 110 10 <strong>36</strong>8<br />
Software <strong>and</strong> other intangible assets 7 230 2 720 2 314 18 624 18 624 2 688 199 246<br />
Payments for financial assets 3 906 3 153 2 306 – – – – –<br />
Total 4 8<strong>36</strong> 703 5 923 310 5 796 741 6 876 513 6 876 513 9 092 055 10 352 348 11 118 134<br />
Expenditure trends<br />
The spending focus over the MTEF period will be on designing <strong>and</strong> implementing policies, strategies <strong>and</strong><br />
programmes to promote industrial development <strong>and</strong> broadening participation. This will include providing<br />
incentives that will create an enabling environment to attract investment <strong>and</strong> stimulate the development of<br />
sustainable, competitive enterprises. This contributes directly to decent employment through inclusive economic<br />
growth (outcome 4).<br />
Expenditure increased from R4.8 billion in 2008/09 to R6.9 billion in 2011/12, at an average annual rate of<br />
12.4 per cent. Spending in the Industrial Development: Policy Development <strong>and</strong> Industrial Development:<br />
Incentive Administration programmes grew between 2008/09 <strong>and</strong> 2011/12, due to the introduction of incentive<br />
support programmes for the clothing <strong>and</strong> textile, <strong>and</strong> automotive sectors. The incentives increased expenditure<br />
in the Industrial Development: Policy Development programme from R418.7 million in 2008/09 to R1.3 billion<br />
in 2011/12, at an average annual rate of 46.3 per cent, <strong>and</strong> in the Industrial Development: Incentive<br />
Administration programme from R2.4 billion in 2008/09 to R3.3 billion in 2011/12, at an average annual rate of<br />
11.4 per cent.<br />
Over the medium term, expenditure is expected to grow to R11.1 billion, at an average annual rate of<br />
17.4 per cent, mainly as a result of additional allocations for the economic support <strong>and</strong> competitive package<br />
(R5.8 billion to the manufacturing competiveness enhancement programme <strong>and</strong> R2.3 billion for the special<br />
economic zones) which are classified under transfer payments.<br />
In addition, the 2012 Budget sets out additional allocations of:<br />
• R42.9 million for improved conditions of service in the department (R12.9 million in 2012/13,<br />
R14.2 million in 2013/14, <strong>and</strong> R15.8 million in 2014/15)<br />
• R14.2 million for the improved conditions of services in public entities (R4.5 million in 2012/13,<br />
R4.7 million in 2013/14, <strong>and</strong> R5 million in 2014/15)<br />
• R150 million for the <strong>National</strong> Metrology Institute of South Africa for capital infrastructure (R50 million in<br />
2013/14 <strong>and</strong> R100 million in 2014/15).<br />
Spending on consultants <strong>and</strong> professional services is expected to increase from R102.2 million in 2011/12 to<br />
R107.9 million in 2014/15, at an average annual rate of 1.8 per cent. Consultants are appointed to provide legal<br />
services for contracts <strong>and</strong> industrial research, <strong>and</strong> incentive reviews.<br />
Infrastructure spending<br />
Spending relates primarily to the critical infrastructure programme <strong>and</strong> the industrial development zones.<br />
Contributions through the critical infrastructure programme have generated R56.9 billion of investments.<br />
Between 2002 <strong>and</strong> 2010, these contributions have supported more than 69 424 direct job opportunities in<br />
infrastructure construction <strong>and</strong> operations. The number of direct job opportunities supported is lower than the<br />
74 000 initially reported in 2009, due to the economic recession <strong>and</strong> cancellation of some projects.<br />
R4.8 billion has been allocated to the three industrial development zones between 2002 <strong>and</strong> 2010. R3.5 billion<br />
of this was allocated to the Coega industrial development zone; the East London industrial development zone<br />
received R1.2 billion; <strong>and</strong> the Richards Bay industrial development zone received R88.4 million. Since the<br />
inception of the industrial development zones programme in 2001, 38 investors have invested R12.8 billion <strong>and</strong><br />
are on site in the three industrial development zones, <strong>and</strong> 41 451 jobs have been created. R1.1 billion in funding<br />
has been allocated to the three industrial development zones over the medium term: Coega will receive<br />
R726.1 million, East London R250 million <strong>and</strong> Richards Bay R72 million.<br />
7
2012 Estimates of <strong>National</strong> Expenditure<br />
The department, together with <strong>National</strong> <strong>Treasury</strong> <strong>and</strong> the Development Bank of Southern Africa, is considering<br />
incentive measures <strong>and</strong> financial instruments for the zones.<br />
Mega projects<br />
The Coega industrial development zone was designated in 2001. The greenfield site near Port Elizabeth<br />
consists of 11 500ha of l<strong>and</strong> <strong>and</strong> is adjacent to the Ngqura deep water port. Some of the key sectors at Coega<br />
include agro-processing, general manufacturing, business process services, energy, automotives <strong>and</strong><br />
petrochemicals. Infrastructure programmes include road construction, earthworks, electricity, water, sewerage,<br />
factories <strong>and</strong> office buildings.<br />
Coega was designed to attract private sector investment in export orientated industries. Its aims are to create<br />
jobs in the industrial development zone, to promote the growth of domestic industries outside Coega, <strong>and</strong> boost<br />
growth through increased exports, technology transfer <strong>and</strong> increased employment. 12 private investors have<br />
moved into the zone since inception. Another 13 private investors have committed about R9 billion, which<br />
could create approximately 3 000 jobs. Coega is in discussions with a further seven investors.<br />
The Coega Development Corporation’s expenditure increased from R718.4 million in 2008/09 to<br />
R859.9 million in 2009/10, <strong>and</strong> decreased to R714 million in 2010/11 <strong>and</strong> R383.7 million in 2011/12. The 2012<br />
Budget allocates R726.1 million to the corporation. Coega’s expenditure is expected to be R417.9 million in<br />
2012/13 <strong>and</strong> R308.2 million in 2013/14.<br />
The East London industrial development zone was designated in 2001. Its key focus sectors are: automotive,<br />
marine aquaculture, agro-processing (bio-fuels, food <strong>and</strong> timber processing), pharmaceutical industry, ICT <strong>and</strong><br />
electronics, business process services, <strong>and</strong> the automotive supplier park. The automotive supplier park supports<br />
the main component suppliers for the Mercedes Benz C-class export programme.<br />
Since 2002, 23 investors invested R1.1 billion <strong>and</strong> are operational on site. The investment has created<br />
1 240 direct jobs <strong>and</strong> approximately 11 300 construction jobs. The Sunningdale Dairy <strong>and</strong> Matla Diamond<br />
Works were completed in 2009/10. The East London industrial development zone is set to attract another nine<br />
investors with an estimated investment value of R900 million, <strong>and</strong> with the potential to create 900 jobs over the<br />
medium term. The industrial development zone received R154 million in 2008/09, R373.4 million in 2009/10,<br />
<strong>and</strong> R198 million in 2010/11. Over the MTEF period, it is allocated R171.3 million, R150 million <strong>and</strong><br />
R100 million.<br />
Between 2002/03 <strong>and</strong> 2010/11, the critical infrastructure development programme received R1.7 billion, of<br />
which R1.1 billion was spent on leveraged investment projects with an estimated value of R88.4 billion. The<br />
projects have created over 69 000 jobs; of which 59.4 per cent were permanent jobs <strong>and</strong> 40.6 per cent<br />
construction jobs. Over this period, the programme managed to provide infrastructure support to 42 investment<br />
projects at various locations across the country. 23.8 per cent of these were in KwaZulu-Natal, 21.4 per cent in<br />
Gauteng <strong>and</strong> 14.3 per cent in North West. 45.2 per cent of the projects supported were in the mining sector,<br />
14.3 per cent in manufacturing, <strong>and</strong> 8.3 per cent in tourism <strong>and</strong> chemicals.<br />
The critical infrastructure development programme projects have committed to support upstream <strong>and</strong><br />
downstream industries to produce value added products in line with national industrial policy. The budget<br />
allocation in 2011/12 was R118.5 million. Expenditure is set to increase to R182 million in 2012/13,<br />
R190 million in 2013/14 <strong>and</strong> R203 million in 2014/15.<br />
Large project<br />
The <strong>National</strong> Metrology Institute of South Africa establishes <strong>and</strong> manages an internationally accepted<br />
measurement system for South Africa. The institute is seeking a means to upgrade the national measurement<br />
st<strong>and</strong>ards by building a fit for purpose facility, <strong>and</strong> modernising the equipment that makes up the national<br />
measurement st<strong>and</strong>ards.<br />
The institute’s measurement infrastructure <strong>and</strong> equipment is fast becoming outdated. The institute is currently<br />
unable to provide an accurate measurement system in line with its legislated m<strong>and</strong>ate <strong>and</strong> has begun discussions<br />
with <strong>National</strong> <strong>Treasury</strong> regarding a feasibility study for a new building. The pre-feasibility study has been<br />
completed. Funding of R25 million in 2011/12, R50 million in 2013/14 <strong>and</strong> R100 million in 2014/15 has been<br />
allocated for new equipment <strong>and</strong> to fund the feasibility study.<br />
8
<strong>Vote</strong> <strong>36</strong>: <strong>Trade</strong> <strong>and</strong> <strong>Industry</strong><br />
Small project<br />
The Richards Bay industrial development zone is located in KwaZulu-Natal. The industrial development<br />
zone is in the process of developing infrastructure to attract investors. Its key strategic industrial clusters include<br />
aluminium clustering, <strong>and</strong> wood, chemicals, <strong>and</strong> mineral beneficiation. The industrial development zone has in<br />
2009/10 <strong>and</strong> 2010/11 attracted investments worth R650 million from Tata Steel. Three investors have moved on<br />
site <strong>and</strong> another four worth R800 million are set to be secured. This has the potential to create 700 jobs over the<br />
medium term. The industrial development zone received R60.7 million in 2011/12, <strong>and</strong> has been allocated<br />
R42 million in 2012/13 <strong>and</strong> R30 million in 2013/14.<br />
Personnel information<br />
Table <strong>36</strong>.3 Details of approved establishment <strong>and</strong> personnel numbers according to salary level 1<br />
Personnel post status as at 30 September 2011 Number of personnel posts filled / planned for on funded establishment<br />
Number of<br />
posts on<br />
approved<br />
establishment<br />
Number of<br />
funded<br />
posts<br />
Number of posts<br />
additional to the<br />
establishment Actual Mid-year 2 Medium-term estimate<br />
2008/09 2009/10 2010/11 2011/12 2012/13 2013/14 2014/15<br />
Department 1 298 1 298 104 1 006 1 140 1 150 1 264 1 441 1 441 1 441<br />
Salary level 1 – 6 117 117 88 157 207 207 190 212 212 212<br />
Salary level 7 – 10 592 592 13 448 495 504 562 635 635 635<br />
Salary level 11 – 12 <strong>36</strong>5 <strong>36</strong>5 3 225 271 270 310 <strong>36</strong>0 <strong>36</strong>0 <strong>36</strong>0<br />
Salary level 13 – 16 224 224 – 176 167 169 202 234 234 234<br />
Administration 394 394 48 372 400 410 480 526 526 526<br />
Salary level 1 – 6 79 79 38 132 135 135 124 134 134 134<br />
Salary level 7 – 10 157 157 7 135 144 153 193 215 215 215<br />
Salary level 11 – 12 112 112 3 65 83 82 107 117 117 117<br />
Salary level 13 – 16 46 46 – 39 38 40 56 60 60 60<br />
International <strong>Trade</strong><br />
<strong>and</strong> Economic<br />
Development<br />
158 158 1 106 111 111 133 152 152 152<br />
Salary level 1 – 6 2 2 1 1 3 3 1 1 1 1<br />
Salary level 7 – 10 72 72 – 38 51 51 60 68 68 68<br />
Salary level 11 – 12 48 48 – <strong>36</strong> 28 28 40 48 48 48<br />
Salary level 13 – 16 <strong>36</strong> <strong>36</strong> – 31 29 29 32 35 35 35<br />
Broadening<br />
Participation<br />
108 108 6 74 86 86 105 121 121 121<br />
Salary level 1 – 6 1 1 6 2 4 4 4 9 9 9<br />
Salary level 7 – 10 46 46 – <strong>36</strong> 34 34 41 46 46 46<br />
Salary level 11 – 12 29 29 – 13 22 22 29 33 33 33<br />
Salary level 13 – 16 32 32 – 22 26 26 31 33 33 33<br />
Industrial<br />
Development: Policy<br />
Development<br />
148 148 14 106 107 107 124 158 158 158<br />
Salary level 1 – 6 1 1 10 4 11 11 7 7 7 7<br />
Salary level 7 – 10 56 56 4 48 39 39 46 61 61 61<br />
Salary level 11 – 12 45 45 – 27 29 29 35 44 44 44<br />
Salary level 13 – 16 46 46 – 28 28 28 <strong>36</strong> 46 46 46<br />
Consumer <strong>and</strong><br />
Corporate Regulation<br />
116 116 4 90 96 96 55 64 64 64<br />
Salary level 1 – 6 1 1 4 4 5 5 2 3 3 3<br />
Salary level 7 – 10 56 56 – 40 47 47 26 29 29 29<br />
Salary level 11 – 12 29 29 – 29 27 27 13 16 16 16<br />
Salary level 13 – 16 30 30 – 17 17 17 14 16 16 16<br />
9
2012 Estimates of <strong>National</strong> Expenditure<br />
Table <strong>36</strong>.3 Detail of approved establishment <strong>and</strong> personnel numbers according to salary level 1 (continued)<br />
Industrial<br />
Development:<br />
Incentive<br />
Administration<br />
10<br />
Personnel post status as at 30 September 2011 Number of personnel posts filled / planned for on funded establishment<br />
Number of<br />
posts on<br />
approved<br />
establishment<br />
Number of<br />
funded<br />
posts<br />
Number of posts<br />
additional to the<br />
establishment Actual Mid-year2 Medium-term estimate<br />
2008/09 2009/10 2010/11 2011/12 2012/13 2013/14 2014/15<br />
241 241 12 161 214 214 227 258 258 258<br />
Salary level 1 – 6 16 16 12 6 22 22 23 25 25 25<br />
Salary level 7 – 10 153 153 – 109 133 133 139 152 152 152<br />
Salary level 11 – 12 51 51 – 24 41 41 45 52 52 52<br />
Salary level 13 – 16 21 21 – 22 18 18 20 29 29 29<br />
<strong>Trade</strong> <strong>and</strong> Investment<br />
South Africa<br />
133 133 19 96 126 126 140 162 162 162<br />
Salary level 1 – 6 17 17 17 8 27 27 29 33 33 33<br />
Salary level 7 – 10 52 52 2 41 47 47 57 64 64 64<br />
Salary level 11 – 12 51 51 – 31 41 41 41 50 50 50<br />
Salary level 13 – 16 13 13 – 16 11 11 13 15 15 15<br />
1. Data has been provided by the department <strong>and</strong> may not necessarily reconcile with official government personnel data.<br />
2. As at 30 September 2011.<br />
Between 2009/10 <strong>and</strong> 2010/11, the approved establishment increased from 1 140 to 1 150 posts. Of these, 198<br />
were vacant as at 31 March 2011. It is expected that filled posts will increase to 1 441 in 2012/13 <strong>and</strong> stay<br />
constant until 2014/15. The ratio of support staff to line staff is 2.1. The percentage of consultants used in<br />
relation to the total number of personnel is 9.1 per cent. Between 2008/09 <strong>and</strong> 2014/15, the number of posts<br />
increased by 435 posts, due to the implementation of the industrial policy action plan, the refocusing of gender<br />
issues <strong>and</strong> cooperatives; participation in the Brazil-Russia-India-China-South Africa group of countries<br />
partnership; refocusing marketing needs <strong>and</strong> strengthening governance of the department’s public entities;<br />
investment <strong>and</strong> export promotion; capacity building in ICT, as well as the provision for the administration of<br />
new incentive schemes.<br />
Departmental receipts<br />
Table <strong>36</strong>.4 Receipts<br />
Adjusted Revised<br />
Audited outcome<br />
estimate estimate Medium-term receipts estimate<br />
R thous<strong>and</strong> 2008/09 2009/10 2010/11 2011/12 2012/13 2013/14 2014/15<br />
Departmental receipts 64 931 52 570 35 630 116 921 43 021 47 321 48 804 51 380<br />
Tax receipts 3 064 3 008 3 161 3 900 2 555 5 000 5 200 5 300<br />
Sales of goods <strong>and</strong> services produced by<br />
department<br />
– – 213 275 260 320 335 357<br />
Sales by market establishments – – 213 100 100 120 125 127<br />
of which:<br />
Rental of parking – – 213 100 100 120 125 127<br />
Other sales – – – 175 160 200 210 230<br />
of which:<br />
Commission on insurance <strong>and</strong> garnishee orders – – – 175 160 200 210 230<br />
Sales of scrap, waste, arms <strong>and</strong> other used<br />
current goods<br />
of which:<br />
– – – – 1 1 1 1<br />
Waste paper: Recycling of paper - Mondi – – – – 1 1 1 1<br />
Fines, penalties <strong>and</strong> forfeits – – 14 150 – – – –<br />
Interest, dividends <strong>and</strong> rent on l<strong>and</strong> 1 912 1 950 513 20 596 200 25 000 25 032 26 000<br />
Interest 1 912 1 950 513 20 596 200 25 000 25 032 26 000<br />
Sales of capital assets 110 2 93 – 5 – – 200<br />
Transactions in financial assets <strong>and</strong><br />
liabilities<br />
59 845 47 610 31 6<strong>36</strong> 92 000 40 000 17 000 18 2<strong>36</strong> 19 522<br />
Total 64 931 52 570 35 630 116 921 43 021 47 321 48 804 51 380
<strong>Vote</strong> <strong>36</strong>: <strong>Trade</strong> <strong>and</strong> <strong>Industry</strong><br />
Revenue is mainly generated from financial transactions in assets <strong>and</strong> liabilities, including recovered debts,<br />
interest from debts <strong>and</strong> bank deposits, cash receipts for senior management parking, recycling of papers, <strong>and</strong><br />
liquor licences. Receipts decreased from R64.9 million in 2008/09 to R43 million in 2011/12, at an average<br />
annual rate of 12.8 per cent, <strong>and</strong> are expected to increase to R51.4 million in 2014/15, at an average annual rate<br />
of 6.1 per cent. The adjustment to departmental receipts in 2011/12, down to R43 million, is mainly attributable<br />
to a lowering of the amount anticipated in respect of interest.<br />
Programme 1: Administration<br />
The former Communication <strong>and</strong> Marketing programme has been shifted to this programme under the two new<br />
subprogrammes, Media Relations <strong>and</strong> Public Relations <strong>and</strong> Communications to better align the department’s<br />
activities <strong>and</strong> programmes.<br />
Expenditure estimates<br />
Table <strong>36</strong>.5 Administration<br />
Subprogramme<br />
Audited outcome<br />
Adjusted<br />
appropriation Medium-term expenditure estimate<br />
R thous<strong>and</strong> 2008/09 2009/10 2010/11 2011/12 2012/13 2013/14 2014/15<br />
Ministry 29 910 27 561 30 031 40 357 37 358 39 407 41 783<br />
Office of the Director General 33 788 39 866 49 641 81 348 87 030 83 263 94 870<br />
Corporate Services 245 552 293 006 313 247 408 157 354 509 376 238 402 530<br />
Office Accommodation 6 462 7 110 7 821 8 292 8 708 9 187 9 738<br />
Financial Management 29 885 32 568 35 075 41 691 44 892 93 477 76 161<br />
Media Relations <strong>and</strong> Public Relations 22 613 3 490 4 622 7 560 10 984 14 089 18 283<br />
Communications 53 511 39 602 39 552 71 881 65 261 74 812 78 848<br />
Total 421 721 443 203 479 989 659 286 608 742 690 473 722 213<br />
Change to 2011 Budget estimate 115 575 25 242 42 877 35 761<br />
Economic classification<br />
Current payments 403 292 419 531 464 233 615 896 597 405 681 847 713 772<br />
Compensation of employees 103 888 122 114 152 021 198 973 224 904 275 053 273 183<br />
Goods <strong>and</strong> services<br />
of which:<br />
299 404 297 417 311 937 416 923 372 501 406 794 440 589<br />
Administrative fees 2 268 3 222 2 281 5 206 4 807 2 919 3 138<br />
Advertising 18 191 12 277 10 833 28 060 24 517 31 874 33 701<br />
Assets less than the capitalisation<br />
threshold<br />
1 526 551 <strong>36</strong>9 597 443 446 486<br />
Audit cost: External 4 751 7 639 8 641 7 787 5 257 9 875 8 348<br />
Bursaries: Employees 130 1 078 1 353 2 485 1 424 1 477 1 566<br />
Catering: Departmental activities 2 052 974 1 235 3 264 2 510 2 651 2 810<br />
Communication 10 473 14 412 7 100 7 466 12 156 14 833 16 284<br />
Computer services 9 167 13 457 12 276 16 938 16 987 16 333 17 298<br />
Consultants <strong>and</strong> professional services:<br />
Business <strong>and</strong> advisory services<br />
20 639 12 888 14 627 38 165 <strong>36</strong> 538 30 564 37 127<br />
Consultants <strong>and</strong> professional services:<br />
Infrastructure <strong>and</strong> planning<br />
114 43 – – – – –<br />
Consultants <strong>and</strong> professional services:<br />
Legal costs<br />
6 472 2 675 5 541 1 876 1 745 1 627 1 725<br />
Contractors 14 515 5 506 4 982 8 057 10 529 11 181 12 655<br />
Agency <strong>and</strong> support / outsourced<br />
services<br />
1 300 4 776 2 800 4 012 2 999 719 761<br />
Entertainment 39 29 16 255 3 595 3 614 3 832<br />
Fleet services (including government<br />
motor transport)<br />
– – 43 111 215 <strong>36</strong>6 399<br />
Inventory: Fuel, oil <strong>and</strong> gas – – – 95 210 261 276<br />
Inventory: Learner <strong>and</strong> teacher support<br />
material<br />
63 – 90 – – – –<br />
11
2012 Estimates of <strong>National</strong> Expenditure<br />
Table <strong>36</strong>.5 Administration (continued)<br />
Audited outcome<br />
Adjusted<br />
appropriation Medium-term expenditure estimate<br />
R thous<strong>and</strong> 2008/09 2009/10 2010/11 2011/12 2012/13 2013/14 2014/15<br />
Economic classification<br />
Inventory: Materials <strong>and</strong> supplies 23 114 537 200 550 620 667<br />
Inventory: Medicine – – 55 – – – –<br />
Inventory: Other consumables 23 176 298 176 73 247 103<br />
Inventory: Stationery <strong>and</strong> printing 3 673 5 145 7 579 8 923 5 459 6 088 6 535<br />
Lease payments 146 646 165 847 175 304 191 204 161 681 179 287 190 981<br />
Property payments 6 952 13 441 15 431 33 291 22 624 23 666 23 976<br />
Travel <strong>and</strong> subsistence 22 688 13 905 17 173 24 347 26 521 28 402 34 290<br />
Training <strong>and</strong> development 2 330 8 921 8 717 12 743 13 901 13 539 14 031<br />
Operating expenditure 9 621 4 840 8 084 10 997 8 347 13 386 16 211<br />
Venues <strong>and</strong> facilities 15 748 5 501 6 572 10 668 9 413 12 819 13 389<br />
Interest <strong>and</strong> rent on l<strong>and</strong> – – 275 – – – –<br />
Transfers <strong>and</strong> subsidies 1 834 2 751 3 549 4 862 1 927 2 186 2 317<br />
Public corporations <strong>and</strong> private<br />
enterprises<br />
523 596 2 600 4 630 650 686 727<br />
Households 1 311 2 155 949 232 1 277 1 500 1 590<br />
Payments for capital assets 14 615 18 319 9 923 38 528 9 410 6 440 6 124<br />
Machinery <strong>and</strong> equipment 11 210 16 603 7 653 19 929 6 722 6 241 5 913<br />
Software <strong>and</strong> other intangible assets 3 405 1 716 2 270 18 599 2 688 199 211<br />
Payments for financial assets 1 980 2 602 2 284 – – – –<br />
Total 421 721 443 203 479 989 659 286 608 742 690 473 722 213<br />
Details of transfers <strong>and</strong> subsidies<br />
Households<br />
Social benefits<br />
Current 1 275 1 804 805 181 1 277 1 500 1 590<br />
Gifts, donations <strong>and</strong> sponsorships 257 214 246 – – – –<br />
Employee social benefits – 777 – – – – –<br />
Bursaries non-employees 1 018 813 559 181 1 277 1 500 1 590<br />
Households<br />
Other transfers to households<br />
Current <strong>36</strong> 351 144 51 – – –<br />
Gifts, donations <strong>and</strong> sponsorships <strong>36</strong> 351 144 – – – –<br />
Employee social benefits – – – 51 – – –<br />
Public corporations <strong>and</strong> private enterprises<br />
Public corporations<br />
Other transfers to public<br />
corporations<br />
Current 523 596 2 600 4 630 650 686 727<br />
Industrial Development Corporation:<br />
Fund for research into industrial<br />
development, growth <strong>and</strong> equity<br />
523 596 2 600 4 630 650 686 727<br />
Expenditure trends<br />
Expenditure increased from R421.7 million in 2008/09 to R659.3 million in 2011/12, at an average annual rate<br />
of 16.1 per cent <strong>and</strong> is expected to increase to R722.2 million in 2014/15, at an average annual rate of<br />
3.1 per cent. The increases in both periods are mainly due to organisational development, increasing staff<br />
capacity <strong>and</strong> the re-engineering of the department’s processes.<br />
The largest allocation goes to the Corporate Services subprogramme, which accounts for on average<br />
60.3 per cent of the programme’s total budget over the seven-year period. Expenditure in this subprogramme<br />
increased from R245.6 million in 2008/09 to R408.2 million in 2011/12, at an average rate of 18.5 per cent, <strong>and</strong><br />
12
<strong>Vote</strong> <strong>36</strong>: <strong>Trade</strong> <strong>and</strong> <strong>Industry</strong><br />
is expected to decrease to R402.5 million over the medium term, at an average annual rate of 0.5 per cent. The<br />
main cost drivers are compensation of employees <strong>and</strong> goods <strong>and</strong> services, such as advertising costs, consultants<br />
<strong>and</strong> professional services, <strong>and</strong> lease payments.<br />
As the activities of the Communication <strong>and</strong> Marketing programme will be incorporated into this programme<br />
over the MTEF period, funding will be directed at increased coverage <strong>and</strong> promotion of the department’s<br />
activities <strong>and</strong> services offered, <strong>and</strong> extensive coverage of international missions in both domestic <strong>and</strong><br />
international media.<br />
Programme 2: International <strong>Trade</strong> <strong>and</strong> Economic Development<br />
Objectives <strong>and</strong> measures<br />
• Promote African economic integration <strong>and</strong> development at the bilateral, regional <strong>and</strong> continental levels by<br />
• consolidating the Southern African Customs Union <strong>and</strong> SADC free trade area <strong>and</strong> launching the SADC East<br />
Africa community common market by 2014.<br />
• Build mutually beneficial economic relations with key economies in order to advance South Africa’s trade,<br />
industrial policy <strong>and</strong> economic development objectives, through building mutually beneficial economic<br />
relations with key economies, by overcoming the tariff <strong>and</strong> non-tariff barriers that inhibit South African<br />
value added exports in key economies around the world by 2014.<br />
• Build national consensus around trade <strong>and</strong> investment policy, strategy <strong>and</strong> negotiation by strengthening<br />
research <strong>and</strong> national consultation as a basis for agreed national policy positions by 2014.<br />
Subprogrammes<br />
• International <strong>Trade</strong> Development facilitates bilateral <strong>and</strong> multilateral trade relations <strong>and</strong> agreements.<br />
Transfer payments are made to: the Organisation for the Prohibition of Chemical Weapons, as South<br />
Africa’s contribution to the convention against the use of chemical weapons; ProTechnik Laboratories, as<br />
South Africa’s contribution to international non-proliferation treaties <strong>and</strong> regimes; <strong>and</strong> the World <strong>Trade</strong><br />
Organisation, as South Africa’s membership fee. Total transfers in this subprogramme in 2010/11 amounted<br />
to R14 million for international membership fees, which is 9.7 per cent of the total programme budget. This<br />
subprogramme had a staff complement of 91 <strong>and</strong> a total budget of R75.1 million in 2011/12, of which<br />
55.9 per cent was used for compensation of employees.<br />
• African Economic Development facilitates bilateral <strong>and</strong> multilateral African trade relations aimed at<br />
deepening regional integration. Transfer payments are made to the Development Bank of Southern Africa<br />
for regional spatial development initiatives, aimed at accelerating sustainable socioeconomic development.<br />
This subprogramme had a staff complement of 62 <strong>and</strong> a total budget of R69.7 million in 2011/12, of which<br />
32 per cent was used for compensation of employees. Total transfers in this subprogramme in 2010/11<br />
amounted to R17.5 million, which is 12 per cent of the total programme budget.<br />
Expenditure estimates<br />
Table <strong>36</strong>.6 International <strong>Trade</strong> <strong>and</strong> Economic Development<br />
Subprogramme<br />
Audited outcome<br />
Adjusted<br />
appropriation Medium-term expenditure estimate<br />
R thous<strong>and</strong> 2008/09 2009/10 2010/11 2011/12 2012/13 2013/14 2014/15<br />
International <strong>Trade</strong> Development 68 832 80 159 63 595 75 063 82 406 84 344 91 882<br />
African Economic Development 39 741 42 839 43 354 69 742 51 056 53 460 57 969<br />
Total 108 573 122 998 106 949 144 805 133 462 137 804 149 851<br />
Change to 2011 Budget estimate 15 126 867 (2 130) 1 521<br />
13
2012 Estimates of <strong>National</strong> Expenditure<br />
Table <strong>36</strong>.6 International <strong>Trade</strong> <strong>and</strong> Economic Development (continued)<br />
Audited outcome<br />
Adjusted<br />
appropriation Medium-term expenditure estimate<br />
R thous<strong>and</strong> 2008/09 2009/10 2010/11 2011/12 2012/13 2013/14 2014/15<br />
Economic classification<br />
Current payments 80 187 88 831 75 772 111 855 97 762 101 019 109 502<br />
Compensation of employees 40 306 47 201 53 459 64 622 74 510 76 416 81 046<br />
Goods <strong>and</strong> services<br />
of which:<br />
39 881 41 630 22 313 47 233 23 252 24 603 28 456<br />
Administrative fees 100 48 1 2 20 20 21<br />
Advertising 265 212 208 600 – – –<br />
Assets less than the capitalisation<br />
threshold<br />
46 – 15 100 40 40 42<br />
Bursaries: Employees 74 – – – – – –<br />
Catering: Departmental activities 212 172 83 464 520 520 551<br />
Communication 1 069 992 876 1 079 1 055 1 055 1 119<br />
Computer services – 14 – – – – –<br />
Consultants <strong>and</strong> professional services:<br />
Business <strong>and</strong> advisory services<br />
582 1 300 894 1 399 1 000 1 100 1 166<br />
Consultants <strong>and</strong> professional services:<br />
Legal costs<br />
15 325 20 567 3 773 1 000 500 500 530<br />
Contractors 45 92 81 911 100 50 53<br />
Agency <strong>and</strong> support / outsourced<br />
services<br />
8 10 58 25 – – –<br />
Entertainment – 5 8 85 96 96 102<br />
Fleet services (including government<br />
motor transport)<br />
– – 1 5 – – –<br />
Inventory: Materials <strong>and</strong> supplies – – 1 – – – –<br />
Inventory: Other consumables – 63 2 – 4 4 4<br />
Inventory: Stationery <strong>and</strong> printing 473 925 424 798 796 796 844<br />
Lease payments – 63 77 49 – – –<br />
Property payments – – 30 16 4 4 4<br />
Travel <strong>and</strong> subsistence 18 <strong>36</strong>1 15 573 14 645 28 953 17 616 18 597 23 398<br />
Training <strong>and</strong> development 49 – – – – – –<br />
Operating expenditure 225 155 144 401 221 237 251<br />
Venues <strong>and</strong> facilities 3 047 1 439 992 11 346 1 280 1 584 371<br />
Transfers <strong>and</strong> subsidies 27 994 33 594 30 6<strong>36</strong> 32 450 35 400 <strong>36</strong> 435 39 588<br />
Foreign governments <strong>and</strong> international<br />
organisations<br />
10 639 10 312 10 832 11 600 13 500 14 243 15 097<br />
Public corporations <strong>and</strong> private<br />
enterprises<br />
17 110 23 282 19 747 20 850 21 900 22 192 24 491<br />
Households 245 – 57 – – – –<br />
Payments for capital assets <strong>36</strong>4 573 541 500 300 350 761<br />
Machinery <strong>and</strong> equipment <strong>36</strong>4 573 541 500 300 350 726<br />
Software <strong>and</strong> other intangible assets – – – – – – 35<br />
Payments for financial assets 28 – – – – – –<br />
Total 108 573 122 998 106 949 144 805 133 462 137 804 149 851<br />
Details of transfers <strong>and</strong> subsidies<br />
Foreign governments <strong>and</strong> international organisations<br />
Current 10 639 10 312 10 832 11 600 13 500 14 243 15 097<br />
Organisation for the prohibition of<br />
chemical weapons<br />
2 300 2 596 2 312 3 000 4 000 4 220 4 473<br />
World <strong>Trade</strong> Organisation 8 339 7 716 8 520 8 600 9 500 10 023 10 624<br />
14
Table <strong>36</strong>.6 International <strong>Trade</strong> <strong>and</strong> Economic Development<br />
<strong>Vote</strong> <strong>36</strong>: <strong>Trade</strong> <strong>and</strong> <strong>Industry</strong><br />
Audited outcome<br />
Adjusted<br />
appropriation Medium-term expenditure estimate<br />
R thous<strong>and</strong> 2008/09 2009/10 2010/11 2011/12 2012/13 2013/14 2014/15<br />
Details of transfers <strong>and</strong> subsidies<br />
Households<br />
Social benefits<br />
Current 245 – 57 – – – –<br />
Employee social benefits<br />
Public corporations <strong>and</strong> private enterprises<br />
Public corporations<br />
Other transfers to public<br />
corporations<br />
245 – 57 – – – –<br />
Current 16 849 18 001 18 747 19 850 20 900 21 137 23 373<br />
Protechnik Laboratories 1 621 2 130 2 247 2 350 2 400 2 532 2 684<br />
Development Bank of Southern Africa:<br />
15 228 15 871 16 500 17 500 18 500 18 605 20 689<br />
Regional spatial development initiatives<br />
Capital 261 5 281 1 000 1 000 1 000 1 055 1 118<br />
Protechnik Laboratories 261 5 281 1 000 1 000 1 000 1 055 1 118<br />
Expenditure trends<br />
Expenditure increased from R108.6 million in 2008/09 to R144.8 million in 2011/12, at an average annual rate<br />
of 10.1 per cent, mainly as a result of increased spending on goods <strong>and</strong> services, due to international legal<br />
proceedings, <strong>and</strong> compensation of employees, due to exp<strong>and</strong>ed capacity. These two items combined increased<br />
current payments from R80.2 million in 2008/09 to R111.9 million in 2011/12, at an average annual rate of<br />
11.7 per cent.<br />
Over the medium term, expenditure is expected to increase to R149.9 million, at an average annual rate of<br />
1.1 per cent. The 26.8 per cent decrease in expenditure in the African Economic Development subprogramme in<br />
2012/13 is because there will be no Tripartite Summit of the Common Market for East <strong>and</strong> Southern Africa, the<br />
East African Community <strong>and</strong> the Southern Africa Development Community in that year, as it was held in<br />
2011/12.<br />
Allocations to this programme over the seven-year period are used to implement the trade policy <strong>and</strong> strategy<br />
framework, <strong>and</strong> the policy framework on bilateral investment treaties that were implemented in 2011. The<br />
allocations also allow the department to provide the economic content for state visits to foreign countries, to<br />
increase South Africa’s value added exports, <strong>and</strong> encourage investments in South Africa. As chair of the<br />
Southern African Customs Union, South Africa, through the interventions of this programme, has assisted in<br />
forging a consensus on a focused work programme on industrialisation, infrastructure development, trade<br />
facilitation, revenue sharing <strong>and</strong> a unified engagement in trade negotiations for the region.<br />
Programme 3: Broadening Participation<br />
Objectives <strong>and</strong> measures<br />
• Foster the growth of small medium <strong>and</strong> micro enterprises (SMMEs ) <strong>and</strong> cooperatives by:<br />
– facilitating the provision of business development support to increase the current number of SMMEs<br />
(estimated at 5 million <strong>and</strong> increasing to 8 million) <strong>and</strong> contributions to GDP, from 2010/11 (estimated at<br />
40 per cent to 45 per cent) by 2014<br />
– assisting in the establishment of 300 small scale cooperatives to contribute to cooperative growth,<br />
employment creation <strong>and</strong> poverty reduction over the next 3 years, resulting in 1 500 new jobs or<br />
memberships<br />
– facilitating access to procurement opportunities for SMMEs <strong>and</strong> cooperatives to increase the share of<br />
SMMEs <strong>and</strong> cooperatives in government’s <strong>and</strong> state owned companies’ procurement by 2014/15<br />
– integrating entrepreneurship into the curriculum <strong>and</strong> research activities of 4 universities <strong>and</strong> 2 further<br />
education <strong>and</strong> training colleges over the MTEF period<br />
– strengthening <strong>and</strong> up scaling the incubator programme to generate 600 new enterprises with 5 000 jobs by<br />
2014<br />
15
2012 Estimates of <strong>National</strong> Expenditure<br />
16<br />
– aligning broad based black economic empowerment with industrial policy, to facilitate increased<br />
participation by blacks <strong>and</strong> by women in priority sectors by 2013<br />
– supporting 60 innovative projects with at least 6 000 students participating in the development of new<br />
technologies over the MTEF period<br />
– supporting the development of at least 3 underdeveloped municipal district areas through targeted<br />
interventions by 2014<br />
– improving the competitiveness of at least 120 companies through the workplace challenge programme by<br />
2013.<br />
Subprogrammes<br />
• Enterprise Development creates an enabling environment that is conducive to the development <strong>and</strong> growth<br />
SMMEs <strong>and</strong> cooperative enterprises, <strong>and</strong> provides a broad range of business development support services.<br />
Transfer payments are made to the Small Enterprise Development Agency, which provides non-financial<br />
business development <strong>and</strong> support services for small enterprises. This subprogramme had a staff<br />
complement of 31 <strong>and</strong> a total budget of R439.7 million in 2011/12, the bulk of which was spent on the<br />
transfer to the Small Enterprise Development Agency.<br />
• Equity <strong>and</strong> Empowerment promotes BEE <strong>and</strong> women’s empowerment. Transfer payments are made to: the<br />
South African Women Entrepreneurs’ Network (R7.7 million in 2011/12), currently administered by Khula<br />
Enterprise Finance, which supports <strong>and</strong> grows women’s entrepreneurship through networking facilities; <strong>and</strong><br />
the Industrial Development Corporation’s Isiv<strong>and</strong>e Women’s Fund (R10.7 million in 2011/12), which<br />
provides financial support for women entrepreneurs to grow their businesses. This subprogramme had a<br />
staff complement of 26 <strong>and</strong> a total budget of R41.4 million, the bulk of which was spent on transfer<br />
payments to organisations.<br />
• Regional Economic Development promotes spatially balanced economic development <strong>and</strong> productivity<br />
improvements by crafting policies, strategies <strong>and</strong> programmes that focus on underdeveloped regions.<br />
Transfer payments are made to: the <strong>National</strong> Research Foundation’s technology <strong>and</strong> human resources for<br />
industry programme (R155 million in 2011/12), which supports research <strong>and</strong> technology development by<br />
strengthening the number <strong>and</strong> skills of appropriately trained people; Productivity South Africa’s Workplace<br />
Challenge programme (R8 million in 2011/12) , which finances <strong>and</strong> supports world class manufacturing <strong>and</strong><br />
value chain efficiency improvements in South African companies; the Industrial Development<br />
Corporation’s support programme for industrial innovation (R59.8 million in 2011/12), which enables<br />
private sector enterprises to develop new products <strong>and</strong> services; the Small Enterprise Development Agency<br />
technology programme (R120 million in 2011/12), which finances <strong>and</strong> supports early, seed <strong>and</strong> start up<br />
technology ventures aimed at increasing South Africa’s competitiveness through technology incubation,<br />
technology transfer <strong>and</strong> quality services; <strong>and</strong> the Wits Business School’s Centre for Entrepreneurship,<br />
which combines technical graduate training <strong>and</strong> entrepreneurialism in the higher education curriculum, thus<br />
empowering emerging entrepreneurs <strong>and</strong> unemployed graduates. This subprogramme had a staff<br />
complement of 62 <strong>and</strong> a total budget of R384.6 million in 2011/12, the bulk of which was spent on transfer<br />
payments.<br />
Expenditure estimates<br />
Table <strong>36</strong>.7 Broadening Participation<br />
Subprogramme<br />
Audited outcome<br />
Adjusted<br />
appropriation Medium-term expenditure estimate<br />
R thous<strong>and</strong> 2008/09 2009/10 2010/11 2011/12 2012/13 2013/14 2014/15<br />
Enterprise Development 431 596 348 848 419 170 439 700 454 1<strong>36</strong> 478 658 506 819<br />
Equity <strong>and</strong> Empowerment 353 858 461 601 39 547 41 421 43 094 45 331 48 059<br />
Regional Economic Development 279 673 350 152 339 <strong>36</strong>0 384 574 382 661 404 373 430 710<br />
Total 1 065 127 1 160 601 798 077 865 695 879 891 928 <strong>36</strong>2 985 588<br />
Change to 2011 Budget estimate 26 000 16 767 19 013 21 678
Table <strong>36</strong>.7 Broadening Participation (continued)<br />
<strong>Vote</strong> <strong>36</strong>: <strong>Trade</strong> <strong>and</strong> <strong>Industry</strong><br />
Audited outcome<br />
Adjusted<br />
appropriation Medium-term expenditure estimate<br />
R thous<strong>and</strong> 2008/09 2009/10 2010/11 2011/12 2012/13 2013/14 2014/15<br />
Economic classification<br />
Current payments 43 891 63 423 62 046 85 246 89 913 94 655 100 <strong>36</strong>8<br />
Compensation of employees 29 199 35 709 40 989 52 738 53 377 56 292 59 703<br />
Goods <strong>and</strong> services<br />
of which:<br />
14 692 27 714 21 057 32 508 <strong>36</strong> 5<strong>36</strong> 38 <strong>36</strong>3 40 665<br />
Administrative fees 130 422 160 101 155 154 163<br />
Advertising <strong>36</strong>3 848 869 184 109 115 122<br />
Assets less than the capitalisation<br />
threshold<br />
19 5 16 44 27 7 7<br />
Catering: Departmental activities 860 784 510 780 650 671 712<br />
Communication 166 277 337 390 457 460 487<br />
Computer services – – 647 – 50 – –<br />
Consultants <strong>and</strong> professional services:<br />
Business <strong>and</strong> advisory services<br />
3 789 10 572 6 470 12 126 14 756 17 156 18 186<br />
Consultants <strong>and</strong> professional services:<br />
Legal costs<br />
2 150 – 2 126 1 635 1 717 1 820<br />
Contractors 264 318 509 <strong>36</strong>7 557 585 620<br />
Agency <strong>and</strong> support / outsourced<br />
services<br />
73 3 043 419 2 100 485 595 631<br />
Entertainment 13 4 4 20 23 24 25<br />
Fleet services (including government<br />
motor transport)<br />
– – 4 9 – – –<br />
Inventory: Medical supplies – – – 1 – – –<br />
Inventory: Other consumables – 6 10 4 – – –<br />
Inventory: Stationery <strong>and</strong> printing 530 459 722 837 1 007 1 014 1 075<br />
Lease payments – 86 166 280 352 370 392<br />
Property payments – – 2 – – – –<br />
Travel <strong>and</strong> subsistence 5 450 8 0<strong>36</strong> 7 047 9 359 12 791 12 028 12 749<br />
Training <strong>and</strong> development 194 – 594 200 – – –<br />
Operating expenditure 717 359 620 313 438 460 488<br />
Venues <strong>and</strong> facilities 2 122 2 345 1 951 3 267 3 044 3 007 3 188<br />
Transfers <strong>and</strong> subsidies 1 021 156 1 096 766 735 528 779 632 789 398 833 127 884 605<br />
Departmental agencies <strong>and</strong> accounts 973 944 1 012 492 640 121 696 290 705 855 744 099 788 178<br />
Higher education institutions 2 000 11 500 – 1 10 001 12 831 15 748<br />
Public corporations <strong>and</strong> private<br />
enterprises<br />
39 137 65 060 85 000 75 491 65 642 67 862 71 844<br />
Non-profit institutions 6 075 7 597 10 300 7 700 7 900 8 335 8 835<br />
Households – 117 107 150 – – –<br />
Payments for capital assets 80 412 503 817 580 580 615<br />
Machinery <strong>and</strong> equipment 80 412 503 792 580 580 615<br />
Software <strong>and</strong> other intangible assets – – – 25 – – –<br />
Total 1 065 127 1 160 601 798 077 865 695 879 891 928 <strong>36</strong>2 985 588<br />
Details of transfers <strong>and</strong> subsidies<br />
Departmental agencies <strong>and</strong> accounts<br />
Departmental agencies (non-business entities)<br />
Current 661 012 700 850 640 121 696 290 705 855 744 099 788 178<br />
Small Enterprise Development Agency 413 631 331 177 401 621 413 290 427 655 450 598 477 067<br />
<strong>National</strong> Empowerment Fund – 116 000 – – – – –<br />
Small Enterprise Development Agency<br />
Technology Programme<br />
76 739 78 320 76 000 120 000 113 000 119 215 126 <strong>36</strong>8<br />
17
2012 Estimates of <strong>National</strong> Expenditure<br />
Table <strong>36</strong>.7 Broadening Participation (continued)<br />
Audited outcome<br />
Adjusted<br />
appropriation Medium-term expenditure estimate<br />
R thous<strong>and</strong> 2008/09 2009/10 2010/11 2011/12 2012/13 2013/14 2014/15<br />
Economic classification<br />
<strong>National</strong> Research Foundation:<br />
Technology <strong>and</strong> human resources for<br />
industry programme.<br />
161 982 163 823 151 000 155 000 157 000 165 635 175 573<br />
<strong>National</strong> Productivity Institute:<br />
Workplace Challenge<br />
8 660 11 530 11 500 8 000 8 200 8 651 9 170<br />
Capital 312 932 311 642 – – – – –<br />
<strong>National</strong> Empowerment Fund 312 932 311 642 – – – – –<br />
Non-profit institutions<br />
Current 6 075 7 597 10 300 7 700 7 900 8 335 8 835<br />
South African Women Entrepreneurs<br />
Network<br />
Households<br />
Social benefits<br />
6 075 7 597 10 300 7 700 7 900 8 335 8 835<br />
Current – 100 57 – – – –<br />
Bursaries: non-employees<br />
Households<br />
Other transfers to households<br />
– 100 57 – – – –<br />
Current – 17 50 150 – – –<br />
Gifts, donations <strong>and</strong> sponsorships – 17 50 150 – – –<br />
Public corporations <strong>and</strong> private enterprises<br />
Public corporations<br />
Other transfers to public<br />
corporations<br />
Current 19 000 9 930 10 500 10 700 10 900 11 500 12 190<br />
Industrial Development Corporation:<br />
Isiv<strong>and</strong>e Women's Fund<br />
19 000 9 930 10 500 10 700 10 900 11 500 12 190<br />
Capital 6 001 53 130 74 500 64 790 52 741 54 861 58 153<br />
Industrial Development Corporation:<br />
Support programme for industrial<br />
innovation<br />
– 47 661 74 500 59 789 52 740 54 860 58 152<br />
Industrial Development Corporation:<br />
Technology venture capital<br />
Higher education institutions<br />
6 001 5 469 – 5 001 1 1 1<br />
Current 2 000 11 500 – 1 10 001 12 831 15 748<br />
University of Johannesburg: Capacity<br />
building programme for economic<br />
development<br />
– 5 000 – – 10 000 12 830 15 747<br />
Wits Business School: Centre for<br />
entrepreneurship<br />
Public corporations <strong>and</strong> private enterprises<br />
2 000 6 500 – 1 1 1 1<br />
Public corporations<br />
Public corporations - subsidies on products <strong>and</strong> production<br />
Current 14 1<strong>36</strong> 2 000 – 1 2 001 1 501 1 501<br />
Council for Scientific <strong>and</strong> Industrial<br />
Research: Fibre <strong>and</strong> Textile Centre of<br />
Excellence<br />
South African Bureau of St<strong>and</strong>ards:<br />
<strong>Trade</strong> Metrology<br />
Expenditure trends<br />
18<br />
3 000 2 000 – 1 2 001 1 501 1 501<br />
11 1<strong>36</strong> – – – – – –<br />
The bulk of this programme’s expenditure is on transfer payments, which are made to the Small Enterprise<br />
Development Agency <strong>and</strong> its technology programme, <strong>and</strong> the <strong>National</strong> Research Foundation for the technology<br />
for human resources for industry programme.<br />
Expenditure decreased from R1.1 billion in 2008/09 to R865.7 million in 2011/12, at an average annual rate of<br />
6.7 per cent, due to the discontinuation of transfer payments to the <strong>National</strong> Empowerment Fund in 2010/11.<br />
Expenditure is expected to increase to R985.6 million in 2014/15, at an average annual rate of 4.4 per cent, in<br />
line with inflation projections.
<strong>Vote</strong> <strong>36</strong>: <strong>Trade</strong> <strong>and</strong> <strong>Industry</strong><br />
R16.4 million in 2012/13, R18.9 million in 2013/14, <strong>and</strong> R20 million in 2014/15 is allocated for spending on<br />
consultants. Consultants are used mainly to assist with policy frameworks <strong>and</strong> strategy solutions for small<br />
enterprise development, such as cooperatives, <strong>and</strong> black economic empowerment.<br />
Over the seven-year period, allocations to this programme are used to support increasing the number of small<br />
enterprises <strong>and</strong> cooperatives. The operations of the SMME payment hotline centre provides a recourse<br />
mechanism for SMME service providers to receive payments from government departments within 30 days.<br />
Since the inception of the codes of good practice for broad based black economic empowerment in 2003, this<br />
programme focused on building capacity in <strong>and</strong> harmonising the verification industry, <strong>and</strong> setting st<strong>and</strong>ards for<br />
BEE verifications.<br />
Programme 4: Industrial Development: Policy Development<br />
Objectives <strong>and</strong> measures<br />
• Contribute to the direct <strong>and</strong> indirect creation of decent jobs, added value <strong>and</strong> competitiveness in both<br />
domestic <strong>and</strong> export markets by developing policies, strategies <strong>and</strong> programmes for the manufacturing<br />
sector <strong>and</strong> related sectors, through the three-year rolling industrial policy action plan. Implement the threeyear<br />
industrial policy action plan by 2013/14.<br />
• Ensure, through regulatory institutions including st<strong>and</strong>ards, quality assurance, accreditation <strong>and</strong> metrology<br />
institutions, that technical infrastructure policies <strong>and</strong> institutions support industrial policy.<br />
• Support industrial upgrading by:<br />
• facilitating the development of specific incentives schemes that support capital investment over the MTEF<br />
period<br />
• developing <strong>and</strong> implementing an industrial climate change response plan <strong>and</strong> cleaner production initiatives<br />
in at least 200 companies from 2010/11 to 2013/14.<br />
• Leverage the economic benefits <strong>and</strong> development support of South African industries through government<br />
procurement, thus creating or retaining 20 000 direct jobs by 2013.<br />
• Optimise the economic benefits <strong>and</strong> development support of government procurement, to promote industrial<br />
development <strong>and</strong> create or retain 20 000 direct jobs by 2013.<br />
• Respond to the growing imperatives of climate change <strong>and</strong> environmental concerns <strong>and</strong> opportunities<br />
through the promotion of green industries <strong>and</strong> resource efficiency in the economy, on an ongoing basis.<br />
• Leverage large public procurements to promote industrial development, through the reorientation of the<br />
national industrial participation programme <strong>and</strong> by actively engaging with the large fleet procurements of<br />
public entities over the MTEF period.<br />
Subprogrammes<br />
• Industrial Competitiveness develops policies, strategies <strong>and</strong> programmes to strengthen the ability of<br />
manufacturing <strong>and</strong> other value added sectors to create decent jobs <strong>and</strong> increase value addition <strong>and</strong><br />
competitiveness in domestic <strong>and</strong> export markets, as set out in the annual three-year rolling industrial policy<br />
action plan. Transfer payments are made to the South African Bureau of St<strong>and</strong>ards, the <strong>National</strong> Metrology<br />
Institute of South Africa, the <strong>National</strong> Regulator for Compulsory Specifications <strong>and</strong> the South African<br />
<strong>National</strong> Accreditation System. Funds have been reprioritised within the programme <strong>and</strong> no savings over<br />
the MTEF period have been identified.<br />
• Customised Sector Programmes develops <strong>and</strong> implements high impact sector strategies focused on<br />
manufacturing <strong>and</strong> other value added sectors to create decent jobs <strong>and</strong> increase value addition <strong>and</strong><br />
competitiveness in domestic <strong>and</strong> export markets, as set out in the annual three-year rolling industrial policy<br />
action plan. Transfer payments are made to: the Industrial Development Corporation’s customised sector<br />
programme, the Council for Scientific <strong>and</strong> Industrial Research’s aerospace industry programme, the Council<br />
for Scientific <strong>and</strong> Industrial Research’s national cleaner production centre, the Council for Scientific <strong>and</strong><br />
Industrial Research’s national foundry technology network, the Intsimbi national tooling initiative <strong>and</strong> the<br />
UN Industrial Development Organisation’s automotive component supplier development programme. The<br />
19
2012 Estimates of <strong>National</strong> Expenditure<br />
20<br />
subprogramme’s budget in 2011/12 was R806.4 million. Funds have been reprioritised within the<br />
programme <strong>and</strong> no savings over the MTEF period were identified.<br />
Expenditure estimates<br />
Table <strong>36</strong>.8 Industrial Development: Policy Development<br />
Subprogramme<br />
Audited outcome<br />
Adjusted<br />
appropriation Medium-term expenditure estimate<br />
R thous<strong>and</strong> 2008/09 2009/10 2010/11 2011/12 2012/13 2013/14 2014/15<br />
Industrial Competitiveness 303 737 323 629 538 952 504 660 500 196 537 696 615 895<br />
Customised Sector Programmes 115 003 101 841 606 177 806 387 982 660 998 177 1 057 283<br />
Total 418 740 425 470 1 145 129 1 311 047 1 482 856 1 535 873 1 673 178<br />
Change to 2011 Budget estimate 44 152 (4 338) 44 899 92 746<br />
Economic classification<br />
Current payments 89 030 62 385 69 794 96 272 105 915 111 927 118 830<br />
Compensation of employees 42 958 45 053 54 046 66 105 74 019 77 904 82 523<br />
Goods <strong>and</strong> services<br />
of which:<br />
46 072 17 332 15 748 30 167 31 896 34 023 <strong>36</strong> 307<br />
Administrative fees 395 217 30 311 200 220 240<br />
Advertising 1 988 328 584 – – – –<br />
Assets less than the capitalisation<br />
threshold<br />
44 9 15 108 70 72 80<br />
Bursaries: Employees 100 – – – – – –<br />
Catering: Departmental activities 182 196 311 415 390 400 439<br />
Communication 687 420 463 609 802 854 894<br />
Computer services – – 31 – 67 80 90<br />
Consultants <strong>and</strong> professional services:<br />
Business <strong>and</strong> advisory services<br />
11 870 6 386 3 <strong>36</strong>3 13 350 12 907 13 690 14 697<br />
Consultants <strong>and</strong> professional services:<br />
Legal costs<br />
57 56 – 220 – – –<br />
Contractors 719 78 15 350 100 100 117<br />
Agency <strong>and</strong> support / outsourced<br />
services<br />
– 118 203 202 170 176 187<br />
Entertainment 11 3 5 37 52 55 58<br />
Fleet services (including government<br />
motor transport)<br />
– – 2 2 – – –<br />
Inventory: Learner <strong>and</strong> teacher support<br />
material<br />
– – 1 – – – –<br />
Inventory: Materials <strong>and</strong> supplies – – – 3 10 10 11<br />
Inventory: Other consumables 2 2 9 23 30 30 33<br />
Inventory: Stationery <strong>and</strong> printing 790 647 765 1 163 1 288 1 378 1 481<br />
Lease payments 2 91 99 86 130 137 145<br />
Property payments – – 2 – – – –<br />
Travel <strong>and</strong> subsistence 18 813 7 270 7 399 9 927 11 122 11 894 12 544<br />
Training <strong>and</strong> development 228 – 6 – 20 27 32<br />
Operating expenditure 1 632 723 1 113 1 441 1 743 1 876 1 979<br />
Venues <strong>and</strong> facilities 8 552 788 1 332 1 920 2 795 3 024 3 280<br />
Transfers <strong>and</strong> subsidies 326 162 <strong>36</strong>2 792 1 074 809 1 213 731 1 376 221 1 423 321 1 553 687<br />
Departmental agencies <strong>and</strong> accounts 80 546 105 446 108 800 145 377 184 963 266 196 328 659<br />
Higher education institutions 8 500 4 000 14 793 3 503 3 3 3<br />
Foreign governments <strong>and</strong> international<br />
organisations<br />
10 545 8 069 12 096 14 152 7 200 7 475 7 792<br />
Public corporations <strong>and</strong> private<br />
enterprises<br />
223 247 245 277 938 903 1 050 694 1 184 055 1 149 647 1 217 233<br />
Households 3 324 – 217 5 – – –<br />
Payments for capital assets 3 548 293 526 1 044 720 625 661<br />
Machinery <strong>and</strong> equipment 730 293 526 1 044 720 625 661<br />
Software <strong>and</strong> other intangible assets 2 818 – – – – – –<br />
Total 418 740 425 470 1 145 129 1 311 047 1 482 856 1 535 873 1 673 178
Table <strong>36</strong>.8 Industrial Development: Policy Development (continued)<br />
<strong>Vote</strong> <strong>36</strong>: <strong>Trade</strong> <strong>and</strong> <strong>Industry</strong><br />
Audited outcome<br />
Adjusted<br />
appropriation Medium-term expenditure estimate<br />
R thous<strong>and</strong> 2008/09 2009/10 2010/11 2011/12 2012/13 2013/14 2014/15<br />
Details of transfers <strong>and</strong> subsidies<br />
Departmental agencies <strong>and</strong> accounts<br />
Departmental agencies (non-business entities)<br />
Current 80 546 105 446 108 800 120 377 184 963 216 196 228 659<br />
South African <strong>National</strong> Accreditation<br />
System<br />
13 750 14 707 18 239 20 623 30 327 32 615 34 560<br />
<strong>National</strong> Metrology Institute of South<br />
Africa<br />
54 999 54 806 57 519 62 581 76 521 84 438 89 545<br />
<strong>National</strong> Regulator for Compulsory<br />
Specifications<br />
11 797 35 933 33 042 37 173 78 115 99 143 104 554<br />
Capital – – – 25 000 – 50 000 100 000<br />
<strong>National</strong> Metrology Institute of South<br />
Africa: Infrastructure<br />
– – – 25 000 – 50 000 100 000<br />
Foreign governments <strong>and</strong> international organisations<br />
Current 10 545 8 069 12 096 14 152 7 200 7 475 7 792<br />
United Nations Industrial Development<br />
Organisation<br />
United Nations Industrial Development<br />
Organisation: Automotive component<br />
supplier development programme<br />
French Institute of South Africa: African<br />
programme on rethinking development<br />
economics<br />
Households<br />
Social benefits<br />
3 492 3 069 3 096 4 800 5 000 5 275 5 592<br />
4 553 5 000 7 000 7 152 – – –<br />
2 500 – 2 000 2 200 2 200 2 200 2 200<br />
Current – – 150 5 – – –<br />
Employee social benefits – – 150 5 – – –<br />
Households<br />
Other transfers to households<br />
Current 3 324 – 67 – – – –<br />
Gifts, donations <strong>and</strong> sponsorships 144 – 67 – – – –<br />
Technology for Women in Business:<br />
Sponsorship<br />
180 – – – – – –<br />
Umsobomvu Youth Fund: Sponsorship 3 000 – – – – – –<br />
Public corporations <strong>and</strong> private enterprises<br />
Public corporations<br />
Other transfers to public<br />
corporations<br />
Current 193 247 227 896 669 908 887 223 1 050 535 1 058 187 1 120 285<br />
Council for Mineral Technology <strong>and</strong><br />
Research: Customised sector<br />
programmes<br />
Industrial Development Corporation:<br />
Customised sector programmes<br />
Council for Scientific <strong>and</strong> Industrial<br />
Research: <strong>National</strong> cleaner production<br />
centre<br />
South African Bureau of St<strong>and</strong>ards:<br />
Research contribution<br />
South African Bureau of St<strong>and</strong>ards:<br />
Small business technical consulting<br />
Nuclear Energy Corporation of South<br />
Africa: Nuclear skills development<br />
Industrial Development Corporation:<br />
Clothing <strong>and</strong> textile production incentive<br />
Council for Scientific <strong>and</strong> Industrial<br />
Research: <strong>National</strong> Foundry<br />
Technology Network: Metals<br />
Council for Scientific <strong>and</strong> Industrial<br />
Research: Maritime industry project<br />
1 000 – 400 – – – –<br />
39 000 48 657 51 092 57 427 56 471 57 041 60 465<br />
9 800 18 966 32 000 40 141 41 225 41 678 44 179<br />
142 144 153 731 178 845 181 496 180 538 181 711 191 272<br />
1 303 1 201 1 071 1 158 1 300 1 312 1 381<br />
– 5 341 – – – – –<br />
– – 400 000 600 000 750 000 758 250 803 744<br />
– – 6 500 7 000 21 000 18 194 19 243<br />
– – – 1 1 1 1<br />
21
2012 Estimates of <strong>National</strong> Expenditure<br />
Table <strong>36</strong>.8 Industrial Development: Policy Development (continued)<br />
Audited outcome<br />
Adjusted<br />
appropriation Medium-term expenditure estimate<br />
R thous<strong>and</strong> 2008/09 2009/10 2010/11 2011/12 2012/13 2013/14 2014/15<br />
Details of transfers <strong>and</strong> subsidies<br />
Capital 10 000 9 931 184 141 117 471 69 352 21 226 22 500<br />
Council for Scientific <strong>and</strong> Industrial<br />
Research: Aerospace industry<br />
South African Bureau of St<strong>and</strong>ards:<br />
Upgrading of vehicle testing facility<br />
South African Bureau of St<strong>and</strong>ards:<br />
Infrastructure<br />
Public corporations <strong>and</strong> private enterprises<br />
Private enterprises<br />
Other transfers to private enterprises<br />
22<br />
10 000 9 931 9 901 17 291 21 352 21 226 22<br />
500<br />
– – – 7 000 – – –<br />
– – 174 240 93 180 48 000 – –<br />
Current 20 000 7 450 52 400 46 000 64 168 70 234 74 448<br />
Intsimbi <strong>National</strong> Tooling Initiative – 7 450 47 400 <strong>36</strong> 000 49 168 54 434 57 700<br />
Centurion Aerospace Village 20 000 – 5 000 10 000 15 000 15 800 16 748<br />
Capital – – 32 454 – – – –<br />
Centurion Aerospace Village – – 32 454 – – – –<br />
Higher education institutions<br />
Current 8 500 4 000 14 793 3 503 3 3 3<br />
University of the Witwatersr<strong>and</strong>:<br />
<strong>National</strong> aerospace skills sector support<br />
centre<br />
University of the North West: Advanced<br />
manufacturing skills sector support<br />
programme<br />
University of Pretoria: Advanced<br />
Engineering Centre of Excellence<br />
Expenditure trends<br />
3 000 4 000 9 000 1 1 1 1<br />
3 000 – 5 793 3 501 1 1 1<br />
2 500 – – 1 1 1 1<br />
Expenditure increased from R418.7 million in 2008/09 to R1.3 billion in 2011/12, at an average annual rate of<br />
46.3 per cent, mostly due to the introduction of the customised sector programmes, <strong>and</strong> the clothing <strong>and</strong> textile<br />
production incentive schemes, which are administered by the Industrial Development Corporation. As a result<br />
of the introduction of the programmes <strong>and</strong> schemes, transfer payments increased from R326.2 million in<br />
2008/09 to R1.2 billion in 2011/12, at an average annual rate of 55 per cent.<br />
Over the medium term, expenditure is expected to increase to R1.7 billion, at an average annual rate of<br />
8.5 per cent, as a result of the provision for the equipment <strong>and</strong> the feasibility study for a new building for the<br />
<strong>National</strong> Metrology Institute of South Africa. Of the R4.7 billion budget over the MTEF period, the production<br />
incentive for the clothing <strong>and</strong> textile industry receives 48.9 per cent (R2.3 billion). The clothing, textile,<br />
footwear <strong>and</strong> leather industry is labour intensive <strong>and</strong> employs approximately 260 000 people in total. Support<br />
for the industry is directly linked to the government priority of the creation of decent employment through<br />
inclusive economic growth (outcome 4).Expenditure in the Customised Sector Programmes subprogramme is<br />
expected to increase from R806.4 million in 2011/12 to R1.1 billion in 2014/15, at an average annual rate of<br />
9.5 per cent, due to additional funding provided to the Intsimbi national tooling initiative pre-apprenticeship<br />
programme. This programme supports the manufacturing sector, which, as a whole, contributes 18 per cent to<br />
GDP.<br />
Programme 5: Consumer <strong>and</strong> Corporate Regulation<br />
Objectives <strong>and</strong> measures<br />
• Increase access to economic opportunities for small businesses <strong>and</strong> historically disadvantaged citizens<br />
through enhancing business confidence <strong>and</strong> certainty of South African business regulation.<br />
• Align laws, policies <strong>and</strong> their implementation.<br />
• Review liquor legislation <strong>and</strong> conduct the liquor Impact assessment policy in 2012/13.
<strong>Vote</strong> <strong>36</strong>: <strong>Trade</strong> <strong>and</strong> <strong>Industry</strong><br />
• Review the <strong>National</strong> Credit Act (2005) <strong>and</strong> propose any amendments in 2012/13; publish regulations by<br />
2014/15.<br />
• Review the consumer protection legislation <strong>and</strong> assess the provisions on accreditation, exemptions <strong>and</strong><br />
compliance from 2011/12 until 2015/16.<br />
• Conduct market surveys, trends analyses <strong>and</strong> impact assessments annually.<br />
• Foster better regulatory practice by 2014/15.<br />
• Amend the Lotteries Act (1997) by the end of 2012/13.<br />
• Review the forthcoming report by the Gambling Commission <strong>and</strong> propose a gambling sector strategy by the<br />
end of 2012/13.<br />
• Draft the intellectual property law amendment regulations by the end of 2012/13.<br />
• Finalise the policy on intellectual property by the second quarter of 2012/13.<br />
• Review the recommendations by the consumer <strong>and</strong> corporate regulation project in 2012/13.<br />
• Undertake a business registration reform project in 2012/13.<br />
• Begin the regulatory impact assessment on all policies <strong>and</strong> bills with policy <strong>and</strong> legislation from 2011/12 to<br />
2015/16.<br />
• Increase investor confidence in South Africa by implementing an effective regulatory framework to reduce<br />
the burden on business.<br />
• Promote competitive, fair <strong>and</strong> efficient markets through business <strong>and</strong> consumer research.<br />
• Exchange regulatory experiences through participation in the World Intellectual Property Organisation <strong>and</strong><br />
the World <strong>Trade</strong> Organisation.<br />
Subprogrammes<br />
• Policy <strong>and</strong> Legislative Development develops regulatory solutions, including legislative reviews. This<br />
subprogramme had a staff complement of 18 <strong>and</strong> a total budget of R22.1 million in 2011/12, of<br />
which 48. 4 per cent was used for compensation of employees.<br />
• Enforcement <strong>and</strong> Compliance provides the public <strong>and</strong> private sector with policy reviews <strong>and</strong> briefings on<br />
trends analysis, impact assessments, market surveys <strong>and</strong> the effectiveness of regulatory agencies <strong>and</strong><br />
voluntary compliance. Amendment of the Liquor Act (2003) will be tabled in Parliament in 2013 after a<br />
regulatory impact assessment on liquor policy in 2012/13 has been done. This subprogramme had a staff<br />
complement of 26 <strong>and</strong> a total budget of R23.9 million in 2011/12, of which 68. 8 per cent was used for<br />
compensation of employees.<br />
• Regulatory Services monitors <strong>and</strong> funds a number of regulatory agencies, including: the <strong>National</strong> Consumer<br />
Tribunal, which received R28.8 million in 2011/12, which adjudicates on credit <strong>and</strong> consumer matters to<br />
ensure equity in the credit market, <strong>and</strong> balances the rights <strong>and</strong> responsibilities of credit providers <strong>and</strong><br />
consumers; the <strong>National</strong> Credit Regulator, which received R53 million in 2011/12, <strong>and</strong> which regulates the<br />
consumer credit industry to improve consumer protection in the end user credit market, provides effective<br />
debt counselling, <strong>and</strong> review mechanisms; the <strong>National</strong> Gambling Board, which received R23.6 million in<br />
2011/12, <strong>and</strong> which provides a regulatory framework for gambling practices <strong>and</strong> monitors the<br />
socioeconomic effects of gambling on citizens; the <strong>National</strong> Consumer Commission, which received<br />
R33 million in 2011/12, <strong>and</strong> which ensures well functioning markets that are fair, competitive <strong>and</strong><br />
responsible to consumers; the Companies <strong>and</strong> Intellectual Property Commission, which received<br />
R14 million in 2011/12, <strong>and</strong> which deals with the registration of companies, adherence to financial<br />
st<strong>and</strong>ards, the provision of business rescue interventions <strong>and</strong> enforcement of non-compliance; <strong>and</strong> the<br />
Companies Tribunal, which received R10 million in 2011/12, <strong>and</strong> which is responsible for adjudicating<br />
matters arising in terms of the Companies Act (1973); <strong>and</strong> a transfer to the World Intellectual Property<br />
Organisation for membership fees, <strong>and</strong> which received R2.9 million in 2011/12. The subprogramme also<br />
monitors the activities of the Estate Agency Affairs Board, the <strong>National</strong> Lotteries Board, the Takeover<br />
Regulation Panel <strong>and</strong> the Financial Reporting St<strong>and</strong>ards Council. This subprogramme had a staff<br />
complement of 19 <strong>and</strong> a total budget of R183.6 million in 2011/12, of which 4.9 per cent was used for<br />
compensation of employees.<br />
23
2012 Estimates of <strong>National</strong> Expenditure<br />
Expenditure estimates<br />
Table <strong>36</strong>.9 Consumer <strong>and</strong> Corporate Regulation<br />
Subprogramme<br />
24<br />
Audited outcome<br />
Adjusted<br />
appropriation Medium-term expenditure estimate<br />
R thous<strong>and</strong> 2008/09 2009/10 2010/11 2011/12 2012/13 2013/14 2014/15<br />
Policy <strong>and</strong> Legislative Development 12 155 10 131 9 637 22 138 23 165 24 386 25 892<br />
Enforcement <strong>and</strong> Compliance 29 844 32 948 <strong>36</strong> 348 23 935 <strong>36</strong> <strong>36</strong>3 40 132 42 5<strong>36</strong><br />
Regulatory Services 69 611 90 746 99 0<strong>36</strong> 183 598 185 185 195 062 180 062<br />
Total 111 610 133 825 145 021 229 671 244 713 259 580 248 490<br />
Change to 2011 Budget estimate (2 000) 2 604 2 868 (23 625)<br />
Economic classification<br />
Current payments 44 880 48 051 51 830 63 495 70 653 75 129 79 681<br />
Compensation of employees 31 7<strong>36</strong> <strong>36</strong> 395 39 711 <strong>36</strong> 352 51 909 55 432 57 465<br />
Goods <strong>and</strong> services<br />
of which:<br />
13 144 11 656 12 119 27 143 18 744 19 697 22 216<br />
Administrative fees 13 42 – 22 40 65 40<br />
Advertising 595 540 193 22 405 – –<br />
Assets less than the capitalisation<br />
threshold<br />
69 2 6 14 24 81 16<br />
Bursaries: Employees 88 – – – – – –<br />
Catering: Departmental activities 98 394 372 546 646 6<strong>36</strong> 675<br />
Communication 2<strong>36</strong> 222 223 267 309 456 482<br />
Computer services – 3 – – – 14 24<br />
Consultants <strong>and</strong> professional services:<br />
Business <strong>and</strong> advisory services<br />
Consultants <strong>and</strong> professional services:<br />
Legal costs<br />
4 808 2 804 4 258 14 031 5 061 6 460 8 263<br />
774 1 257 386 1 183 500 500 500<br />
Contractors 21 132 60 71 122 5 6<br />
Agency <strong>and</strong> support / outsourced<br />
services<br />
– 413 32 250 – – –<br />
Entertainment 2 1 5 25 10 – –<br />
Fleet services (including government<br />
motor transport)<br />
– – 1 2 – – –<br />
Inventory: Materials <strong>and</strong> supplies – – – 1 – – –<br />
Inventory: Other consumables – 8 1 6 – 3 3<br />
Inventory: Stationery <strong>and</strong> printing 623 569 486 890 7<strong>36</strong> 784 828<br />
Lease payments – 85 175 97 55 <strong>36</strong> 31<br />
Travel <strong>and</strong> subsistence 3 948 3 039 4 730 6 021 7 609 7 452 7 778<br />
Training <strong>and</strong> development 71 – – – – – –<br />
Operating expenditure 160 1 201 325 1 918 1 450 1 786 1 815<br />
Venues <strong>and</strong> facilities 1 638 944 866 1 777 1 777 1 419 1 755<br />
Transfers <strong>and</strong> subsidies 66 132 85 513 92 908 165 376 173 <strong>36</strong>0 184 451 168 809<br />
Departmental agencies <strong>and</strong> accounts 62 748 82 948 90 059 162 458 169 <strong>36</strong>0 180 231 164 3<strong>36</strong><br />
Foreign governments <strong>and</strong> international<br />
organisations<br />
3 074 2 565 2 630 2 918 4 000 4 220 4 473<br />
Households 310 – 219 – – – –<br />
Payments for capital assets 594 261 283 800 700 – –<br />
Machinery <strong>and</strong> equipment 594 261 283 800 700 – –<br />
Payments for financial assets 4 – – – – – –<br />
Total 111 610 133 825 145 021 229 671 244 713 259 580 248 490
Table <strong>36</strong>.9 Consumer <strong>and</strong> Corporate Regulation (continued)<br />
<strong>Vote</strong> <strong>36</strong>: <strong>Trade</strong> <strong>and</strong> <strong>Industry</strong><br />
Audited outcome<br />
Adjusted<br />
appropriation Medium-term expenditure estimate<br />
R thous<strong>and</strong> 2008/09 2009/10 2010/11 2011/12 2012/13 2013/14 2014/15<br />
Details of transfers <strong>and</strong> subsidies<br />
Departmental agencies <strong>and</strong> accounts<br />
Departmental agencies (non-business entities)<br />
Current 62 748 82 948 90 059 162 458 169 <strong>36</strong>0 180 231 164 3<strong>36</strong><br />
<strong>National</strong> Credit Regulator 34 082 43 859 46 000 53 042 54 690 58 870 57 400<br />
<strong>National</strong> Gambling Board 17 274 21 570 22 000 23 605 25 900 27 330 26 700<br />
<strong>National</strong> Consumer Tribunal 11 392 17 519 22 059 28 833 33 035 35 780 37 7<strong>36</strong><br />
Companies <strong>and</strong> Intellectual Property<br />
Commission<br />
– – – 13 990 4 158 4 387 –<br />
<strong>National</strong> Consumer Commission – – – 32 988 41 577 43 864 42 500<br />
Companies Tribunal – – – 10 000 10 000 10 000 –<br />
Foreign governments <strong>and</strong> international organisations<br />
Current 3 074 2 565 2 630 2 918 4 000 4 220 4 473<br />
World Intellectual Property Organisation 3 074 2 565 2 630 2 918 4 000 4 220 4 473<br />
Households<br />
Social benefits<br />
Current 310 – 219 – – – –<br />
Employee social benefits 310 – 219 – – – –<br />
Expenditure trends<br />
Expenditure increased from R111.6 million in 2008/09 to R229.7 million in 2011/12, at an average annual rate<br />
of 27.2 per cent, due to the establishment of new entities, including the <strong>National</strong> Consumer Commission, the<br />
Companies <strong>and</strong> Intellectual Property Commission <strong>and</strong> the Companies Tribunal. As a result, expenditure on<br />
transfers is expected to increase from R66.1 million in 2008/09 to R168.8 million in 2014/15, at an average<br />
annual rate of 16.9 per cent.<br />
Over the medium term, total expenditure is expected to increase to R248.5 million, at an average growth rate of<br />
2.7 per cent, mainly to provide for increased transfers to departmental agencies <strong>and</strong> accounts, <strong>and</strong> to fund the<br />
division’s restructuring process.<br />
Allocations over the seven-year period principally fund the operational expenditure of a number of regulatory<br />
institutions responsible for the effective implementation <strong>and</strong> enforcement of important regulatory legislation<br />
such as the Companies Amendment Act (2011), the Consumer Protection Act (2008), the Lotteries Act (1997),<br />
the <strong>National</strong> Gambling Act (2004), the Estate Agency Affairs Act (1976) <strong>and</strong> the <strong>National</strong> Credit Act (2005).)<br />
Programme 6: Industrial Development: Incentive Administration<br />
Objectives <strong>and</strong> measures<br />
• Design <strong>and</strong> implement programmes or incentives by March 2013 that support investment, competitiveness,<br />
employment creation <strong>and</strong> equity.<br />
• Improve the impact of incentives programmes by implementing a monitoring <strong>and</strong> evaluation system by<br />
2012/13.<br />
• Improve the administrative requirements for incentives to make them more user friendly by implementing an<br />
electronic online application <strong>and</strong> claim system by March 2013.<br />
Subprogrammes<br />
• Broadening Participation Incentives provides incentive programmes that promote the broader participation<br />
in the mainstream economy of businesses owned by individuals from historically disadvantaged<br />
25
2012 Estimates of <strong>National</strong> Expenditure<br />
communities <strong>and</strong> marginalised regions. Transfer payments make provision for the following incentive<br />
schemes: R64.1 million or 49 per cent of the total budget of the subprogramme to the black business<br />
supplier development programme for incentives to qualifying companies through which black business<br />
suppliers are supported; <strong>and</strong> R54.4 million or 46 per cent of the total budget of the subprogramme to the<br />
cooperatives incentive scheme for incentives to qualifying companies through which cooperative enterprises<br />
in the emerging economy acquire business development services. This subprogramme had a staff<br />
complement of 30 <strong>and</strong> a total budget of R129.9 million in 2011/12, of which 8 per cent was used for<br />
compensation of employees. No savings over the medium term have been identified in this subprogramme.<br />
• Manufacturing Investment Incentives provides incentives to promote additional investment in the<br />
manufacturing sector. Transfer payments to various incentive schemes were made as follows:<br />
R649.5 million or 31 per cent of the total budget of the subprogramme for the enterprise investment<br />
programme for incentives to qualifying local <strong>and</strong> foreign owned manufacturing companies establishing new<br />
or exp<strong>and</strong>ing production facilities as from 2009/10; R241.2 million or 12 per cent of the total budget of the<br />
subprogramme for the small <strong>and</strong> medium enterprise development programme for incentives to qualifying<br />
companies starting or exp<strong>and</strong>ing current operations; R1 million or 0.4 per cent of the total budget of the<br />
subprogramme for the small <strong>and</strong> medium manufacturing development programme for incentives to<br />
qualifying companies starting or exp<strong>and</strong>ing current manufacturing operations; R947.5 million or 46 per cent<br />
of the total budget of the subprogramme for automotive production <strong>and</strong> development programmes for<br />
incentives to qualifying motor vehicle manufacturers in South Africa; R168.6 million or 8 per cent of the<br />
total budget of the subprogramme for export marketing <strong>and</strong> investment assistance for sector specific<br />
assistance schemes for capital project feasibility programmes <strong>and</strong> industrial competitiveness <strong>and</strong> upgrading<br />
programmes. This subprogramme had a staff complement of 147 <strong>and</strong> a total budget of R2.1 billion in<br />
2011/12, of which 1.9 per cent was used for compensation of employees. No savings over the medium term<br />
have been identified in this subprogramme.<br />
• Service Investment Incentives provides incentive programmes that promote increased investment <strong>and</strong><br />
employment growth in the targeted subsectors. R143.1 million or 44 per cent of the total budget of the<br />
subprogramme was transferred for the business process services programme services, which is a dedicated<br />
investor friendly setup process, <strong>and</strong> is designed to improve industry service st<strong>and</strong>ards to position South<br />
• Africa as a preferred location for business process services operations. The programme aims to attract<br />
investment <strong>and</strong> create employment in South Africa through off-shoring activities. R190.3 million or<br />
55 per cent of the total budget of the subprogramme was transferred to the film <strong>and</strong> television production<br />
incentive scheme for incentives to qualifying companies to support film <strong>and</strong> television productions in South<br />
Africa. This subprogramme had a staff complement of 14 <strong>and</strong> a total budget of R345.6 million in 2011/12,<br />
of which 2.3 per cent was used for compensation of employees. R5.8 billion over the MTEF period in<br />
additional funding as part of the economic support package is allocated to the manufacturing<br />
competitiveness enhancement programme.<br />
• Infrastructure Development Support leverages investments in the South African economy by providing<br />
infrastructure critical to industrial development, thereby increasing the export of value added commodities<br />
<strong>and</strong> creating employment opportunities. Transfer payments are made as follows: R383.7 million in 2011/12<br />
or 52 per cent of the total budget of the subprogramme to the Coega Development Corporation for bulk<br />
infrastructure development in the industrial development zone; R171.3 million or 23 per cent of the total<br />
budget of the subprogramme to the East London industrial development zone for bulk infrastructure<br />
development in the industrial development zone; R60.7 million or 8 per cent of the total budget of the<br />
subprogramme to the Richards Bay industrial development zone for bulk infrastructure development in the<br />
industrial development zone; <strong>and</strong> R118.5 million or 16 per cent of the total budget of the subprogramme to<br />
the critical infrastructure programme for bulk infrastructure development in South Africa. This<br />
subprogramme had a staff complement of 15 <strong>and</strong> a total budget of R744.1 million in 2011/12, of which<br />
1.2 per cent was used for compensation of employees. As part of the economic support package, additional<br />
funding of R2.2 billion over the MTEF period is allocated to the special economic zones programme.<br />
• Product <strong>and</strong> Systems Development aims to develop, review, monitor <strong>and</strong> evaluate existing as well as new<br />
incentive programmes to: support the industrial policy framework <strong>and</strong> its action plan, develop sector<br />
strategies to address identified market failures, <strong>and</strong> develop a new tax incentive allowance that was<br />
26
<strong>Vote</strong> <strong>36</strong>: <strong>Trade</strong> <strong>and</strong> <strong>Industry</strong><br />
launched in 2010/11. The subprogramme also reviewed the business process services <strong>and</strong> off-shoring<br />
incentive, a revised version of which was launched in 2010/11, <strong>and</strong> the automotive investment scheme also<br />
in 2010/11. This subprogramme had a staff complement of 20 <strong>and</strong> a total budget of R9.7 million in 2011/12,<br />
of which 91.5 per cent was used for compensation of employees.<br />
• Business Development <strong>and</strong> After Care facilitates access to targeted enterprises by reviewing incentive<br />
schemes for their impact, <strong>and</strong> the lessons learnt for improving old schemes or developing new ones. A<br />
customer satisfaction survey was completed, results analysed <strong>and</strong> a report presented to management in<br />
2010/11. This subprogramme had a staff complement of 32 <strong>and</strong> a total budget of R17.2 million, of which<br />
75 per cent was used for compensation of employees.<br />
Expenditure estimates<br />
Table <strong>36</strong>.10 Industrial Development: Incentive Administration<br />
Subprogramme<br />
Audited outcome<br />
Adjusted<br />
appropriation Medium-term expenditure estimate<br />
R thous<strong>and</strong> 2008/09 2009/10 2010/11 2011/12 2012/13 2013/14 2014/15<br />
Broadening Participation Incentives 98 356 118 042 183 832 129 903 147 810 161 150 172 066<br />
Manufacturing Investment Incentives 1 144 343 1 526 384 1 3<strong>36</strong> 769 2 074 <strong>36</strong>3 3 507 425 4 374 572 4 975 170<br />
Services Investment Incentives 210 494 258 473 233 551 345 581 452 519 517 980 569 722<br />
Infrastructure Development Support 947 506 1 418 673 1 020 607 744 131 1 302 632 1 389 567 1 215 091<br />
Product <strong>and</strong> Systems Development – 5 504 5 817 9 734 10 557 11 104 11 773<br />
Business Development <strong>and</strong> After Care – 11 158 12 418 17 150 16 622 17 710 16 690<br />
Total 2 400 699 3 338 234 2 792 994 3 320 862 5 437 565 6 472 083 6 960 512<br />
Change to 2011 Budget estimate (148 252) 1 694 298 2 676 291 2 9<strong>36</strong> 972<br />
Economic classification<br />
Current payments 70 391 88 650 99 115 122 799 158 196 175 510 185 972<br />
Compensation of employees 49 092 67 677 73 5<strong>36</strong> 90 244 117 995 133 699 139 981<br />
Goods <strong>and</strong> services<br />
of which:<br />
21 299 20 973 25 579 32 555 40 201 41 811 45 991<br />
Administrative fees 42 66 180 425 50 53 56<br />
Advertising 355 30 300 430 – – –<br />
Assets less than the capitalisation<br />
threshold<br />
147 72118 115 210 222 235<br />
Bursaries: Employees 176 – – – – – –<br />
Catering: Departmental activities 172 196 185 160 170 179 190<br />
Communication 287 405 419 650 861 902 952<br />
Computer services 1 018 688 355 – – – –<br />
Consultants <strong>and</strong> professional services:<br />
Business <strong>and</strong> advisory services<br />
5 127 4 331 8 726 11 425 14 415 15 126 16 948<br />
Consultants <strong>and</strong> professional services:<br />
Legal costs<br />
1 167 1 477 1 438 2 103 3 000 3 117 3 244<br />
Contractors 39 4 1 2 – – –<br />
Agency <strong>and</strong> support / outsourced<br />
services<br />
862 1 225 779 460 200 212 225<br />
Entertainment 1 9 12 70 75 79 84<br />
Fleet services (including government<br />
motor transport)<br />
– – 42 120 375 398 421<br />
Inventory: Materials <strong>and</strong> supplies – – 2 2 – – –<br />
Inventory: Other consumables 3 28 7 40 30 32 34<br />
Inventory: Stationery <strong>and</strong> printing 1 302 1 832 1 577 1 289 2 700 2 809 3 918<br />
Lease payments – 961 962 150 – – –<br />
Property payments 29 47 <strong>36</strong> 80 – – –<br />
Travel <strong>and</strong> subsistence 8 124 8 770 9 078 12 999 15 150 15 609 16 487<br />
Training <strong>and</strong> development 590 – – – – – –<br />
Operating expenditure 260 155 576 385 500 528 560<br />
Venues <strong>and</strong> facilities 1 598 677 786 1 650 2 465 2 545 2 637<br />
27
2012 Estimates of <strong>National</strong> Expenditure<br />
Table <strong>36</strong>.10 Industrial Development: Incentive Administration (continued)<br />
Audited outcome<br />
Adjusted<br />
appropriation Medium-term expenditure estimate<br />
R thous<strong>and</strong><br />
Economic classification<br />
2008/09 2009/10 2010/11 2011/12 2012/13 2013/14 2014/15<br />
Transfers <strong>and</strong> subsidies 2 326 705 3 247 549 2 692 604 3 197 063 5 278 319 6 295 509 6 773 412<br />
Public corporations <strong>and</strong> private<br />
enterprises<br />
2 326 695 3 247 343 2 692 596 3 197 063 5 278 319 6 295 509 6 773 412<br />
Households 10 206 8 – – – –<br />
Payments for capital assets 1 757 1 800 1 274 1 000 1 050 1 064 1 128<br />
Machinery <strong>and</strong> equipment 750 796 1 274 1 000 1 050 1 064 1 128<br />
Software <strong>and</strong> other intangible assets 1 007 1 004 – – – – –<br />
Payments for financial assets 1 846 235 1 – – – –<br />
Total 2 400 699 3 338 234 2 792 994 3 320 862 5 437 565 6 472 083 6 960 512<br />
Details of transfers <strong>and</strong> subsidies<br />
Households<br />
Social benefits<br />
Current 10 206 8 – – – –<br />
Employee social benefits 10 206 8 – – – –<br />
Public corporations <strong>and</strong> private enterprises<br />
Public corporations<br />
Other transfers to public<br />
corporations<br />
Capital 872 455 1301 685 932 000 615 682 609 876 438 195 –<br />
Coega Development Corporation 718 425 859 889 714 000 383 718 417 858 308 195 –<br />
Richards Bay Industrial Development<br />
Zone Company<br />
– 68 423 20 000 60 682 42 018 30 000 –<br />
East London Industrial Development<br />
Zone<br />
Public corporations <strong>and</strong> private enterprises<br />
154 030 373 373 198 000 171 282 150 000 100 000 –<br />
Private enterprises<br />
Other transfers to private enterprises<br />
Current 148 777 230 676 308 911 287 116 317 000 3<strong>36</strong> 000 355 000<br />
Export Market <strong>and</strong> Investment<br />
Assistance<br />
112 124 122 303 133 878 168 644 182 000 189 000 200 000<br />
Broadening Participation Development<br />
Incentives<br />
<strong>36</strong> 653 108 373 175 033 118 472 135 000 147 000 155 000<br />
Capital 75 051 105 601 80 642 118 540 182 000 190 000 203 000<br />
Critical Infrastructure Programme 75 051 105 601 80 642 118 540 182 000 190 000 203 000<br />
Public corporations <strong>and</strong> private enterprises<br />
Private enterprises<br />
Private enterprises - subsidies on products <strong>and</strong> production<br />
Current 1 230 412 1 609 381 1 371 043 2 175 725 3 669 443 4 581 314 5 215 412<br />
Manufacturing Development Incentives 1 019 442 1 350 631 1 144 261 1 839 247 3 227 079 4 074 001 4 657 001<br />
Staple Food Fortification Programme 476 282 – – – – –<br />
Services Sector Development<br />
Incentives<br />
210 494 253 993 226 782 333 <strong>36</strong>9 439 000 504 000 555 000<br />
Industrial Development Zones: Other – 4 475 – 1 – – –<br />
Sector Development Programme – – – 3 108 3 <strong>36</strong>4 3 313 3 411<br />
Capital – – – – 500 000 750 000 1 000 000<br />
Special Economic Zones: Investment<br />
incentives<br />
– – – – 500 000 750 000 1 000 000<br />
Expenditure trends<br />
Expenditure increased from R2.4 billion in 2008/09 to R3.3 billion in 2011/12, at an average annual rate of<br />
11.4 per cent, mainly due to the implementation of new schemes, such as the automotive incentives schemes<br />
<strong>and</strong> the enterprise investment programme. Over this period, the East London industrial development zone<br />
28
<strong>Vote</strong> <strong>36</strong>: <strong>Trade</strong> <strong>and</strong> <strong>Industry</strong><br />
received R896.7 million, the Richards Bay industrial development zone received R149.1 million <strong>and</strong> the Coega<br />
industrial development zone received R2.7 billion for infrastructure development.<br />
Over the MTEF period, the expenditure is expected to increase to R7 billion, at an average annual rate of<br />
28.5 per cent, mainly due to: the continuous improvement of enterprise investment programme guidelines; the<br />
implementation of the automotive incentive scheme; the revised black business supplier development<br />
programme; <strong>and</strong> the revised business process services programme, which will attract more applications.<br />
Allocations over the seven-year period provide incentive measures that support investment, job creation <strong>and</strong><br />
regional economic development. A large portion of the funds is directed towards the funding of the automotive<br />
investment scheme, business process services programme, critical infrastructure programme, enterprise<br />
investment programme, film <strong>and</strong> television production incentive, three industrial development zones, <strong>and</strong> the<br />
export market <strong>and</strong> investment assistance scheme.<br />
Programme 7: <strong>Trade</strong> <strong>and</strong> Investment South Africa<br />
Objectives <strong>and</strong> measures<br />
• Increase the quality <strong>and</strong> quantity of domestic <strong>and</strong> foreign direct investment by reviewing the investment<br />
strategies over the MTEF period.<br />
• Review the export strategy over the MTEF period, in order to develop new <strong>and</strong> increase existing South<br />
African export capabilities.<br />
• Promote South African products in targeted high growth markets through 6 international trade <strong>and</strong><br />
investment initiatives <strong>and</strong> 54 pavilions, <strong>and</strong> by funding 129 trade missions, by March 2014.<br />
• Facilitate markets for South African manufactured products <strong>and</strong> services by promoting <strong>and</strong> implementing<br />
export <strong>and</strong> investment projects in high yield targeted countries such as the Brazil-Russia-India-China-South<br />
Africa group of countries, the rest of Africa <strong>and</strong> other developing countries by March 2013.<br />
• Enhance the promotion of exports <strong>and</strong> investment in targeted countries, through maintaining a footprint of<br />
27 foreign based economic offices.<br />
Subprogrammes<br />
• Investment Promotion <strong>and</strong> Facilitation facilitates the increase in the quality <strong>and</strong> quantity of foreign <strong>and</strong><br />
domestic direct investment by providing an investment recruitment, problem solving <strong>and</strong> information<br />
service. This entails promoting South Africa as an investment destination, with a target of R115 billion in<br />
investment over the 3 years to 2013/14 <strong>and</strong> R45 billion in investment for 2012/13. It is also responsible for<br />
organising an international investment conference annually. This subprogramme had a staff complement of<br />
47 <strong>and</strong> a total budget of R43.3 million in 2011/12, of which 35 per cent was used for compensation of<br />
employees. In 2011/12, the subprogramme made a contribution of R7 million or 17.2 per cent of its total<br />
budget to the Proudly South African campaign <strong>and</strong> R11.8 million to the Export Consultancy Trust Fund for<br />
the International Bank for Reconstruction <strong>and</strong> Development <strong>and</strong> the International Finance Corporation. No<br />
savings over the medium term have been identified in this subprogramme.<br />
• Export Development <strong>and</strong> Promotion develops new <strong>and</strong> existing South African exporter capabilities. It<br />
provides information, financial support <strong>and</strong> practical assistance to sustain organic growth in traditional<br />
markets <strong>and</strong> to penetrate new high growth markets. Transfer payments are made to the Export Credit<br />
Insurance Corporation of South Africa, which facilitates <strong>and</strong> encourages South African export trade by<br />
underwriting export credit loans <strong>and</strong> investments outside South Africa’s borders to allow South African<br />
contractors to win capital goods <strong>and</strong> services contracts in other countries. Allocations to the corporation<br />
vary due to the fluctuations in interest rates, world economic stability <strong>and</strong> the Eurozone economic crisis.<br />
This subprogramme had a staff complement of 78 <strong>and</strong> a total budget of R168.7 million in 2011/12, of which<br />
12.3 per cent was used for compensation of employees <strong>and</strong> 73 per cent transferred to the Export Credit<br />
Insurance Corporation of South Africa for the interest make-up scheme. <strong>Trade</strong> <strong>and</strong> Investment South Africa<br />
participated in the 2010 Shanghai World Expo. In 2011, it conducted further expo promotions in China to<br />
highlight manufactured products <strong>and</strong> services in Beijing <strong>and</strong> Shanghai. This programme implements<br />
measures to assist businesses in securing market access opportunities <strong>and</strong> investments for South African<br />
29
2012 Estimates of <strong>National</strong> Expenditure<br />
products <strong>and</strong> services. The programme has facilitated six international initiatives in investments <strong>and</strong> exports<br />
in the last quarter of 2011/12 to Zimbabwe, Brazil, Russia, the Democratic Republic of the Congo <strong>and</strong><br />
India. No savings over the medium term have been identified in this subprogramme.<br />
• International Operations manages <strong>and</strong> administers the department’s foreign office network of 27 foreign<br />
economic representatives covering a footprint of 45 countries to promote trade <strong>and</strong> investment in South<br />
Africa. This subprogramme had a staff complement of 37 <strong>and</strong> a total budget of R133.2 million in 2011/12,<br />
of which 57.3 per cent was used for compensation of employees. No savings over the medium term have<br />
been identified in this subprogramme.<br />
Expenditure estimates<br />
Table <strong>36</strong>.11 <strong>Trade</strong> <strong>and</strong> Investment South Africa<br />
Subprogramme<br />
Audited outcome<br />
Adjusted<br />
appropriation Medium-term expenditure estimate<br />
R thous<strong>and</strong> 2008/09 2009/10 2010/11 2011/12 2012/13 2013/14 2014/15<br />
Investment Promotion <strong>and</strong> Facilitation 33 681 42 041 54 676 43 256 44 259 46 444 86 058<br />
Export Development <strong>and</strong> Promotion 172 702 157 780 157 069 168 673 144 720 159 796 162 857<br />
International Operations 103 850 99 158 116 837 133 218 115 847 121 933 129 387<br />
Total 310 233 298 979 328 582 345 147 304 826 328 173 378 302<br />
Change to 2011 Budget estimate 39 016 (10 289) (3 907) 26 298<br />
Economic classification<br />
Current payments 175 507 164 205 167 250 203 630 183 522 192 998 204 741<br />
Compensation of employees 85 898 83 561 101 173 112 310 117 281 123 828 131 420<br />
Goods <strong>and</strong> services<br />
of which:<br />
89 609 80 644 66 077 91 320 66 241 69 170 73 321<br />
Administrative fees 601 1 043 487 872 411 421 447<br />
Advertising 2 026 1 243 1 289 900 175 302 320<br />
Assets less than the capitalisation<br />
threshold<br />
174 264 279 628 243 337 357<br />
Bursaries: Employees 19 – – – – – –<br />
Catering: Departmental activities 186 98 412 911 491 398 422<br />
Communication 2 814 2 009 2 184 2 935 2 265 2 414 2 559<br />
Computer services 766 312 664 1 035 550 570 604<br />
Consultants <strong>and</strong> professional services:<br />
Business <strong>and</strong> advisory services<br />
8 783 1 473 1 534 2 977 3 016 3 105 3 291<br />
Consultants <strong>and</strong> professional services:<br />
Legal costs<br />
523 585 165 2<strong>36</strong> 160 394 418<br />
Contractors 3 442 2 178 1 860 2 335 1 681 1 740 1 844<br />
Agency <strong>and</strong> support / outsourced<br />
services<br />
– 39 4<strong>36</strong> 259 20 – –<br />
Entertainment 1 025 951 1 051 1 530 1 173 1 229 1 303<br />
Fleet services (including government<br />
motor transport)<br />
– – 152 54 – – –<br />
Inventory: Learner <strong>and</strong> teacher support<br />
material<br />
– – 1 – – – –<br />
Inventory: Materials <strong>and</strong> supplies – 1 4 – – – –<br />
Inventory: Other consumables 1 98 89 495 517 485 514<br />
Inventory: Stationery <strong>and</strong> printing 2 113 972 1 376 1 956 1 250 1 511 1 602<br />
Lease payments 11 047 12 267 14 640 15 105 9 666 9 974 10 572<br />
Property payments 1 844 884 1 055 3 041 760 800 848<br />
Transport provided: Departmental<br />
activity<br />
– – – 20 100 – –<br />
Travel <strong>and</strong> subsistence 22 312 18 156 18 677 29 701 18 900 20 300 21 518<br />
Training <strong>and</strong> development 130 6 54 665 50 – –<br />
Operating expenditure 9 593 8 003 5 932 8 352 7 400 7 920 8 396<br />
Venues <strong>and</strong> facilities 22 210 30 062 13 7<strong>36</strong> 17 313 17 413 17 270 18 306<br />
30
Table <strong>36</strong>.11 <strong>Trade</strong> <strong>and</strong> Investment South Africa (continued)<br />
Expenditure trends<br />
<strong>Vote</strong> <strong>36</strong>: <strong>Trade</strong> <strong>and</strong> <strong>Industry</strong><br />
Audited outcome<br />
Adjusted<br />
appropriation Medium-term expenditure estimate<br />
R thous<strong>and</strong> 2008/09 2009/10 2010/11 2011/12 2012/13 2013/14 2014/15<br />
Economic classification<br />
Transfers <strong>and</strong> subsidies 133 559 132 956 159 172 140 267 119 954 133 925 172 2<strong>36</strong><br />
Foreign governments <strong>and</strong><br />
international organisations<br />
9 911 10 456 11 084 11 750 12 338 13 082 13 866<br />
Public corporations <strong>and</strong> private<br />
enterprises<br />
123 648 122 400 120 488 121 517 97 616 110 293 110 370<br />
Non-profit institutions – – 27 500 7 000 10 000 10 550 48 000<br />
Households – 100 100 – – – –<br />
Payments for capital assets 1 119 1 502 2 139 1 250 1 350 1 250 1 325<br />
Machinery <strong>and</strong> equipment 1 119 1 502 2 095 1 250 1 350 1 250 1 325<br />
Software <strong>and</strong> other intangible assets – – 44 – – – –<br />
Payments for financial assets 48 316 21 – – – –<br />
Total 310 233 298 979 328 582 345 147 304 826 328 173 378 302<br />
Details of transfers <strong>and</strong> subsidies<br />
Foreign governments <strong>and</strong> international organisations<br />
Current 9 911 10 456 11 084 11 750 12 338 13 082 13 866<br />
Export consultancy trust funds:<br />
International Bank for Reconstruction<br />
<strong>and</strong> Development (World Bank)<br />
Export consultancy trust funds:<br />
International Finance Corporation<br />
Non-profit institutions<br />
4 956 5 228 5 542 5 875 6 169 6 541 6 933<br />
4 955 5 228 5 542 5 875 6 169 6 541 6 933<br />
Current – – 27 500 7 000 10 000 10 550 48 000<br />
Proudly South African campaign – – 27 500 7 000 10 000 10 550 48 000<br />
Households<br />
Social benefits<br />
Current – 100 100 – – – –<br />
Gifts, donations <strong>and</strong> sponsorships – 100 100 – – – –<br />
Public corporations <strong>and</strong> private enterprises<br />
Public corporations<br />
Other transfers to public<br />
corporations<br />
Current 123 648 122 400 120 488 121 517 97 616 110 293 110 370<br />
Export Credit Insurance Corporation:<br />
Interest make-up scheme<br />
123 648 122 400 120 488 121 517 97 616 110 293 110 370<br />
Expenditure increased from R310.2 million in 2008/09 to R345.1 million in 2011/12, at an average annual rate<br />
of 3.6 per cent, <strong>and</strong> is expected to increase to R378.3 million over the medium term, at an average annual rate of<br />
3.1 per cent. The trends in the International Operations subprogramme drive the changes in spending in both<br />
periods. Between 2008/09 <strong>and</strong> 2011/12, spending in this subprogramme, which includes expenses related to the<br />
trade missions abroad, increased from R103.9 million in 2008/09 to R133.2 million in 2011/12, at an average<br />
annual rate of 8.7 per cent, due to favourable exchange rates <strong>and</strong> vacancies in foreign offices. Over the medium<br />
term, the subprogramme’s expenditure is expected to decrease to R129.4 million, at an average annual rate of<br />
1 per cent, due to the non-recurrence of the expos in China.<br />
Allocations over the seven-year period are mainly used for export development <strong>and</strong> promotion <strong>and</strong> transfers to<br />
the Export Credit <strong>and</strong> Insurance Corporation for the interest make–up scheme for exporters.<br />
31
2012 Estimates of <strong>National</strong> Expenditure<br />
Public entities <strong>and</strong> other agencies<br />
Companies <strong>and</strong> Intellectual Property Commission<br />
Overview: 2008/09 – 2014/15<br />
The Companies <strong>and</strong> Intellectual Property Commission, formerly the Companies <strong>and</strong> Intellectual Property<br />
Registration Office, became operational on 1 May 2011. Its strategic m<strong>and</strong>ate derives from the legislation <strong>and</strong><br />
regulations under which it has been established, primarily the Companies Act (2008) <strong>and</strong> legislation regulating<br />
trademarks, copyright <strong>and</strong> patents, as well as the policy framework of government.<br />
The commission is m<strong>and</strong>ated to register <strong>and</strong> protect companies <strong>and</strong> similar entities. The Companies Act (2008)<br />
aims to facilitate business transactions <strong>and</strong> enable a supportive environment for the growth of well governed,<br />
credible businesses.<br />
The goals of the commission are to improve the competitiveness of the South African business environment;<br />
promote innovation, creativity <strong>and</strong> indigenous cultural expression through contributing to a knowledge based<br />
economy <strong>and</strong> competitive local industries; <strong>and</strong> promote broader formal economic participation through<br />
enhancing service delivery <strong>and</strong> extending the reach of the commission.<br />
Key initiatives relate to the increase in the number of small businesses, the increase in the percentage of local<br />
internet protocol across all IP domains, record of indigenous knowledge <strong>and</strong> support a strong competitive South<br />
African creative industry that provides benefit to local artists <strong>and</strong> to implement measures to ensure increased<br />
data integrity. Such measures include the updating of records to ensure completeness <strong>and</strong> accuracy.<br />
Performance<br />
Since its inception in May 2011, the commission cleared backlogs in most areas of business registration,<br />
introduced service delivery st<strong>and</strong>ards, stabilised its IT systems by migrating back to Computron, <strong>and</strong> putting<br />
mechanisms in place to better address customer needs. The commission, as a new organisation, went through an<br />
extensive exercise to determine how best to capitalise on its new strategy, <strong>and</strong> to capture the economic value of<br />
the new m<strong>and</strong>ate in terms of the Companies Act (2008). In the past registration, volumes used to be measured.<br />
However, the organisation has little control over the dem<strong>and</strong> for certain services such as registration of<br />
companies, cooperatives, trademarks, patents <strong>and</strong> designs <strong>and</strong> copyright in films. Instead, greater value is<br />
derived from better service delivery such as turnaround time.<br />
Selected performance indicators<br />
Table <strong>36</strong>.12 Companies <strong>and</strong> Intellectual Property Commission<br />
Indicator Programme/Activity/Objective/Project Past1 Current Projections<br />
2008/09 2009/10 2010/11 2011/12 2012/13 2013/14 2014/15<br />
Turnaround time in days: Company Registration of business entities <strong>and</strong><br />
– – – 25 20 16 13<br />
registration<br />
intellectual property<br />
Turnaround time in days:<br />
Registration of business entities <strong>and</strong><br />
– – – 15 12 10 8<br />
Cooperative registration<br />
intellectual property<br />
Turnaround time in days: Patent Registration of business entities <strong>and</strong><br />
– – – 60 60 55 55<br />
registrations<br />
intellectual property<br />
Turnaround time in days: Design Registration of business entities <strong>and</strong><br />
– – – 60 60 55 55<br />
registrations<br />
intellectual property<br />
Turnaround time: Films registrations Registration of business entities <strong>and</strong><br />
intellectual property<br />
– – – 88 88 120 120<br />
Turnaround times: Counterfeit<br />
goods request for search <strong>and</strong><br />
seizure processing<br />
Regulations – – – 7 6 4 4<br />
Turnaround times: Licensing of<br />
business rescue practitioners<br />
Regulations – – – 3 2 2 2<br />
1. No past data is available, as the commission only became operational in May 2011.<br />
32
Programmes/activities/objectives<br />
Table <strong>36</strong>.13 Companies <strong>and</strong> Intellectual Property Commission<br />
Revised<br />
<strong>Vote</strong> <strong>36</strong>: <strong>Trade</strong> <strong>and</strong> <strong>Industry</strong><br />
Audited outcome estimate Medium-term estimate<br />
R thous<strong>and</strong> 2008/09 2009/10 2010/11 2011/12 2012/13 2013/14 2014/15<br />
Administration 833 824 422 602 231 552 218 113 379 394 <strong>36</strong>4 919 346 602<br />
Registration of business entities <strong>and</strong><br />
intellectual property<br />
59 261 184 563 82 298 124 741 220 994 188 329 193 813<br />
Regulations 31 910 99 380 27 433 41 580 73 664 62 776 89 331<br />
Total expense 924 995 706 545 341 283 384 434 674 052 616 024 629 746<br />
The Companies <strong>and</strong> Intellectual Property Commission had a total budget of R384.4 million in 2011/12, of<br />
which 56.7 per cent was used on administration.<br />
Savings <strong>and</strong> cost effectiveness measures<br />
Over the MTEF period, the commission will consider implementing a cost recovery fee structure <strong>and</strong> implement<br />
cost cutting in non-core activities.<br />
Expenditure estimates<br />
Table <strong>36</strong>.14 Companies <strong>and</strong> Intellectual Property Commission<br />
Statement of financial performance<br />
Audited outcome<br />
Revised<br />
estimate Medium-term estimate<br />
R thous<strong>and</strong> 2008/09 2009/10 2010/11 2011/12 2012/13 2013/14 2014/15<br />
Revenue<br />
Non-tax revenue 1 133 627 958 075 483 706 521 233 669 894 611 637 630 112<br />
Sale of goods <strong>and</strong> services other than<br />
capital assets<br />
of which:<br />
954 819 851 189 414 491 414 683 429 024 444 137 459 682<br />
Administration fees 954 819 851 189 414 491 414 683 429 024 444 137 459 682<br />
Other non-tax revenue 178 808 106 886 69 215 106 550 240 870 167 500 170 430<br />
Transfers received – – – 13 990 4 158 4 387 –<br />
Total revenue 1 133 627 958 075 483 706 535 223 674 052 616 024 630 112<br />
Expenses<br />
Current expenses 924 995 706 545 341 283 384 434 674 052 616 024 629 746<br />
Compensation of employees 87 253 115 402 132 768 179 805 228 251 309 405 357 787<br />
Goods <strong>and</strong> services 824 554 586 080 198 909 177 372 397 900 260 507 227 459<br />
Depreciation 13 106 4 942 9 542 27 257 47 901 46 112 44 500<br />
Interest, dividends <strong>and</strong> rent on l<strong>and</strong> 82 121 64 – – – –<br />
Total expenses 924 995 706 545 341 283 384 434 674 052 616 024 629 746<br />
Surplus / (Deficit) 208 632 251 530 142 423 150 789 – – <strong>36</strong>6<br />
Statement of financial position<br />
Carrying value of assets 76 642 122 049 21 593 15 372 197 471 211 359 206 859<br />
of which:<br />
Acquisition of assets 64 837 50 422 11 135 21 0<strong>36</strong> 230 000 60 000 40 000<br />
Inventory 578 620 834 650 400 350 300<br />
Receivables <strong>and</strong> prepayments 81 049 121 032 58 692 29 346 14 673 7 337 3 668<br />
Cash <strong>and</strong> cash equivalents 519 579 644 501 956 489 1 033 246 840 485 818 506 790 833<br />
Total assets 677 848 888 202 1 037 608 1 078 614 1 053 029 1 037 552 1 001 660<br />
Accumulated surplus / (deficit) 552 347 803 878 946 301 1 038 441 1 010 171 992 198 981 840<br />
Finance lease 1 190 699 – – – – –<br />
<strong>Trade</strong> <strong>and</strong> other payables 114 375 71 877 78 458 25 000 25 967 27 196 300<br />
Provisions 9 9<strong>36</strong> 11 748 12 849 15 173 16 891 18 158 19 520<br />
Total equity <strong>and</strong> liabilities 677 848 888 202 1 037 608 1 078 614 1 053 029 1 037 552 1 001 660<br />
33
2012 Estimates of <strong>National</strong> Expenditure<br />
Expenditure trends<br />
The commission generates revenue mainly from registration fees <strong>and</strong> annual returns. Revenue decreased from<br />
R1.1 billion in 2008/09 to R535.2 million in 2011/12, at an average annual rate of 22.1 per cent, due to the<br />
deregistration of non-compliant companies, which resulted in fewer annual returns being filed. Over the<br />
medium term, revenue is expected to increase to R630.1 million, at an average annual rate of 5.6 per cent, due to<br />
the planned revision of the fee structure.<br />
Expenditure decreased from R925 million in 2008/09 to R384.4 million in 2011/12, at an average annual rate of<br />
25.4 per cent, mainly due to lower expenditure on goods <strong>and</strong> services over the period as a result of a decrease in<br />
financing costs. Over the medium term, expenditure is expected to increase to R629.7 million, at an average<br />
annual rate of 17.9 per cent. Spending on compensation of employees is expected to increase from<br />
R87.3 million in 2008/09 to R357.8 million in 2014/15, at an average annual rate of 26.5 per cent, due to the<br />
implementation of the corporation’s new structure <strong>and</strong> function.<br />
The commission receives additional funding of R13.9 million in 2012/13, R4.1 million in 2013/14 <strong>and</strong><br />
R4.3 million in 2014/15 for its exp<strong>and</strong>ed m<strong>and</strong>ate. Expenditure on goods <strong>and</strong> services is expected to increase<br />
from R177.4 million in 2011/12 to R227.5 million in 2014/15, at an average annual rate of 8.6 per cent, due to<br />
the implementation of special projects relating to the enhancement of ICT systems, the move to the new<br />
building <strong>and</strong> the implementation of a new service delivery model.<br />
Personnel information<br />
Table <strong>36</strong>.15 Companies <strong>and</strong> Intellectual Property Commission<br />
34<br />
Personnel post status as at 30 September 2011 Number of personnel posts filled / planned for on funded establishment<br />
Number of<br />
posts on<br />
approved<br />
establishment<br />
Number of<br />
funded posts<br />
Number of<br />
vacant posts<br />
Actual Mid- year1 Medium-term estimate<br />
2008/09 2009/10 2010/11 2011/12 2012/13 2013/14 2014/15<br />
Executive<br />
management<br />
9 9 2 6 5 5 7 12 18 18<br />
Senior<br />
management<br />
55 55 – 14 22 22 55 38 62 62<br />
Middle<br />
management<br />
69 69 10 41 53 53 59 68 112 126<br />
Skilled 134 134 3 87 115 116 131 132 157 239<br />
Semi-skilled 329 329 27 295 306 306 302 421 421 425<br />
Total 596 596 42 443 501 502 554 671 770 870<br />
Compensation<br />
(R thous<strong>and</strong>)<br />
87 253 115 402 132 768 179 805 228 251 309 405 357 787<br />
Unit cost<br />
(R thous<strong>and</strong>)<br />
1. As at 30 September 2011.<br />
197 230 264 325 340 402 411<br />
As at 30 September 2011, the commission had an establishment of 596 funded posts. The number of posts filled<br />
increased from 443 in 2008/09 to 554 in 2011/12 <strong>and</strong> is expected to grow to 870 posts over the medium term.<br />
This is as a result of the exp<strong>and</strong>ed m<strong>and</strong>ate of the new entity.<br />
The commission had 42 vacancies as at 30 September 2011, 2 of which were at the senior management level.<br />
The ratio of support staff to line staff is 0.37:1.<br />
Companies Tribunal<br />
Overview: 2008/09 – 2014/15<br />
The Companies Tribunal m<strong>and</strong>ate is derived from the Companies Act (2008) <strong>and</strong> government policy. The<br />
tribunal becomes operational from 2012/13.<br />
The tribunal’s m<strong>and</strong>ate is to adjudicate any application made to it in terms of the act, assist in the resolution of<br />
disputes as contemplated by the act <strong>and</strong> perform any other function assigned to it by or in terms of the act, or<br />
any law mentioned in the act. The tribunal’s establishment <strong>and</strong> operations are expected to: reduce compliance<br />
regulatory costs; provide quick redress <strong>and</strong> easy access to stakeholders, particularly small businesses; <strong>and</strong><br />
provide mediation where required or deemed necessary. The act seeks, among other aims, to facilitate ease of
<strong>Vote</strong> <strong>36</strong>: <strong>Trade</strong> <strong>and</strong> <strong>Industry</strong><br />
doing business in South Africa, <strong>and</strong> create the formalisation of corporate entities <strong>and</strong> an environment that is<br />
supportive to the efficient growth of well governed, credible businesses.<br />
As the implementing arm of the department, the tribunal contributes to the following outcomes <strong>and</strong> outputs:<br />
creating a better South Africa <strong>and</strong> contributing to a better <strong>and</strong> safer Africa in a better world (outcome 11);<br />
enhanced trade <strong>and</strong> investment (output 4); an efficient, effective <strong>and</strong> development oriented public service <strong>and</strong> an<br />
empowered, fair <strong>and</strong> inclusive citizenship (outcome 12); service delivery quality <strong>and</strong> access (output 1).<br />
Performance<br />
Over the medium term, the tribunal will focus on building capacity <strong>and</strong> dealing with appeal cases referred by the<br />
Companies <strong>and</strong> Intellectual Property Commission.<br />
Selected performance indicators<br />
Table <strong>36</strong>.16 Companies Tribunal<br />
Indicator Activity/ Objective/ Programme Past 1 Current Projected<br />
Turnaround time in days of cases <strong>and</strong> To hear cases <strong>and</strong> facilitate access<br />
complaints heard<br />
to participation in formal economy<br />
Number of cases <strong>and</strong> complaints<br />
To hear cases <strong>and</strong> facilitate access<br />
heard per year<br />
to participation in formal economy<br />
Turnaround time in days of dispute To mediate <strong>and</strong> provide quicker<br />
resolution cases<br />
solutions/cheaper solutions<br />
Number of dispute resolution cases per To mediate <strong>and</strong> provide quicker<br />
year<br />
solutions/cheaper solutions<br />
Turnaround time in days of compliance To conduct hearings <strong>and</strong><br />
notices reviewed<br />
confirm/review/set aside compliance<br />
notices <strong>and</strong> monitor adherence<br />
Number of compliance notices<br />
To conduct hearings <strong>and</strong><br />
reviewed per year<br />
confirm/review/set aside compliance<br />
notices <strong>and</strong> monitor adherence<br />
Number of targeted stakeholder groups To engage on tribunal processes <strong>and</strong><br />
reached per year<br />
educate stakeholders<br />
Percentage of implementation of case To ensure reliable, effective <strong>and</strong><br />
management system <strong>and</strong> monitoring efficient data management <strong>and</strong><br />
workflow systems<br />
1. No past data is available, as the Tribunal becomes operational in 2012/13.<br />
Savings <strong>and</strong> cost effectiveness measures<br />
2008/09 2009/10 2010/11 2011/12 2012/13 2013/14 2014/15<br />
– – – – 25 25 20<br />
– – – – 15 20 30<br />
– – – – 20 20 15<br />
– – – – 5 10 15<br />
– – – – 5 5 5<br />
– – – – 10 10 10<br />
– – – – 4 4 5<br />
– – – – 60% 75% 80%<br />
No savings were effected. However, the tribunal will continuously monitor expenditure on a monthly basis to<br />
identify costs that can be reduced.<br />
Expenditure estimates<br />
The tribunal generates revenue from transfers from the department <strong>and</strong> interest on savings.<br />
Spending on compensation of employees is estimated at R68.5 million over the MTEF period, due to the<br />
adoption <strong>and</strong> implementation of the structure <strong>and</strong> appointment of tribunal members. Spending on goods <strong>and</strong><br />
services is projected to be R15 million over the medium term, due to the acquisition <strong>and</strong> implementation of ICT<br />
systems, capacity building <strong>and</strong> accommodation.<br />
35
2012 Estimates of <strong>National</strong> Expenditure<br />
Personnel information<br />
Table <strong>36</strong>.17 Companies Tribunal<br />
Posts status as 30 November 2011 Number of posts filled/planned for on funded establishment<br />
Current as at<br />
<strong>36</strong><br />
Number of posts<br />
on approved<br />
establishment<br />
Number of<br />
funded posts<br />
1 January 2012 Medium term estimate<br />
Number of<br />
vacant<br />
posts 2011/12 2012/13 2013/14 2014/15<br />
Tribunal Members 14 14 14 11 11 14 14<br />
Senior<br />
Management<br />
6 – 6 1 6 6 6<br />
Middle<br />
Management<br />
12 – 12 1 12 12 12<br />
Professionals 7 – 7 1 7 7 7<br />
Skilled 1 – 1 1 1 1 1<br />
Total 40 14 40 14 37 40 40<br />
The tribunal had an establishment of 40 posts, 14 of which will be funded. 11 tribunal members had been<br />
approved for appointment by 30 September 2011 <strong>and</strong> are expected to increase to 14 over the MTEF period. The<br />
tribunal expects to fill all 40 posts on its establishment over the MTEF period.<br />
The Estate Agency Affairs Board<br />
Overview: 2008/09 – 2014/15<br />
The Estate Agency Affairs Board was established by the Estate Agency Affairs Act (1976); the board is selffinancing.<br />
The board’s dual objectives are to maintain <strong>and</strong> promote the st<strong>and</strong>ard of conduct of estate agents <strong>and</strong><br />
to regulate their activities. The board has served as the statutory regulator of the estate agency industry for<br />
32 years. It is responsible for the administration of the Estate Agents Fidelity Fund, to which all estate agents<br />
make annual contributions. The board provides services to estate agents, <strong>and</strong> administers the qualifying<br />
examination for estate agents.<br />
Over the medium term, the board will pursue the following strategic initiatives: establish or outsource an<br />
inspectorate function for legislative compliance; increase public awareness of the professional status,<br />
qualifications <strong>and</strong> training st<strong>and</strong>ards of registered estate agents; <strong>and</strong> increase awareness among estate agents of<br />
the benefits of being a registered member of the board. The aim of these initiatives is to enhance compliance<br />
with legislation <strong>and</strong> coverage in the industry.<br />
Performance<br />
Averaging 14 days from the date of receipt of applications, the turnaround time on the issue of fidelity fund<br />
certificates has been on target since 2008/09. The turnaround time in addressing customer queries is expected to<br />
improve from an average of six days in 2010/11 to 5 days from date of receipt over the medium term. Annual<br />
inspections are expected to increase from 66 in 2010/11 to 1800 in 2012/13.<br />
The period within which appeals are resolved has been 3 months since 2008/09; this target is expected to be<br />
maintained. The board shall conduct annual customer surveys. Recoveries of debtors will be maintained at<br />
60 days due to the legal processes imposed by governing legislation in the recoveries process. At least<br />
20 per cent of the registered estate agents are expected to sit for <strong>and</strong> pass the professional designation<br />
examination.<br />
The board’s achievements in 2010/11 include issuing fidelity fund certificates to the 49 980 registered estate<br />
agents, <strong>and</strong> resolving <strong>and</strong> finalising 758 of the 1 597 complaints received. 839 of these complaints are being<br />
investigated further <strong>and</strong> 172 matters were referred to committees of inquiry of the board for adjudication. The<br />
board projects that these figures will increase in 2011/12. The board conducted 66 inspections in Gauteng,<br />
KwaZulu-Natal <strong>and</strong> Western Cape to address the issue of unregistered estate agents <strong>and</strong> illegal operators.<br />
The board is committed to intensifying its inspectorate programme by establishing internal personnel <strong>and</strong> a<br />
resourced inspectorate, with clear targets <strong>and</strong> milestones. In 2010/11, over 8 000 estate agents qualified to write<br />
the professional designation examination for both principal <strong>and</strong> non-principal estate agents, after having been<br />
certificated against levels four <strong>and</strong> five of the national qualifications framework.
<strong>Vote</strong> <strong>36</strong>: <strong>Trade</strong> <strong>and</strong> <strong>Industry</strong><br />
Selected performance indicators<br />
Table <strong>36</strong>.18 Estate Agency Affairs Board<br />
Indicator Programme/Activity/ Objective/ Project Past Current Projections<br />
Turnaround time in days<br />
on the issue of the<br />
fidelity fund certificate<br />
Turnaround time in days<br />
to addressing customer<br />
queries<br />
Number of inspections<br />
performed per year<br />
Time in months taken to<br />
deal with appeals<br />
Number of surveys<br />
conducted on customer<br />
satisfaction per year<br />
Number of days to<br />
recover claims<br />
Number of days to<br />
collect all debtors<br />
Percentage of new<br />
interns qualified by end<br />
of financial year<br />
2008/09 2009/10 2010/11 2011/12 2012/13 2013/14 2014/15<br />
Compliance 14 14 14 14 14 14 14<br />
Compliance 6 5 6 5 5 5 5<br />
Inspectorate 8 16 66 1 200 1 800 2 400 2 400<br />
Compliance 3 3 3 3 3 3 3<br />
Corporate services – 1 1 1 1 1 1<br />
Compliance – – 60 60 60 60 60<br />
Corporate services 60 60 60 60 60 60 60<br />
Education <strong>and</strong> training – – – 20%<br />
(6 298)<br />
Programmes/activities/objectives<br />
Table <strong>36</strong>.19 Estate Agency Affairs Board<br />
80<br />
(24 60)<br />
100%<br />
(31 200)<br />
100%<br />
(31 500)<br />
Audited outcome<br />
Revised<br />
estimate Medium-term estimate<br />
R thous<strong>and</strong><br />
2008/09 2009/10 2010/11 2011/12 2012/13 2013/14 2014/15<br />
Governance <strong>and</strong> strategy 4 271 5 579 5 915 9 063 10 496 11 259 12 047<br />
Compliance 2 855 8 937 13 050 15 738 27 890 29 842 31 931<br />
Education <strong>and</strong> training 1 613 2 832 4 700 7 779 6 047 6 470 6 923<br />
Corporate services 45 225 24 200 28 925 28 108 38 680 41 207 44 093<br />
Total expense 53 964 41 548 52 590 60 688 83 113 88 779 94 994<br />
The Estate Agency Affairs Board had a total budget of R60.7 million in 2011/12, of which 49.9 per cent was<br />
used for compensation of employees <strong>and</strong> 47.9 per cent for goods <strong>and</strong> services.<br />
Savings <strong>and</strong> cost effectiveness measures<br />
Although the board will be exp<strong>and</strong>ing to improve capacity, significant savings are expected as follows:<br />
R500 000 from consulting fees due to improved in-house capacity, R3.6 million in fruitless expenditure from<br />
insurance policies, <strong>and</strong> a R200 000 reduction in audit fees due to improved internal control systems.<br />
Expenditure estimates<br />
Table <strong>36</strong>.20 Estate Agency Affairs Board<br />
Statement of financial performance<br />
Audited outcome<br />
Revised<br />
estimate Medium-term estimate<br />
R thous<strong>and</strong> 2008/09 2009/10 2010/11 2011/12 2012/13 2013/14 2014/15<br />
Revenue<br />
Non-tax revenue 53 838 55 728 60 610 59 712 83 625 88 998 95 228<br />
Sale of goods <strong>and</strong> services other than<br />
capital assets<br />
of which:<br />
45 466 46 162 47 476 51 437 74 446 79 657 85 233<br />
Sales by market establishments 45 466 46 162 47 476 51 437 74 446 79 657 85 233<br />
Other non-tax revenue 8 372 9 566 13 134 8 275 9 179 9 341 9 995<br />
Total revenue<br />
Expenses<br />
53 838 55 728 60 610 59 712 83 625 88 998 95 228<br />
Current expenses 49 780 40 253 52 387 60 688 83 113 88 779 94 994<br />
Compensation of employees 24 038 20 533 31 871 30 281 51 206 54 790 58 626<br />
Goods <strong>and</strong> services 24 251 17 652 18 453 29 065 30 213 32 328 34 591<br />
37
2012 Estimates of <strong>National</strong> Expenditure<br />
Table <strong>36</strong>.20 Estate Agency Affairs Board (continued)<br />
Statement of financial<br />
performance Audited outcome<br />
Revised<br />
estimate Medium-term estimate<br />
R thous<strong>and</strong> 2008/09 2009/10 2010/11 2011/12 2012/13 2013/14 2014/15<br />
Depreciation 1 491 1 722 1 979 1 342 1 694 1 660 1 777<br />
Interest, dividends <strong>and</strong> rent on<br />
l<strong>and</strong><br />
– 346 84 – – – –<br />
Transfers <strong>and</strong> subsidies 4 184 1 295 203 – – – –<br />
Total expenses 53 964 41 548 52 590 60 688 83 113 88 779 94 994<br />
Surplus / (Deficit) (126) 14 180 8 020 (976) 512 219 234<br />
Statement of financial position<br />
Carrying value of assets 23 698 23 486 3 353 3 020 3 668 2 811 1 893<br />
of which:<br />
Acquisition of assets 1 515 1 548 685 1 009 2 342 803 859<br />
Investments 73 326 71 710 74 838 76 273 81 823 78 614 69 785<br />
Inventory 357 706 223 506 541 541 563<br />
Receivables <strong>and</strong> prepayments 617 1 259 1 976 13 633 11 328 11 220 11 104<br />
Cash <strong>and</strong> cash equivalents 4 176 15 502 4 490 28 459 25 556 30 654 41 483<br />
Defined benefit plan assets 843 5 280 39 063 2 <strong>36</strong>9 2 <strong>36</strong>9 2 535 2 712<br />
Total assets 103 017 117 943 123 943 124 260 125 285 126 375 127 540<br />
Accumulated surplus / (deficit) 81 795 86 177 94 196 93 221 93 731 93 950 94 184<br />
Capital <strong>and</strong> reserves – 9 775 9 775 9 775 9 775 9 775 9 775<br />
Finance lease – 455 286 171 – – –<br />
<strong>Trade</strong> <strong>and</strong> other payables 10 049 9 119 6 254 7 104 7 601 7 479 7 349<br />
Provisions 11 173 12 417 13 432 13 989 14 178 15 170 16 232<br />
Total equity <strong>and</strong> liabilities 103 017 117 943 123 943 124 260 125 285 126 374 127 541<br />
Expenditure trends<br />
The Estate Agency Affairs Board generates revenue from fees <strong>and</strong> contributions from registered estate agents. It<br />
does not receive any transfers from government. Revenue increased from R53.8 million in 2008/09 to<br />
R59.7 million in 2011/12, at an average annual rate of 3.5 per cent, due to increases in the number of estate<br />
agents <strong>and</strong> recovery in the real estate market. Over the medium term, revenue is expected to increase to<br />
R95.2 million, at an average annual rate of 16.8 per cent, due to increased management fees charged for<br />
managing the fidelity fund.<br />
The spending focus over the MTEF period will be on enhancing compliance with legislation in the industry.<br />
Expenditure increased from R54 million in 2008/09 to R60.7 million in 2011/12, at an average annual rate of<br />
4 per cent, due to adjustments for inflation. Over the medium term, expenditure is expected to increase to<br />
R95 million, at an average annual rate of 16.1 per cent, due to the enhancement of the board’s operational<br />
capacity, which includes the establishment of the inspectorate division in 2012/13, at an estimated cost of<br />
R6.3 million.<br />
The board investigates high level cases. Inspections will have increased from 66 in 2010/11 to 1 200 in 2011/12,<br />
<strong>and</strong> are projected to double to 2 400 in 2014/15. The increase in inspections has resulted in the need to enhance<br />
capacity in core function areas such as registrations, education <strong>and</strong> training, <strong>and</strong> support services such as<br />
marketing <strong>and</strong> communications.<br />
38
Personnel information<br />
Table <strong>36</strong>.22 Estate Agency Affairs Board<br />
<strong>Vote</strong> <strong>36</strong>: <strong>Trade</strong> <strong>and</strong> <strong>Industry</strong><br />
Personnel post status as at 30 September 2011 Number of personnel posts filled / planned for on funded establishment<br />
Number of<br />
posts on<br />
approved<br />
establishment<br />
Number of<br />
funded posts<br />
Number<br />
of vacant<br />
posts<br />
Actual Mid- year 1 Medium-term estimate<br />
2008/09 2009/10 2010/11 2011/12 2012/13 2013/14 2014/15<br />
Executive board<br />
members<br />
15 15 4 15 11 11 11 15 15 15<br />
Executive<br />
management<br />
5 4 1 5 4 4 4 5 5 5<br />
Senior<br />
management<br />
6 5 1 4 5 5 5 6 6 6<br />
Middle<br />
management<br />
8 7 1 6 7 7 7 8 8 8<br />
Professionals 5 4 1 4 4 4 4 5 5 5<br />
Skilled 41 41 – 41 45 41 41 41 41 41<br />
Semi-skilled 5 5 – 3 3 5 5 5 5 5<br />
Total 85 81 8 78 79 77 77 85 85 85<br />
Compensation<br />
(R thous<strong>and</strong>)<br />
24 038 20 533 31 871 30 281 51 206 54 790 58 626<br />
Unit cost<br />
(R thous<strong>and</strong>)<br />
1. As at 30 September 2011.<br />
308 260 414 393 602 645 690<br />
The board had an approved establishment of 85 posts as at 30 September 2011. Over the medium term, the<br />
number of filled posts is expected to increase from 77 to 85, as the board continues to build capacity. There<br />
were 8 vacancies as at 30 September 2011, mainly executive board members. The ratio of support staff to line<br />
staff is 0.7:1<br />
Export Credit Insurance Corporation of South Africa<br />
Overview: 2008/09 – 2014/15<br />
The Export Credit Insurance Corporation of South Africa was established in terms of the Export Credit <strong>and</strong><br />
Foreign Investments Insurance Act (1957) to facilitate <strong>and</strong> encourage South Africa’s export trade by<br />
underwriting export credit loans <strong>and</strong> investments abroad. The corporation evaluates export credit <strong>and</strong> foreign<br />
investment risks, <strong>and</strong> provides export credit <strong>and</strong> foreign investment insurance cover on behalf of the South<br />
African government. The corporation is the government’s primary source of export credit <strong>and</strong> fills the market<br />
gap in the provision of export credit <strong>and</strong> investment insurance cover for political <strong>and</strong> commercial risk<br />
considered unacceptable by the private insurance sector.<br />
The corporation administers interest make-up schemes on behalf of the department. The scheme comprises<br />
agreements entered into between government <strong>and</strong> financial institutions, which allow South African exporters to<br />
offer term finance at internationally competitive interest rates by subsidising the interest that the South African<br />
exporter pays. The scheme generated R5.6 billion in exports between 2005/06 <strong>and</strong> 2010/11, while the actual<br />
cost to the fiscus for enabling these exports was R9<strong>36</strong> million. Based on these figures, for every R1 made<br />
available by the fiscus through the interest make-up scheme, almost R6 was mobilised by the corporation,<br />
through its insurance cover <strong>and</strong> in conjunction with the exporters <strong>and</strong> financial institutions, to generate exports<br />
from South Africa. The impact of the scheme <strong>and</strong> the corporation’s insurance cover was not only in South<br />
Africa but also in 16 other, mostly African countries, including R994 million for the Democratic Republic of the<br />
Congo <strong>and</strong> R890 million for Malawi.<br />
The focus over the medium term is to: increase credit <strong>and</strong> investment insurance <strong>and</strong> demonstrate its economic<br />
impact at home <strong>and</strong> in the host country; be a key vehicle in implementing the government’s African economic<br />
agenda; <strong>and</strong> be a key agency for tapping into economic opportunities offered by the Brazil-Russia-India-China-<br />
South Africa group of countries. To achieve this, the corporation will: raise its profile <strong>and</strong> enhance collaboration<br />
with other national development finance institutions, enhance capacity, encourage innovation <strong>and</strong> pursue active<br />
business development initiatives, re-orientate the business culture to a stronger focus on customers, improve<br />
organisational <strong>and</strong> operational efficiencies, <strong>and</strong> develop a strong focus on effective performance management<br />
39
2012 Estimates of <strong>National</strong> Expenditure<br />
while aligning rewards accordingly. The corporation’s board has approved a strategic review <strong>and</strong> identified new<br />
key performance indicators.<br />
In 2010/11, the corporation experienced a record year in terms of the number <strong>and</strong> value of new insurance<br />
applications approved. The value of approved insurance applications grew by 61 per cent from R3.5 billion in<br />
2009/10. Most of these applications were for infrastructure projects on the African continent, with Zimbabwe<br />
having the largest share at R2.2 billion. The value of signed insurance policies, which represents committed<br />
insurance cover, grew by 35.4 per cent from 2008/09 to 2014/15. The corporation also concluded a<br />
memor<strong>and</strong>um of underst<strong>and</strong>ing with the Export-Import Bank of the United States, the official credit export<br />
agency of the United States. This is expected to provide an opportunity for both organisations to exchange notes<br />
<strong>and</strong> to benchmark programmes.<br />
Selected performance indicators<br />
Table <strong>36</strong>.22 Export Credit Insurance Corporation of South Africa<br />
Indicator Activity/Objective/Programme/Project Past 1 Current Projections<br />
Value of approved<br />
insurance<br />
applications per year<br />
Value of signed<br />
insurance policies per<br />
year<br />
Value of loans<br />
disbursed <strong>and</strong>/or<br />
investment insurance<br />
exposures declared<br />
per year<br />
Number of<br />
cooperation<br />
agreements or<br />
arrangements<br />
initiated with export<br />
credit agencies or<br />
development finance<br />
institutions in Africa,<br />
Middle East, other<br />
members of Brazil-<br />
Russia-India-China-<br />
South Africa group of<br />
countries <strong>and</strong> other<br />
developing nations<br />
per year<br />
Number of the<br />
corporation’s product<br />
presentations or<br />
awareness sessions<br />
held per year with<br />
export promotion<br />
agencies <strong>and</strong>/or with<br />
economic<br />
development<br />
agencies or through<br />
conferences in the<br />
various provinces in<br />
South Africa<br />
Number of provinces<br />
in which a print media<br />
advertising campaign<br />
was held per year<br />
The single largest<br />
country exposure as a<br />
percentage of the<br />
corporations’ total<br />
insurance portfolio not<br />
exceeding the target<br />
of practices<br />
40<br />
Facilitate export trade <strong>and</strong> investment<br />
outside South Africa<br />
Facilitate export trade <strong>and</strong> investment<br />
outside South Africa<br />
Facilitate export trade <strong>and</strong> investment<br />
outside South Africa<br />
Build mutually beneficial local, regional<br />
<strong>and</strong> global relations to advance South<br />
Africa’s trade <strong>and</strong> economic development<br />
objective<br />
Promote a professional, competitive <strong>and</strong><br />
customer focused workforce that ensures<br />
an effective <strong>and</strong> efficient service to our<br />
customers<br />
Promote a professional, competitive <strong>and</strong><br />
customer focused workforce that ensures<br />
an effective <strong>and</strong> efficient service to our<br />
customers<br />
Create an enterprise wide risk awareness<br />
<strong>and</strong> effective corporate governance <strong>and</strong><br />
risk management practices<br />
1. No past data is available, as new strategic targets have been set post 2010/11.<br />
2008/09 2009/10 2010/11 2011/12 2012/13 2013/14 2014/15<br />
R1.5bn R3.5bn R5.7bn R5.1bn R5.1bn R5.8bn R6.2bn<br />
R372.7m R1bn R2.6bn R1.4bn R1.7bn R1.9bn R2.3bn<br />
R439.1m R1.1bn R1.2bn – R1.5bn R1.7bn R1.9bn<br />
– – 1 2 2 2 2<br />
– – – 9 12 15 18<br />
– – – – 2 4 9<br />
32% 38% <strong>36</strong>% 35% 34% 32% 30%
Programmes/activities/objectives<br />
Table <strong>36</strong>.23 Export Credit Insurance Corporation of South Africa<br />
<strong>Vote</strong> <strong>36</strong>: <strong>Trade</strong> <strong>and</strong> <strong>Industry</strong><br />
Audited outcome<br />
Revised<br />
estimate<br />
Medium-term estimate<br />
R thous<strong>and</strong> 2008/09 2009/10 2010/11 2011/12 2012/13 2013/14 2014/15<br />
Facilitate export trade <strong>and</strong><br />
investment outside South Africa<br />
384 602 1<strong>36</strong> 371 139 055 141 546 241 386 238 411 222 459<br />
Build mutually beneficial local,<br />
regional <strong>and</strong> global relations to<br />
advance South Africa’s trade <strong>and</strong><br />
economic development objective<br />
353 339 271 535 570 606 643<br />
Promote a professional,<br />
competitive <strong>and</strong> customer focused<br />
workforce that ensures an<br />
effective <strong>and</strong> efficient service to<br />
our customers<br />
15 417 21 200 20 925 13 082 14 480 16 048 17 343<br />
Create an enterprise wide risk<br />
awareness <strong>and</strong> effective corporate<br />
governance <strong>and</strong> risk management<br />
practices<br />
212 430 211 270 241 561 41 095 55 616 68 632 76 009<br />
Consistently utilise sound<br />
business environment <strong>and</strong> social<br />
principles, applying international<br />
best practice<br />
29 911 158 440 112 016 180 662 103 193 105 371 114 329<br />
Total expense 642 713 527 620 513 828 376 920 415 245 429 068 430 783<br />
The Export Credit Insurance Corporation of South Africa had a budget of R376.9 million in 2011/12, of which<br />
46.1 per cent was spent on goods <strong>and</strong> services.<br />
Savings <strong>and</strong> cost effectiveness measures<br />
The corporation is continuing with the implementation of cost reduction measures implemented in 2008/09 on<br />
entertainment <strong>and</strong> travelling expenses by introducing assessments on travelling needs <strong>and</strong> reviewing the<br />
business impact resulting from entertainment expenses. The procurement policy implemented in that year<br />
requires that each purchase be subject to obtaining competitive prices. The impact of these measures is reflected<br />
in the operational expenses, excluding salaries <strong>and</strong> commission, to income ratio, which remains at 3 per cent<br />
over the MTEF period.<br />
Expenditure estimates<br />
Table <strong>36</strong>.24 Export Credit Insurance Corporation of South Africa<br />
Statement of financial performance<br />
Audited outcome<br />
Revised<br />
estimate Medium-term estimate<br />
R thous<strong>and</strong> 2008/09 2009/10 2010/11 2011/12 2012/13 2013/14 2014/15<br />
Revenue<br />
Non-tax revenue 579 911 763 339 805 705 714 <strong>36</strong>5 588 145 588 551 602 2<strong>36</strong><br />
Sale of goods <strong>and</strong> services other than<br />
capital assets<br />
of which:<br />
305 090 290 349 388 410 373 149 290 000 300 000 310 000<br />
Sales by market establishments 305 090 290 349 388 410 373 149 290 000 300 000 310 000<br />
Other non-tax revenue 274 821 472 990 417 295 341 216 298 145 288 551 292 2<strong>36</strong><br />
Transfers received 137 265 122 400 120 488 121 517 97 616 110 293 110 370<br />
Total revenue 717 176 885 739 926 193 835 882 685 761 698 844 712 606<br />
Expenses<br />
Current expenses 613 927 383 868 403 011 197 486 313 404 325 155 318 019<br />
Compensation of employees 19 910 18 135 23 462 23 526 25 9<strong>36</strong> 27 993 30 048<br />
Goods <strong>and</strong> services 593 888 351 848 379 300 173 728 286 868 295 962 286 471<br />
Depreciation 108 177 246 232 600 1 200 1 500<br />
Interest, dividends <strong>and</strong> rent on l<strong>and</strong> 21 13 708 3 – – – –<br />
Total expenses 642 713 527 620 513 828 376 920 415 245 429 068 430 783<br />
Surplus / (Deficit) 74 463 358 119 412 <strong>36</strong>5 458 962 270 516 269 776 281 823<br />
41
2012 Estimates of <strong>National</strong> Expenditure<br />
Table <strong>36</strong>.24 Export Credit Insurance Corporation of South Africa (continued)<br />
Audited outcome<br />
Revised<br />
estimate Medium-term estimate<br />
R thous<strong>and</strong><br />
Statement of financial position<br />
2008/09 2009/10 2010/11 2011/12 2012/13 2013/14 2014/15<br />
Carrying value of assets 280 804 598 481 1 831 2 531 2 031<br />
of which:<br />
Acquisition of assets 268 810 92 115 1 950 1 900 1 000<br />
Investments 1 604 316 1 284 001 1 529 942 1 663 340 1 652 154 1 821 278 2 007 035<br />
Receivables <strong>and</strong> prepayments 191 623 182 454 235 616 191 320 181 320 231 320 241 320<br />
Cash <strong>and</strong> cash equivalents 1 283 560 1 303 586 1 396 374 1 799 153 2 167 755 2 387 773 2 628 634<br />
Taxation 123 029 21 525 4 020 1 000 3 000 4 000 2 000<br />
Total assets 3 202 808 2 792 370 3 166 550 3 655 294 4 006 060 4 446 902 4 881 020<br />
Accumulated surplus / (deficit) 1 169 434 1 528 900 1 918 111 2 377 073 2 647 588 2 917 <strong>36</strong>3 3 199 186<br />
Capital <strong>and</strong> reserves 598 388 409 066 268 509 260 163 258 668 259 668 260 668<br />
<strong>Trade</strong> <strong>and</strong> other payables 31 954 18 858 5 258 5 574 5 905 6 262 6 637<br />
Taxation 55 069 6 056 24 072 102 182 20 633 32 992 38 308<br />
Provisions 1 347 963 829 490 950 600 910 302 1 073 266 1 230 617 1 376 221<br />
Total equity <strong>and</strong> liabilities 3 202 808 2 792 370 3 166 550 3 655 294 4 006 060 4 446 902 4 881 020<br />
Expenditure trends<br />
The entity mainly generates revenue from insurance premiums <strong>and</strong> investment income. Revenue increased from<br />
R717.2 million in 2008/09 to R835.9 million in 2011/12, at an average annual rate of 5.2 per cent, due to<br />
investment income, foreign exchange gain <strong>and</strong> premiums. Over the medium term, revenue is expected to<br />
decrease to R712.6 million, at an average annual rate of 5.2 per cent, due to transfers made for the interest<br />
make-up scheme.<br />
The spending over the medium term will be on extending medium <strong>and</strong> long term export credit <strong>and</strong> investment<br />
insurance by underwriting export credit loans <strong>and</strong> investments outside South Africa, including portfolio <strong>and</strong> risk<br />
management.<br />
Expenditure decreased from R642.7 million in 2008/09 to R376.9 million in 2011/12, at an average annual rate<br />
of 16.3 per cent. The decline in expenditure is as a result of a reduction in claims, which resulted in a decrease<br />
in provision for claims. The reduction in claims was caused by the adverse economic climate. Over the medium<br />
term, expenditure is expected to increase to R430.8 million, at an average annual rate of 4.6 per cent, in line<br />
with inflation projections.<br />
Personnel information<br />
Table <strong>36</strong>.25 Export Credit Insurance Corporation of South Africa<br />
42<br />
Personnel post status as at 30 September 2011 Number of personnel posts filled / planned for on funded establishment<br />
Number of posts<br />
on approved<br />
establishment<br />
Number of<br />
funded posts<br />
Number of<br />
vacant posts<br />
Actual Mid- year1 Medium-term estimate<br />
2008/09 2009/10 2010/11 2011/12 2012/13 2013/14 2014/15<br />
Executive board<br />
members<br />
1 1 – 1 1 1 1 – – –<br />
Executive<br />
management<br />
5 5 – 3 2 4 5 5 5 5<br />
Senior<br />
management<br />
6 6 – 8 3 5 5 6 6 6<br />
Professionals 15 17 2 22 23 17 17 18 19 20<br />
Skilled 6 6 – 4 6 6 6 6 6 6<br />
Total 33 35 2 38 35 33 34 <strong>36</strong> 37 38<br />
Compensation<br />
(R thous<strong>and</strong>)<br />
19 910 18 135 23 462 23 526 25 9<strong>36</strong> 27 993 30 048<br />
Unit cost<br />
(R thous<strong>and</strong>)<br />
1. As at 30 September 2011.<br />
524 518 711 692 720 757 791<br />
As at 30 September 2011, the corporation had an establishment of 33 posts, 35 of which were funded. The<br />
number of posts filled decreased from 38 in 2008/09 to 34 in 2011/12, <strong>and</strong> is expected to grow to 38 over the
<strong>Vote</strong> <strong>36</strong>: <strong>Trade</strong> <strong>and</strong> <strong>Industry</strong><br />
medium term as a result of exp<strong>and</strong>ed business operations. As at 30 September 2011, there were 2 vacancies,<br />
both at the professional level. The ratio of support staff to line staff is 5:2.<br />
<strong>National</strong> Consumer Commission<br />
Overview: 2008/09 – 2014/15<br />
The <strong>National</strong> Consumer Commission was established in terms of the Consumer Protection Act (2008). The aim<br />
of the commission is to promote a fair, accessible <strong>and</strong> sustainable marketplace for consumer products <strong>and</strong><br />
services; establish national norms <strong>and</strong> st<strong>and</strong>ards relating to consumer protection; provide for improved st<strong>and</strong>ards<br />
of consumer information; prohibit certain unfair marketing <strong>and</strong> business practices; promote responsible<br />
consumer behaviour; <strong>and</strong> promote a consistent legislative <strong>and</strong> enforcement framework relating to consumer<br />
transactions <strong>and</strong> agreements. It was established on 1 April 2011 with a budget of R33 million.<br />
The commission’s medium term objectives are to: protect consumers from hazards through advocacy education<br />
<strong>and</strong> awareness; improve consumer redress as envisaged in the Consumer Protection Act; protect consumers<br />
from unethical business practices <strong>and</strong> misconduct through law enforcement <strong>and</strong> compliance; conduct research<br />
for policy, legislative <strong>and</strong> regulatory improvement; deliver on customer <strong>and</strong> stakeholder expectations <strong>and</strong> those<br />
of st<strong>and</strong>ing advisory committees; ensure the establishment of a functional organisation; achieve the m<strong>and</strong>ate of<br />
the commission with an optimal staff complement; implement an organisation wide performance management<br />
system; create the br<strong>and</strong> of the commission as the voice of the South African consumer; provide an effective<br />
ICT infrastructure <strong>and</strong> network; <strong>and</strong> implement an effective <strong>and</strong> efficient IT <strong>and</strong> financial management system.<br />
The commission provides professional services at no cost.<br />
Performance<br />
The <strong>National</strong> Consumer Commission has a set a complaints resolution target of 65 per cent. The commission<br />
also undertakes proactive investigations in industries where consumers are victims of abuse. It intends to target<br />
at least one industry each year. The commission plans at least 1 annual consumer satisfaction survey.<br />
Selected performance indicators<br />
Table <strong>36</strong>.26 <strong>National</strong> Consumer Commission<br />
Indicator Programme/Activity/Objective/Project Past 1 Current Projections<br />
Number of themes on consumer<br />
protection accessed online per<br />
year<br />
Percentage of consumer<br />
complaints timeously resolved<br />
Number of industry sectors<br />
identified for investigations per<br />
year<br />
2008/09 2009/10 2010/11 2011/12 2012/13 2013/14 2014/15<br />
Consumer education <strong>and</strong> awareness – – – 2 2 2 5<br />
Resolving consumer complaints – – – 60% 70% 80% 98%<br />
Providing legal services – – – 3 3 3 3<br />
Research reports on consumer<br />
behaviour <strong>and</strong> protection per<br />
year<br />
Research analysis – – – 1 1 1 1<br />
Percentage unavailability of a<br />
functional ICT systems2 ICT management – – – 80% 100% – –<br />
1. The commission became operational in April 2011, thus no historical data is available.<br />
2. The commission plans to establish <strong>and</strong> implement ICT systems in 2011/12 <strong>and</strong> 2012/13, then conduct operations <strong>and</strong> maintenance on the systems in 2013/14 <strong>and</strong><br />
2014/15.<br />
Programmes/activities/objectives<br />
Table <strong>36</strong>.27 <strong>National</strong> Consumer Commission<br />
Audited outcome<br />
Revised<br />
estimate Medium-term estimate<br />
R thous<strong>and</strong><br />
2008/09 2009/10 2010/11 2011/12 2012/13 2013/14 2014/15<br />
Consumer education <strong>and</strong><br />
awareness<br />
– – – 1 560 300 600 900<br />
Resolving consumer complaint – – – 10 9<strong>36</strong> 13 861 14 620 14 167<br />
Providing legal services – – – 4 198 5 929 7 310 5 584<br />
43
2012 Estimates of <strong>National</strong> Expenditure<br />
Table <strong>36</strong>.27 <strong>National</strong> Consumer Commission (continued)<br />
R thous<strong>and</strong><br />
44<br />
Audited outcome<br />
Revised<br />
estimate Medium-term estimate<br />
2008/09 2009/10 2010/11 2011/12 2012/13 2013/14 2014/15<br />
Research analysis – – – 300 – – –<br />
ICT Management – – – 6 498 8 129 8 610 9 083<br />
Financial Management – – – 4 498 5 720 6 010 5 083<br />
Human Capital Management – – – 4 998 7 638 6 714 7 683<br />
Total expense<br />
– – –<br />
32 988 41 577 43 864 42 500<br />
The <strong>National</strong> Consumer Commission had a total budget of R33 million in 2011/12, of which 71.7 per cent was<br />
used for compensation of employees.<br />
Savings <strong>and</strong> cost effectiveness measures<br />
No savings were effected. However, the commission will continuously monitor expenditure on a monthly basis<br />
to identify costs that can be reduced.<br />
Expenditure estimates<br />
Table <strong>36</strong>.28 <strong>National</strong> Consumer Commission<br />
Statement of financial<br />
performance<br />
R thous<strong>and</strong><br />
Revenue<br />
Audited outcome<br />
Revised<br />
estimate Medium-term estimate<br />
2008/09 2009/10 2010/11 2011/12 2012/13 2013/14 2014/15<br />
Non-tax revenue – – – – – – –<br />
Transfers received – – – 32 988 41 577 43 864 42 500<br />
Total revenue – – – 32 988 41 577 43 864 42 500<br />
Expenses<br />
Current expenses – – – 32 988 41 577 43 864 42 500<br />
Compensation of employees – – – 23 654 22 547 24 351 25 510<br />
Goods <strong>and</strong> services – – – 8 854 18 550 18 923 16 530<br />
Depreciation – – – 480 480 590 460<br />
Total expenses – – – 32 988 41 577 43 864 42 500<br />
Surplus / (Deficit) – – – – – – –<br />
Statement of financial position<br />
Carrying value of assets – – – 23 310 15 066 5 195 2 <strong>36</strong>6<br />
of which:<br />
Acquisition of assets – – – 33 320 2 550 1 325 –<br />
Receivables <strong>and</strong> prepayments – – – 32 900 42 600 43 900 45 217<br />
Total assets – – – 56 210 57 666 49 095 47 583<br />
Accumulated surplus/ (deficit) – – – 39 934 34 435 37 391 32 146<br />
<strong>Trade</strong> <strong>and</strong> other payables – – – 11 295 18 250 6 723 10 456<br />
Provisions – – – 4 981 4 981 4 981 4 981<br />
Total equity <strong>and</strong> liabilities – – – 56 210 57 666 49 095 47 583<br />
Expenditure trends<br />
The commission’s main source of revenue is transfer payments received from the department. Transfers<br />
received <strong>and</strong> expenditure are expected to increase from R33 million in 2011/12 to R42.5 million in 2014/15, at<br />
an average annual rate of 8.8 per cent, as the entity establishes itself.
Personnel information<br />
Table <strong>36</strong>.30 <strong>National</strong> Consumer Commission<br />
<strong>Vote</strong> <strong>36</strong>: <strong>Trade</strong> <strong>and</strong> <strong>Industry</strong><br />
Personnel post status as at 30 September 2011 Number of personnel posts filled / planned for on funded establishment<br />
Number of<br />
posts on<br />
approved<br />
establishment<br />
Number of<br />
funded<br />
posts<br />
Number of<br />
vacant osts<br />
Actual Mid-year1 Medium-term estimate<br />
2008/09 2009/10 2010/11 2011/12 2012/13 2013/14 2014/15<br />
Executive<br />
management<br />
7 7 – – – – 2 7 9 9<br />
Senior<br />
management<br />
23 23 – – – – 5 12 12 12<br />
Middle<br />
management<br />
16 16 – – – – 7 22 22 22<br />
Professionals 41 41 – – – – 12 12 12 12<br />
Skilled 32 32 – – – – 25 21 19 19<br />
Semi-skilled 12 12 – – – – 9 21 21 21<br />
Total 131 131 – – – – 60 95 95 95<br />
Compensation<br />
(R thous<strong>and</strong>)<br />
– – – 23 654 22 547 24 351 25 510<br />
Unit cost<br />
(R thous<strong>and</strong>)<br />
1. As at 30 September 2011.<br />
– – – 394 237 256 269<br />
The commission began operating in 2011/12. As at 30 September 2011, the commission has an establishment of<br />
131 posts, of which 60 were filled.<br />
<strong>National</strong> Consumer Tribunal<br />
Overview: 2008/09 – 2014/15<br />
The <strong>National</strong> Consumer Tribunal was established in 2006 in terms of the <strong>National</strong> Credit Act (2005). As from<br />
1 April 2011, the m<strong>and</strong>ate of the tribunal was exp<strong>and</strong>ed to also include the Consumer Protection Act (2008). As<br />
an independent body, the tribunal’s m<strong>and</strong>ate is to hear <strong>and</strong> decide on cases involving consumers, credit<br />
providers, debt counsellors <strong>and</strong> credit bureaus. It is also responsible for reviewing decisions made by the<br />
<strong>National</strong> Credit Regulator <strong>and</strong> the <strong>National</strong> Consumer Commission.<br />
The tribunal’s strategic objectives over the medium term include increasing its accessibility, <strong>and</strong> managing<br />
cases effectively. Through improved process management <strong>and</strong> developing a culture of fair adjudication, the<br />
tribunal aims to position itself as an authoritative adjudication body.<br />
Until 2009/10, the tribunal’s focus was on: providing input to the department on developing <strong>and</strong> finalising the<br />
rules of procedure for matters before the tribunal, <strong>and</strong> on the Consumer Protection Act; building capacity <strong>and</strong><br />
related initiatives; infrastructure development; <strong>and</strong> creating awareness of the act. The tribunal prepared for the<br />
implementation of the Consumer Protection Act (2008) on 1 April 2011 by ensuring that appropriate resources<br />
were available to facilitate the process, <strong>and</strong> is increasing its resources to deal with the extended m<strong>and</strong>ate <strong>and</strong><br />
skills requirements brought about by the new legislation.<br />
Performance<br />
In 2010/11, the tribunal experienced a major increase in the number of cases referred. The tribunal was able to<br />
meet the majority of its targets, as set down in the strategic goals <strong>and</strong> objectives of its business plan. The<br />
tribunal achieved this by reviewing its adjudication processes to implement improved efficiencies, <strong>and</strong> by<br />
increasing dem<strong>and</strong>s on tribunal members. 31 stakeholder groups were convened in terms of the national credit<br />
<strong>and</strong> consumer protection acts. 75 per cent of cases were finalised during set down periods. The tribunal achieved<br />
a 100 per cent compliance level in maintaining <strong>and</strong> ensuring sound monitoring, evaluation <strong>and</strong> reporting<br />
processes to enhance organisational performance. The highlights of the previous year include the finalisation of<br />
the service charter; the introduction of the fraud hotline, <strong>and</strong> the filling of 72 per cent of posts at 31 March 2011.<br />
The tribunal has also made considerable progress on the implementation of the information communication<br />
technology strategy <strong>and</strong> plan, <strong>and</strong> on several aspects of the human resources strategy <strong>and</strong> plan. The main focus<br />
will be on increasing access to the tribunal, informing stakeholders about the activities of the tribunal, <strong>and</strong><br />
improving efficiencies <strong>and</strong> turnaround times.<br />
45
2012 Estimates of <strong>National</strong> Expenditure<br />
Selected performance indicators<br />
Table <strong>36</strong>.30 <strong>National</strong> Consumer Tribunal<br />
Indicator Activity/ Objective/ Programme/ Project Past 1 Current Projections<br />
2008/09 2009/10 2010/11 2011/12 2012/13 2013/14 2014/15<br />
Percentage of cases<br />
adjudicated2 Cases effectively <strong>and</strong> efficiently<br />
100% 100% 100% – – – –<br />
adjudicated<br />
Number of alternative access<br />
points for tribunal documents<br />
or venues for hearings.<br />
Increased accessibility of the tribunal – – – 4 4 8 12<br />
Number of press releases<br />
issued <strong>and</strong> marketing<br />
communication initiatives<br />
undertaken<br />
Increased accessibility of the tribunal – – 10 20 25 30 35<br />
Average number of days for Cases effectively <strong>and</strong> efficiently<br />
– – – 5 5 5 5<br />
communicating with filing<br />
parties<br />
adjudicated<br />
Average number of days for Cases effectively <strong>and</strong> efficiently<br />
– – – 10 10 10 10<br />
communicating judgments to<br />
parties<br />
adjudicated<br />
Average number of days for<br />
payment of undisputed<br />
creditors’ invoices<br />
Sound organisational management – – – – 30 30 30<br />
Percentage of operational<br />
budget spent per year<br />
Sound organisational management – – – 95% 98% 98% 98%<br />
1. Due to the shift of strategic focus from a start-up operation to a more matured <strong>and</strong> established organisation, most selected performance indicators over the medium term<br />
are new <strong>and</strong> therefore have no data available before 2011/12.<br />
2. Measurement of this performance indicator will be discontinued, as the tribunal will always adjudicate 100 per cent of all its cases. Other, new indicators that better<br />
reflect <strong>and</strong> measure the tribunal’s performance, have been introduced.<br />
Programmes/activities/objectives<br />
Table <strong>36</strong>.31 <strong>National</strong> Consumer Tribunal<br />
Audited outcome<br />
Revised<br />
estimate Medium-term estimate<br />
R thous<strong>and</strong> 2008/09 2009/10 2010/11 2011/12 2012/13 2013/14 2014/15<br />
All the strategic objectives 12 604 18 118 20 603 29 175 33 805 <strong>36</strong> 575 38 561<br />
Total expense 12 604 18 118 20 603 29 175 33 805 <strong>36</strong> 575 38 561<br />
The <strong>National</strong> Consumer Tribunal had a total budget of R29.2 million in 2011/12, of which 66 per cent was used<br />
for goods <strong>and</strong> services.<br />
Savings <strong>and</strong> cost effectiveness measures<br />
The tribunal has made changes to its systems to promote efficiency. By increasing the resources available to<br />
tribunal members <strong>and</strong> enhancing technological aspects, it was possible to increase the average number of<br />
consent order applications attributable to a single tribunal member from eight to twelve. Considering consent<br />
order applications in chambers has also resulted in efficiency savings in travel, accommodation <strong>and</strong> recording<br />
services associated with the hearings. Improved procurement processes have allowed the tribunal to negotiate<br />
more competitive prices <strong>and</strong> value for money from a wider pool of suppliers. In 2010/11, the tribunal began<br />
developing an improved case management system <strong>and</strong> a space planning project that will further improve<br />
efficiencies <strong>and</strong> productivity of staff. This will be implemented during 2012/13.<br />
46
Expenditure estimates<br />
Table <strong>36</strong>.32 <strong>National</strong> Consumer Tribunal<br />
Statement of financial performance<br />
Audited outcome<br />
<strong>Vote</strong> <strong>36</strong>: <strong>Trade</strong> <strong>and</strong> <strong>Industry</strong><br />
Revised<br />
estimate Medium-term estimate<br />
R thous<strong>and</strong> 2008/09 2009/10 2010/11 2011/12 2012/13 2013/14 2014/15<br />
Revenue<br />
Non-tax revenue 344 230 514 646 770 795 825<br />
Sale of goods <strong>and</strong> services other than<br />
capital assets<br />
of which:<br />
8 40 138 100 120 140 160<br />
Administration fees 8 40 138 100 120 140 160<br />
Other non-tax revenue 3<strong>36</strong> 190 376 546 650 655 665<br />
Transfers received 11 392 17 869 22 059 28 833 33 035 35 780 37 7<strong>36</strong><br />
Total revenue 11 7<strong>36</strong> 18 099 22 573 29 479 33 805 <strong>36</strong> 575 38 561<br />
Expenses<br />
Current expenses 12 604 18 118 20 603 29 175 33 805 <strong>36</strong> 575 38 561<br />
Compensation of employees 3 189 5 215 5 378 9 191 13 825 16 998 16 585<br />
Goods <strong>and</strong> services 8 899 12 207 14 604 19 262 17 514 16 998 19 221<br />
Depreciation 423 591 527 678 2 424 2 540 2 724<br />
Interest, dividends <strong>and</strong> rent on l<strong>and</strong> 93 105 94 44 42 40 31<br />
Total expenses 12 604 18 118 20 603 29 175 33 805 <strong>36</strong> 575 38 561<br />
Surplus / (Deficit) (868) (19) 1 970 304 – – –<br />
Statement of financial position<br />
Carrying value of assets 1 200 1 288 1 750 6 677 5 353 3 563 2 339<br />
of which:<br />
Acquisition of assets 309 684 1 028 5 605 1 100 750 1 500<br />
Inventory – – 22 30 35 40 45<br />
Receivables <strong>and</strong> prepayments 98 106 – 100 125 150 175<br />
Cash <strong>and</strong> cash equivalents 2 926 3 441 6 518 290 1 664 3 454 4 677<br />
Total assets 4 224 4 835 8 290 7 097 7 177 7 207 7 2<strong>36</strong><br />
Accumulated surplus/ (deficit) 2 672 2 653 4 623 4 927 4 927 4 927 4 926<br />
Capital reserve fund 350 – – – – – –<br />
Finance lease 1<strong>36</strong> 78 141 120 100 80 60<br />
<strong>Trade</strong> <strong>and</strong> other payables 989 1 839 3 280 1 750 1 750 1 750 1 750<br />
Provisions 77 265 246 300 400 450 500<br />
Total equity <strong>and</strong> liabilities 4 224 4 835 8 290 7 097 7 177 7 207 7 2<strong>36</strong><br />
Expenditure trends<br />
The tribunal is reliant on a grant allocation from the national government. The tribunal also generates revenue<br />
from the filing fee of R100 per case for a consent order application. The filing fee is nominal <strong>and</strong> insufficient to<br />
finance the cost associated with the processing of cases. The tribunal has, since the implementation of the act,<br />
experienced a significant increase in cases relating to the <strong>National</strong> Credit Act (2005). Revenue increased from<br />
R11.7 million in 2008/09 to R29.5 million in 2011/12 at an average annual rate of 35.9 per cent, <strong>and</strong> is expected<br />
to increase to R38.6 million over the medium term, at an average annual rate of 9.4 per cent.<br />
The spending focus over the MTEF period will be on managing the increase in the number of cases referred to<br />
the tribunal as a result of the exp<strong>and</strong>ed m<strong>and</strong>ate.<br />
Expenditure increased from R12.6 million in 2008/09 to R29.2 million in 2011/12, at an average annual rate of<br />
32.3 per cent, <strong>and</strong> is expected to increase to R38.6 million over the medium term, at an average annual rate of<br />
9.7 per cent. Cases referred to the tribunal increased from 26 in 2008/09 to 1 382 in 2010/11. As a result of the<br />
increased caseload the tribunal appointed additional staff at a faster rate than was originally anticipated. It is also<br />
anticipated that some tribunal members will in future be appointed on a full time basis. The permanent staff<br />
number has risen from 8 in 2010/11 to 21 in 2011/12, <strong>and</strong> 26 are budgeted for in 2012/13. The Consumer<br />
Protection Act (2008) is expected to increase caseload over the medium term.<br />
47
2012 Estimates of <strong>National</strong> Expenditure<br />
In addition to increased spending on compensation of employees, the increased headcount has resulted in<br />
increased spending on goods <strong>and</strong> services, specifically on rental costs to accommodate the additional staff <strong>and</strong><br />
associated operating expenses. The tribunal will spend R5.6 million in 2011/12 on capital assets to assist in<br />
dealing more efficiently with the caseloads, <strong>and</strong> to allow staff to work smarter <strong>and</strong> more effectively.<br />
Personnel information<br />
Table <strong>36</strong>.33 <strong>National</strong> Consumer Tribunal<br />
48<br />
Personnel post status as at 30 September 2011 Number of personnel posts filled / planned for on funded establishment<br />
Number of posts<br />
on approved<br />
establishment<br />
Number of<br />
funded posts<br />
Number of<br />
vacant posts<br />
Actual Mid-year1 Medium-term estimate<br />
2008/09 2009/10 2010/11 2011/12 2012/13 2013/14 2014/15<br />
Executive<br />
management<br />
1 1 – 1 1 1 1 3 3 3<br />
Senior<br />
management<br />
5 5 – 1 3 3 5 6 5 5<br />
Middle<br />
management<br />
2 2 – 2 2 2 2 2 2 2<br />
Professionals 6 6 1 – – – 5 6 6 6<br />
Skilled 7 7 – 1 1 1 7 7 7 7<br />
Total 21 21 1 5 7 7 20 26 28 28<br />
Compensation<br />
(R thous<strong>and</strong>)<br />
Unit cost<br />
(R thous<strong>and</strong>)<br />
1. As at 30 September 2011.<br />
3 189 5 215 5 378 9 191 13 825 16 998 16 585<br />
638 745 768 460 532 607 592<br />
The tribunal had an establishment of 21 posts as at 30 September 2011. Filled posts increased from 5 in 2008/09<br />
to 20 in 2011/12 <strong>and</strong> are expected to increase to 28 over the medium term. The increases in both periods are a<br />
direct result of the increase in case numbers referred to the tribunal. The ratio of support staff to line staff is 1 to<br />
1:33.<br />
<strong>National</strong> Credit Regulator<br />
Overview: 2008/09 – 2014/15<br />
The <strong>National</strong> Credit Regulator is m<strong>and</strong>ated by the <strong>National</strong> Credit Act (2005), which replaced the Usury<br />
Act (1968) <strong>and</strong> the Credit Agreements Act (1980). The primary purpose of the regulator is to regulate the<br />
consumer credit industry in order to improve consumer protection, <strong>and</strong> the efficiency <strong>and</strong> fairness of the end<br />
user credit market.<br />
The primary objectives of the regulator are defined in the <strong>National</strong> Credit Act (2005) <strong>and</strong> are to: carry out<br />
education, research, policy development, registration of industry participants, <strong>and</strong> investigation of complaints;<br />
promote the development of an accessible credit market, <strong>and</strong> particularly to address the needs of historically<br />
disadvantaged persons, low income persons, <strong>and</strong> remote, isolated or low density communities; register all credit<br />
providers, credit bureaus <strong>and</strong> debt counsellors; <strong>and</strong> enforce compliance with the provisions of the act.<br />
The complaints indicator was revised due to a change in the nature of complaints. Some complaints have to be<br />
investigated <strong>and</strong> referred to court before they can be resolved.<br />
Over the medium term most of the regulator’s work is focused on strengthening oversight <strong>and</strong> monitoring of<br />
credit providers, credit bureaus <strong>and</strong> debt counsellors; the fostering of consumer <strong>and</strong> public awareness of the<br />
provisions of the act, <strong>and</strong> debt relief. A single national register of outst<strong>and</strong>ing credit agreements has been<br />
established. The compilation of reporting of statistical data will be disseminated regularly to government <strong>and</strong><br />
stakeholders, to facilitate the development of policy <strong>and</strong> other decision-making processes in the consumer credit<br />
industry. Over the medium term, the regulator will strengthen its infrastructure, starting with the implementation<br />
of a new ICT operations system.
<strong>Vote</strong> <strong>36</strong>: <strong>Trade</strong> <strong>and</strong> <strong>Industry</strong><br />
Performance<br />
The regulator’s achievements in 2010/11 include registering 4 473 credit providers representing<br />
34 896 branches <strong>and</strong> a loan book of R1.2 trillion. There are 11 registered credit bureaus. The regulator has an<br />
extensive consumer awareness programme, including capacity building workshops <strong>and</strong> radio talk shows. Since<br />
its inception the regulator has conducted 445 stakeholder workshops <strong>and</strong> 1 883 public workshops. The regulator<br />
has received 388 999 complaints calls at its call centre <strong>and</strong> has been successful with enforcement actions in<br />
cases ranging from fraudulent mortgage schemes <strong>and</strong> micro-lending practices to debt counselling contraventions<br />
<strong>and</strong> credit bureau non-compliance.<br />
Selected performance indicators<br />
Table <strong>36</strong>.34 <strong>National</strong> Credit Regulator<br />
Indicator Programme/Activity/Objective/Project Past Current Projections<br />
2008/09 2009/10 2010/11 2011/12 2012/13 2013/14 2014/15<br />
Average turnaround time in<br />
days for approval of<br />
registration after receipt of<br />
all required information<br />
Registrations 10 10 10 10 10 10 10<br />
Percentage of complaints<br />
resolved within 30 days1 Complaints 73% 38% <strong>36</strong>%<br />
(998) (1 384) (834) – – – –<br />
Percentage of complaints<br />
resolved within 60 days1 Complaints 21% 24% 28%<br />
– – – –<br />
(290) (874) (648)<br />
Remaining percentage of<br />
complaints resolved within<br />
90 days1 Complaints 5%<br />
4% 18%<br />
– – – –<br />
(66) (146) (418)<br />
Percentage of complaints<br />
not resolved within<br />
90 days1 Complaints 1%<br />
1% 18%<br />
– – – –<br />
(25)<br />
(<strong>36</strong>) (447)<br />
Percentage of debt<br />
counselling related<br />
complaints resolved within<br />
90 business days2 Complaints – – – 85% 85% 85% 85%<br />
Percentage of general<br />
complaints (those that<br />
relate only to credit<br />
providers <strong>and</strong> credit<br />
bureaux)resolved within<br />
90 business days2 Complaints – – – 90% 90% 90% 90%<br />
1. These selected performance indicators have been consolidated into one indicator.<br />
2. No past data, as this is new performance indicator.<br />
Programmes/activities/objectives<br />
Table <strong>36</strong>.35 <strong>National</strong> Credit Regulator<br />
Audited outcome<br />
Revised<br />
estimate Medium-term estimate<br />
R thous<strong>and</strong> 2008/09 2009/10 2010/11 2011/12 2012/13 2013/14 2014/15<br />
Registrations 6 602 7 316 9 270 14 784 15 512 16 475 15 552<br />
Complaints 5 521 7 474 8 395 11 383 11 583 12 212 12 591<br />
Investigations 5 767 6 709 8 585 11 586 11 741 12 332 12 516<br />
Research <strong>and</strong> statistics 3 186 4 023 3 757 5 491 5 578 5 871 6 011<br />
Credit information 1 880 1 718 3 146 5 679 5 680 5 926 5 851<br />
Debt counseling 9 898 9 375 9 896 7 546 9 064 9 475 4 865<br />
Education 4 741 10 757 10 394 12 118 12 087 12 605 12 417<br />
Other objectives 15 238 18 796 25 065 39 661 39 900 41 747 41 691<br />
Total expense 52 833 66 168 78 508 108 248 111 145 116 643 111 494<br />
The <strong>National</strong> Credit Regulator had a total budget of R108.2 million in 2011/12, of which 48.2 per cent was used<br />
for compensation of employees <strong>and</strong> 49.3 per cent for goods <strong>and</strong> services.<br />
49
2012 Estimates of <strong>National</strong> Expenditure<br />
Savings <strong>and</strong> cost effectiveness measures<br />
The regulator is currently in a growth <strong>and</strong> expansion phase, with a focus on challenges in recruitment <strong>and</strong> other<br />
key areas. Once the regulator has reached capacity, it will embark on cost saving initiatives, mainly to reduce<br />
administrative expenditure.<br />
Expenditure estimates<br />
Table <strong>36</strong>.37 <strong>National</strong> Credit Regulator<br />
Statement of financial performance<br />
50<br />
Audited outcome<br />
Revised<br />
estimate Medium-term estimate<br />
R thous<strong>and</strong> 2008/09 2009/10 2010/11 2011/12 2012/13 2013/14 2014/15<br />
Revenue<br />
Non-tax revenue 33 028 31 786 31 161 54 669 56 455 57 773 54 094<br />
Sale of goods <strong>and</strong> services other than<br />
capital assets<br />
of which:<br />
25 148 25 695 25 198 28 954 31 960 33 878 35 911<br />
Administration fees 25 148 25 695 25 198 28 954 31 960 33 878 35 911<br />
Other non-tax revenue 7 880 6 091 5 963 25 715 24 495 23 895 18 183<br />
Transfers received 34 513 46 213 49 387 53 579 54 690 58 870 57 400<br />
Total revenue 67 541 77 999 80 548 108 248 111 145 116 643 111 494<br />
Expenses<br />
Current expenses 52 833 66 168 78 508 108 248 111 145 116 643 111 494<br />
Compensation of employees 25 691 30 201 <strong>36</strong> 791 52 149 55 2<strong>36</strong> 58 869 61 383<br />
Goods <strong>and</strong> services 27 688 34 229 40 041 53 397 53 759 55 493 47 698<br />
Depreciation (560) 1 407 1 669 2 701 2 146 2 275 2 412<br />
Interest, dividends <strong>and</strong> rent on l<strong>and</strong> 14 331 7 1 4 6 1<br />
Total expenses 52 833 66 168 78 508 108 248 111 145 116 643 111 494<br />
Surplus / (Deficit) 14 708 11 831 2 040 – – – –<br />
Statement of financial position<br />
Carrying value of assets 6 6<strong>36</strong> 7 432 9 038 10 091 11 924 13 867 15 926<br />
of which:<br />
Acquisition of assets 1 749 2 432 3 424 3 754 3 979 4 218 4 471<br />
Receivables <strong>and</strong> prepayments 285 189 560 339 339 339 339<br />
Cash <strong>and</strong> cash equivalents 61 949 73 019 74 247 72 643 58 620 68 787 68 787<br />
Total assets 68 870 80 640 83 845 83 073 70 883 82 993 85 052<br />
Accumulated surplus / (deficit) 37 969 49 800 51 840 51 840 35 598 46 119 48 178<br />
Capital reserve fund 5 978 3 624 537 – – – –<br />
Finance lease 603 699 656 421 <strong>36</strong>9 539 539<br />
Deferred income 16 838 18 202 20 174 20 174 24 990 27 117 27 117<br />
<strong>Trade</strong> <strong>and</strong> other payables 5 217 4 717 6 180 6 180 7 107 6 168 6 168<br />
Provisions 2 265 3 598 4 458 4 458 2 819 3 050 3 050<br />
Total equity <strong>and</strong> liabilities 68 870 80 640 83 845 83 073 70 883 82 993 85 052<br />
Expenditure trends<br />
The regulator generates revenue from transfers received from the department <strong>and</strong> the collection of<br />
administration fees for services rendered. Revenue increased from R67.5 million in 2008/09 to R108.2 million<br />
in 2011/12, at an average annual rate of 17 per cent. The increase is mainly due to the collection of<br />
administration fees <strong>and</strong> the increased transfer payments received from the department to finance the regulator’s<br />
operational expenditure. Over the medium term, revenue is expected to grow to R111.5 million, at an average<br />
annual rate of 1 per cent.<br />
The spending focus over the MTEF period will be on operational expenses <strong>and</strong> compensation of employees, as a<br />
result of the regulatory function this entity performs.<br />
Expenditure increased from R52.8 million in 2008/09 to R108.2 million in 2011/12, at an average annual rate of<br />
27 per cent, due to growth <strong>and</strong> expansion. Over the medium term, expenditure is expected to increase to
<strong>Vote</strong> <strong>36</strong>: <strong>Trade</strong> <strong>and</strong> <strong>Industry</strong><br />
R111.5 million, at an average annual rate of 1 per cent. The increase in expenditure is mainly due to increased<br />
capital <strong>and</strong> goods <strong>and</strong> services expenditure, due to the regulator being in a growth phase. The regulator expects<br />
to further exp<strong>and</strong> capacity to fulfil its m<strong>and</strong>ate <strong>and</strong> enforce compliance with the act.<br />
Personnel information<br />
Table <strong>36</strong>.37 <strong>National</strong> Credit Regulator<br />
Personnel post status as at 30 September 2011 Number of personnel posts filled / planned for on funded establishment<br />
Number<br />
of posts<br />
on approved<br />
establishment<br />
Number<br />
of<br />
funded<br />
posts<br />
Number of<br />
vacant<br />
posts<br />
Actual Mid- year 1 Medium-term estimate<br />
2008/09 2009/10 2010/11 2011/12 2012/13 2013/14 2014/15<br />
Executive<br />
management<br />
1 1 – 1 1 – – 1 1 1<br />
Senior management 3 3 – 3 3 3 3 5 5 5<br />
Middle management 8 5 3 6 6 13 5 10 11 12<br />
Professionals 37 28 9 – 22 28 28 28 28 28<br />
Skilled 13 12 1 – 10 9 12 13 13 13<br />
Semi-skilled 53 <strong>36</strong> 17 26 33 24 <strong>36</strong> 53 53 53<br />
Very low skilled 37 33 4 22 24 31 33 37 37 37<br />
Total 152 118 34 58 99 108 117 147 148 149<br />
Compensation<br />
(R thous<strong>and</strong>)<br />
25 691 30 201 <strong>36</strong> 791 52 149 55 2<strong>36</strong> 58 869 61 383<br />
Unit cost<br />
(R thous<strong>and</strong>)<br />
443 305 341 446 376 398 412<br />
1. As at 30 September 2011.<br />
As at 30 September 2011, the regulator had an approved establishment of 152 posts. The number of filled posts<br />
grew from 58 in 2008/09 to 117 in 2011/12. Over the MTEF period, filled posts are expected to increase to 149<br />
due to the expansion of activities resulting from the regulatory function the entity performs. There were<br />
34 vacancies within the regulator, most of them at the semi-skilled level. The ratio of support staff to line staff is<br />
1:2.<br />
<strong>National</strong> Empowerment Fund<br />
Overview: 2008/09 – 2014/15<br />
The <strong>National</strong> Empowerment Fund was established by the <strong>National</strong> Empowerment Fund Act (1998) to promote<br />
<strong>and</strong> facilitate black economic equality <strong>and</strong> transformation. It provides finance <strong>and</strong> non-financial support to black<br />
businesses <strong>and</strong> structures retail savings products for black people based on allocated state owned equity<br />
investments. Its m<strong>and</strong>ate is to implement the codes of good practice.<br />
The strategic objectives over the medium term are to: promote <strong>and</strong> support business ventures pioneered <strong>and</strong> run<br />
by black people; provide black people with the opportunity of acquiring shares or interests in state owned<br />
entities; encourage <strong>and</strong> promote savings, investment <strong>and</strong> meaningful economic participation by black people;<br />
promote universal underst<strong>and</strong>ing of equity ownership among black people; contribute to the creation of<br />
employment opportunities; encourage the development of a competitive <strong>and</strong> effective equities market inclusive<br />
of all persons in the country; <strong>and</strong> generally employ such schemes, businesses <strong>and</strong> enterprises as may be<br />
necessary to achieve the objectives of the <strong>National</strong> Empowerment Fund Act (1998).<br />
The organisation is structured to deliver on its m<strong>and</strong>ate <strong>and</strong> realise these objectives through three core divisions:<br />
small <strong>and</strong> medium enterprises <strong>and</strong> rural development, venture capital <strong>and</strong> corporate finance, <strong>and</strong> asset<br />
management. In delivering on this m<strong>and</strong>ate, the organisation sets key performance indicators that target<br />
numbers <strong>and</strong> values of funding applications approved <strong>and</strong> disbursed over a financial year, along with job<br />
support <strong>and</strong> creation targets.<br />
The key performance indicators set over the medium term will fully utilise current remaining capital under<br />
management. Any reduction in this capitalisation will have a negative effect on the targets set for the MTEF<br />
period <strong>and</strong> its ability to reach its targets.<br />
51
2012 Estimates of <strong>National</strong> Expenditure<br />
Performance<br />
Since inception, the fund has approved 286 deals worth R2.5 billion <strong>and</strong> disbursed 257 worth R2.1 billion.<br />
Actual draw-downs against disbursement facilities since inception were R1.7 billion. Capital allocated to the<br />
organisation, R2.5 billion to date, is fully applied against funding applications. Future programmes are funded<br />
out of internally generated reserves.<br />
Selected Performance Indicators<br />
Table <strong>36</strong>.38 <strong>National</strong> Empowerment Fund<br />
Indicator Programme/Activity/Objective/Project Past Current Projections<br />
Disbursement value per<br />
year within a targeted<br />
number of transactions<br />
between R2 million <strong>and</strong><br />
R75 million<br />
Disbursement value per<br />
year within a targeted<br />
number of transactions<br />
between R250 000 <strong>and</strong><br />
R10 million<br />
Disbursement value per<br />
year within a targeted<br />
number of transactions<br />
Disbursement value per<br />
year within a targeted<br />
number of transactions<br />
<strong>and</strong> feasibility studies<br />
Number of asset<br />
management activities per<br />
year<br />
Number of projects<br />
receiving non-financial<br />
support per year<br />
52<br />
2008/09 2009/10 2010/11 2011/12 2012/13 2013/14 2014/15<br />
Umnotho fund R 219m R184.7m R300m R375m R450m R500m R550m<br />
Imbewu fund R78m R106m R135m R140m R140m R240m R345m<br />
Rural <strong>and</strong> community development R9m R86.1m R75m R105m R130m R156m R184m<br />
Strategic projects fund R5m R46.5m R70m R130m R200m R200m R200m<br />
Asset management – – 18 702 9 862 2 850 2 850 –<br />
Non-financial support – – 5 554 4 400 4 800 6 000 6 000<br />
Programmes/activities/objectives<br />
Table <strong>36</strong>.39 <strong>National</strong> Empowerment Fund<br />
Audited outcome<br />
Revised<br />
estimate Medium-term estimate<br />
R thous<strong>and</strong> 2008/09 2009/10 2010/11 2011/12 2012/13 2013/14 2014/15<br />
Umnotho fund 219 000 184 654 300 000 375 000 450 000 500 000 550 000<br />
Imbewu fund 78 000 106 162 135 000 150 000 250 000 <strong>36</strong>0 000 450 000<br />
Rural <strong>and</strong> community development 9 000 86 145 91 314 105 000 130 000 156 000 184 000<br />
Strategic projects fund 5 000 46 533 70 000 130 000 200 000 200 000 200 000<br />
Asset management – – 18 702 9 862 2 850 2 850 –<br />
Non financial support – – 5 554 4 400 4 800 6 000 6 000<br />
Total expense 311 000 423 494 620 570 774 262 1 037 650 1 224 850 1 390 000<br />
Savings <strong>and</strong> cost effectiveness measures<br />
The fund has, since inception, applied a model that seeks to use existing provincial infrastructure <strong>and</strong> sources of<br />
expertise, as opposed to replicating these facilities. The fund has leveraged off provincial governments’ <strong>and</strong> the<br />
Department of <strong>Trade</strong> <strong>and</strong> <strong>Industry</strong>’s relationships to create awareness for its products <strong>and</strong> services <strong>and</strong> has been,<br />
as of 2011/12, establishing regional satellite offices in each province to further entrench the fund’s provincial<br />
activities. Additional skills, especially at the non-financial support level, are sourced through the mentorship<br />
network that the fund has established, as opposed to the permanent recruitment of staff to fulfil these support<br />
requirements. As a result of better cost management, operating expenditure is set to decline from R225 million<br />
in 2011/12 to R208 million in 2014/15, at an average annual rate of 2.6 per cent.
Expenditure estimates<br />
Table <strong>36</strong>.40 <strong>National</strong> Empowerment Fund<br />
Statement of financial performance<br />
<strong>Vote</strong> <strong>36</strong>: <strong>Trade</strong> <strong>and</strong> <strong>Industry</strong><br />
Audited outcome<br />
Revised<br />
estimate Medium-term estimate<br />
R thous<strong>and</strong><br />
Revenue<br />
2008/09 2009/10 2010/11 2011/12 2012/13 2013/14 2014/15<br />
Non-tax revenue 432 930 466 654 371 979 431 516 473 000 509 8<strong>36</strong> 552 410<br />
Other non-tax revenue 432 930 466 654 371 979 431 516 473 000 509 8<strong>36</strong> 552 410<br />
Transfers received – 116 000 – – – – –<br />
Total revenue<br />
Expenses<br />
432 930 582 654 371 979 431 516 473 000 509 8<strong>36</strong> 552 410<br />
Current expenses 328 887 383 690 297 151 333 953 347 152 342 128 358 266<br />
Compensation of employees 60 609 78 050 85 028 101 184 123 726 126 700 138 200<br />
Goods <strong>and</strong> services 264 491 300 222 204 839 225 769 216 426 208 428 213 066<br />
Depreciation 3 787 5 418 7 284 7 000 7 000 7 000 7 000<br />
Total expenses 328 887 383 690 297 151 333 953 347 152 342 128 358 266<br />
Surplus / (Deficit) 104 043 198 964 74 828 97 563 125 848 167 708 194 144<br />
Statement of financial position<br />
Carrying value of assets 11 458 13 283 12 129 10 837 8 465 7 143 5 871<br />
of which:<br />
Acquisition of assets 7 526 7 243 6 130 5 708 4 628 5 678 5 728<br />
Investments 1 309 951 1 289 581 1 639 267 1 639 267 1 639 267 1 639 267 1 639 267<br />
Loans 688 586 875 573 1 007 784 1 437 169 1 979 949 2 591 584 3 268 990<br />
Receivables <strong>and</strong> prepayments 23 985 33 472 74 125 6 057 5 629 5 116 5 116<br />
Cash <strong>and</strong> cash equivalents 2 604 188 2 788 342 2 582 555 2 315 493 1 901 251 1 459 058 977 068<br />
Total assets 4 638 168 5 000 251 5 315 860 5 408 823 5 534 561 5 702 168 5 896 312<br />
Accumulated surplus/(deficit) 1 241 159 1 440 124 1 514 952 1 612 515 1 738 <strong>36</strong>3 1 906 070 2 100 214<br />
Capital <strong>and</strong> reserves 3 245 385 3 518 812 3 765 625 3 765 625 3 765 625 3 765 625 3 765 625<br />
Finance lease 170 – – – – – –<br />
<strong>Trade</strong> <strong>and</strong> other payables 29 460 41 315 35 283 30 683 30 573 30 473 30 473<br />
Provisions 121 994 – – – – – –<br />
Total equity <strong>and</strong> liabilities 4 638 168 5 000 251 5 315 860 5 408 823 5 534 561 5 702 168 5 896 312<br />
Expenditure trends<br />
Revenue is mainly generated from: interest income, which is earned from loans advanced, <strong>and</strong> from the cash<br />
<strong>and</strong> cash equivalents held at the banks; <strong>and</strong> dividends earned on an invested portfolio, which includes listed <strong>and</strong><br />
unlisted investments. Total revenue is expected to increase from R432.9 million in 2008/09 to R552.4 million in<br />
2014/15, at an average annual rate of 4.1 per cent, mainly as a result of the growth in the loans portfolio.<br />
The spending focus over the MTEF period will mainly be on implementing the fund's m<strong>and</strong>ate in respect of<br />
asset management, fund management <strong>and</strong> the strategic projects fund.<br />
Expenditure increases from R328.9 million in 2008/09 to R358.3 million in 2014/15, at an average annual rate<br />
of 1.4 per cent in line with the increase in net asset value. The net asset value of the fund increased from<br />
R4.6 billion in 2008/09 to R5.4 billion in 2011/12. This has largely been due to appreciation in fair value of the<br />
asset management portfolio <strong>and</strong> retained earnings, <strong>and</strong> the department’s recapitalisation of the fund.<br />
Expenditure has increased in line with net asset value, but remains at 3 per cent of the net asset value, which is<br />
an acceptable level for a development finance institution.<br />
Investment approvals were projected to reach the R2 billion milestone. The fund has supported 257 black<br />
empowered businesses, created 10 500 new jobs <strong>and</strong> supported the retention of 15 000 jobs. In total,<br />
disbursements have grown from R311 million in 2008/09 to over R580 million in 2010/11, with targets set at<br />
R750 million in 2011/12, R920 million in 2012/13, R1.1 billion in 2014/15 <strong>and</strong> R1.3 billion in 2014/15. If these<br />
funding levels are achieved, this could contribute to the support of over 29 000 jobs over the medium term.<br />
53
2012 Estimates of <strong>National</strong> Expenditure<br />
Personnel information<br />
Table <strong>36</strong>.41 <strong>National</strong> Empowerment Fund<br />
Personnel post status as at 30 September 2011 Number of personnel posts filled / planned for on funded establishment<br />
Number of posts Number of Number of<br />
Actual Mid-year<br />
on approved funded vacant<br />
establishment posts posts<br />
1 Medium-term estimate<br />
2008/09 2009/10 2010/11 2011/12 2012/13 2013/14 2014/15<br />
Executive board<br />
members<br />
2 2 – 1 2 2 2 2 2 2<br />
Executive management 3 3 – 4 2 1 3 3 3 3<br />
Senior management 11 11 – 11 11 11 11 11 11 11<br />
Middle management 4 4 – 4 4 4 4 7 7 7<br />
Professionals 111 98 13 68 83 88 98 116 121 127<br />
Skilled 8 8 – 8 8 8 8 10 10 10<br />
Semi-skilled 20 20 – 20 20 20 20 20 20 20<br />
Very low skilled 10 10 – 9 10 10 10 10 10 10<br />
Total 169 156 13 125 140 144 156 179 184 190<br />
Compensation<br />
(R thous<strong>and</strong>)<br />
Unit cost<br />
(R thous<strong>and</strong>)<br />
1. As at 30 September 2011.<br />
54<br />
60 609 78 050 85 028 101 184 123 726 126 700 138 200<br />
485 558 590 649 691 689 727<br />
The number of filled posts increased from 125 in 2008/09 to 156 in 2011/12. This is due to the establishment of<br />
regional offices. Over the medium term, the number of filled posts is expected to increase. Due to the high<br />
number of professionals, a high turnover of staff is prevalent. The ratio of support staff to line staff is 1:2.<br />
<strong>National</strong> Gambling Board<br />
Overview: 2008/09 – 2014/15<br />
The <strong>National</strong> Gambling Board is responsible for regulating the gambling industry. In 2011/12, the board<br />
reviewed its strategy to focus on new forms of gambling, such as internet gambling, to protect minors. The<br />
board participates in international gambling regulators forums on policy formulation <strong>and</strong> research. The board<br />
will commission research to assess evolution of technologies.<br />
The outcomes projected between 2010 <strong>and</strong> 2015 are to: acquire the knowledge <strong>and</strong> capability to proactively<br />
manage a regulatory framework that ensures a stable regulatory regime in the gambling industry; provide a<br />
coordinated research <strong>and</strong> marketing strategy to communicate more frequently with communities on the adverse<br />
effects of reckless or excessive gambling; <strong>and</strong> provide meaningful information to stakeholders <strong>and</strong> use national<br />
information databases to inform policy.<br />
Performance<br />
Achievements in 2010/11 include: consultation with provincial licensing authorities about draft national norms<br />
<strong>and</strong> st<strong>and</strong>ards; liaison with the law enforcement agencies to address illegal gambling activities; consultation<br />
with the various gambling operators, including the Bingo Association of South Africa <strong>and</strong> the Casino<br />
Association of South Africa; <strong>and</strong> underst<strong>and</strong>ing the best way to build stakeholder relations in future.
Selected performance indicators<br />
<strong>Vote</strong> <strong>36</strong>: <strong>Trade</strong> <strong>and</strong> <strong>Industry</strong><br />
Table <strong>36</strong>.42 <strong>National</strong> Gambling Board<br />
Indicator Programme/Activity/Objective/Project Past Current Projections<br />
Number of e-Financial<br />
Intelligence Centre Act (2001)<br />
inspections conducted per year<br />
Number of approved national<br />
employee licenses issued per<br />
year<br />
Number of central electronic<br />
monitoring system audits<br />
completed per year (9<br />
provinces)<br />
Number of oversight<br />
inspections conducted per<br />
province per year<br />
Number of illegal gambling<br />
activities registered per year<br />
Number of research projects<br />
conducted per year<br />
Number of test laboratories<br />
inspected per year<br />
2008/09 2009/10 2010/11 2011/12 2012/13 2013/14 2014/15<br />
Compliance oversight 44 112 97 106 106 106 30<br />
Compliance oversight 0 72 10 43 10 10 15<br />
Compliance oversight – 2 1 2 1 1 2<br />
Compliance oversight 1 1 2 2 2 2 1<br />
Compliance oversight 9 11 18 18 18 10 15<br />
Leading debate on new forms of<br />
gambling<br />
3 2 2 2 4 1 2<br />
Integrated information portal 0 9 8 2 2 2 2<br />
Programmes/activities/objectives<br />
Table <strong>36</strong>.43 <strong>National</strong> Gambling Board of South Africa<br />
Audited outcome<br />
Revised<br />
estimate<br />
Medium-term estimate<br />
R thous<strong>and</strong> 2008/09 2009/10 2010/11 2011/12 2012/13 2013/14 2014/15<br />
Harmonisation of legislation – – – 1 075 2 400 2 300 2 400<br />
Compliance oversight 5 258 6 501 6 116 5 700 5 754 5 289 5 950<br />
Integrated information portal – – – 2 800 3 381 3 100 2 781<br />
Leading debate on new forms of<br />
gambling<br />
– – – 6 216 5 950 7 721 6 050<br />
Organisational excellent 6 845 6 970 7 563 8 179 8 800 9 350 9 969<br />
CEO 2 551 3 259 3 081 – – – –<br />
Legal 870 1 200 1 552 – – – –<br />
Board 1 117 1 889 1 278 – – – –<br />
Research 2 574 1 300 3 465 – – – –<br />
Other objectives – 1 242 – – – – –<br />
Total expense 19 215 22 <strong>36</strong>1 23 055 23 970 26 285 27 760 27 150<br />
The <strong>National</strong> Gambling Board had a total budget of R24 million in 2011/12, of which 51.4 per cent was used for<br />
compensation of employees.<br />
Savings <strong>and</strong> cost effectiveness measures<br />
The board maintains oversight on the allocation of resources <strong>and</strong> expenditure. Managers also sign performance<br />
agreements with the executives to achieve the annual targets.<br />
Expenditure estimates<br />
Table <strong>36</strong>.44 <strong>National</strong> Gambling Board of South Africa<br />
Statement of financial performance<br />
Audited outcome<br />
Revised<br />
estimate Medium-term estimate<br />
R thous<strong>and</strong> 2008/09 2009/10 2010/11 2011/12 2012/13 2013/14 2014/15<br />
Revenue<br />
Non-tax revenue 1 374 530 763 8 <strong>36</strong>5 385 430 450<br />
Other non-tax revenue 1 374 530 763 8 <strong>36</strong>5 385 430 450<br />
Transfers received 18 195 21 570 22 000 15 605 25 900 27 330 26 700<br />
Total revenue 19 569 22 100 22 763 23 970 26 285 27 760 27 150<br />
55
2012 Estimates of <strong>National</strong> Expenditure<br />
Table <strong>36</strong>.44 <strong>National</strong> Gambling Board of South Africa (continued)<br />
Statement of financial performance<br />
56<br />
Audited outcome<br />
Revised<br />
estimate Medium-term estimate<br />
R thous<strong>and</strong> 2008/09 2009/10 2010/11 2011/12 2012/13 2013/14 2014/15<br />
Expenses<br />
Current expenses 19 215 22 <strong>36</strong>1 23 055 23 970 26 285 27 760 27 150<br />
Compensation of employees 7 990 8 254 10 025 12 332 13 133 13 354 14 339<br />
Goods <strong>and</strong> services 10 879 13 688 12 632 11 224 12 116 13 317 11 722<br />
Depreciation 324 405 398 400 1 0<strong>36</strong> 1 089 1 089<br />
Interest, dividends <strong>and</strong> rent on l<strong>and</strong> 22 14 – 14 – – –<br />
Total expenses 19 215 22 <strong>36</strong>1 23 055 23 970 26 285 27 760 27 150<br />
Surplus / (Deficit) 354 (261) (292) – – – –<br />
Statement of financial position<br />
Carrying value of assets 1 581 1 392 1 212 1 482 4 038 3 432 2 343<br />
of which:<br />
Acquisition of assets 888 244 270 687 3 670 553 –<br />
Inventory 33 94 59 176 156 156 156<br />
Accrued investment interest – – – – – 1 <strong>36</strong>5 339<br />
Receivables <strong>and</strong> prepayments 28 104 387 86 145 265 145<br />
Cash <strong>and</strong> cash equivalents 5 103 4 059 4 191 7 281 5 250 2 644 5 153<br />
Taxation – – – – – 224 –<br />
Total assets 6 745 5 649 5 849 9 025 9 589 8 086 8 1<strong>36</strong><br />
Accumulated surplus / (deficit) 3 462 1 631 1 339 4 478 4 477 4 477 4 477<br />
Finance lease 62 17 – – – – –<br />
<strong>Trade</strong> <strong>and</strong> other payables 1 769 2 634 3 143 1 931 1 953 1 093 1 593<br />
Taxation – – – – 193 – –<br />
Provisions 1 452 1 <strong>36</strong>7 1 <strong>36</strong>7 2 616 2 966 2 516 2 066<br />
Total equity <strong>and</strong> liabilities 6 745 5 649 5 849 9 025 9 589 8 086 8 1<strong>36</strong><br />
Expenditure trends<br />
The board is funded by transfers from the Department of <strong>Trade</strong> <strong>and</strong> <strong>Industry</strong>, <strong>and</strong> generates other revenue<br />
licence fees. Between 2008/09 <strong>and</strong> 2011/12, transfers received decreased from R18.2 million to R15.6 million,<br />
at an average annual of 5 per cent. Over the medium term, transfers received are expected to increase to<br />
R26.7 million, at an average annual rate of 19.6 per cent. The growth is based on increased regulation <strong>and</strong> new<br />
modes, interactive gambling <strong>and</strong> animal racing, when legalised.<br />
The spending focus over the MTEF period will be on strengthening the regulatory capability of the board by<br />
appointing additional staff.<br />
Expenditure increased from R19.2 million in 2008/09 to R24 million in 2011/12, at an average annual rate of<br />
7.6 per cent, <strong>and</strong> is expected to increase to R27.2 million over the medium term, at an average annual rate of<br />
4.2 per cent. This is due to the need to increase the scope of regulation as the gambling industry introduces new<br />
form of gambling.<br />
The board conducted the central electronic monitoring system audit as planned. The 40 criteria were developed<br />
for the limited payout machine industry, which brought uniform requirements for assessment of licence<br />
applications across the provinces. The 40 licensed casinos were inspected in relation to the requirements of the<br />
Financial Intelligence Centre Act (2001). These inspections were also conducted on 44 betting outlets.<br />
The board is a member of the Anti-Money-Laundering Advisory Council. Good progress has been made on the<br />
strategy dealing with probity, information sharing, exclusions <strong>and</strong> devices. 158 employee licences <strong>and</strong> 43 entity<br />
licenses were issued. The board maintains a database on revenues, taxes, levies <strong>and</strong> returns to punters, to which<br />
provincial gambling boards report quarterly statistics. Despite the recession, 2010/11 gross gambling revenues<br />
increased each year by 5.4 per cent, from R16.3 billion to R17.1 billion; <strong>and</strong> taxes/levies increased by 6 per cent<br />
from R1.6 billion to R1.7 billion.
Personnel information<br />
Table <strong>36</strong>.45 <strong>National</strong> Gambling Board of South Africa<br />
<strong>Vote</strong> <strong>36</strong>: <strong>Trade</strong> <strong>and</strong> <strong>Industry</strong><br />
Personnel post status as at 30 September 2011 Number of personnel posts filled / planned for on funded establishment<br />
Number of posts<br />
on approved<br />
establishment<br />
Number of<br />
funded<br />
posts<br />
Number of<br />
vacant<br />
posts<br />
Actual Mid-year1 Medium-term estimate<br />
2008/09 2009/10 2010/11 2011/12 2012/13 2013/14 2014/15<br />
Executive<br />
management<br />
3 3 – 3 3 3 3 4 4 4<br />
Senior<br />
management<br />
7 7 1 7 7 7 7 10 10 10<br />
Middle<br />
management<br />
6 6 – 6 6 6 6 7 7 7<br />
Professionals 2 – 2 – – – – – – –<br />
Skilled 6 6 – 6 6 7 7 6 6 6<br />
Semi-skilled 3 3 – 3 3 3 3 3 3 3<br />
Total 27 25 3 25 25 26 26 30 30 30<br />
Compensation<br />
(R thous<strong>and</strong>)<br />
7 990 8 254 10 025 12 332 13 133 13 354 14 339<br />
Unit cost<br />
(R thous<strong>and</strong>)<br />
1. As at 30 September 2011.<br />
320 330 386 474 438 445 478<br />
As at 30 September 2011, the board had an approved establishment of 27 posts, all of which are funded. Over<br />
the MTEF period, the number of filled posts is expected to increase to 30 as a result of the exp<strong>and</strong>ed m<strong>and</strong>ate to<br />
regulate interactive gambling <strong>and</strong> the infrastructure required to provide the regulatory framework, including<br />
developing a compliance monitoring system. As at 30 September 2011, the board had 1 vacancy at skilled level.<br />
The ratio of support staff to line staff is 3:5.<br />
<strong>National</strong> Lotteries Board<br />
Overview: 2008/09 – 2014/15<br />
The <strong>National</strong> Lotteries Board was established in terms of the <strong>National</strong> Lotteries Act (1997) as amended. The<br />
board monitors <strong>and</strong> enforces the implementation of the <strong>National</strong> Lottery, <strong>and</strong> the establishment of private<br />
lotteries <strong>and</strong> promotional competitions. In addition, the board manages the <strong>National</strong> Lottery Distribution Trust<br />
Fund, which distributes proceeds from its share of lottery sales to worthy causes.<br />
Major objectives for 2012/2013 include: fair <strong>and</strong> equitable distribution of good cause funds with maximum<br />
developmental impact; efficient <strong>and</strong> responsive distribution processes; proportional, balanced <strong>and</strong> inclusive<br />
regulation; <strong>and</strong> alignment of human <strong>and</strong> organisational capacity with the board’s current <strong>and</strong> future needs,<br />
including a review of regulatory practice <strong>and</strong> managing the licences.<br />
Performance<br />
In the absence of new games, ticket sales are expected to settle at around R4.7 billion per year, of which<br />
34 per cent remains the contribution to the <strong>National</strong> Lotteries Distribution Trust Fund. Having allocated the old<br />
surpluses, new grant commitments would move toward the equivalent of one year’s revenue from the lottery<br />
operator.<br />
Selected performance indicators<br />
Table <strong>36</strong>.46 <strong>National</strong> Lotteries Board<br />
Indicator Programme/Activity/Objective/Project Past Current Projections<br />
Value of<br />
operator ticket<br />
sales per year<br />
Value of<br />
<strong>National</strong><br />
Lotteries<br />
Distribution<br />
Trust Fund grant<br />
commitments<br />
per year<br />
2008/09 2009/10 2010/11 2011/12 2012/13 2013/14 2014/15<br />
<strong>National</strong> lottery regulation R3.5bn R4.4bn R4.71bn R4.59bn R4.62bn R4.7bn R4.7bn<br />
<strong>National</strong> lottery distribution R1.4bn R3.3bn R3.1bn R1.8bn R1.8bn R1.7bn R1.6bn<br />
57
2012 Estimates of <strong>National</strong> Expenditure<br />
Table <strong>36</strong>.46 <strong>National</strong> Lotteries Board (continued)<br />
Indicator Programme/Activity/Objective/Project Past Current Projections<br />
Value of actual<br />
cash disbursed<br />
per year<br />
Value of contribution<br />
to the <strong>National</strong><br />
Lotteries Distribution<br />
Trust Fund per year<br />
58<br />
2008/09 2009/10 2010/11 2011/12 2012/13 2013/14 2014/15<br />
<strong>National</strong> lottery distribution R950m R1.9bn R3.6bn R2.4bn R2.1bn R1.4bn R1.4bn<br />
<strong>National</strong> lottery regulation R1.5bn R1.5bn R1.6bn R1.6bn R1.6bn R1.6bn R1.6bn<br />
Programmes/activities/objectives<br />
Table <strong>36</strong>.47 <strong>National</strong> Lotteries Board<br />
Audited outcome<br />
Revised<br />
estimate Medium-term estimate<br />
R thous<strong>and</strong> 2008/09 2009/10 2010/11 2011/12 2012/13 2013/14 2014/15<br />
<strong>National</strong> lottery regulation 49 593 65 376 83 573 117 823 162 379 176 169 192 4<strong>36</strong><br />
Total expense 49 593 65 376 83 573 117 823 162 379 176 169 192 4<strong>36</strong><br />
The <strong>National</strong> Lotteries Board had a total budget of R117.8 million in 2011/12, of which 49.8 per cent was used<br />
for compensations of employees <strong>and</strong> 48.7 per cent for goods <strong>and</strong> services.<br />
Savings <strong>and</strong> cost effectiveness measures<br />
The board continues with plans to achieve cost effective delivery by improving the operations of the <strong>National</strong><br />
Lottery Distribution Trust Fund. Turnaround time in processing applications, <strong>and</strong> ultimately in processing<br />
payments to approved beneficiaries from 2008/09 to 2009/10 <strong>and</strong> 2010/11, has already shown marked<br />
improvement.<br />
Expenditure estimates<br />
Table <strong>36</strong>.48 <strong>National</strong> Lotteries Board<br />
Statement of financial performance<br />
Audited outcome<br />
Revised<br />
estimate Medium-term estimate<br />
R thous<strong>and</strong><br />
Revenue<br />
2008/09 2009/10 2010/11 2011/12 2012/13 2013/14 2014/15<br />
Non-tax revenue 1 959 1 643 1 617 1 560 1 656 1 698 1 728<br />
Other non-tax revenue 1 959 1 643 1 617 1 560 1 656 1 698 1 728<br />
Transfers received 47 634 63 733 81 956 116 263 160 723 174 471 190 708<br />
Total revenue 49 593 65 376 83 573 117 823 162 379 176 169 192 4<strong>36</strong><br />
Expenses<br />
Current expenses 49 593 65 376 83 573 117 823 162 379 176 169 192 4<strong>36</strong><br />
Compensation of employees 22 637 33 922 45 413 58 680 88 333 97 124 106 7<strong>36</strong><br />
Goods <strong>and</strong> services 25 110 29 495 37 404 57 397 71 791 76 745 83 200<br />
Depreciation 1 846 1 959 756 1 746 2 255 2 300 2 500<br />
Total expenses 49 593 65 376 83 573 117 823 162 379 176 169 192 4<strong>36</strong><br />
Surplus / (Deficit) – – – – – – –<br />
Statement of financial position<br />
Carrying value of assets 8 075 7 530 8 324 9 629 13 124 13 624 14 124<br />
of which:<br />
Acquisition of assets 4 777 1 414 1 685 3 051 5 750 2 800 3 000<br />
Receivables <strong>and</strong> prepayments 3 718 3 648 4 780 4 600 3 200 2 500 2 500<br />
Cash <strong>and</strong> cash equivalents 3 616 5 803 4 108 6 234 6 762 9 463 11 403<br />
Total assets 15 409 16 981 17 212 20 463 23 086 25 587 28 027<br />
Deferred income 8 038 6 730 5 422 4 114 2 806 1 498 190<br />
<strong>Trade</strong> <strong>and</strong> other payables 7 371 10 251 11 790 13 733 15 018 16 181 17 313<br />
Managed funds (e.g. Poverty alleviation<br />
fund)<br />
– – – 2 616 5 262 7 908 10 524<br />
Total equity <strong>and</strong> liabilities 15 409 16 981 17 212 20 463 23 086 25 587 28 027
<strong>Vote</strong> <strong>36</strong>: <strong>Trade</strong> <strong>and</strong> <strong>Industry</strong><br />
Expenditure trends<br />
The board receives funding from the <strong>National</strong> Lottery Distribution Trust Fund. The board does not receive any<br />
funding from the department. It also generates revenue from interest earned on funds received from licence<br />
holders. Transfers to the board increased significantly from R47.6 million in 2008/09 to R116.3 million in<br />
2011/12, at an average annual rate of 34.6 per cent, to cover operational costs. Over the medium term, transfers<br />
are expected to grow to R190.7 million, at an average annual rate of 17.9 per cent. This is due to increasing<br />
operational costs.<br />
Expenditure increased significantly from R49.6 million in 2008/09 to R117.8 million in 2011/12, at an average<br />
annual rate of 33.4 per cent, <strong>and</strong> is expected to increase to R192.4 million over the medium term, at an average<br />
annual rate of 17.8 per cent. The increase over the seven-year period mainly provides for increased capacity.<br />
Personnel information<br />
Table <strong>36</strong>.49 <strong>National</strong> Lotteries Board<br />
Personnel post status as at 30 September 2011 Number of personnel posts filled / planned for on funded establishment<br />
Number of<br />
posts on<br />
approved<br />
establishment<br />
Number of<br />
funded<br />
posts<br />
Number of<br />
vacant posts<br />
Actual Mid-year1 Medium-term estimate<br />
2008/09 2009/10 2010/11 2011/12 2012/13 2013/14 2014/15<br />
Executive board<br />
members<br />
– – – 1 1 – – – – –<br />
Executive<br />
management<br />
2 2 – 2 2 2 2 6 6 6<br />
Senior<br />
management<br />
10 8 2 8 8 8 8 7 7 7<br />
Middle<br />
management<br />
28 22 6 17 18 22 22 27 30 32<br />
Professionals 1 1 1 1 2 1 1 2 2 2<br />
Skilled 77 63 14 35 50 63 63 96 99 102<br />
Semi-skilled 30 30 – 25 26 30 30 48 48 50<br />
Very low skilled 7 7 – 6 7 7 7 7 7 7<br />
Total 155 133 23 95 114 133 133 193 199 206<br />
Compensation<br />
(R thous<strong>and</strong>)<br />
22 637 33 922 45 413 58 680 88 333 97 124 106 7<strong>36</strong><br />
Unit cost<br />
(R thous<strong>and</strong>)<br />
1. As at 30 September 2011.<br />
238 298 341 441 458 488 518<br />
As at 30 September 2011, the board had an approved establishment of 155 posts. The number of filled posts<br />
grew from 95 in 2008/09 to 133 in 2011/12. Over the MTEF period, filled posts are expected to increase to 206.<br />
As at 30 September 2011, there were 23 vacancies, most of them in the skilled classification. The ratio of<br />
support staff to line staff is 1:13.<br />
<strong>National</strong> Metrology Institute of South Africa<br />
Overview: 2008/09 – 2014/15<br />
The <strong>National</strong> Metrology Institute of South Africa is m<strong>and</strong>ated by the Measurement Unit <strong>and</strong> Measurement<br />
St<strong>and</strong>ards Act (2006) to maintain the international system of units <strong>and</strong> ensure that South African measurements,<br />
st<strong>and</strong>ards <strong>and</strong> units are internationally comparable <strong>and</strong> scientifically valid. The institute is responsible for the<br />
maintenance <strong>and</strong> dissemination of the international system of units <strong>and</strong> any other appropriate measurement units<br />
for South Africa. The institute also maintains <strong>and</strong> develops primary scientific national measurement st<strong>and</strong>ards<br />
for South Africa <strong>and</strong> ensures global measurement equivalence.<br />
The institute’s objectives include keeping <strong>and</strong> maintaining the equipment necessary for bringing national<br />
measurement st<strong>and</strong>ards <strong>and</strong> certification of reference materials into being. It aims to disseminate traceability,<br />
measurement expertise <strong>and</strong> services to South African commercial enterprises <strong>and</strong> industry by means of<br />
calibration, measurement analysis, <strong>and</strong> appropriate technology <strong>and</strong> skills transfer. The institute also undertakes<br />
to establish confidence in the accuracy of national measurement st<strong>and</strong>ards by means of suitable <strong>and</strong> documented<br />
verification processes.<br />
59
2012 Estimates of <strong>National</strong> Expenditure<br />
The launch of the second industrial policy action plan in February 2011 reaffirmed the institute’s role in the<br />
technical infrastructure, where particular mention was made of the contribution of the institute’s work plan<br />
aligned to the plan’s outcomes. The institute successfully developed a plan of action, which mapped out the<br />
metrology impact on the plan’s priority sectors for the coming years.<br />
Performance<br />
Previously, the institute had two indicators, maintenance of the national measurement st<strong>and</strong>ards <strong>and</strong> calibration<br />
<strong>and</strong> dissemination of national st<strong>and</strong>ards. These have been exp<strong>and</strong>ed to include performance monitoring on<br />
strategic planning.<br />
Selected performance indicators<br />
Table <strong>36</strong>.50 <strong>National</strong> Metrology Institute of South Africa<br />
Indicator Activity/Objective/Programme/Project Past Current Projections<br />
Number of new gazetted<br />
national st<strong>and</strong>ards1 Number of national st<strong>and</strong>ards<br />
improved per year2 Number of benchmarking<br />
activities performed per year<br />
Number of calibration <strong>and</strong><br />
measurement capabilities in<br />
international database<br />
Number of calibration services<br />
performed for industry per<br />
year<br />
Number of certified reference<br />
materials supplied to health,<br />
food <strong>and</strong> environmental<br />
industries per year<br />
Bursary programmes per year<br />
for a skilled <strong>and</strong> competent<br />
workforce for measurements<br />
in industry<br />
Number of publications on<br />
measurement in journals <strong>and</strong><br />
conferences per year<br />
Number of interns in service<br />
per year<br />
60<br />
Maintenance of the national measurement<br />
st<strong>and</strong>ards <strong>and</strong> international benchmarking<br />
Upgrade of existing measurement st<strong>and</strong>ards <strong>and</strong><br />
development of new measurement st<strong>and</strong>ards <strong>and</strong><br />
reference materials in line with the requirements<br />
of commerce <strong>and</strong> industry<br />
Maintenance of the national measurement<br />
st<strong>and</strong>ards <strong>and</strong> international benchmarking<br />
Dissemination, measurement expertise <strong>and</strong><br />
services to South African commerce <strong>and</strong> industry<br />
by means of calibration, measurement or analysis<br />
<strong>and</strong> certified reference materials<br />
Dissemination, measurement expertise <strong>and</strong><br />
services to South African commerce <strong>and</strong> industry<br />
by means of calibration, measurement or analysis<br />
<strong>and</strong> certified reference materials<br />
Upgrade of existing measurement st<strong>and</strong>ards <strong>and</strong><br />
development of new measurement st<strong>and</strong>ards <strong>and</strong><br />
reference materials in line with the requirements<br />
of commerce <strong>and</strong> industry<br />
Establish <strong>and</strong> maintain the necessary expertise<br />
<strong>and</strong> competencies according to internationally<br />
acceptable st<strong>and</strong>ards<br />
Establish <strong>and</strong> maintain the necessary expertise<br />
<strong>and</strong> competencies according to internationally<br />
acceptable st<strong>and</strong>ards<br />
Establish <strong>and</strong> maintain the necessary expertise<br />
<strong>and</strong> competencies according to internationally<br />
acceptable st<strong>and</strong>ards<br />
2008/09 2009/10 2010/11 2011/12 2012/13 2013/14 2014/15<br />
42 44 42 5 5 9 6<br />
– – – 12 5 10 7<br />
28 34 24 25 22 23 21<br />
342 345 356 356 <strong>36</strong>5 376 405<br />
980 1 111 1 350 1 811 1 849 1 787 1 702<br />
78 69 64 64 74 98 110<br />
– – 3 10 12 15 18<br />
11 11 15 22 17 22 25<br />
4 8 2 5 5 5 6<br />
1. The large decrease in 2011/12 is because this indicator changed in 2011/12 from measuring the total number of gazetted national measurement st<strong>and</strong>ards to the<br />
number of new national measurement st<strong>and</strong>ards to be gazetted each year.<br />
2. No historical information is available, as this is a new performance indicator.
Programmes/activities/objectives<br />
Table <strong>36</strong>.51 <strong>National</strong> Metrology Institute of South Africa<br />
<strong>Vote</strong> <strong>36</strong>: <strong>Trade</strong> <strong>and</strong> <strong>Industry</strong><br />
Audited outcome<br />
Revised<br />
estimate Medium-term estimate<br />
R thous<strong>and</strong> 2008/09 2009/10 2010/11 2011/12 2012/13 2013/14 2014/15<br />
Maintenance of the national<br />
measurement st<strong>and</strong>ards <strong>and</strong><br />
international benchmarking<br />
32 491 39 959 41 <strong>36</strong>0 57 665 53 035 87 771 123 258<br />
Dissemination, measurement expertise<br />
<strong>and</strong> services to South African<br />
commerce <strong>and</strong> industry by means of<br />
calibration, measurement or analysis<br />
<strong>and</strong> certified reference materials<br />
10 830 13 320 13 787 19 222 17 588 29 264 41 086<br />
Upgrade of existing measurement<br />
st<strong>and</strong>ards <strong>and</strong> development of new<br />
measurement st<strong>and</strong>ards <strong>and</strong> reference<br />
materials in line with the requirements<br />
of commerce <strong>and</strong> industry<br />
5 415 6 660 6 893 9 611 8 794 14 632 20 543<br />
Establish <strong>and</strong> maintain the necessary<br />
expertise <strong>and</strong> competencies according<br />
to internationally acceptable st<strong>and</strong>ards<br />
5 415 6 660 6 893 9 611 8 794 14 632 20 543<br />
Total expense 54 152 66 598 68 934 96 108 88 211 146 299 205 430<br />
The <strong>National</strong> Metrology Institute of South Africa had a total budget of R96.1 million in 2011/12, of which<br />
44.8 per cent was used for compensation of employees <strong>and</strong> 42.5 per cent for goods <strong>and</strong> services.<br />
Savings <strong>and</strong> cost effectiveness measures<br />
In 2011/12, the institute decided to reduce its participation in less critical international activities from 2012/13<br />
onward. Technical trips will also be linked more tightly to research outcomes. These measures are expected to<br />
result in a saving of 31 per cent on travel in 2011/12.<br />
The institute centralised stationary procurement during the last quarter of 2011/12 to ensure more efficient cost<br />
procurement <strong>and</strong> control. Coupled with a centralised printing solution <strong>and</strong> a shared point information<br />
management system planned for 2012/13, excessive spending on printing cartridges <strong>and</strong> a paper is expected to<br />
reduce by R350 000 over the medium term. Operational expenditure has been growing noticeably due to<br />
increased maintenance costs for the aging humidity, ventilation <strong>and</strong> air conditioning systems <strong>and</strong> instruments.<br />
The entity reprioritised the bulk of the savings in 2011/12 for new humidity, ventilation <strong>and</strong> air conditioning<br />
systems <strong>and</strong> obtained additional funding to replace aged instruments. This is expected to reduce the<br />
maintenance cost by about R500 000 per year over the MTEF period.<br />
Expenditure estimates<br />
Table <strong>36</strong>.52 <strong>National</strong> Metrology Institute of South Africa<br />
Statement of financial performance<br />
Audited outcome<br />
Revised<br />
estimate Medium-term estimate<br />
R thous<strong>and</strong> 2008/09 2009/10 2010/11 2011/12 2012/13 2013/14 2014/15<br />
Revenue<br />
Non-tax revenue 8 378 7 712 9 381 8 527 11 690 11 861 15 885<br />
Other non-tax revenue 8 378 7 712 9 381 8 527 11 690 11 861 15 885<br />
Transfers received 54 999 54 806 57 519 87 581 76 521 134 438 189 545<br />
Total revenue 63 377 62 518 66 900 96 108 88 211 146 299 205 430<br />
Expenses<br />
Current expenses 54 152 66 598 68 934 96 108 88 211 146 299 205 430<br />
Compensation of employees 30 050 33 701 35 602 43 074 47 529 62 535 77 995<br />
Goods <strong>and</strong> services 21 949 22 918 22 445 40 834 25 022 63 240 96 494<br />
Depreciation 2 153 9 979 10 884 12 200 15 660 20 524 30 940<br />
Interest, dividends <strong>and</strong> rent on l<strong>and</strong> – – 3 – – – –<br />
Total expenses 54 152 66 598 68 934 96 108 88 211 146 299 205 430<br />
61
2012 Estimates of <strong>National</strong> Expenditure<br />
Table <strong>36</strong>.52 <strong>National</strong> Metrology Institute of South Africa (continued)<br />
Statement of financial performance<br />
62<br />
Audited outcome<br />
Revised<br />
estimate Medium-term estimate<br />
R thous<strong>and</strong> 2008/09 2009/10 2010/11 2011/12 2012/13 2013/14 2014/15<br />
Surplus / (Deficit) 9 225 (4 080) (2 034) – – – –<br />
Statement of financial position<br />
Carrying value of assets 20 701 63 802 56 132 71 640 64 980 80 455 126 614<br />
of which:<br />
Acquisition of assets 14 872 7 667 3 272 27 708 9 000 35 999 77 099<br />
Inventory 209 – – – – – –<br />
Receivables <strong>and</strong> prepayments 4 984 3 603 2 025 1 298 844 574 382<br />
Cash <strong>and</strong> cash equivalents 9 505 8 446 13 614 8 000 10 407 4 649 –<br />
Total assets 35 399 75 851 71 771 80 938 76 231 85 678 126 996<br />
Accumulated surplus / (deficit) 28 917 70 533 68 501 68 501 68 501 68 501 94 219<br />
<strong>Trade</strong> <strong>and</strong> other payables 6 482 5 318 3 270 12 437 7 730 17 177 32 777<br />
Total equity <strong>and</strong> liabilities 35 399 75 851 71 771 80 938 76 231 85 678 126 996<br />
Expenditure trends<br />
The spending focus over the MTEF period will be on providing metrology <strong>and</strong> advanced measurement<br />
assistance to specific industry sectors <strong>and</strong> building capacity in the institution.<br />
Revenue is generated mainly from transfers from the department. Other non-tax revenue is from fees for<br />
dissemination services. Transfers increased from R55 million in 2008/09 to R87.6 million in 2011/12, at an<br />
average rate of 16.8 per cent. Transfers from the department are expected to increase to R189.5 million over the<br />
medium term, at an average annual rate of 29.4 per cent, which will include contributions towards capital<br />
expenditure of R25 million for 2011/12; R50 million in 2013/14 <strong>and</strong> R100 million in 2014/15. The entity will<br />
focus on growth in capital investment to replace aged infrastructure <strong>and</strong> acute skills shortage over the MTEF<br />
period.<br />
Expenditure increased from R54.2 million in 2008/09 to R96.1 million in 2011/12, at an average annual rate of<br />
21.1 per cent, <strong>and</strong> is expected to increase to R205.4 million over the medium term, at an average annual rate of<br />
28.8 per cent. Spending on compensation of employees grew from R30.1 million in 2008/09 to R43.1 million in<br />
2011/12, at an average annual rate of 12.8 per cent, due to inflation related annual salary increases <strong>and</strong> the<br />
filling of critical vacancies. The new recruits will be mainly in the technical divisions <strong>and</strong> will play a key role in<br />
research <strong>and</strong> in enhancing the technical capability of the institute. Due to the scarcity of measurement skills<br />
nationally, the institution will further scale up its bursary <strong>and</strong> learnership programmes. Lower than normal<br />
capital expenditure contributed to higher than expected maintenance costs <strong>and</strong> significant equipment down time<br />
in the laboratories.<br />
The institute maintained the 42 gazetted national measurement st<strong>and</strong>ards. To ensure the national measurement<br />
st<strong>and</strong>ards are comparable to other national <strong>and</strong> international st<strong>and</strong>ards <strong>and</strong> measurements, the institute<br />
participated in 12 international comparisons. This underpins the calibration <strong>and</strong> analytical services offered to<br />
industry.<br />
In support of commerce, industry <strong>and</strong> innovation, the institute continuously develops <strong>and</strong> improves national<br />
measurement st<strong>and</strong>ards. A number of physical metrology parameters have been improved, <strong>and</strong> a new iodine<br />
stabilised laser was commissioned, <strong>and</strong> declared the new national measurement st<strong>and</strong>ard for length. The number<br />
of new reference methods that underpin industry measurements has increased significantly.<br />
Despite the economic slowdown <strong>and</strong> infrastructure challenges that have seriously impacted on service delivery,<br />
as is evident in the decline in the number of calibrations performed, there was a noticeable increase in the<br />
number of reference measurements sold to industry, exceeding targets. Gas measurement capabilities have been<br />
improved in support of stack <strong>and</strong> automotive emissions monitoring.<br />
The technical expertise is evident through the publication of 22 technical papers in peer-reviewed journals <strong>and</strong><br />
conference proceedings, as well as a chapter in a scientific book. A major innovative achievement was the<br />
design <strong>and</strong> manufacture of a ball plate, for which a claim for intellectual property rights has been filed.
<strong>Vote</strong> <strong>36</strong>: <strong>Trade</strong> <strong>and</strong> <strong>Industry</strong><br />
The institute managed to establish <strong>and</strong> maintain the necessary expertise <strong>and</strong> competencies according to<br />
internationally acceptable st<strong>and</strong>ards. The intern <strong>and</strong> bursary programme were exp<strong>and</strong>ed in 2011/12, when ten<br />
bursaries were awarded <strong>and</strong> three interns were hosted. It is projected that more than 20 bursaries will be<br />
awarded over the MTEF period.<br />
Personnel information<br />
Table <strong>36</strong>.53 <strong>National</strong> Metrology Institute of South Africa<br />
Personnel post status as at 30 September 2011 Number of personnel posts filled / planned for on funded establishment<br />
Number of posts on<br />
approved<br />
establishment<br />
Number of<br />
funded<br />
posts<br />
Number of vacant<br />
posts<br />
Actual Mid-year1 Medium-term estimate<br />
2008/09 2009/10 2010/11 2011/12 2012/13 2013/14 2014/15<br />
Executive board<br />
members<br />
1 1 – – – 1 1 1 1 1<br />
Executive<br />
management<br />
6 6 – 5 5 6 7 7 7 7<br />
Senior<br />
management<br />
6 6 – 6 6 6 6 6 6 6<br />
Professionals 70 70 2 60 60 63 70 74 82 87<br />
Skilled 6 6 – 6 6 6 6 6 6 6<br />
Semi-skilled 17 17 – 13 17 17 17 17 17 17<br />
Total 106 106 2 90 94 99 107 111 119 124<br />
Compensation<br />
(R thous<strong>and</strong>)<br />
30 050 33 701 35 602 43 074 47 529 62 535 77 995<br />
Unit cost<br />
(R thous<strong>and</strong>)<br />
1. As at 30 September 2011.<br />
334 359 <strong>36</strong>0 403 428 526 629<br />
As at 30 September 2011, the institute had an establishment of 106 posts. The number of posts filled increased<br />
from 90 in 2008/09 to 107 in 2011/12, <strong>and</strong> is expected to grow to 124 over the medium term. On its separation<br />
from the Council for Scientific <strong>and</strong> Industrial Research, the institute had to purchase a new ICT support system<br />
<strong>and</strong> appoint people with technical skills to manage the system. The number of support staff was the equivalent<br />
to 23 per cent of line staff <strong>and</strong> consultants were the equivalent to 1 per cent of the total staff.<br />
<strong>National</strong> Regulator for Compulsory Specifications<br />
Overview: 2008/09 – 2014/15<br />
The <strong>National</strong> Regulator for Compulsory Specifications was established in September 2008 in terms of the<br />
<strong>National</strong> Regulator for Compulsory Specifications Act (2008). The regulator’s broad m<strong>and</strong>ate is to promote<br />
public health <strong>and</strong> safety, environmental protection, <strong>and</strong> fair trade. This will be achieved through establishing<br />
sound regulatory infrastructure, which will incorporate updated compulsory specifications to promote consumer<br />
health <strong>and</strong> safety, environmental protection, <strong>and</strong> the development of South African industries <strong>and</strong> the South<br />
African economy. The regulator is mindful of the need to balance the burden of overregulation with the benefits<br />
of pragmatic, focused regulation.<br />
Over the medium term, the regulator will use resources to enhance the competitiveness of the South African<br />
economy. This will foster a culture of compliance with compulsory specifications. This will be achieved<br />
through: investing in human capital <strong>and</strong> IT; developing sound regulatory models; implementing the risk based<br />
approach; <strong>and</strong> focusing on research that will develop an evidence based underst<strong>and</strong>ing of where compliance<br />
gaps exist, by means of a multifaceted deployment of resources to bridge these gaps over the medium term. The<br />
regulator’s interventions will not only be focused on inspections <strong>and</strong> enforcement, but also on positive measures<br />
such as industry specific communication <strong>and</strong> consumer awareness campaigns.<br />
The regulator is structured into five sectors, which serve as units in fulfilling its m<strong>and</strong>ate of market surveillance<br />
<strong>and</strong> enforcement. These sectors are: automotive; chemical, mechanical <strong>and</strong> materials; electro-technical; food<br />
<strong>and</strong> associated industries, <strong>and</strong> legal metrology.<br />
Performance<br />
In 2010/11, the regulator was responsible for the development <strong>and</strong> subsequent submission of eight new <strong>and</strong><br />
amended compulsory specifications <strong>and</strong> technical regulations to the Department of <strong>Trade</strong> <strong>and</strong> <strong>Industry</strong>. These<br />
63
2012 Estimates of <strong>National</strong> Expenditure<br />
specifications will add to the growing list of quality controls that protect consumers. 57 572 inspections across<br />
the organisation were carried out, exceeding the target of 52 940. R6 million worth of goods were confiscated<br />
<strong>and</strong> destroyed. In addition, the regulator destroyed or rejected fish <strong>and</strong> fishery products <strong>and</strong> canned meat<br />
products with an estimated value of R21 million. In 2010/11, the total goods not compliant in terms of legal<br />
metrology confiscated increased from the R37.1 million in 2009/10 to an R148.9 million. Legal metrology<br />
inspects products <strong>and</strong> measuring equipment to ensure that products are in fact sold in the exact amounts that are<br />
declared on the packaging. In all, the regulator issued 14 188 embargoes against non-compliant products <strong>and</strong><br />
rejected 678 measuring instruments. Furthermore, prosecutions were instituted against 90 businesses in 2010/11.<br />
Selected performance indicators<br />
Table <strong>36</strong>.54 <strong>National</strong> Regulator for Compulsory Specifications<br />
Indicator Programme/Activity Past Current Projections<br />
Percentage of<br />
inspections<br />
conducted in<br />
accordance<br />
with the<br />
compulsory<br />
specification,<br />
divisional<br />
procedures<br />
<strong>and</strong> applicable<br />
legislation 1<br />
Number of<br />
inspections<br />
conducted in<br />
accordance<br />
with the<br />
compulsory<br />
specification,<br />
divisional<br />
procedures<br />
<strong>and</strong> applicable<br />
legislation<br />
Number of<br />
inspections<br />
conducted<br />
within the trade<br />
metrology<br />
domain, in<br />
accordance<br />
with the<br />
technical<br />
regulations,<br />
divisional<br />
procedures<br />
<strong>and</strong> applicable<br />
legislation<br />
Number of new<br />
<strong>and</strong> amended<br />
compulsory<br />
specifications<br />
developed per<br />
year<br />
64<br />
Ensure maximum<br />
coverage within the<br />
food <strong>and</strong> fisheries<br />
regulated industries<br />
Ensure maximum<br />
coverage within the<br />
automotive, electrotechnical<br />
<strong>and</strong><br />
chemicals industries<br />
Ensure maximum<br />
coverage within the<br />
trade metrology<br />
domain<br />
Maintaining <strong>and</strong><br />
making<br />
recommendations to<br />
the minister on<br />
compulsory<br />
specifications <strong>and</strong><br />
technical regulations<br />
2008/09 2009/10 2010/11 2011/12 2012/13 2013/14 2014/15<br />
24 389<br />
inspections<br />
Chemicals<br />
materials<br />
<strong>and</strong><br />
mechanicals<br />
1 902<br />
Automotive<br />
1 538<br />
Electrotechnical<br />
3 821<br />
37 741<br />
inspections<br />
Chemicals<br />
materials <strong>and</strong><br />
mechanicals<br />
5 610<br />
57 572<br />
inspections<br />
Chemicals<br />
materials<br />
<strong>and</strong><br />
mechanicals<br />
6 967<br />
Automotive<br />
4 986<br />
Electrotechnical<br />
8 414<br />
100% of all<br />
production <strong>and</strong><br />
consignments<br />
Chemicals<br />
materials <strong>and</strong><br />
mechanicals<br />
8 160<br />
Automotive<br />
7 560<br />
Electrotechnical<br />
7 600<br />
100% of all<br />
production <strong>and</strong><br />
consignments<br />
Chemicals<br />
materials <strong>and</strong><br />
mechanicals<br />
6 000<br />
Automotive<br />
5 000<br />
Electrotechnical<br />
5 000<br />
100% of all<br />
production <strong>and</strong><br />
consignments<br />
Chemicals<br />
materials <strong>and</strong><br />
mechanicals<br />
6 000<br />
Automotive<br />
5 000<br />
Electrotechnical<br />
6 000<br />
100% of all<br />
production <strong>and</strong><br />
consignments<br />
Chemicals<br />
materials <strong>and</strong><br />
mechanicals<br />
6 000<br />
Automotive<br />
5 000<br />
Electrotechnical<br />
6 000<br />
3 231 5 401 6 100 5 438 4 <strong>36</strong>9 5 058 6 029<br />
9 8 8 11 12 12 12<br />
1. Only the absolute numbers are available for past years, due to the difficulty of predicting absolute numbers, the regulator projects in percentage terms.
Programmes/activities/objectives<br />
Table <strong>36</strong>.55 <strong>National</strong> Regulator for Compulsory Specifications<br />
<strong>Vote</strong> <strong>36</strong>: <strong>Trade</strong> <strong>and</strong> <strong>Industry</strong><br />
Audited outcome<br />
Revised<br />
estimate Medium-term estimate<br />
R thous<strong>and</strong> 2008/09 2009/10 2010/11 2011/12 2012/13 2013/14 2014/15<br />
Risk based inspections to maximise<br />
compliance with all specifications <strong>and</strong><br />
technical regulations<br />
– – – 100 509 133 9<strong>36</strong> 153 068 165 406<br />
Extend NRCS Scope (R&D, Special<br />
Investigations Unit)<br />
– – – 8 556 9 698 11 107 11 998<br />
To inform <strong>and</strong> educate stakeholders,<br />
industry <strong>and</strong> consumers regarding<br />
NRCS obligations with regard to<br />
Compulsory Specifications <strong>and</strong><br />
Technical Regulations<br />
– – – 10 276 11 186 12 077 16 215<br />
To become the employer of choice with<br />
motivated <strong>and</strong> productive staff<br />
– – – 7 <strong>36</strong>2 8 096 8 930 10 171<br />
NRCS well resourced including fit for<br />
purpose IT<br />
– – – 9 857 10 716 11 646 12 406<br />
Optimise revenue generation <strong>and</strong><br />
collection<br />
– – – 20 635 22 631 24 849 26 549<br />
Ensure good corporate governance,<br />
ITC, legal <strong>and</strong> risk management<br />
– – – 30 034 33 792 38 356 41 341<br />
Total expense – – – 187 229 230 055 260 032 284 086<br />
The <strong>National</strong> Regulator for Compulsory Specifications had a total budget of R187.2 million in 2011/12, of<br />
which 64.4 per cent was used for compensation of employees.<br />
Savings <strong>and</strong> cost effectiveness measures<br />
No savings were effected. However, the regulator will continuously monitor expenditure on a monthly basis to<br />
identify costs that can be reduced.<br />
Expenditure estimates<br />
Table <strong>36</strong>.56 <strong>National</strong> Regulator for Compulsory Specifications<br />
Statement of financial performance<br />
Audited outcome<br />
Revised<br />
estimate Medium-term estimate<br />
R thous<strong>and</strong> 2008/09 2009/10 2010/11 2011/12 2012/13 2013/14 2014/15<br />
Revenue<br />
Non-tax revenue 62 044 122 118 149 820 150 086 151 940 166 160 184 257<br />
Sale of goods <strong>and</strong> services other than<br />
capital assets<br />
of which:<br />
57 211 111 284 130 564 146 004 147 815 162 025 182 595<br />
Sales by market establishments 57 211 111 284 130 564 146 004 147 815 162 025 182 595<br />
Other non-tax revenue 4 833 10 834 19 256 4 082 4 125 4 135 1 662<br />
Transfers received 17 495 35 933 33 042 37 173 78 115 99 143 104 554<br />
Total revenue 79 539 158 051 182 862 187 259 230 055 265 303 288 811<br />
Expenses<br />
Current expenses 78 224 150 293 156 457 187 229 230 055 260 032 284 086<br />
Compensation of employees 49 356 96 355 104 127 120 523 152 092 177 186 193 786<br />
Goods <strong>and</strong> services 27 496 49 823 48 070 60 573 72 025 76 520 83 372<br />
Depreciation 1 208 3 574 3 900 6 010 5 808 6 324 6 928<br />
Interest, dividends <strong>and</strong> rent on l<strong>and</strong> 164 541 <strong>36</strong>0 123 130 1 –<br />
Transfers <strong>and</strong> subsidies – 1 097 763 – – – –<br />
Total expenses 78 224 151 390 157 220 187 229 230 055 260 032 284 086<br />
Surplus / (Deficit) 1 315 6 661 25 642 30 – 5 271 4 725<br />
65
2012 Estimates of <strong>National</strong> Expenditure<br />
Table <strong>36</strong>.56 <strong>National</strong> Regulator for Compulsory Specifications (continued)<br />
Statement of financial position<br />
66<br />
Audited outcome<br />
Revised<br />
estimate Medium-term estimate<br />
R thous<strong>and</strong> 2008/09 2009/10 2010/11 2011/12 2012/13 2013/14 2014/15<br />
Carrying value of assets 11 407 10 523 17 832 18 230 23 606 35 782 49 674<br />
of which:<br />
Acquisition of assets 12 724 2 578 11 182 6 408 11 185 18 500 20 820<br />
Investments – – – 25 900 20 000 15 000 10 000<br />
Receivables <strong>and</strong> prepayments 7 880 7 625 15 540 13 188 9 108 15 388 9 538<br />
Cash <strong>and</strong> cash equivalents 17 142 30 617 42 314 21 549 28 467 13 884 10 719<br />
Total assets <strong>36</strong> 429 48 765 75 686 78 867 81 182 80 054 79 931<br />
Accumulated surplus / (deficit) 935 7 597 33 240 33 210 31 100 25 829 21 104<br />
Finance lease 4 445 3 270 1 701 601 17 – –<br />
<strong>Trade</strong> <strong>and</strong> other payables 19 417 24 095 25 260 19 521 19 298 23 480 26 108<br />
Provisions 11 632 13 803 15 485 25 535 30 767 30 745 32 719<br />
Total equity <strong>and</strong> liabilities <strong>36</strong> 429 48 765 75 686 78 867 81 182 80 054 79 931<br />
Expenditure trends<br />
The regulator generates 66 per cent of its revenue from levies <strong>and</strong> services rendered for export certification,<br />
vehicle homologation <strong>and</strong> letter of authority. Non-tax revenue is expected to increase from R62 million in<br />
2008/09 to R184.3 million in 2014/15. The increase is attributed to increases in compliance by the levy payers,<br />
growth in economic activities, as well as annual levy fee increases. Transfers received are expected to increase<br />
from R37.2 million in 2011/12 to R104.6 million in 2014/15, at an average annual rate of 41.2 per cent, due to<br />
additional funding for legal metrology <strong>and</strong> other capacity needs.<br />
Expenditure increases from R78.2 million in 2008/09 to R284.1 million in 2014/15, at an average annual rate of<br />
24 per cent. The increase is driven mainly by spending on compensation of employees, which is expected to<br />
grow from R120.5 million to R193.8 million over the medium term at an average annual rate of 17.2 per cent.<br />
The increased spending is as a result of an expected increase in employee numbers, from 375 in 2011/12 to<br />
440 in 2014/15.<br />
Personnel information<br />
Table <strong>36</strong>.57 <strong>National</strong> Regulator for Compulsory Specifications<br />
Executive<br />
board<br />
members<br />
Executive<br />
management<br />
Senior<br />
management<br />
Middle<br />
management<br />
Personnel post status as at 30 September 2011 Number of personnel posts filled / planned for on funded establishment<br />
Number of<br />
posts on<br />
approved<br />
establishment<br />
Number of<br />
funded posts<br />
Number of<br />
vacant<br />
posts Actual Mid- year1 Medium-term estimate<br />
2008/09 2009/10 2010/11 2011/12 2012/13 2013/14 2014/15<br />
1 1 1 1 1 1 1 1 1 1<br />
8 8 – – 10 8 10 8 10 10<br />
4 4 – – 5 7 6 5 5 5<br />
51 51 50 50 50 48 49 55 55 55<br />
Skilled 157 153 157 157 154 141 180 197 202 202<br />
Semi-skilled 86 74 86 86 86 86 129 109 157 167<br />
Total 307 291 294 294 306 291 375 375 430 440<br />
Compensation<br />
(R thous<strong>and</strong>)<br />
49 356 96 355 104 127 120 523 152 091 177 186 193 786<br />
Unit cost<br />
(R thous<strong>and</strong>)<br />
1. As at 30 September 2011.<br />
168 315 358 321 406 412 440<br />
As at 30 September 2011, the regulator had an establishment of 307 posts, of which 291 were funded. The<br />
number of filled posts increased from 294 in 2008/09 to 375 in 2011/12 <strong>and</strong> is projected to increase to 440 over<br />
the medium term. The increase in both periods is to address the strategic imperative requirements of the
<strong>Vote</strong> <strong>36</strong>: <strong>Trade</strong> <strong>and</strong> <strong>Industry</strong><br />
regulator. The increase in staff also bolsters the border enforcement programme, the special investigations unit<br />
<strong>and</strong> the urgent need to build capacity in other operational areas such as legal metrology. The regulator had<br />
64 vacancies as at 30 September 2011 <strong>and</strong> plans to recruit staff over the medium term. As at 30 September<br />
2011, the number of support staff was equivalent to 20 per cent of line staff.<br />
Small Enterprise Development Agency<br />
Overview: 2008/09 – 2014/15<br />
The Small Enterprise Development Agency provides non-financial business development <strong>and</strong> support services<br />
to small enterprises in partnership with other role players. Its mission is to develop, support <strong>and</strong> promote small<br />
enterprises to ensure their growth <strong>and</strong> sustainability. It aims to enhance the competitiveness <strong>and</strong> capabilities of<br />
small enterprises through coordinated services, programmes <strong>and</strong> projects, <strong>and</strong> to ensure equitable access to<br />
business support services. The agency aims to promote economic growth, job creation <strong>and</strong> equity.<br />
Through its offerings <strong>and</strong> partnerships with other role players, the agency contributes mostly to the Department<br />
of <strong>Trade</strong> <strong>and</strong> <strong>Industry</strong>’s strategic objective of promoting broader participation, equity <strong>and</strong> redress in the<br />
economy. The objective forms the basis of the agency’s strategic goal of ensuring that the small enterprise<br />
sector grows <strong>and</strong> increases its contribution to sustainable <strong>and</strong> equitable social <strong>and</strong> economic development,<br />
employment <strong>and</strong> wealth creation.<br />
In terms of the industrial policy action plan, the agency is expected to contribute to four action programmes<br />
prioritised by the department over the medium term. These are: mentoring small to medium component<br />
manufacturers; participating in the skills transfer <strong>and</strong> technology upgrading programme for small scale saw<br />
millers; developing <strong>and</strong> establishing business management structures; <strong>and</strong> providing training to charcoal<br />
manufacturing enterprises <strong>and</strong> cooperatives in communities showing interest in charcoal production. The<br />
organisation shall focus on: increasing the incubation footprint, directing specific interventions to the small <strong>and</strong><br />
medium enterprise segment, identifying <strong>and</strong> working with large scale projects <strong>and</strong> cooperatives, <strong>and</strong> prioritising<br />
growth sectors.<br />
Performance<br />
63 916 potential <strong>and</strong> existing businesses were attracted to the agency’s network for the first time in 2010/11.<br />
26 747 of these were assessed <strong>and</strong> registered on the agency’s client database. Of those, 12 577 received an<br />
agency intervention during the year. 2 916 clients were surveyed to assess their satisfaction levels with the<br />
quality of the agency’s services. 93 per cent indicated that the service was satisfactory. 677 potential<br />
entrepreneurs were converted into trading businesses as a result of assistance from the agency during the year.<br />
Of the assisted clients, 2 657 were evaluated to measure business performance improvement. 37 per cent of the<br />
surveyed clients reported an increase in turnover <strong>and</strong> 27 per cent reported an increase in number of people<br />
employed.<br />
The agency’s technology programme supported 1 479 clients, resulting in 202 new businesses, 893 direct jobs<br />
<strong>and</strong> 2 920 indirect jobs.<br />
Selected performance indicators<br />
Table <strong>36</strong>.58 Small Enterprise Development Agency<br />
Indicator Programme/Activity/Objective/Project Past 1 Current Projections<br />
Number of new clients<br />
attracted per year<br />
Number of clients the<br />
agency works with per<br />
year<br />
Number of adopted<br />
enterprises under the<br />
community public<br />
private partnership<br />
programme per year<br />
Ensure equitable access to business support<br />
services<br />
Ensure equitable access to business support<br />
services<br />
Ensure equitable access to business support<br />
services<br />
2008/09 2009/10 2010/11 2011/12 2012/13 2013/14 2014/15<br />
199 830 12 386 60 000 90 000 65 000 65 000 65 000<br />
– 23 000 12 000 25 000 10 400 10 400 10 400<br />
– – 18 20 22 24 26<br />
67
2012 Estimates of <strong>National</strong> Expenditure<br />
Table <strong>36</strong>.58 Small Enterprise Development Agency (continued)<br />
Indicator Programme/Activity/Objective/Project Past 1 Current Projections<br />
Value of service<br />
provision costs<br />
covered by partners<br />
Percentage of clients<br />
satisfied with quality of<br />
the agency’s services:<br />
2 400 out of 3 000<br />
clients each year<br />
Percentage of existing<br />
SMME clients whose<br />
financial turnover<br />
increased<br />
Percentage of existing<br />
SMME clients whose<br />
number of employees<br />
increased<br />
Number of<br />
partnerships<br />
operational per year<br />
Percentage of clients<br />
satisfied with quality of<br />
agency’s services<br />
Number of jobs<br />
created per year<br />
Number of clients<br />
supported by the<br />
technology<br />
programme per year<br />
Number of clients<br />
assisted with transfer<br />
incentives provided<br />
per year<br />
Number of clients<br />
supported in<br />
conformity<br />
assessment <strong>and</strong><br />
product testing per<br />
year<br />
Number of clients<br />
trained on national<br />
<strong>and</strong> international<br />
st<strong>and</strong>ards per year<br />
Number of clients<br />
supported in system<br />
implementation per<br />
year<br />
68<br />
Ensure equitable access to business support<br />
services<br />
Enhance competitiveness <strong>and</strong> capabilities of<br />
small enterprises through coordinated<br />
services, programmes <strong>and</strong> projects<br />
Enhance competitiveness <strong>and</strong> capabilities of<br />
small enterprises through coordinated<br />
services, programmes <strong>and</strong> projects<br />
Enhance competitiveness <strong>and</strong> capabilities of<br />
small enterprises through coordinated<br />
services, programmes <strong>and</strong> projects<br />
Ensure equitable access to business support<br />
services<br />
Technology programme assisting SMMEs<br />
with technology<br />
Technology programme assisting SMMEs<br />
with technology<br />
Technology programme assisting SMMEs<br />
with technology<br />
Technology programme assisting SMMEs<br />
with technology<br />
Technology programme assisting SMMEs<br />
with technology<br />
Technology programme assisting SMMEs<br />
with technology<br />
Technology programme assisting SMMEs<br />
with technology<br />
1. No past data is available, as the performance measures were not yet in use.<br />
Programmes/activities/objectives<br />
Table <strong>36</strong>.59 Small Enterprise Development Agency<br />
2008/09 2009/10 2010/11 2011/12 2012/13 2013/14 2014/15<br />
– – R6.8m R7.6m R5m R5m R5m<br />
– – 93% 80% 80% 80% 80%<br />
– – 37% 35% 35% 35% 35%<br />
– – 27% 25% 25% 25% 25%<br />
– – 40 30 30 30 30<br />
– – – 80% 80% 80% 80%<br />
– – 893 1 050 – – 1 040<br />
– – 756 1 500 842 935 1 027<br />
– – 26 50 30 34 39<br />
– – 103 100 115 127 140<br />
– – 350 500 385 425 468<br />
– – 26 25 30 34 39<br />
Audited outcome<br />
Revised<br />
estimate Medium-term estimate<br />
R thous<strong>and</strong> 2008/09 2009/10 2010/11 2011/12 2012/13 2013/14 2014/15<br />
Enhance competitiveness <strong>and</strong><br />
capabilities of small enterprises through<br />
coordinated services, programmes <strong>and</strong><br />
projects<br />
88 558 112 083 118 6<strong>36</strong> 147 977 168 565 179 242 190 208<br />
Ensure equitable access to business<br />
support services<br />
97 118 115 732 124 586 118 062 112 972 118 927 124 412<br />
Strengthen the organisation to deliver<br />
on its mission<br />
175 275 193 981 188 072 203 129 165 510 165 429 170 447<br />
Seda Technology Programme (STP)<br />
assisting SMME's with technology<br />
121 268 99 632 78 247 120 069 113 000 119 215 126 <strong>36</strong>9<br />
Total expense 482 219 521 428 509 541 589 2<strong>36</strong> 560 047 582 813 611 435<br />
The Small Enterprise Development Agency had a total budget of R589.2 million in 2011/12, of which 34.9 per<br />
cent was used for compensation of employees <strong>and</strong> 62.6 per cent for goods <strong>and</strong> services.
<strong>Vote</strong> <strong>36</strong>: <strong>Trade</strong> <strong>and</strong> <strong>Industry</strong><br />
Savings <strong>and</strong> cost effectiveness measures<br />
The following measures were put in place in 2008/09 to ensure savings <strong>and</strong> cost effectiveness: budgets are<br />
linked to performance management; the importance of budget planning is highlighted to prevent fiscal dumping;<br />
critical percentages such as compensation of employees as a percentage of total expenditure <strong>and</strong> per client<br />
served are monitored; <strong>and</strong> costs are monitored monthly <strong>and</strong> measures put in place to keep costs within<br />
acceptable limits.<br />
Expenditure estimates<br />
Table <strong>36</strong>.60 Small Enterprise Development Agency<br />
Statement of financial performance<br />
Audited outcome<br />
Revised<br />
estimate Medium-term estimate<br />
R thous<strong>and</strong> 2008/09 2009/10 2010/11 2011/12 2012/13 2013/14 2014/15<br />
Revenue<br />
Non-tax revenue 74 647 75 254 34 887 23 566 19 392 13 000 8 000<br />
Other non-tax revenue 74 647 75 254 34 887 23 566 19 392 13 000 8 000<br />
Transfers received 484 770 409 497 461 121 553 290 540 655 569 813 603 435<br />
Total revenue 559 417 484 751 496 008 576 856 560 047 582 813 611 435<br />
Expenses<br />
Current expenses 482 219 521 428 509 541 589 2<strong>36</strong> 560 047 582 813 611 435<br />
Compensation of employees 165 899 169 603 189 848 205 648 220 042 235 445 251 926<br />
Goods <strong>and</strong> services 302 508 339 106 303 799 <strong>36</strong>8 900 324 960 332 267 344 978<br />
Depreciation 9 602 10 512 13 702 12 518 12 760 12 690 12 000<br />
Interest, dividends <strong>and</strong> rent on l<strong>and</strong> 4 210 2 207 2 192 2 170 2 285 2 411 2 531<br />
Total expenses 482 219 521 428 509 541 589 2<strong>36</strong> 560 047 582 813 611 435<br />
Surplus / (Deficit) 77 198 (<strong>36</strong> 677) (13 533) (12 380) – – –<br />
Statement of financial position<br />
Carrying value of assets 35 371 44 982 45 520 49 068 45 790 44 621 45 171<br />
of which:<br />
Acquisition of assets 7 425 20 865 15 616 16 066 9 482 11 521 12 550<br />
Inventory 330 399 341 320 310 300 290<br />
Receivables <strong>and</strong> prepayments 4 996 6 416 4 110 4 500 4 300 4 100 4 000<br />
Cash <strong>and</strong> cash equivalents 206 450 162 082 155 912 105 330 99 425 98 554 99 714<br />
Total assets 247 147 213 879 205 883 159 218 149 825 147 575 149 175<br />
Accumulated surplus / (deficit) 108 121 71 444 57 911 25 531 20 139 20 139 20 139<br />
Finance lease 12 073 12 172 12 172 15 704 17 604 19 454 21 254<br />
Deferred income 7 641 7 641 9 082 7 582 6 082 4 582 3 082<br />
<strong>Trade</strong> <strong>and</strong> other payables 107 175 109 478 110 941 95 000 90 000 87 000 88 000<br />
Provisions 12 137 13 144 15 777 15 401 16 000 16 400 16 700<br />
Total equity <strong>and</strong> liabilities 247 147 213 879 205 883 159 218 149 825 147 575 149 175<br />
Expenditure trends<br />
The spending focus over the MTEF period will be on continuing to develop, support <strong>and</strong> promote small<br />
enterprises to ensure their growth <strong>and</strong> sustainability through non-financial small business services.<br />
Revenue is dominated by transfers from the Department of <strong>Trade</strong> <strong>and</strong> <strong>Industry</strong>. Transfers received increased<br />
from R484.8 million in 2008/09 to R553.3 million in 2011/12, at an average annual rate of 4.5 per cent. Over<br />
the medium term, departmental transfers to the agency <strong>and</strong> the technology programme are expected to increase<br />
to R603.4 million, at an average annual rate of 2.9 per cent.<br />
Total expenditure increased from R482.2 million in 2008/09 to R589.2 million in 2011/12, at an average annual<br />
rate of 6.9 per cent. Over the medium term, expenditure is expected to increase to R611.4 million, at an average<br />
annual rate of 1.2 per cent. This is mainly due to increases in spending on compensation of employees from<br />
R205.6 million in 2011/12 to R251.9 million in 2014/15, as a result of the filling of funded vacancies.<br />
69
2012 Estimates of <strong>National</strong> Expenditure<br />
Personnel information<br />
Table <strong>36</strong>.61 Small Enterprise Development Agency<br />
70<br />
Personnel post status as at 30 September 2011 Number of personnel posts filled / planned for on funded establishment<br />
Number of<br />
posts on<br />
approved<br />
establishment<br />
Number of<br />
funded<br />
posts<br />
Number of<br />
vacant posts<br />
Actual Mid- year1 Medium-term estimate<br />
2008/09 2009/10 2010/11 2011/12 2012/13 2013/14 2014/15<br />
Executive board<br />
members<br />
1 1 1 – 1 1 1 1 1 1<br />
Executive<br />
management<br />
5 5 – 4 4 4 4 5 5 5<br />
Senior<br />
management<br />
27 27 2 19 24 24 23 27 27 27<br />
Middle<br />
management<br />
273 273 54 270 280 291 300 249 252 255<br />
Professionals 244 244 18 176 210 214 165 222 224 227<br />
Semi-skilled 128 128 9 65 53 62 101 117 118 120<br />
Total 678 678 84 534 572 596 594 621 627 635<br />
Compensation<br />
(R thous<strong>and</strong>)<br />
Unit cost<br />
(R thous<strong>and</strong>)<br />
1. As at 30 September 2011.<br />
165 899 169 603 189 848 205 648 220 042 235 445 251 926<br />
311 297 319 346 354 376 397<br />
As at 30 September 2011, the agency had an approved <strong>and</strong> funded establishment of 678 posts. The number of<br />
posts filled increased from 534 in 2008/09 to 594 in 2011/12, <strong>and</strong> is expected to increase to 635 over the<br />
medium term. This is as a result of increased service deliverables. Approximately 72 per cent of the entity’s<br />
personnel are directly involved with service delivery while 28 per cent perform support functions.<br />
South African Bureau of St<strong>and</strong>ards<br />
Overview: 2008/09 – 2014/15<br />
The South African Bureau of St<strong>and</strong>ards provides st<strong>and</strong>ardisation <strong>and</strong> conformity assessment services aimed at<br />
protecting the integrity of the South African market, protecting consumers, creating a competitive advantage for<br />
South African industry, <strong>and</strong> facilitating access by South Africans to local <strong>and</strong> international markets. The bureau<br />
forms part of South Africa’s st<strong>and</strong>ardisation, quality assurance, accreditation <strong>and</strong> metrology technical<br />
infrastructure.<br />
Over the medium term, the bureau will focus on: developing market-relevant st<strong>and</strong>ards that support the<br />
requirements of the South African economy; collaborating with national higher education bodies to promote the<br />
uptake of st<strong>and</strong>ards into the industrial sector; <strong>and</strong> providing services that will enable the development of<br />
industrial capacity in South Africa, including increased support to SMMEs.<br />
Performance<br />
The bureau produced 650 South African national st<strong>and</strong>ards in 2010/11, 80 per cent of which were aligned with<br />
international st<strong>and</strong>ards. The need to support the implementation of the second industrial policy action plan <strong>and</strong><br />
the protection of the South African market’s integrity has necessitated a revision of the indicators to be tracked<br />
in the development of st<strong>and</strong>ards. The number of home grown st<strong>and</strong>ards developed in support of the second<br />
industrial policy action plan <strong>and</strong> the number of st<strong>and</strong>ards referenced in legislation will become key indicators<br />
over the medium term, replacing the number of st<strong>and</strong>ards published.<br />
Acceptance by peer organisations <strong>and</strong> trading partners of the bureau’s conformity testing <strong>and</strong> assessment<br />
services is reflected in accreditations that the organisation maintains with both local <strong>and</strong> international bodies. In<br />
2010/11, the bureau produced 412 539 test reports across all laboratories with the 2014/15 projection set at<br />
442 000. This increase in volume is expected to be driven substantially by the implementation of the Consumer<br />
Protection Act (2008).
<strong>Vote</strong> <strong>36</strong>: <strong>Trade</strong> <strong>and</strong> <strong>Industry</strong><br />
Selected performance indicators<br />
Table <strong>36</strong>.62 South African Bureau of St<strong>and</strong>ards<br />
Indicator Programme/Activity/Objective/Proje<br />
ct Past Current Projections<br />
2008/09 2009/10 2010/11 2011/12 2012/13 2013/14 2014/15<br />
Number of national<br />
st<strong>and</strong>ards developed per<br />
year1 Number of days taken to<br />
produce a st<strong>and</strong>ard<br />
Value of sales of<br />
st<strong>and</strong>ards<br />
Tests <strong>and</strong> services<br />
revenue<br />
Value of products <strong>and</strong><br />
systems certification<br />
revenue<br />
Number of test reports<br />
completed per year<br />
Number of certification<br />
certificates issued per year<br />
Number of home grown<br />
South African national<br />
st<strong>and</strong>ards developed per<br />
year<br />
Development of South African national<br />
st<strong>and</strong>ards<br />
634 857 650 600 1 – –<br />
Development of South African national<br />
st<strong>and</strong>ards<br />
330 241 300 340 340 320 300<br />
Development of South African national<br />
st<strong>and</strong>ards<br />
R15.3m R16.8m R16.6m R18.3m R27.6m R31.7m R<strong>36</strong>.1m<br />
Tests <strong>and</strong> conformity assessments R189.8m R199.9m R192.3m R180.9m R627.3m R317.8m R354m<br />
Tests <strong>and</strong> conformity assessments R156.1m R173.8m R184.1m R221.9m R272.5m R354m R358.4m<br />
Tests <strong>and</strong> conformity assessments 391 886 527 983 412 539 395 400 407 100 422 000 442 000<br />
Tests <strong>and</strong> conformity assessments – 9 628 10 356 11 375 11 640 11 960 12 315<br />
Development of South African national<br />
st<strong>and</strong>ards<br />
– – – 100 135 140 145<br />
1. Indicator discontinued <strong>and</strong> replaced by home grown st<strong>and</strong>ards developed to address challenges unique to the South African economy. The bureau will continue<br />
producing more st<strong>and</strong>ards than the home grown target but the indicator has been changed to focus on relevance.<br />
Programmes/activities/objectives<br />
Table <strong>36</strong>.63 South Africa Bureau of St<strong>and</strong>ards<br />
Audited outcome<br />
Revised<br />
estimate Medium-term estimate<br />
R thous<strong>and</strong> 2008/09 2009/10 2010/11 2011/12 2012/13 2013/14 2014/15<br />
Development of South African national<br />
st<strong>and</strong>ards<br />
49 027 113 817 121 533 134 115 169 591 187 062 204 416<br />
Tests <strong>and</strong> conformity assessments 283 102 420 172 432 425 510 499 585 226 645 455 702 223<br />
Regulation of compulsory specifications 48 074 38 458 – – – – –<br />
Corporate support 135 740 – – – – – –<br />
Total expense 515 943 572 447 553 958 644 614 754 817 832 517 906 639<br />
The South African Bureau of St<strong>and</strong>ards had a total budget of R644.6 million in 2011/12, of which 58.8 per cent<br />
was used for compensation on employees.<br />
Savings <strong>and</strong> cost effectiveness measures<br />
The bureau has implemented cost containment measures, which include requiring auditors to travel on low cost<br />
airlines, the use of an in house travel agent, <strong>and</strong> booking trips at least two weeks in advance to save on airfares.<br />
The procurement process is being streamlined <strong>and</strong> enhanced in 2012/13 to ensure favourable prices <strong>and</strong> terms<br />
from suppliers. All major expense items such as security services, cleaning, garden services, advertising <strong>and</strong><br />
network support services are procured through an open tender system with increases limited to an average of<br />
6 per cent each year, resulting in savings of R6 million over the medium term.<br />
71
2012 Estimates of <strong>National</strong> Expenditure<br />
Expenditure estimates<br />
Table <strong>36</strong>.64 South African Bureau of St<strong>and</strong>ards<br />
Statement of financial performance<br />
72<br />
Audited outcome<br />
Revised<br />
estimate Medium-term estimate<br />
R thous<strong>and</strong> 2008/09 2009/10 2010/11 2011/12 2012/13 2013/14 2014/15<br />
Revenue<br />
Non-tax revenue 418 897 481 002 448 411 481 351 587 379 682 152 764 930<br />
Sale of goods <strong>and</strong> services other than<br />
capital assets<br />
of which:<br />
358 509 390 743 394 553 458 326 572 791 666 689 748 539<br />
Sales by market establishments 358 509 390 743 394 553 458 326 572 791 666 689 748 539<br />
Other non-tax revenue 60 388 90 259 53 858 23 025 14 588 15 463 16 391<br />
Transfers received 126 148 138 090 160 065 184 477 188 759 189 932 199 493<br />
Total revenue 546 692 619 265 608 476 665 828 776 138 872 084 964 423<br />
Expenses<br />
Current expenses 508 757 565 358 543 603 6<strong>36</strong> 673 746 179 823 <strong>36</strong>1 896 934<br />
Compensation of employees 272 658 291 912 321 471 378 855 419 762 459 160 496 949<br />
Goods <strong>and</strong> services 208 082 240 792 181 182 216 793 268 052 297 867 329 595<br />
Depreciation 25 341 31 147 33 757 41 025 58 <strong>36</strong>5 66 334 70 390<br />
Interest, dividends <strong>and</strong> rent on l<strong>and</strong> 2 676 1 507 7 193 – – – –<br />
Transfers <strong>and</strong> subsidies 7 186 7 089 7 566 7 941 8 638 9 156 9 705<br />
Total expenses 515 943 572 447 553 958 644 614 754 817 832 517 906 639<br />
Surplus / (Deficit) 30 749 46 818 54 518 21 214 21 321 39 567 57 784<br />
Statement of financial position<br />
Carrying value of assets 200 679 198 780 274 566 455 442 573 212 587 450 587 309<br />
of which:<br />
Acquisition of assets 50 7<strong>36</strong> 30 185 110 385 221 901 176 135 80 572 70 249<br />
Investments 250 088 201 465 291 900 313 750 310 687 345 251 378 276<br />
Inventory 829 520 1 524 1 000 1 000 1 000 1 000<br />
Receivables <strong>and</strong> prepayments 66 630 52 448 54 656 78 410 90 172 103 697 119 252<br />
Cash <strong>and</strong> cash equivalents 7 565 122 162 190 447 94 287 60 713 65 058 100 978<br />
Non-current assets held for sale 2 342 1 894 1 653 – – – –<br />
Taxation 23 732 23 905 21 116 23 905 23 905 23 905 23 905<br />
Total assets 551 865 601 174 835 862 966 794 1 059 689 1 126 <strong>36</strong>1 1 210 719<br />
Accumulated surplus / (deficit) 274 827 321 930 376 560 397 774 419 095 458 662 516 446<br />
Capital <strong>and</strong> reserves 72 493 62 749 68 686 86 383 104 734 125 353 144 038<br />
Capital reserve fund 25 341 15 917 165 575 262 774 302 553 294 332 286 111<br />
Borrowings 14 885 14 892 14 905 – – – –<br />
Finance lease 3 556 811 9 – – – –<br />
<strong>Trade</strong> <strong>and</strong> other payables 66 872 90 193 107 617 118 379 130 217 143 239 157 562<br />
Provisions 93 432 94 386 102 343 101 484 103 090 104 775 106 562<br />
Derivatives financial instruments 459 296 167 – – – –<br />
Total equity <strong>and</strong> liabilities 551 865 601 174 835 862 966 794 1 059 689 1 126 <strong>36</strong>1 1 210 719<br />
Expenditure trends<br />
The entity’s spending focus over the MTEF period will be on strengthening the enforcement of technical<br />
regulation functions.<br />
Revenue is derived mainly from fees for services provided, such as certification <strong>and</strong> testing. Government<br />
transfers represent approximately 27.7 per cent of total revenue in 2011/12, which is used for the development<br />
of South African national st<strong>and</strong>ards. Between 2008/09 <strong>and</strong> 2011/12, revenue increased from R546.7 million to<br />
R665.8 million, at an average rate of 6.8 per cent. The 15.9 per cent <strong>and</strong> 15.3 per cent increases in transfers<br />
received in 2010/11 <strong>and</strong> 2011/12 were due to earmarked funding for the construction of new laboratory<br />
buildings. It is projected that transfers from government will increase to R199.5 million in 2014/15 due to the<br />
cessation of capital transfers.
<strong>Vote</strong> <strong>36</strong>: <strong>Trade</strong> <strong>and</strong> <strong>Industry</strong><br />
Expenditure increased from R515.9 million in 2008/09 to R644.6 million in 2011/12 with compensation of<br />
employees accounting for 55.2 per cent of total spending over the period. The need to attract talent <strong>and</strong> retain<br />
skilled employees has influenced the growth in expenditure, as the bureau had to align pay scales with those of<br />
competition to curb the loss of skills. Expenditure is projected to increase to R906.6 million over the medium<br />
term as part of the bureau’s efforts to improve technical capacity, strengthen the br<strong>and</strong> <strong>and</strong> improve on testing<br />
technology. Spending on compensation of employees is expected to increase from R378.9 million in 2011/12 to<br />
R496.9 million in 2014/15, at an average annual rate of 9.5 per cent, as a result. Spending on goods <strong>and</strong> services<br />
costs is expected to increase from R216.8 million in 2011/12 to R329.6 million in 2014/15, at an average annual<br />
rate of 15 per cent, due to new projects to generate revenue.<br />
Personnel information<br />
Table <strong>36</strong>.65 South African Bureau of St<strong>and</strong>ards<br />
Personnel post status as at 30 September 2011 Number of personnel posts filled / planned for on funded establishment<br />
Number of posts<br />
on approved<br />
establishment<br />
Number of<br />
funded<br />
posts<br />
Number of<br />
vacant<br />
posts<br />
Actual Mid- year1 Medium-term estimate<br />
2008/09 2009/10 2010/11 2011/12 2012/13 2013/14 2014/15<br />
Executive board<br />
members<br />
1 1 – 1 1 1 1 2 2 2<br />
Executive<br />
management<br />
9 9 3 4 4 5 6 5 5 5<br />
Senior<br />
management<br />
44 44 11 23 22 29 38 40 50 52<br />
Middle<br />
management<br />
84 84 26 72 68 61 63 68 75 77<br />
Professionals 162 162 31 129 126 120 138 142 155 160<br />
Skilled 752 752 127 663 668 644 648 658 663 672<br />
Semi-skilled 122 122 20 160 135 117 102 100 98 95<br />
Very low skilled 89 89 18 213 173 111 71 65 60 57<br />
Total 1 263 1 263 2<strong>36</strong> 1 265 1 197 1 088 1 067 1 080 1 108 1 120<br />
Compensation<br />
R thous<strong>and</strong>)<br />
272 658 291 912 321 471 378 855 419 762 459 160 496 949<br />
Unit cost<br />
(R thous<strong>and</strong>)<br />
1. As at 30 September 2011.<br />
216 244 295 355 389 414 444<br />
As at 30 September 2011, the bureau had an approved establishment of 1 263 posts. Headcount dropped from<br />
1 265 in 2008/09 to 1 088 in 2010/11 due to the loss of coal <strong>and</strong> iron ore analysis contracts in the mining <strong>and</strong><br />
minerals segment of the business. Over the MTEF period, filled positions are expected to increase from 1 067 as<br />
at 30 September 2011 to 1 120 in 2014/15, due to a projected increase in headcount required to achieve<br />
organisational objectives. There were 2<strong>36</strong> vacancies as at 30 September 2011.<br />
South African <strong>National</strong> Accreditation System<br />
Overview: 2008/09 – 2014/15<br />
The South African <strong>National</strong> Accreditation System is m<strong>and</strong>ated through the Accreditation for Conformity<br />
Assessment, Calibration <strong>and</strong> Good Laboratory Practice Act (2006) to achieve the following objectives:<br />
accrediting or monitoring for compliance purposes; promoting accreditation as a means of facilitating<br />
international trade <strong>and</strong> enhancing South Africa’s economic performance <strong>and</strong> transformation; promoting the<br />
competence <strong>and</strong> equivalence of accredited bodies; <strong>and</strong> promoting the competence <strong>and</strong> equivalence of facilities<br />
compliant to the act.<br />
In support of government’s objective of regional integration, the entity plays an important role in Southern<br />
African Development Community (SADC) by hosting the SADC accreditation secretariat, holding the regional<br />
coordinator position, training assessors, forming partnerships <strong>and</strong> hosting the secretariat for the new African<br />
Accreditation Cooperation.<br />
The entity holds signatory status to the International Laboratory Accreditation Cooperation’s mutual recognition<br />
arrangement <strong>and</strong> the International Accreditation Forum’s multilateral arrangement, for laboratory <strong>and</strong><br />
certification body accreditation.<br />
73
2012 Estimates of <strong>National</strong> Expenditure<br />
Over the medium term, the entity will promote the use of accreditation as a tool for fostering international trade<br />
<strong>and</strong> the protection of health, safety <strong>and</strong> the environment, <strong>and</strong> to provide training.<br />
The entity is now recognised as the single national authority for the accreditation of test <strong>and</strong> calibration<br />
laboratories, inspection bodies, bodies for certification of quality <strong>and</strong> environmental management systems, <strong>and</strong><br />
product conformity certification bodies. Its role in facilitating the governments’ objective of regional integration<br />
<strong>and</strong> locking out poor quality <strong>and</strong> unsafe products continues to gain momentum. In 2010, the entity concluded a<br />
memor<strong>and</strong>um of underst<strong>and</strong>ing with the SADC Accreditation Services, which was officially launched by<br />
Botswana’s minister of trade <strong>and</strong> industry <strong>and</strong> the executive secretary of SADC.<br />
Performance<br />
The number of accredited organisations grew by 6.6 per cent, bringing the total number of accredited<br />
conformity assessment bodies to 1 244. The entity has maintained its position as the ninth largest accreditation<br />
body in the world <strong>and</strong> continues to be the only accreditation body in SADC that is internationally recognised.<br />
The international recognition facilitates the international acceptance of South African produced goods <strong>and</strong><br />
services. The entity has accredited an additional 19 BEE verification agencies over this period, bringing the total<br />
to 30 accredited BEE verification agencies. In 2009/10, the agency concluded a three-year twinning<br />
arrangement to assist the Mauritius accreditation body to accredit its 10 conformity assessment bodies. This<br />
allowed the Mauritian body to obtain International Laboratory Accreditation Cooperation association<br />
membership status.<br />
The calibration programme has an impact on the lives of ordinary South Africans. The interventions ranged<br />
from ensuring that the weight of sugar, maize meal, flour <strong>and</strong> other basic goods are purchased is correct to<br />
ensuring the accuracy of equipment used for law enforcement, such as evidential breath analysers <strong>and</strong> speed<br />
measuring devices, <strong>and</strong> ensuring the accuracy of pre-paid electricity metering devices.<br />
Selected performance indicators<br />
Table <strong>36</strong>.66 South African <strong>National</strong> Accreditation System<br />
Indicators Programme/Activity/Objective Past1 Current Projections<br />
2008/09 2009/10 2010/11 2011/12 2012/13 2013/14 2014/15<br />
Months taken to develop a new New programme development<br />
– – – 24 21 18 15<br />
accreditation programme<br />
projects <strong>and</strong> related activities<br />
Percentage of vacant positions Restructuring <strong>and</strong> capacity building – – – 24% (17) 10% (7) 10% (7) 10%(7)<br />
Percentage of previously<br />
disadvantaged individuals<br />
assessors registered with the<br />
entity in the total assessors pool<br />
Provision of accreditation services – – 35% 35% 40% 50% 55%<br />
Number of new accreditation New programme development<br />
– – – 1 3 3 1<br />
programmes developed <strong>and</strong><br />
rolled out per year<br />
projects <strong>and</strong> related activities<br />
Total number of accredited<br />
organisations<br />
Provision of accreditation services – – – 1 <strong>36</strong>2 1 380 1 408 1 438<br />
Percentage of input made to the International, regional <strong>and</strong> national<br />
– – – 85% 90% 95% 95%<br />
international accreditation<br />
requirements of the<br />
International Laboratory<br />
Accreditation Cooperation <strong>and</strong><br />
International Accreditation<br />
Forum<br />
responsibilities<br />
Percentage of progress made International, regional <strong>and</strong> national<br />
– – – 80% 85% 85% 85%<br />
against the approved annual<br />
work plan for the SADC<br />
secretariat as approved by the<br />
SADC general assembly<br />
responsibilities<br />
Percentage of progress made International, regional <strong>and</strong> national<br />
– – – 85% 85% 85% 85%<br />
against the approved annual<br />
work plan for the African<br />
Accreditation Cooperation<br />
secretariat approved by the<br />
African Accreditation<br />
Cooperation General assembly<br />
responsibilities<br />
1. No past data, as these are new performance indicators.<br />
74
Programmes/activities/objectives<br />
Table <strong>36</strong>.67 South African <strong>National</strong> Accreditation System<br />
<strong>Vote</strong> <strong>36</strong>: <strong>Trade</strong> <strong>and</strong> <strong>Industry</strong><br />
Audited outcome<br />
Revised<br />
estimate Medium-term estimate<br />
R thous<strong>and</strong> 2008/09 2009/10 2010/11 2011/12 2012/13 2013/14 2014/15<br />
Provision of accreditation services 9 486 11 217 14 023 29 530 30 783 32 548 34 253<br />
International, regional <strong>and</strong> national<br />
responsibilities<br />
2 726 1 110 1 327 2 687 1 948 2 055 2 158<br />
New programme development projects<br />
<strong>and</strong> related activities<br />
766 1 178 1 376 5 459 6 252 6 608 6 950<br />
Restructuring/capacity building – – 4 325 7 113 10 766 11 412 12 040<br />
Knowledge transfer 5<strong>36</strong> 723 651 1 434 1 396 1 472 1 546<br />
Marketing 1 256 1 394 1 870 2 705 2 594 2 7<strong>36</strong> 2 874<br />
Administrative support 22 577 23 431 23 019 7 001 15 373 16 290 16 972<br />
Total expense 37 347 39 053 46 591 55 929 69 112 73 121 76 793<br />
The South African <strong>National</strong> Accreditation System had a total budget of R55.9 million in 2011/12, of which<br />
52.8 per cent was used for providing accreditation services.<br />
Savings <strong>and</strong> cost effectiveness measures<br />
The entity has reviewed some of its processes <strong>and</strong> outsourced services since the implementation of the<br />
restructuring project. There has been 60 per cent savings in human resource costs by appointing a full time<br />
human resources manager, which has also increased the efficiency of human resource processes. Previous<br />
financial years saw cost savings, through the shared resources of the Department of <strong>Trade</strong> <strong>and</strong> <strong>Industry</strong> campus.<br />
The relocation of the entity’s offices will assist in reducing venue hire costs over the medium term as onsite<br />
venues will be used.<br />
Expenditure estimates<br />
Table <strong>36</strong>.68 South African <strong>National</strong> Accreditation System<br />
Statement of financial performance<br />
Audited outcome<br />
Revised<br />
estimate Medium-term estimate<br />
R thous<strong>and</strong> 2008/09 2009/10 2010/11 2011/12 2012/13 2013/14 2014/15<br />
Revenue<br />
Non-tax revenue 26 273 28 624 33 578 35 306 39 685 41 461 43 233<br />
Sale of goods <strong>and</strong> services other than<br />
capital assets<br />
of which:<br />
20 210 23 192 28 131 28 396 32 454 34 239 35 951<br />
Administration fees 20 210 23 192 28 131 28 396 32 454 34 239 35 951<br />
Other non-tax revenue 6 063 5 432 5 447 6 910 7 231 7 222 7 282<br />
Transfers received 13 750 14 707 18 239 20 623 30 327 32 615 34 560<br />
Total revenue 40 023 43 331 51 817 55 929 70 012 74 076 77 793<br />
Expenses<br />
Current expenses <strong>36</strong> 992 38 670 46 185 55 499 68 657 72 640 76 289<br />
Compensation of employees 15 600 18 223 23 720 24 712 32 427 34 372 <strong>36</strong> 262<br />
Goods <strong>and</strong> services 20 258 19 951 21 891 30 096 35 585 37 688 39 398<br />
Depreciation 1 046 379 425 508 429 331 346<br />
Interest, dividends <strong>and</strong> rent on l<strong>and</strong> 88 117 149 184 216 249 283<br />
Transfers <strong>and</strong> subsidies 355 383 406 430 455 480 504<br />
Total expenses 37 347 39 053 46 591 55 929 69 112 73 121 76 793<br />
Surplus / (Deficit) 2 676 4 278 5 226 – 900 955 1 000<br />
Statement of financial position<br />
Carrying value of assets 2 358 2 151 1 955 2 407 52 478 52 247 52 001<br />
of which:<br />
Acquisition of assets 109 176 249 960 50 500 100 100<br />
Receivables <strong>and</strong> prepayments 728 991 1 557 800 1 500 1 550 1 600<br />
Cash <strong>and</strong> cash equivalents 18 587 27 248 33 896 35 143 15 516 12 989 10 3<strong>36</strong><br />
Total assets 21 673 30 390 37 408 38 350 69 494 66 786 63 937<br />
75
2012 Estimates of <strong>National</strong> Expenditure<br />
Table <strong>36</strong>.68 South African <strong>National</strong> Accreditation System (continued)<br />
Statement of financial performance<br />
76<br />
Audited outcome<br />
Revised<br />
estimate Medium-term estimate<br />
R thous<strong>and</strong> 2008/09 2009/10 2010/11 2011/12 2012/13 2013/14 2014/15<br />
Accumulated surplus / (deficit) 13 759 18 037 23 263 23 263 23 263 23 263 23 263<br />
Borrowings – – – – 31 000 28 000 25 000<br />
Finance lease 3 002 3 238 3 407 3 537 3 531 3 473 3 324<br />
Deferred income 986 3 180 3 009 3 500 3 550 3 600 3 650<br />
<strong>Trade</strong> <strong>and</strong> other payables 2 924 4 8<strong>36</strong> 6 309 6 500 6 550 6 800 7 000<br />
Provisions 1 002 1 099 1 420 1 550 1 600 1 650 1 700<br />
Total equity <strong>and</strong> liabilities 21 673 30 390 37 408 38 350 69 494 66 786 63 937<br />
Expenditure trends<br />
The spending focus over the MTEF period will be on providing training in South Africa <strong>and</strong> the region, <strong>and</strong><br />
promoting the use of accreditation as a tool for fostering international trade <strong>and</strong> the protection of health, safety<br />
<strong>and</strong> the environment.<br />
The entity derives 51 per cent of its revenue from fees charged to accredited facilities. Total revenue increased<br />
from R40 million in 2008/09 to R55.9 million in 2011/12, at an average annual rate of 11.8 per cent, <strong>and</strong> is<br />
expected to increase to R77.8 million over the medium term, at an average annual rate of 11.6 per cent. The<br />
increase in both periods is as a result of rapid growth in of the accreditation of facilities. The entity is expecting<br />
a 14 per cent increase in accreditation fees in 2012/13 due to new programmes. Once the new programmes are<br />
established, this income is predicted to stabilise over the medium term.<br />
Expenditure increased from R37.3 million in 2008/09 to R55.9 million in 2011/12, at an average annual rate of<br />
14.4 per cent. Over the medium term, expenditure is expected to increase to R76.8 million, at an average annual<br />
rate of 11.1 per cent, due to increases in compensation of employees <strong>and</strong> goods <strong>and</strong> services.<br />
Personnel information<br />
Table <strong>36</strong>.69 South African <strong>National</strong> Accreditation System<br />
Personnel post status as at 30 September 2011 Number of personnel posts filled / planned for on funded establishment<br />
Number of posts<br />
on approved<br />
Number of<br />
funded posts<br />
Number of<br />
vacant<br />
Actual Mid-year<br />
establishment<br />
posts<br />
1 Medium-term estimate<br />
2008/09 2009/10 2010/11 2011/12 2012/13 2013/14 2014/15<br />
Executive board<br />
members<br />
1 1 – 1 1 1 1 1 1 1<br />
Executive<br />
management<br />
5 5 1 3 3 4 3 5 5 5<br />
Senior management 15 15 2 13 13 13 13 15 15 15<br />
Professionals 13 13 4 8 8 9 8 13 13 13<br />
Skilled 35 35 9 16 23 26 25 35 35 35<br />
Semi-skilled 1 1 – 1 1 1 1 1 1 1<br />
70 70 16 42 49 54 51 70 70 70<br />
Compensation<br />
(R thous<strong>and</strong>)<br />
15 600 18 223 23 720 24 712 32 427 34 372 <strong>36</strong> 262<br />
Unit cost<br />
(R thous<strong>and</strong>)<br />
371 372 439 485 463 491 518<br />
1. As at 30 September 2011.<br />
As at 30 September 2011, the entity had an approved <strong>and</strong> funded establishment of 70 posts. The number of posts<br />
filled increased from 42 in 2008/09 to 51 in 2011/12 <strong>and</strong> is expected to grow to 70 over the medium term. The<br />
growth in staff is due to the increase in dem<strong>and</strong> for the entity’s services, <strong>and</strong> supporting government’s industrial<br />
development <strong>and</strong> health <strong>and</strong> safety projects.<br />
As at 30 September 2011, there were 16 vacancies. The entity expects to fill these over the medium term. The<br />
ratio of support staff to line staff was 0.7:1 as at 30 September 2011.
Additional tables<br />
<strong>Vote</strong> <strong>36</strong>: <strong>Trade</strong> <strong>and</strong> <strong>Industry</strong><br />
Table <strong>36</strong>.A Summary of expenditure trends <strong>and</strong> estimates per programme <strong>and</strong> economic classification<br />
Programme Appropriation Audited Appropriation Revised<br />
Main Adjusted outcome Main Additional Adjusted estimate<br />
R thous<strong>and</strong> 2010/11 2010/11 2011/12 2011/12<br />
Administration 530 777 507 266 479 989 543 711 115 575 659 286 641 586<br />
International <strong>Trade</strong> <strong>and</strong> Economic Development 131 138 125 088 106 949 129 679 15 126 144 805 144 805<br />
Broadening Participation 777 797 796 034 801 173 839 695 26 000 865 695 885 695<br />
Industrial Development: Policy Development 1 052 122 1 132 961 1 142 033 1 266 895 44 152 1 311 047 1 <strong>36</strong>9 747<br />
Consumer <strong>and</strong> Corporate Regulation 191 531 195 531 145 021 231 671 (2 000) 229 671 231 671<br />
Industrial Development: Incentive Administration 3 175 296 3 085 852 2 792 994 3 469 114 (148 252) 3 320 862 3 250 862<br />
<strong>Trade</strong> <strong>and</strong> Investment South Africa 291 447 351 476 328 582 306 131 39 016 345 147 352 147<br />
Total 6 150 108 6 194 208 5 796 741 6 786 896 89 617 6 876 513 6 876 513<br />
Economic classification<br />
Current payments 1 142 874 1 143 952 990 040 1 172 351 126 842 1 299 193 1 292 493<br />
Compensation of employees 557 843 569 849 514 935 602 237 19 107 621 344 621 344<br />
Goods <strong>and</strong> services 585 031 574 103 474 830 570 114 107 735 677 849 671 149<br />
Interest <strong>and</strong> rent on l<strong>and</strong> – – 275 – – – –<br />
Transfers <strong>and</strong> subsidies 4 992 556 5 032 762 4 789 206 5 600 414 (67 033) 5 533 381 5 551 081<br />
Departmental agencies <strong>and</strong> accounts 844 109 859 609 838 980 969 125 35 000 1 004 125 1 026 125<br />
Higher education institutions 4 2 298 14 793 4 3 500 3 504 3 504<br />
Foreign governments <strong>and</strong> international<br />
organisations<br />
37 584 39 084 <strong>36</strong> 642 34 668 5 752 40 420 40 420<br />
Public corporations <strong>and</strong> private enterprises 4 095 914 4 096 296 3 859 334 4 581 917 (111 672) 4 470 245 4 458 945<br />
Non-profit institutions 12 500 33 000 37 800 14 700 – 14 700 21 700<br />
Households 2 445 2 475 1 657 – 387 387 387<br />
Payments for capital assets 14 678 17 494 15 189 14 131 29 808 43 939 32 939<br />
Machinery <strong>and</strong> equipment 10 665 12 964 12 875 9 873 15 442 25 315 14 315<br />
Software <strong>and</strong> other intangible assets 4 013 4 530 2 314 4 258 14 <strong>36</strong>6 18 624 18 624<br />
Payments for financial assets – – 2 306 – – – –<br />
Total 6 150 108 6 194 208 5 796 741 6 786 896 89 617 6 876 513 6 876 513<br />
Table <strong>36</strong>.B Summary of expenditure on training<br />
Adjusted<br />
Audited outcome appropriation Medium-term expenditure estimate<br />
2008/09 2009/10 2010/11 2011/12 2012/13 2013/14 2014/15<br />
Compensation of employees (R thous<strong>and</strong>) 383 077 437 710 514 935 621 344 693 995 768 624 795 321<br />
Training expenditure (R thous<strong>and</strong>) 2 524 9 297 9 370 15 908 13 971 13 566 14 063<br />
Training as percentage of compensation 0.7% 2.1% 1.8% 2.6% 2.0% 1.8% 1.8%<br />
Total number trained in department (headcount) – 1 627 – –<br />
of which:<br />
Employees receiving bursaries (headcount) – 150 – –<br />
Learnerships trained (headcount) – 10 – –<br />
Internships trained (headcount) – 34 – –<br />
Households receiving bursaries (R thous<strong>and</strong>) 1 200 1 425 1 514 – 1 277 1 500 1 590<br />
Households receiving bursaries (headcount) – 42 – –<br />
77
2012 Estimates of <strong>National</strong> Expenditure<br />
Table <strong>36</strong>.C Summary of departmental public private partnership projects<br />
Project description: Department of <strong>Trade</strong> <strong>and</strong> <strong>Industry</strong> Campus project Project<br />
annual<br />
unitary fee Budgeted<br />
at time of expenditure Medium-term expenditure estimate<br />
R thous<strong>and</strong> contract 2011/12 2012/13 2013/14 2014/15<br />
Projects signed in terms of <strong>Treasury</strong> Regulation 16 – 156 304 171 527 180 961 190 155<br />
Public private partnership unitary charge – 155 932 171 1<strong>36</strong> 180 548 189 655<br />
Project monitoring cost – 372 391 413 500<br />
Total – 156 304 171 527 180 961 190 155<br />
Disclosure notes for projects signed in terms of <strong>Treasury</strong> Regulation 16<br />
Project name Department of <strong>Trade</strong> <strong>and</strong> <strong>Industry</strong> (dti) public private partnership campus<br />
Brief description Department of <strong>Trade</strong> <strong>and</strong> <strong>Industry</strong> public private partnership campus<br />
Meintjies Street, Pretoria. Design, Construct <strong>and</strong> Facility Management<br />
Services over period of 25 years<br />
Date public private partnership agreement was signed 1-Aug-03<br />
Duration of public private partnership agreement 25 years<br />
Escalation index for unitary fee CPIX linked - July every year on anniversary<br />
Variations <strong>and</strong> amendments to public private partnership agreement Variation orders as per allowed schedules - but no formal amendment to<br />
date was signed on the public private partnership Agreement<br />
Cost implications of variations <strong>and</strong> amendments Costed per each variation order. Strategic Space strategy will inform over<br />
Significant contingent fiscal obligations including termination payments, guarantees,<br />
warranties <strong>and</strong> indemnities <strong>and</strong> maximum estimated value of such liabilities<br />
78<br />
the medium term the quantum of variation orders to be executed.<br />
The outst<strong>and</strong>ing debt amount as per financial model<br />
Table <strong>36</strong>.D Summary of departmental public private partnership projects<br />
Project description: <strong>National</strong> Fleet project Project<br />
annual<br />
unitary fee Budgeted<br />
at time of expenditure Medium-term expenditure estimate<br />
R thous<strong>and</strong> contract 2011/12 2012/13 2013/14 2014/15<br />
Projects signed in terms of <strong>Treasury</strong> Regulation 16 – 3 796 4 005 4 225 5 000<br />
Public private partnership unitary charge 1 – 3 796 4 005 4 225 5 000<br />
Total – 3 796 4 005 4 225 5 000<br />
1. Phavis fleet services public private partnership. Disclosure notes for this project can be viewed in the public private partnership table of the Department of Transport's<br />
chapter.<br />
Disclosure notes for projects signed in terms of <strong>Treasury</strong> Regulation 16<br />
Project name Phavis fleet services<br />
Brief description Disclosure notes for this project can be viewed in the Puplic Private<br />
Partnership annexure table of the Department of Transport chapter
Medium-term expenditure<br />
Audited outcome Estimate<br />
estimate<br />
R thous<strong>and</strong> 2008/09 2009/10 2010/11 2011/12 2012/13 2013/14 2014/15<br />
Foreign<br />
In cash<br />
European Sector wide enterprise Industrial<br />
2004 - 2009 450 000 Public<br />
Increase employment <strong>and</strong> 197 816 – 33 307 30 000 – – –<br />
Union<br />
employment <strong>and</strong> equity Development: Policy<br />
corporations <strong>and</strong> facilitate greater social<br />
programme<br />
Development<br />
private<br />
<strong>and</strong> economic equity <strong>and</strong><br />
enterprises<br />
integration<br />
European Risk capital facility<br />
Broadening<br />
2005 - 2013 450 000 Public<br />
Facilitate black economic 182 387 – 32 249 98 318 100 000 – –<br />
Union<br />
programme<br />
Participation<br />
corporations <strong>and</strong> empowerment in small<br />
private<br />
medium enterprise sector<br />
enterprises<br />
European Employment creation, sector Broadening<br />
2009 - 2013 462 441 Public<br />
Create long term<br />
– – – 100 000 200 000 – –<br />
Union<br />
policy support to the<br />
Participation<br />
corporations <strong>and</strong> sustainable employment<br />
economic cluster’s<br />
private<br />
<strong>and</strong> contribute to the<br />
programme of action (4<br />
enterprises<br />
national target of halving<br />
departmental projects<br />
unemployment <strong>and</strong><br />
implemented)<br />
poverty by 2014<br />
Department Employment creation, sector Broadening<br />
2009 - 2013 56 772 Public<br />
Create long term<br />
– – 40 399 10 000 6 373 – –<br />
of<br />
policy support to the<br />
Participation<br />
corporations <strong>and</strong> sustainable employment<br />
International economic cluster’s<br />
private<br />
<strong>and</strong> contribute to the<br />
Development programme of action (3<br />
enterprises<br />
national target of halving<br />
United<br />
departmental projects<br />
unemployment <strong>and</strong><br />
Kingdom implemented)<br />
poverty by 2014<br />
Finl<strong>and</strong> Small medium micro<br />
Industrial<br />
2009-2011 44 722 Departmental Support development of<br />
– 18 598 2 699 – – – –<br />
enterprise development Development: Policy<br />
agencies <strong>and</strong> small medium micro<br />
programme<br />
Development<br />
accounts<br />
enterprises through<br />
technical support by Small<br />
Enterprise Development<br />
Agency<br />
Sweden Economic development Industrial<br />
2008-2009 37 183 Departmental Provide business linkages 7 183 – – – – – –<br />
support<br />
Development: Policy<br />
agencies <strong>and</strong> training <strong>and</strong> skills<br />
Development<br />
accounts<br />
development for black<br />
economic empowerment,<br />
<strong>and</strong> programmes for<br />
women’s empowerment<br />
Table <strong>36</strong>.E Summary of donor funding<br />
Donor Project Departmental Period of Amount Main economic Spending<br />
programme name commitment committed classification focus<br />
<strong>Vote</strong> <strong>36</strong>: <strong>Trade</strong> <strong>and</strong> <strong>Industry</strong><br />
79
2012 Estimates of <strong>National</strong> Expenditure<br />
Table <strong>36</strong>.E Summary of donor funding (continued)<br />
Donor Project Departmental Period of Amount Main economic Spending<br />
programme name commitment committed classification focus<br />
80<br />
Medium-term expenditure<br />
Audited outcome Estimate<br />
estimate<br />
R thous<strong>and</strong> 2008/09 2009/10 2010/11 2011/12 2012/13 2013/14 2014/15<br />
In kind<br />
United<br />
Economic growth support Industrial<br />
2008 - 2012 191 982 Departmental Provide technical support 42 000 54 982 – 42 000 – – –<br />
States<br />
Development: Policy<br />
agencies <strong>and</strong> to financial sector <strong>and</strong><br />
Agency for<br />
Development<br />
accounts<br />
private sector, <strong>and</strong> for<br />
International<br />
competitiveness. Support<br />
Development<br />
department’s regulatory<br />
policy, its research <strong>and</strong><br />
legislative review process,<br />
<strong>and</strong> its participation in a<br />
technical evaluation<br />
Total 1 693 100 429 386 73 580 108 654 280 318 306 373 – –<br />
Table <strong>36</strong>.F Summary of expenditure on infrastructure<br />
Project name Service delivery Current Total Adjusted<br />
outputs project stage project cost Audited outcome appropriation Medium-term expenditure estimate<br />
R thous<strong>and</strong> 2008/09 2009/10 2010/11 2011/12 2012/13 2013/14 2014/15<br />
Infrastructure transfers to other spheres, agencies <strong>and</strong> departments<br />
Coega<br />
Infrastructure developments to<br />
Various 5 689 043 718 425 859 889 714 000 383 718 417 858 308 195 –<br />
Development enable investment in the zone<br />
Corporation<br />
East London<br />
Infrastructure developments to<br />
Various 1 817 535 154 030 373 373 198 000 171 282 150 000 100 000 –<br />
industrial<br />
enable investment in the zone<br />
development zone<br />
Critical<br />
Infrastructure projects supporting Various 1 473 171 75 051 105 601 80 643 118 540 182 000 190 000 203 000<br />
infrastructure investment in mining, tourism,<br />
programme<br />
manufacturing <strong>and</strong> services<br />
Richards Bay Infrastructure developments to<br />
Various 672 018 – 68 423 20 000 60 682 42 018 30 000 –<br />
industrial<br />
enable investment in the zone<br />
development zone<br />
Centurion<br />
Establishment of aero-mechanical Various 407 279 20 000 – 37 454 – – – –<br />
Aerospace Village manufacturing abilities<br />
Establishment of an aerospace<br />
supplier park<br />
South African New building to house the South Construction 315 420 – – 174 240 93 180 48 000 – –<br />
Bureau of<br />
African Bureau of St<strong>and</strong>ards<br />
St<strong>and</strong>ards<br />
<strong>National</strong> Metrology Laboratory <strong>and</strong> administrative<br />
Project 837 043 – – – 25 000 – 50 000 100 000<br />
Institute of South buildings<br />
Africa infrastructure<br />
project<br />
Total 11 211 509 967 506 1 407 286 1 224 337 852 402 839 876 678 195 303 000
<strong>National</strong> <strong>Treasury</strong><br />
estimates of national expenditure<br />
Private Bag X115, Pretoria, 0001, Tel: +27 12 395 6697, Fax: +27 12 315 5126<br />
national treasury<br />
Department:<br />
<strong>National</strong> <strong>Treasury</strong><br />
REPUBLIC OF SOUTH AFRICA