CHF 302 million - Partners Group
CHF 302 million - Partners Group
CHF 302 million - Partners Group

Create successful ePaper yourself
Turn your PDF publications into a flip-book with our unique Google optimized e-Paper software.
Stephan Schäli Head Private Equity, Pam Alsterlind Co-Head Private Real Estate,<br />
Philipp Schnyder Co-Head Private Equity Secondaries and Robert Lustenberger Investment Solutions Europe.<br />
SUSTAINED GROWTH IN A CHANGING<br />
WORLD<br />
ANNUAL REPORT 2010<br />
Passion for Private Markets
DISCUSSING A TECHNOLOGY DIRECT<br />
INVESTMENT<br />
Christoph Rubeli Private Equity Directs & Primaries, Stefan Näf Co-Head<br />
Investment Solutions, Sergio Jovele Investment Solutions Europe and<br />
Christian Ebert Private Equity Directs & Primaries.
KEY FIGURES<br />
447 professionals<br />
14 offi ces<br />
around the world<br />
EUR 21.4 billion<br />
assets under management<br />
1.44%<br />
net revenue margin<br />
<strong>CHF</strong> 376 <strong>million</strong><br />
net revenues<br />
<strong>CHF</strong> 250 <strong>million</strong><br />
EBITDA<br />
<strong>CHF</strong> 297 <strong>million</strong><br />
net profi t<br />
<strong>CHF</strong> <strong>302</strong> <strong>million</strong><br />
adjusted net profi t<br />
Number of professionals<br />
450<br />
400<br />
350<br />
300<br />
250<br />
200<br />
150<br />
100<br />
50<br />
0<br />
Assets under management<br />
(in EUR bn)<br />
25<br />
20<br />
15<br />
10<br />
5<br />
0<br />
7.8<br />
175<br />
06<br />
2.9<br />
11.7<br />
273<br />
07<br />
3.0<br />
15.1<br />
344<br />
06 07 08 09<br />
08<br />
361<br />
16.6<br />
09<br />
20.7<br />
1.2 0.7 0.7<br />
� Private markets � Public markets/affiliates<br />
Adjusted net profit<br />
(in <strong>CHF</strong> m)<br />
350<br />
300<br />
250<br />
200<br />
150<br />
100<br />
50<br />
0<br />
Share price development<br />
200%<br />
175%<br />
150%<br />
125%<br />
100%<br />
75%<br />
50%<br />
25%<br />
0%<br />
-25%<br />
-50%<br />
-75%<br />
-100%<br />
Mar<br />
06<br />
141<br />
06<br />
Bloomberg European<br />
Banks&Financials -60%<br />
Dec<br />
06<br />
228<br />
07<br />
Dec<br />
07<br />
213<br />
08<br />
<strong>Partners</strong> <strong>Group</strong><br />
+182%<br />
Dec<br />
08<br />
210<br />
09<br />
Dec<br />
09<br />
447<br />
10<br />
10<br />
<strong>302</strong><br />
10<br />
Dec<br />
10
2009 2010<br />
Average assets under management (in EUR bn) 16.5 19.3<br />
Net revenue margin 1.31% 1.44%<br />
Net revenues (in <strong>CHF</strong> m) 325 376<br />
EBITDA margin 70% 66%<br />
EBITDA (in <strong>CHF</strong> m) 227 250<br />
Financial result (in <strong>CHF</strong> m) 1 78<br />
Net profi t (in <strong>CHF</strong> m) 205 297<br />
Adjusted net profi t (in <strong>CHF</strong> m) 1 210 <strong>302</strong><br />
Cash and cash equivalents at end of year (in <strong>CHF</strong> m) 170 227<br />
Shareholders’ equity (in <strong>CHF</strong> m) 458 572<br />
Return on shareholder’s equity (ROE) 1 51% 56%<br />
Equity ratio1 83% 87%<br />
1 adjusted for certain non-cash items relating to our capital-protected product Pearl Holding Limited<br />
Share information as of 31 December 2010<br />
Share price <strong>CHF</strong> 177.40<br />
Total shares 26’700’000<br />
Market capitalization <strong>CHF</strong> 4.7 bn<br />
Free fl oat (according to SIX defi nition) 49.76%<br />
Diluted shares 26’431’651<br />
Adjusted diluted earnings per share1 <strong>CHF</strong> 11.43<br />
Dividend2 <strong>CHF</strong> 5.00<br />
Dividend yield2 2.8%<br />
Bloomberg ticker symbol PGHN SW<br />
Reuters ticker symbol PGHN.S<br />
1 adjusted for certain non-cash items relating to our capital-protected product Pearl Holding Limited<br />
2 as per proposal to be submitted to the annual general meeting of shareholders<br />
Forthcoming events<br />
5 May 2011 Annual general meeting of shareholders<br />
14 July 2011 Pre-close announcement assets under management as of 30 June 2011<br />
6 September 2011 Interim results and report as of 30 June 2011
TABLE OF CONTENTS<br />
Key fi gures 3<br />
Message from the management 7<br />
2010 at a glance –<br />
review of the fi nancial performance 9<br />
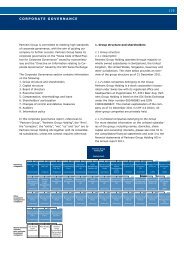
<strong>Partners</strong> <strong>Group</strong> and the impact<br />
of globalization 15<br />
Corporate responsibility 19<br />
Consolidated fi nancial statements 25<br />
Financial statements<br />
<strong>Partners</strong> <strong>Group</strong> Holding AG 103<br />
Corporate governance 119<br />
Contacts 137<br />
5
6<br />
A COMMITTED TEAM OF PARTNERS
MESSAGE FROM THE MANAGEMENT<br />
Dear clients, shareholders and business partners<br />
We are pleased to report a successful year with our products showing a strong performance for our clients and<br />
an adjusted net profi t of <strong>CHF</strong> <strong>302</strong> <strong>million</strong> attributable to our shareholders, representing an increase of 44% compared<br />
to 2009.<br />
We look back on a year with numerous shifts in private markets and several M&A transactions in various fi rms<br />
bringing public and private asset managers together. This is happening at a time when <strong>Partners</strong> <strong>Group</strong> continues<br />
to exclusively focus on our core competence, managing and developing our global investment platform solely<br />
dedicated to private markets. The ongoing changes currently observed in our industry result from a variety of<br />
different drivers. On the one hand, regulatory changes have resulted in some banks exiting private markets by<br />
either outsourcing or even selling their practices in this segment. In addition, various independent traditional public<br />
markets managers have expanded their business activities by diversifying to include private markets activities.<br />
Finally, selected larger private markets managers have moved in the opposite direction and are expanding to include<br />
public markets activities in the scope of their offerings.<br />
During this transition period in private markets, we have further concentrated on fi rmly establishing our globally<br />
leading integrated private markets investment platform and making attractive investments in signifi cant amounts.<br />
In continuing its expansion, the fi rm has recently opened offi ces in Dubai, Seoul, Munich and São Paulo while increasing<br />
the number of employees to over 450. The local presence in these new regions has allowed for the identifi<br />
cation of attractive investment opportunities, with for instance four transactions in various industries already<br />
completed in Brazil, including in a company active in the educational sector as well as in a producer of consumer<br />
goods for the growing middle class. The fi rm’s Asian investment activity has also been further supported by the<br />
proximity to investments offered by the new Korean location with an investment in a manufacturer of tire machinery<br />
completed. Overall, the fi rm has invested USD 4.8 billion in strong fi rms and high quality assets around the<br />
world, including more than 40 direct investments, making us one of the most active global private markets investors<br />
in 2010 again. In addition to the fi rm’s reach across all private markets segments and regions, <strong>Partners</strong><br />
<strong>Group</strong> has also furthered its expertise across a multitude of industry segments, often a key success factor in<br />
sourcing, developing and realizing the right opportunities. In continuing to build up our business, all steps taken<br />
have pursued the common goal of securing superior investment performance over the long term for our clients.<br />
Both the efforts made and achievements reached by the fi rm in the past as well as the measures taken to secure<br />
future success have continued to result in a large amount of confi dence placed in us by our clients, who have entrusted<br />
us with over EUR 4 billion in investment programs during the fi nancial year. This trust is not exclusively<br />
based on our investment track record and platform, but is also a refl ection of the focus we as a fi rm place on delivering<br />
above-average services in all relevant aspects for clients. We believe that, in all these efforts, having a<br />
common long-term view is the key to maintaining a superior relationship with our clients.<br />
Ensuring our team retains the same long-term view as we place on our client relationships was the main driver for<br />
our minority fl oating in 2006. We pursued this step to support our long-term equity incentive system, and therefore<br />
cement our continuity and independence. This at the time extraordinary approach has in the meantime also<br />
been embraced by a number of others in our industry, with many communicating their intention to launch an IPO.<br />
We believe though the predominant motivation is often a different one.<br />
Going forward, <strong>Partners</strong> <strong>Group</strong> continues to further build up investment know how in all sectors and regions<br />
around the world. As in the past, we will place a major emphasis on the commitment and the passion for what we<br />
do and thus this evolution will to a good part be driven by organic growth from within. However, as we have done<br />
previously, we will always consider adding external teams provided such teams possess the same long-term philosophy<br />
and core values as our fi rm. <strong>Partners</strong> <strong>Group</strong> will in any case remain a fully integrated fi rm and will avoid<br />
the creation of islands within our global investment team. We are committed to what we as a team stand for and<br />
to upholding our unique culture and long-term thinking as much as over the past 15 years.<br />
We are pleased to present you with a comprehensive overview of the development of our business in the past<br />
twelve months and thank you for your continued trust in our global team.<br />
Alfred Gantner Steffen Meister<br />
Executive Chairman Chief Executive Offi cer<br />
7
8<br />
IN DUE DILIGENCE ON AN<br />
OPPORTUNITY IN ASIA<br />
Alex Cho Head Seoul, Kelvin Chan Private Equity Directs & Primaries, Junichiro<br />
Kawamura Head Tokyo and Reto Schwager Head Investment Solutions Asia.
2010 AT A GLANCE – REVIEW OF THE<br />
FINANCIAL PERFORMANCE<br />
A CLEAR BUSINESS STRATEGY<br />
AND GROWTH,<br />
PROFITABILITY AND EARNINGS<br />
STABILITY<br />
Our clear business strategy has once again led to a<br />
positive development of our business in 2010. We believe<br />
the trust placed in us is for the most part based<br />
on our clear goal of achieving superior returns for our<br />
clients in combination with the high level of client services<br />
we aspire to provide in all private markets asset<br />
classes.<br />
With this focus as our foundation, we target the continued<br />
growth of our profi table and predictable business<br />
and believe our global resources and reach will enable<br />
us to continue to be a leader in a globalizing and consolidating<br />
private markets industry. <strong>Partners</strong> <strong>Group</strong>’s<br />
approach of ensuring proximity to both investment opportunities<br />
as well as clients around the globe remains<br />
of the utmost importance for the implementation of<br />
the fi rm’s future strategy. This approach allows the<br />
identifi cation of a larger number of opportunities while<br />
enabling their execution. In addition, the global setup<br />
supports handling the increased complexity in an investment<br />
environment interacting across borders and<br />
asset classes while coping with an increasingly evolved<br />
regulatory environment.<br />
The fi rm’s profi tability and earnings stability have always<br />
formed the basis for achieving a sustainable<br />
expansion. <strong>Partners</strong> <strong>Group</strong> continues to focus on further<br />
strengthening this foundation to also allow for a<br />
continued controlled and stable growth over the coming<br />
years. In this review of the fi nancial fi gures, we provide<br />
additional information on the assets under management<br />
(AuM) growth, the profi tability and the earnings<br />
stability of our business; factors which are key for supporting<br />
the continuing evolution of the fi rm. As most of<br />
our products are denominated in Euros, we present<br />
AuM in Euros since July 2010. Additional information on<br />
recurring revenues, margins and other factors such as<br />
foreign exchange fl uctuations allow for a greater transparency<br />
concerning the business and support the assessment<br />
of its development.<br />
2009 2010<br />
AuM as per end of the year (in EUR bn) 17.3 21.4<br />
Average AuM (in EUR bn, quarterly) 16.5 19.3<br />
Net revenue margin 1.31% 1.44%<br />
Recurring net revenue margin 1.18% 1.20%<br />
Net revenues (in <strong>CHF</strong> m) 325 376<br />
Recurring net revenues (in <strong>CHF</strong> m) 292 314<br />
EBITDA margin 70% 66%<br />
EBITDA (in <strong>CHF</strong> m) 227 250<br />
Net profi t (in <strong>CHF</strong> m) 205 297<br />
Adjusted net profi t (in <strong>CHF</strong> m) 210 <strong>302</strong><br />
Notes:<br />
– Recurring revenues are based on stable, long-term management fees and recur every year.<br />
– Adjusted net profi t is adjusted for certain non-cash items relating to our capital-protected product Pearl Holding Limited.<br />
9
10<br />
2010 AT A GLANCE – REVIEW OF THE<br />
FINANCIAL PERFORMANCE<br />
Assets under management<br />
In 2010, the fundraising environment for the private<br />
markets industry in general remained on a subdued<br />
level compared to pre-crisis years. Clients entrusted<br />
only a small number of leading market participants<br />
with new assets. <strong>Partners</strong> <strong>Group</strong> was able to gain market<br />
share with asset infl ows of EUR 4.0 billion in 2010.<br />
As of 31 December 2010, private markets assets totaled<br />
EUR 20.7 billion. The breakdown of AuM as of 31<br />
December 2010 is as follows: EUR 15.2 billion private<br />
equity, EUR 2.0 billion private debt, EUR 2.5 billion private<br />
real estate, EUR 1.0 billion private infrastructure<br />
and EUR 0.7 billion in affi liated companies, comprising<br />
the independent private wealth management division<br />
and alternative strategies.<br />
Asset infl ows from various sources invested<br />
around the globe<br />
<strong>Partners</strong> <strong>Group</strong> has continued to see interest from clients<br />
in all major regions around the globe with signifi -<br />
cant infl ows seen from both existing and new clients.<br />
While existing clients continued to expand their already<br />
successfully running private markets investment programs,<br />
increasing interest from new clients was seen<br />
as investors new to the private markets asset class began<br />
exploring its potential for the fi rst time. Client demand<br />
was well-diversifi ed around the globe, confi rming<br />
<strong>Partners</strong> <strong>Group</strong>’s “glocal” strategy, whereby local offi ces<br />
employing regional specialists offer greater scope for<br />
accessing the local markets. This includes both the<br />
sourcing and the completing of investment opportunities<br />
as well as developing mutually benefi cial client<br />
relationships through the increased proximity to a<br />
greater number of clients in combination with regional<br />
networks and an in-depth understanding of the local<br />
culture.<br />
Assets under management<br />
North America<br />
14%<br />
Scandinavia<br />
6%<br />
Middle<br />
Asia<br />
East<br />
3%<br />
1%<br />
UK<br />
23%<br />
Southern<br />
Europe<br />
2%<br />
Other<br />
2%<br />
Switzerland<br />
18%<br />
France<br />
& Benelux<br />
4%<br />
Germany &<br />
Austria<br />
27%<br />
Private market investments 2010<br />
In terms of investments completed, the particular attractiveness<br />
of secondary assets and direct opportunities<br />
has resulted in investments in these two segments<br />
totaling 75% of activity in 2010. The sustained geographic<br />
shift towards the growth offered by the Asia-<br />
Pacifi c region and Latin America has resulted in investment<br />
activity in this region amounting to 23% of the<br />
total in 2010. Considering only direct and primary<br />
investment activity, the fi rm invests a third in each<br />
Europe, North America and Asia/emerging markets.<br />
This is because secondary investment opportunities<br />
traditionally mainly occur in the Western world. This<br />
clearly refl ects <strong>Partners</strong> <strong>Group</strong>’s current relative value<br />
strategy of increasing exposure to the Asia-Pacifi c and<br />
emerging markets regions.<br />
Private market investments 2010<br />
North<br />
America<br />
45%<br />
Successful investment activity drives client<br />
demand<br />
The investments completed by <strong>Partners</strong> <strong>Group</strong> on behalf<br />
of its clients have continued to generate further<br />
interest in 2010. EUR 4.0 billion in asset infl ows from<br />
clients in combination with other factors of EUR 0.1 billion<br />
resulted in total assets under management as of<br />
31 December 2010 of EUR 21.4 billion. Other factors<br />
included a positive impact from foreign exchange fl uctuations<br />
mainly due to the depreciation of the Euro versus<br />
the US Dollar. Approximately 70% of AuM are denominated<br />
in Euros, 20% in US Dollars and 10% in<br />
other currencies.<br />
Assets under management<br />
(in EUR bn)<br />
17.3<br />
0.7 +4.1<br />
16.6<br />
0.7<br />
20.7<br />
Europe<br />
32%<br />
Asia/emerging<br />
markets<br />
23%<br />
21.4<br />
2009 2010<br />
Primaries<br />
25%<br />
� Affiliated<br />
companies<br />
� Private markets<br />
Directs<br />
21%<br />
Secondaries<br />
54%
2010 AT A GLANCE – REVIEW OF THE<br />
FINANCIAL PERFORMANCE<br />
AuM growth also refl ected in development of<br />
number of professionals<br />
<strong>Partners</strong> <strong>Group</strong> has always been committed to its principle<br />
of aligning the growth of its business with the size<br />
of its team. Private markets investing is a resourceintense<br />
and information-restricted business which requires<br />
a strong team in a multitude of locations around<br />
the world to identify the best investments for a fi rm’s<br />
clients. Since the beginning of the fi nancial crisis in<br />
2007, <strong>Partners</strong> <strong>Group</strong> has increased its private markets<br />
AuM by 77% to EUR 20.7 billion at the end of 2010.<br />
The headcount increased by 64% during the same period.<br />
In 2010, <strong>Partners</strong> <strong>Group</strong> increased headcount by<br />
86 new employees to 447 employees as of 31 December<br />
2010 (2009: 361 employees) and anticipates a further<br />
increase in 2011 to over 500 employees.<br />
Number of employees and private markets AuM<br />
400%<br />
350%<br />
+322% growth of AuM<br />
+226% growth of<br />
number of employees<br />
EUR<br />
20.7bn<br />
300%<br />
250%<br />
EUR<br />
15.1bn<br />
EUR<br />
16.6bn<br />
#500<br />
200%<br />
EUR<br />
11.7bn<br />
#447<br />
150%<br />
100%<br />
EUR<br />
7.8bn<br />
#344<br />
#361<br />
50%<br />
EUR<br />
4.9bn<br />
#273<br />
#137<br />
0%<br />
2005<br />
Source: <strong>Partners</strong> <strong>Group</strong><br />
#175<br />
2006 2007 2008 2009 2010<br />
Profi tability<br />
Stable recurring net revenue margin<br />
In the fi nancial year 2010, the recurring net revenue<br />
margin remained stable, standing at 1.20% (2009:<br />
1.18%). However, the recurring net revenue margin<br />
(recurring net revenues over average AuM) was again<br />
skewed to the positive due to fund closings late in<br />
the year and foreign exchange effects at year end (especially<br />
the Euro weakening against the Swiss franc).<br />
<strong>Partners</strong> <strong>Group</strong> therefore continues to project a recurring<br />
net revenue margin of approximately 1.15% going<br />
forward. The total net revenue margin increased to<br />
1.44% (2009: 1.31%) due mainly to higher performance<br />
fees and other one-time fee income and is<br />
somewhat impacted by foreign exchange movements<br />
in 2010 affecting the average revenues (average daily<br />
spot rates) less than the average AuM (quarter-end<br />
spot rates). Performance fees and other one-time fee<br />
income accounted for <strong>CHF</strong> 62 <strong>million</strong> in 2010 (2009:<br />
<strong>CHF</strong> 32 <strong>million</strong>).<br />
Net revenue margin<br />
1.31%<br />
1.18%<br />
1.20%<br />
1.44%<br />
2009 2010<br />
� Recurring net revenue margin � Net revenue margin<br />
11
12<br />
2010 AT A GLANCE – REVIEW OF THE<br />
FINANCIAL PERFORMANCE<br />
Signifi cant increase in private markets revenues<br />
Due to the continued growth of the fi rm’s core business,<br />
revenues continued to increase in all asset classes<br />
and rose by 16% to <strong>CHF</strong> 376 <strong>million</strong> (2009: <strong>CHF</strong> 325<br />
<strong>million</strong>). Private infrastructure – admittedly from a<br />
low base – more than tripled its revenues in 2010<br />
(+319%), while private real estate was again able to<br />
double its topline revenue streams (+147%) and private<br />
debt also rose signifi cantly (+58%). Due to the<br />
weakening of the Euro vs. the Swiss franc, revenues<br />
stemming from the private equity business increased<br />
only slightly by 3% in Swiss francs despite AuM in Euros<br />
rising by 12%.<br />
Net revenues<br />
(in <strong>CHF</strong> m)<br />
EBITDA growth somewhat impacted by foreign<br />
exchange<br />
Based on higher revenues and a disciplined cost management,<br />
although impacted by foreign exchange effects,<br />
EBITDA rose by 10% to <strong>CHF</strong> 250 <strong>million</strong> (2009:<br />
<strong>CHF</strong> 227 <strong>million</strong>). The decrease in the EBITDA margin<br />
to 66% (2009: 70%) is a direct consequence of the appreciation<br />
of the Swiss franc against the Euro and the<br />
US Dollar during the period.<br />
EBITDA<br />
(in <strong>CHF</strong> m)<br />
325<br />
227<br />
2009<br />
376<br />
2009 2010<br />
250<br />
2010<br />
Adjusted net profi t supported by strong fi nancial<br />
result<br />
While our business showed further signifi cant growth in<br />
the fi nancial year 2010, our results were negatively impacted<br />
by foreign exchange rate fl uctuations. However,<br />
an extraordinarily strong fi nancial result led to a signifi -<br />
cant increase of 44% in adjusted net profi t to <strong>CHF</strong> <strong>302</strong><br />
<strong>million</strong> (2009: <strong>CHF</strong> 210 <strong>million</strong>).<br />
<strong>Partners</strong> <strong>Group</strong>’s fi nancial result consists of three line<br />
items: (i) net gains on own investments, (ii) net interest<br />
income and (iii) net foreign exchange result. <strong>Partners</strong><br />
<strong>Group</strong>’s investment programs have shown a significant<br />
positive performance during 2010 resulting in net<br />
gains of <strong>CHF</strong> +30 <strong>million</strong> on <strong>Partners</strong> <strong>Group</strong>’s own contribution<br />
to these programs. Net interest income on the<br />
signifi cant liquidity position of <strong>CHF</strong> 343 <strong>million</strong> on the<br />
fi rm’s balance sheet (including working capital facilities<br />
to products provided by the group) contributed a further<br />
<strong>CHF</strong> +16 <strong>million</strong> to the fi nancial result. Finally, <strong>CHF</strong><br />
+32 <strong>million</strong> stemmed from extraordinary gains on foreign<br />
exchange hedges due to a weakening of the Euro<br />
vs. the Swiss franc during 2010.<br />
(in <strong>CHF</strong> m) 2009 2010<br />
Net gains on investments –5.7 +30.4<br />
Net interest income +9.9 +15.8<br />
Net foreign exchange result –3.4 +32.1<br />
Net fi nancial result +0.9 +78.3
2010 AT A GLANCE – REVIEW OF THE<br />
FINANCIAL PERFORMANCE<br />
Earnings stability<br />
Predictable earnings allow for the continuous<br />
build-out of global resources<br />
The private markets industry is characterized by a long<br />
duration of assets under management due to the inherent<br />
structures of the product offerings (usually limited<br />
partnerships with 12 year initial durations). These<br />
structures enable investors to profi t from the qualities<br />
of private markets managers, which remain focused on<br />
the operational improvement of the assets they invest<br />
in, naturally requiring a long-term perspective. These<br />
structures translate into a high stability of revenue<br />
streams over the long term, forming the basis for <strong>Partners</strong><br />
<strong>Group</strong>’s continued confi dence regarding the expansion<br />
of its global resources.<br />
Dependable revenue stream strengthened<br />
This longer duration of assets under management was<br />
once again refl ected in the breakdown of <strong>Partners</strong><br />
<strong>Group</strong>’s total revenues. In 2010, 91% of revenues<br />
stemmed from stable management fees, compared to<br />
97% in 2009. This is a positive development as the recovery<br />
of the markets and the improved exit environment<br />
have already resulted in performance fees of<br />
<strong>CHF</strong> 16 <strong>million</strong> in 2010 (2009: zero). <strong>Partners</strong> <strong>Group</strong><br />
expects to profi t from an additional performance fee<br />
upside in the future due to an anticipated more benign<br />
market environment.<br />
Fee structure<br />
3%<br />
97%<br />
5%<br />
4%<br />
91%<br />
2009 2010<br />
� Performance fees<br />
� Transaction fees<br />
� Management fees<br />
Proposed dividend for the fi nancial year 2010<br />
After having seen a strong operating result followed by<br />
record net adjusted earnings, <strong>Partners</strong> <strong>Group</strong>’s board<br />
proposes an increase of the dividend payment based<br />
on the achievements in 2010 to <strong>CHF</strong> 5.00 per share<br />
(+11%). This compares to <strong>CHF</strong> 4.50 a year ago and<br />
represents a dividend yield of 2.8% as of the share<br />
price on 31 December 2010. Overall, <strong>Partners</strong> <strong>Group</strong>’s<br />
board proposes to distribute <strong>CHF</strong> 134 <strong>million</strong> to its<br />
shareholders.<br />
Sustained client interest anticipated in 2011<br />
Going forward, we expect to see interest from both existing<br />
as well as new clients growing further. While<br />
certain client segments are not expected to return to<br />
the market quickly and others such as some insurance<br />
companies may still have certain investment limitations<br />
due to Solvency II regulations, we anticipate an increased<br />
interest from many clients in particular also<br />
due to the resistance demonstrated by our portfolios<br />
through the market downturn and our capabilities in<br />
investing through the cycle.<br />
Client demand in 2011 will likely focus on the most attractive<br />
investment themes offered by different asset<br />
classes:<br />
(i) private equity: Asia/emerging markets, secondaries<br />
and small/mid cap directs globally<br />
(ii) private real estate: strong demand for global noncore<br />
programs and recapitalizations<br />
(iii) private infrastructure: focus on brownfi eld investments<br />
in industrial countries and rehabilitative<br />
brownfi eld/greenfi eld projects in emerging markets<br />
(iv) private debt: attractive returns (L+11%) at low<br />
risks (50% equity cushion)<br />
Based on the interest seen from clients in the above<br />
opportunities, 2011 should be another successful year<br />
with clients expected to entrust us with EUR 4–5 billion.<br />
Most importantly however, <strong>Partners</strong> <strong>Group</strong> remains<br />
dedicated to the achievement of a superior long-term<br />
performance for clients, and considers this its ultimate<br />
goal.<br />
13
14<br />
UNDERSTANDING THE RESEARCH OF A<br />
LIFE SCIENCE COMPANY<br />
Karin Hallin Head São Paulo, Remy Hauser Healthcare Investments, Hans-Ulrich<br />
Müller Technology Investments and Martin Ruetz Private Equity Secondaries.
PARTNERS GROUP AND THE IMPACT OF GLOBALIZATION<br />
CONFRONTING THE CHALLENGES<br />
OF A GLOBALIZING WORLD<br />
In facing the challenges we are confronted with today,<br />
we observe that the impact of globalization has over<br />
the years gradually changed how <strong>Partners</strong> <strong>Group</strong> as a<br />
fi rm is required to function. In striving to meet clients’<br />
needs, the fi rm has continued to evolve while remaining<br />
focused on providing the best possible means of<br />
accessing the attractive returns offered by private markets<br />
investing. <strong>Partners</strong> <strong>Group</strong> has identifi ed fi ve key<br />
areas in this globalizing market environment.<br />
Investing through<br />
the cycle<br />
Changing regulatory<br />
environment<br />
Globalization<br />
Higher investment<br />
complexity<br />
Changing regulatory environment<br />
Shifting asset<br />
allocation<br />
Increasingly<br />
individualized demand<br />
With pressure from regulators around the world continually<br />
increasing, companies in the fi nancial sector face<br />
additional requirements which demonstrate a complexity<br />
not seen before. As the globalization process speeds<br />
up, companies must comply with a growing number of<br />
regulatory bodies of various governments around the<br />
world and thus are required to ensure their setups and<br />
offerings refl ect the new requirements. Firms need to<br />
show a high degree of fl exibility and possess a setup<br />
that is sophisticated enough to easily confront any<br />
changes in regulations they may encounter.<br />
<strong>Partners</strong> <strong>Group</strong>, with its 14 offi ces and over 450 employees,<br />
possesses the required scope, know-how and<br />
expertise to have built a structure that can be adapted<br />
to signifi cant regulatory changes. In the course of its<br />
growth, <strong>Partners</strong> <strong>Group</strong> has developed a powerful<br />
structuring team that is engaged in designing the fi rm’s<br />
regulatory setup. A global compliance team is then responsible<br />
for its maintenance and further development.<br />
The fi rm believes that the regulatory developments<br />
may further support the ongoing market consolidation<br />
with some small players lacking the necessary experience<br />
and structures. <strong>Partners</strong> <strong>Group</strong> is committed to<br />
offering its clients the security of knowing the fi rm has<br />
the resources to ensure it continues to meet all regulatory<br />
requirements.<br />
<strong>Partners</strong> <strong>Group</strong> is for instance currently faced with two<br />
new initiatives in the regulatory environment likely to<br />
have an impact on clients. On the one hand, the Alternative<br />
Investment Fund Managers (AIFM) Directive<br />
governs, inter alia, alternative investment funds marketed<br />
to investors in Europe. According to its authors,<br />
the AIFM Directive will better protect sophisticated investors,<br />
create a level playing fi eld for alternative<br />
funds, mitigate systemic risk and, arguably, also attract<br />
taxable substance to Europe. <strong>Partners</strong> <strong>Group</strong> expects<br />
many of its products to potentially be within the scope<br />
of the AIFM Directive. Despite there being no immediate<br />
need for the fi rm to adapt any of its offerings, <strong>Partners</strong><br />
<strong>Group</strong> has already devoted considerable resources<br />
to ensuring it meets the requirements of the directive<br />
in order to ensure the transition runs smoothly. <strong>Partners</strong><br />
<strong>Group</strong> is also involved with a number of industry<br />
associations as well as the Swiss Financial Market Supervisory<br />
Authority FINMA in shaping the required<br />
amendments to local legislation. A further example can<br />
be seen in the implementation of the Dodd-Frank rules<br />
in the US. <strong>Partners</strong> <strong>Group</strong> has been monitoring the developments<br />
regarding this new law as they appear in<br />
preparation for adapting any necessary parts of the<br />
<strong>Partners</strong> <strong>Group</strong> setup as required and is implementing<br />
the according measures. It is crucial today to have the<br />
setup <strong>Partners</strong> <strong>Group</strong> has, where any such developments<br />
are identifi ed early on in the process.<br />
Shifting asset allocation<br />
The increase in the impact of regulatory aspects is to<br />
a certain part driven by the shift in asset allocation we<br />
observe amongst clients, including a geographical redistribution.<br />
While the acceptance of the private markets<br />
asset class has risen in general, which should result<br />
in growing allocations overall, it is predominantly<br />
the increase in focus on non-domestic investments<br />
which should fuel the anticipated growth. With investors<br />
no longer restricting their investment activities to<br />
their home countries, there has been a need for greater<br />
regulation due to foreign investment activity.<br />
15
16<br />
P a r t n e r s g r o u P a n d t h e i m P a c t o f g l o b a l i z a t i o n<br />
This non-domestic investment activity is anticipated to<br />
stem from both existing private markets investors stepping<br />
up their activities or also increasingly from investors<br />
new to the asset class, a movement <strong>Partners</strong><br />
<strong>Group</strong> can confirm to have seen within its own client<br />
base. Amongst clients seeking global diversification,<br />
<strong>Partners</strong> <strong>Group</strong> has identified three clear trends that<br />
vary in the different regions around the globe. On the<br />
one hand, US investors were amongst the first to invest<br />
in private markets and have been investing abroad –<br />
although with small allocations – for a number of years.<br />
<strong>Partners</strong> <strong>Group</strong> now expects to see the investment activity<br />
abroad rise rapidly, with this group starting to<br />
step up their investment activities in the attractive<br />
emerging markets in particular. In Europe, the picture<br />
is slightly different, as many conservative European investors<br />
are only now starting to consider global investments<br />
and are taking their first steps into this realm.<br />
Finally, Asian investors are often new to private markets<br />
and completing their very first investments in this<br />
asset class.<br />
Addressing the various investment approaches pursued<br />
by clients around the world requires a firm that is as<br />
capable of assisting a US investor with a complex, individualized<br />
investment approach in emerging markets<br />
as of helping an Asian investor with building up his first<br />
private markets investment portfolio with a focus on<br />
Europe and the US. Only true global specialists with experience<br />
in all types of portfolio build-ups possess the<br />
expertise to be able to provide clients of all nationalities<br />
the best possible setup in order to proceed with<br />
their private markets investment strategies.<br />
increasingly individualized demand<br />
In addition to being required to meet ever-changing<br />
and increasingly demanding regulations and respond to<br />
clients investing outside their home markets for the<br />
first time, <strong>Partners</strong> <strong>Group</strong>’s clients have become more<br />
demanding in the method they apply to structuring<br />
their investment activities. This evolution in client demand<br />
has resulted in investment structures becoming<br />
more complex over the years. <strong>Partners</strong> <strong>Group</strong> has built<br />
up a palette of over 100 different structures which are<br />
all designed to offer clients best-in-class access to the<br />
private markets asset class.<br />
The firm currently sees two main developments in client<br />
demand, both of which require the expertise and<br />
know-how of a large structuring team dedicated to developing<br />
the types of products our clients are interested<br />
in. On the one hand, the amount of country-specific<br />
investment structures has increased, with investors in<br />
different countries requesting solutions which address<br />
their individual tax, legal and regulatory requirements.<br />
On the other hand, we currently observe that the number<br />
of customized, tailor-made mandates has continued<br />
to rise and now many clients have a clear preference<br />
for this type of individual access. Mandates can take<br />
the specific needs of each client into account and deliver<br />
a structure that allows for the optimization of all aspects,<br />
from general structuring perspectives as well as<br />
individual access to specific parts of the private markets<br />
universe. For instance, <strong>Partners</strong> <strong>Group</strong> has recently<br />
been awarded a mandate for value-added and opportunistic<br />
investment strategies in the global private<br />
real estate market by a European investment foundation,<br />
representing the first time pension funds in the<br />
respective local region are provided the opportunity of<br />
participating in the growth of this attractive market.<br />
<strong>Partners</strong> <strong>Group</strong> has also been awarded two separate<br />
mandates by the Korea Investment Corporation, one<br />
for private equity secondary investment and a second<br />
aimed at the restructuring and recapitalization space in<br />
private real estate. These are prime examples of the<br />
direction the market is evolving in and the opportunities<br />
that should arise for <strong>Partners</strong> <strong>Group</strong> out of these<br />
shifts. With its global structuring team, <strong>Partners</strong> <strong>Group</strong><br />
can offer each individual client the ideal structure and<br />
setup to access the exact market it is interested in.<br />
higher investment complexity<br />
Over the years, the investment opportunities arising<br />
have shown a marked development towards a consistently<br />
increasing level of complexity, with in particular<br />
<strong>Partners</strong> <strong>Group</strong>’s increased direct investment activities<br />
confronting the firm with new requirements, especially<br />
for further resources. <strong>Partners</strong> <strong>Group</strong> has developed its<br />
investment platform to respond to the shifts and today<br />
invests in all types of investment, in all sectors and industries<br />
and across all private markets asset classes.<br />
In combination with the expertise across private equity,<br />
private debt, private real estate and private infrastructure,<br />
the demands placed on investing today also require<br />
an in-depth industry analysis, requiring a greater<br />
industry specialization within the <strong>Partners</strong> <strong>Group</strong> team.<br />
For instance, the private equity secondaries team recently<br />
invested in a highly attractive portfolio of growth<br />
opportunities, with the seller interested in a discreet<br />
transaction with ideally a single counterparty. The<br />
transaction covered hundreds of individual companies<br />
with many value drivers in varying segments of the IT<br />
and life sciences sectors. Valuing a portfolio as diverse
P a r t n e r s g r o u P a n d t h e i m P a c t o f g l o b a l i z a t i o n<br />
as this requires a high level of expertise as well as the<br />
correct in-house specialists who are in a position to<br />
provide the relevant industry expertise. The firm has<br />
over the years continually devoted time and resources<br />
to making the furthering of the in-house industry specialization<br />
a top priority. With backgrounds in various<br />
industry segments, the in-house specialists ensure that<br />
in-depth and specialized know-how forms the base for<br />
all investment decisions. In this era of globalizing private<br />
markets, further expanding this knowledge within<br />
the firm remains a key focus.<br />
Going beyond the investment expertise the firm possesses,<br />
a second crucial pillar again lies within <strong>Partners</strong><br />
<strong>Group</strong>’s structuring capabilities as transactions are no<br />
longer simple but rather present a growing level of<br />
complexity. Clients looking to gain access to all aspects<br />
of private markets investing rely on their investment<br />
partner to optimize the structure any type of investment.<br />
<strong>Partners</strong> <strong>Group</strong> recently refinanced a private real<br />
estate property located at the heart of London’s Canary<br />
Wharf. In addition to the complexity inherent to the<br />
private real estate asset class, where a thorough due<br />
diligence on a property requires a very specific skill set,<br />
this transaction required lenders in different tranches<br />
to work together to ensure all were able to participate<br />
within a very tight time frame. As the lead in the private<br />
negotiations for the provision of this facility, the<br />
<strong>Partners</strong> <strong>Group</strong> transaction team faced a number of<br />
challenges in ensuring the needs of all partners were<br />
met and the transaction was able to be restructured in<br />
a satisfactory manner. This example of a tight time<br />
frame is very typical of the current market environment<br />
for refinancing transactions in the private real estate<br />
asset class and something which presents additional<br />
difficulties to the investment team and requires an extensive<br />
transaction team in order to address.<br />
A further complexity has been brought about directly<br />
by the shift towards globalization in investment activities,<br />
with in particular the emerging markets offering<br />
new challenges. In these markets, it is highly important<br />
to stay up-to-date concerning the regulatory environment<br />
and any potential shifts in direction that are anticipated.<br />
The risks can particularly be seen in infrastructure<br />
investing, where investments are often linked<br />
to government policies. Governments changing their<br />
policies in any way can often have an impact on infrastructure<br />
investments in the region and thus have a direct<br />
correlation with the expected return.<br />
investing through the cycle<br />
A globalizing investment environment has not only increased<br />
the complexity of the investments themselves<br />
but has made the importance of understanding the investment<br />
cycle and being able to invest throughout it<br />
even more important. <strong>Partners</strong> <strong>Group</strong> considers being<br />
able to invest in the most attractive opportunities in all<br />
regions around the world at any point in time a key advantage.<br />
The shifts in the market described above have<br />
resulted in <strong>Partners</strong> <strong>Group</strong>’s investment activities undergoing<br />
an evolution and the attractive opportunities<br />
in the Asia-Pacific region and Latin America have resulted<br />
in consistently higher amounts invested in these<br />
regions. In 2010, such investments amounted to almost<br />
a quarter of the total of USD 4.8 billion invested<br />
by the firm. In terms of direct and primary activity, the<br />
allocation to the Asia-Pacific region and Latin America<br />
increases even further to a third of total activity as secondaries<br />
traditionally mainly occur in the Western<br />
world.<br />
Apart from the increased investment activity in the<br />
regions mentioned above, for the past 24 months secondaries<br />
have offered the highest relative value and<br />
<strong>Partners</strong> <strong>Group</strong> invested USD 2.6 billion (54% of the<br />
total) in this segment in 2010. <strong>Partners</strong> <strong>Group</strong> has<br />
been able to acquire assets at trough prices with the<br />
on-target timing resulting in secondary investments<br />
achieving a strong performance for clients. The firm<br />
places a further emphasis on direct investments as<br />
these are also judged to offer superior relative value<br />
at this point in the cycle. While 24 months ago, attractive<br />
direct investments were to be found in distressed<br />
assets and special situations, the past twelve months<br />
have seen opportunities emerging in small and mid cap<br />
transactions at attractive valuations. In 2010, <strong>Partners</strong><br />
<strong>Group</strong> invested USD 1.0 billion in directs, amounting to<br />
21% of the total invested and up from 14% in 2009.<br />
<strong>Partners</strong> <strong>Group</strong> believes that the importance of having<br />
the scope to invest through the cycle will retain its importance<br />
going forward.<br />
17
18<br />
ASSESSING A PRIVATE REAL ESTATE<br />
INVESTMENT OPPORTUNITY<br />
Eliza Bailey Head Private Real Estate Debt, Claude Angéloz Co-Head Private Real<br />
Estate and Erik Kaas Co-Head Investment Solutions.
CORPORATE RESPONSIBILITY<br />
COMMITTED TO RUNNING OUR<br />
BUSINESS RESPONSIBLY<br />
<strong>Partners</strong> <strong>Group</strong> is committed to ensuring all interactions<br />
with our environment are carried out in a responsible<br />
and sustainable manner. We are passionate making<br />
a positive contribution to our world.<br />
We believe that social responsibility, ecological awareness<br />
and good corporate governance are crucial pillars<br />
of a company’s success. We therefore consider the interests<br />
of society and take responsibility for the impact<br />
of our activities on clients, shareholders, employees,<br />
communities and the environment in our operations. In<br />
living our credo of “passion for private markets” we<br />
apply the same passion to supporting others in achieving<br />
their goals. Our corporate responsibility program<br />
follows the ultimate goal of fostering entrepreneurial<br />
development by supporting future entrepreneurs just<br />
as our employees pursue the same goal.<br />
We strive to make an impact in the four following directions:<br />
We work to minimize any adverse<br />
impact our activities could have<br />
on our environment and are<br />
committed to upholding our<br />
principles of sustainability<br />
at all times.<br />
We are committed to taking<br />
an active role in supporting<br />
and backing young<br />
entrepreneurs in following<br />
their own ideas and starting<br />
their own innovative businesses.<br />
Sustainability<br />
Entrepreneurship<br />
Corporate<br />
responsibility<br />
Passion for sustainability<br />
We view environmental legislation and codes of practice<br />
as a minimum standard and aim to live up to and exceed<br />
the highest industry benchmarks. As a fi rm, we<br />
remain on the lookout for innovative ways we can<br />
make a difference to our environment and adopt these<br />
into our daily practices. While all employees are encouraged<br />
in incorporating environmentally conscious<br />
behavior into their daily lives, we additionally participate<br />
in certain initiatives as a fi rm. These include being<br />
a signatory to the United Nations Principles for Responsible<br />
Investing and participating in the Carbon Disclosure<br />
Project. Far from simply participating in these programs,<br />
we are committed to also acting on them and<br />
are delighted to have seen others in our industry follow<br />
the same path and to see the high level sustainability<br />
awareness stands at today.<br />
United Nations Principles for Responsible Investing<br />
In our investment activities, we make a commitment<br />
to our clients that we intend to be active owners and<br />
incorporate environmental, social and corporate governance<br />
(ESG) issues into our activities and are therefore<br />
a signatory to the United Nations Principles of Responsible<br />
Investing (UNPRI), having acknowledged the United<br />
Nations Key Principles since 2006. The UNPRI were<br />
launched in 2001 under the guidance of the United Nations<br />
Secretary General and have quickly become the<br />
benchmark for global best practices in responsible investing.<br />
They provide a voluntary and aspirational<br />
framework for incorporating ESG issues into mainstream<br />
investment decision-making and ownership<br />
practices.<br />
Philanthropy<br />
Education<br />
We recognize that we are more<br />
fortunate than others in this world<br />
and therefore devote both<br />
financial and personal resources<br />
to supporting those less<br />
privileged and encouraging<br />
them to reach<br />
self-sustainability.<br />
We invest in in-house and<br />
external training to ensure<br />
<strong>Partners</strong> <strong>Group</strong> people not<br />
only possess the relevant<br />
expertise but are also<br />
supported in their personal<br />
development.<br />
19
20<br />
CORPORATE RESPONSIBILITY<br />
As a private markets investor, we are focused on providing<br />
the best solutions in this asset class for our clients.<br />
Given the long-term perspective and the focus on<br />
sustainable growth and operational development inherent<br />
to this asset class, we believe that applying ESG<br />
criteria to investments can positively impact the performance<br />
of investment portfolios and strive to encourage<br />
portfolio companies to improve performance in terms of<br />
ESG criteria. We are of the opinion that investors<br />
should include opportunities and risks stemming from<br />
integrating ESG factors into their investment process<br />
and also work to promote acceptance of the UNPRI<br />
within the industry.<br />
As a signatory of the UNPRI, <strong>Partners</strong> <strong>Group</strong> commits<br />
itself to the following principles:<br />
1. Incorporating ESG issues into investment analysis<br />
and decision-making processes<br />
2. Being active investors and incorporating ESG issues<br />
into investment policies and practices<br />
3. Seeking appropriate disclosure on ESG issues by the<br />
entities in which investments are completed<br />
4. Promoting acceptance and implementation of the<br />
principles within the investment industry<br />
5. Working together to enhance effectiveness in implementing<br />
the principles<br />
6. Reporting on our activities and progress towards implementing<br />
the principles<br />
Carbon Disclosure Project<br />
As we consider our fi rm as well as its individual employees<br />
directly responsible for protecting our environment<br />
we voluntarily participate in the carbon disclosure<br />
project (CDP), an independent, not-for-profi t organization<br />
which holds the largest database of corporate climate<br />
change information in the world. CDP has today<br />
become the leading standard for carbon methodology<br />
and process while providing comprehensive climate<br />
change data to the global marketplace.<br />
In addition, our clear goal is to be carbon neutral in our<br />
business activities. While we cannot completely avoid<br />
emissions in our daily activities, we compensate these<br />
through investing in environmentally friendly ventures.<br />
Determining the amount of our greenhouse gas emissions<br />
in the CDP has allowed us to establish the level of<br />
investment required to neutralize these. As a fi rm, we<br />
have invested a substantial amount into our global resources/clean<br />
environment product which will go exclusively<br />
towards investments in sustainable, green projects<br />
geared at improving our environment. The sectors<br />
these projects are active in include clean energy (renewable<br />
energy and clean technology, e.g. construction<br />
of wind farms or development of more effi cient photovoltaic<br />
cells), timber (management and sustainable development<br />
of forests), water (wastewater treatment,<br />
security, water infrastructure and desalination), wastemanagement<br />
(collection, transport, processing, recycling<br />
or disposal of waste materials) and carbon-related<br />
(development of projects that reduce greenhouse gas<br />
emissions or trading of carbon certifi cates, e.g. European<br />
Carbon Fund which was awarded “Carbon Finance<br />
Transaction of the Year” in 2007 by Environmental Finance)<br />
private equity transactions.
CORPORATE RESPONSIBILITY<br />
Passion for philanthropy<br />
We understand that we are more fortunate than others<br />
in this world and feel a civic responsibility towards helping<br />
where we can. We realize that while every individual<br />
can make a difference, as a group we are able to<br />
have a exponentially higher impact. As a fi rm, <strong>Partners</strong><br />
<strong>Group</strong> supports various charitable causes and is proud<br />
that its efforts are based on the individual efforts made<br />
by its team members. <strong>Partners</strong> <strong>Group</strong>’s passion for philanthropy<br />
has been implemented through various initiatives<br />
over the years.<br />
PG Alternative IMPACT<br />
In the interest of harnessing our collective efforts for<br />
the greater good, <strong>Partners</strong> <strong>Group</strong> has founded PG Alternative<br />
IMPACT, an endowment which fosters entrepreneurial<br />
activity with the goal of helping people<br />
around the world achieve sustainability and independence<br />
in their lives.<br />
While using the <strong>Partners</strong> <strong>Group</strong> network in the most<br />
productive manner, PG Alternative IMPACT targets the<br />
creation of signifi cant, measurable and self-sustainable<br />
improvements in people’s lives through providing help<br />
in receiving training or advanced education as well as<br />
the means for realizing business concepts.<br />
The PG Alternative IMPACT charity board, which is<br />
made up of <strong>Partners</strong> <strong>Group</strong> team members, reviews<br />
proposals based on a number of criteria. Firstly, the<br />
project must support individuals in reaching autonomy<br />
through fostering entrepreneurship and independence.<br />
Secondly, projects are required to have a personal connection<br />
with the fi rm and the broader <strong>Partners</strong> <strong>Group</strong><br />
family network. A third crucial aspect is the establishment<br />
of long-term sustainability for individuals through<br />
the projects supported and funded by PG Alternative<br />
IMPACT. Finally, PG Alternative IMPACT prioritizes projects<br />
which to the largest part can be fi nanced and sustained<br />
over time solely through our support.<br />
PG Alternative IMPACT has so far fi nanced 16 different<br />
projects on fi ve continents. Two examples of recent<br />
projects supported are:<br />
Mpanshya Revolving Fund, Zambia<br />
This project was introduced by Alfred Gantner, cofounder<br />
and chairman of the board of <strong>Partners</strong> <strong>Group</strong>,<br />
through his longstanding relationship with the FIS<br />
Foundation, founded and led by Dr. med Matthias Furrer<br />
and his wife Dr. med. Kathrin Furrer. Alfred<br />
Gantner’s personal involvement and visits with the Furrer<br />
family over several years provided <strong>Partners</strong> <strong>Group</strong><br />
with fi rst-hand knowledge of this project.<br />
PG Alternative IMPACT is the sole sponsor for establishing<br />
a revolving education fund for vocational training<br />
of medical personnel at a college facility situated next<br />
to a renowned district hospital in Mpanshya, Zambia.<br />
The objective is to provide repayable student loans to<br />
qualifi ed candidates which enroll in a study program.<br />
The college is offi cially approved and supported by<br />
Zambia’s Ministry of Health. However, only a certain<br />
part of a two-year education for hospital nurses is subsidized<br />
thus obliging the college to charge an additional<br />
fee to cover all costs. At approximately <strong>CHF</strong> 530, these<br />
supplemental costs (ie fees to be paid by student) represent<br />
2/3 of an annual income for a typical untrained<br />
worker. As qualifi ed nurses are sought after in Zambia,<br />
they can earn up to <strong>CHF</strong> 220 per month and thus have<br />
the earnings potential to repay such a loan within less<br />
than two years. The loans are intended to be recycled,<br />
thus establishing a perpetual fund instrument which<br />
will allow a continual stream of students to complete<br />
nursing training. There is a 10% interest attached to a<br />
loan in order to compensate for currency devaluation,<br />
increase the hurdle to apply for it only in case of dire<br />
need and to possibly shorten the maturity for repay-<br />
21
22<br />
CORPORATE RESPONSIBILITY<br />
ment. Such repayment will be effected through direct<br />
deduction from wages which are issued and controlled<br />
by a government institution as part of the public health<br />
system. Qualifi cation certifi cates (originals) will be retained<br />
as collateral until full repayment of the loan.<br />
The program established by PG Alternative IMPACT’s<br />
donation will alleviate the shortage of qualifi ed nurses<br />
in the periphery and retain personnel in rural areas.<br />
It will also offer a new perspective leading to self-sustainability<br />
to many young people in the region and ultimately<br />
benefi ts the unnumbered sick and needy requiring<br />
professional care at the hospitals.<br />
Training for working with the visually impaired, Wales,<br />
England<br />
This project was brought to the attention of PG Alternative<br />
IMPACT by Robert Lamb, a vice president in the<br />
investment solutions Europe team in the London offi ce.<br />
This project is run by the University of Wales, Newport,<br />
at which Robert Lamb’s mother, Eirlys Lamb, is a lecturer<br />
specialized in working with the visually impaired.<br />
Eirlys Lamb has spent the past 30 years working with<br />
visually impaired children in the UK and is professionally<br />
employed to oversee education for the visually impaired<br />
in Wales.<br />
With the PG Alternative IMPACT contribution, the University<br />
of Wales, Newport, will establish a course offering<br />
specialist training for working with visual impairment,<br />
in the form of an accredited degree. There is a<br />
current shortage of rehabilitation workers in all developed<br />
countries, which has contributed to a dearth of<br />
services available to blind and partially sighted people<br />
in the UK. At the same time, the incidence of blindness<br />
in the over 50s population has increased markedly,<br />
with this demand resulting in an urgent need to provide<br />
the appropriate training.<br />
The University of Wales, Newport will be the sole provider<br />
of this qualifi cation in Wales, while already offering<br />
a successful pioneering course in Mobility and Orientation<br />
in Education. Successful students from that<br />
course may progress to the new course, thus gaining a<br />
qualifi cation to work “from cradle to grave” in this area<br />
of need. <strong>Partners</strong> <strong>Group</strong>’s donation will fund the inception<br />
of this project and will enable the University of<br />
Wales, Newport to establish an accredited degree<br />
course which will then become self-suffi cient, sustained<br />
by recurring tuition fees. Through this donation, <strong>Partners</strong><br />
<strong>Group</strong> supports the launch of an innovative educational<br />
initiative which is the only course of its kind in<br />
the region. Students are offered the chance to acquire<br />
highly utilizable skills which address a true unmet need<br />
and thus provide them with the perspective for securing<br />
a future career in applying these skills. In addition,<br />
the donation offers care to handicapped members of<br />
society which are in need of specialized support in their<br />
daily activities.<br />
Marathon of marathons<br />
Within the scope of <strong>Partners</strong> <strong>Group</strong>’s charitable activities,<br />
the fi rm is always on the lookout for new and<br />
innovative ways of supporting charitable causes. In<br />
2010, the private markets community celebrated the<br />
2’500th anniversary of the Battle of Marathon and Pheidippodes’<br />
historic run from Marathon to Athens with<br />
250 members of the private markets communities<br />
around the world choosing to run or walk the Athens<br />
marathon while targeting to collectively raise EUR 2.5<br />
<strong>million</strong> to help children around the world. The event<br />
was organized by Cambell Lutyens and PEI Media and<br />
<strong>Partners</strong> <strong>Group</strong> co-founder Urs Wietlisbach was a patron<br />
of the race, with a group of <strong>Partners</strong> <strong>Group</strong> team<br />
members led by Felix Haldner, Partner and Head Investment<br />
Structures, amongst the participants.<br />
Of the funds raised, half will be donated to UNICEF<br />
while the remaining half will be distributed to a carefully<br />
selected small group of charities with a focus on<br />
children under the age of 18. The charities selected<br />
were all recommended by race participants or by people<br />
closely linked to the event and represented a wide<br />
geographical focus, tackling a variety of important issues<br />
and where it was felt a meaningful difference to<br />
the lives and outlook of the children affected could be<br />
made.
CORPORATE RESPONSIBILITY<br />
Passion for education<br />
We remain absolutely committed to lending our skills<br />
and knowledge to furthering education in young, promising<br />
people and feel this contributes to shaping the entrepreneurs<br />
of the future. We focus on increasing skills<br />
through training, both internally for <strong>Partners</strong> <strong>Group</strong><br />
team members as well as externally in cooperation with<br />
institutes of higher learning around the world.<br />
In-house education and training take a variety of different<br />
forms. The most important training resource is the<br />
<strong>Partners</strong> <strong>Group</strong> associate program, through which we<br />
hire and internally train investment professionals. The<br />
associate program is designed to refi ne core skills and<br />
deepen industry knowledge while identifying the individual<br />
skill sets that best match available job profi les.<br />
The associate program gives participants exposure to<br />
different business groups in a rotating system, thereby<br />
allowing them to broaden their skills and to build a<br />
strong network within the fi rm. Participants typically<br />
spend 12–24 months in the associate program and<br />
complete several rotations during this time before being<br />
assigned to a specifi c team. We additionally run an<br />
apprenticeship and internship program for young professionals<br />
starting out in their careers as well as supporting<br />
the further education of our more senior professionals<br />
in pursuing external programs such as the<br />
CFA, etc. Finally, we make a strong commitment to<br />
coaching team members on all levels on a continuous<br />
basis to further their professional and personal development.<br />
All <strong>Partners</strong> and senior professionals of the<br />
fi rm set time aside each week to coach both their<br />
teams as well as other employees within the fi rm,<br />
spending several hours per week focused on coaching,<br />
with a strong emphasis placed on coaching by feedback<br />
as we believe this is an ideal format for providing concrete<br />
and constructive suggestions.<br />
In addition, we donate time to furthering education<br />
outside <strong>Partners</strong> <strong>Group</strong>, and thus uphold a regular dialogue<br />
with many of the leading universities (such as<br />
Harvard University, University of St Gallen etc.) around<br />
the world, cooperating with them with regard to university<br />
research or student theses. A number of <strong>Partners</strong><br />
and other professionals additionally fi nd time to lecture<br />
on specifi c industry topics at a number of institutions<br />
dedicated to higher education, thereby ensuring our industry<br />
expertise and knowledge is passed on to future<br />
private markets practitioners.<br />
Passion for entrepreneurship<br />
The heart of our daily business is supporting and fostering<br />
entrepreneurship. Not only do we devote time<br />
and resources to this through the activities in our corporate<br />
responsibility program but our investment activities<br />
themselves pursue the very same path. In investing<br />
across the private markets asset classes, we are<br />
directly involved in the development of companies as<br />
well as of innovative business ideas and new inventions.<br />
Supporting entrepreneurial development can<br />
take different forms, and we have been active in many<br />
such opportunities. We invest with entrepreneurs just<br />
starting their expansion, who are developing new products<br />
or conquering new markets and have invested in<br />
and supported many entrepreneurial ideas in small and<br />
mid cap companies. Our passion for supporting entrepreneurs<br />
leads us to devote considerable resources to<br />
analyzing the business ideas brought to our attention<br />
with the aim of identifying a new idea, a new product,<br />
a new technology or a company striving to reach new<br />
markets. In 2010, we evaluated close to 1’800 direct<br />
investments, many submitted by innovative and highly<br />
entrepreneurial companies.<br />
<strong>Partners</strong> <strong>Group</strong> has supported dozens of entrepreneurial<br />
companies in sectors such as IT or hightech. The<br />
fi rm has accompanied many from the development of<br />
their fi rst prototype right up to their IPO with a prime<br />
example being ublox, a leading semiconductor provider.<br />
An example from a different sector of one of many entrepreneurial<br />
companies invested in by <strong>Partners</strong> <strong>Group</strong><br />
is Nord Anglia, a global provider of premium quality<br />
private education to students in kindergarten through<br />
the end of secondary school in Asia, Europe and the<br />
Middle East. The company has undergone a transition<br />
over the past years and has closed a number of noncore<br />
and underperforming schools while growing its<br />
business in China and moving into high growth regions<br />
such as the Middle East and most recently South East<br />
Asia. <strong>Partners</strong> <strong>Group</strong> was struck by the entrepreneurial<br />
spirit of this company as well as their aim of providing<br />
high-quality education to students around the world.<br />
Nord Anglia thus not only provided an attractive investment<br />
opportunity but was also aligned with <strong>Partners</strong><br />
<strong>Group</strong>’s corporate responsibility principles and passion<br />
for education and entrepreneurship. Nord Anglia currently<br />
targets further growth and intends to enter attractive<br />
new markets, with in particular a new school in<br />
Switzerland amongst their projects. <strong>Partners</strong> <strong>Group</strong> actively<br />
supports Nord Anglia with its market know-how<br />
as well as leveraging its global industry network to aid<br />
the company in further growing its business.<br />
23
24<br />
APPRAISING AN INFRASTRUCTURE<br />
INVESTMENT<br />
Benjamin Haan Private Infrastructure, Nick ap Simon Head Dubai, Michael<br />
Barben Head Private Infrastructure and Dmitriy Antropov Private Infrastructure.
INDEX OF CONSOLIDATED FINANCIAL STATEMENTS<br />
AND REPORT OF THE AUDITORS<br />
1. Report of the Auditors on the Consolidated Financial Statements 26<br />
2. Consolidated Financial Statements:<br />
– Consolidated income statement for the years ended 31 December 2010 and 2009 29<br />
- Consolidated statement of comprehensive income for the years ended 31 December 2010 and 2009 30<br />
– Consolidated balance sheet as of 31 December 2010 and 2009 31<br />
– Consolidated statement of changes in equity for the years ended 31 December 2010 and 2009 32<br />
– Consolidated cash fl ow statement for the years ended 31 December 2010 and 2009 34<br />
– Notes to the consolidated fi nancial statements for the years ended 31 December 2010 and 2009 36<br />
25
26<br />
R E P O R T O F T H E A U D I T O R S O N T H E C O N S O L I D A T E D<br />
F I N A N C I A L S T A T E M E N T S
R E P O R T O F T H E A U D I T O R S O N T H E C O N S O L I D A T E D<br />
F I N A N C I A L S T A T E M E N T S<br />
27
28<br />
This page has been left blank intentionally.
CONSOLIDATED INCOME STATEMENT<br />
FOR THE YEARS ENDED 31 DECEMBER 2010 AND 2009<br />
In thousands of Swiss francs Note 2010 2009<br />
Revenues from management and advisory services, net 7 372’552 321’781<br />
Share of results of associates 14 3’650 2’942<br />
Net revenues 376’202 324’723<br />
Third party services 8 – 5’882 – 5’041<br />
Personnel expenses 9 – 97’704 – 73’692<br />
General and administrative expenses – 14’269 – 12’076<br />
Marketing and representation expenses – 8’587 – 6’733<br />
Depreciation and amortization 12&13 – 7’624 – 5’342<br />
EBIT 242’136 221’839<br />
Change in fair value of derivatives arising from<br />
insurance contracts 27 – 3’436 – 5’580<br />
Net fi nance income and expense 10 78’328 866<br />
Profi t before tax 317’028 217’125<br />
Income tax expense 11 – 20’493 – 12’253<br />
Net profi t for the period 296’535 204’872<br />
Attributable to:<br />
Equity holders of the parent 296’294 204’838<br />
Non-controlling interest 241 34<br />
Basic earnings per share (Swiss francs) 22 11.94 8.29<br />
Diluted earnings per share (Swiss francs) 22 11.21 7.75<br />
29
30<br />
CONSOLIDATED STATEMENT OF COMPREHENSIVE INCOME<br />
FOR THE YEARS ENDED 31 DECEMBER 2010 AND 2009<br />
In thousands of Swiss francs 2010 2009<br />
Net profi t for the period 296’535 204’872<br />
Other comprehensive income:<br />
Exchange differences on translating foreign operations – 29’692 – 1’069<br />
Other comprehensive income for the period – 29’692 – 1’069<br />
Total comprehensive income for the period 266’843 203’803<br />
Total comprehensive income attributable to:<br />
Equity holders of the parent 266’602 203’769<br />
Non-controlling interest 241 34
CONSOLIDATED BALANCE SHEET<br />
AS OF 31 DECEMBER 2010 AND 2009<br />
In thousands of Swiss francs Note 2010 2009<br />
Assets<br />
Property and equipment 12 7’100 6’247<br />
Intangible assets 13 46’050 55’886<br />
Investments in associates 14 3’902 3’382<br />
Other investments 15 180’480 124’872<br />
Other fi nancial assets 16 88’502 100’638<br />
Employee benefi ts 26 827 –<br />
Deferred tax assets 17 646 396<br />
Total non-current assets 327’507 291’421<br />
Prepaid expenses, derivative assets and loans 18 141’929 126’444<br />
Trade receivables 18 40’093 38’659<br />
Other receivables 18 2’230 3’705<br />
Marketable securities 19 488 10’170<br />
Cash and cash equivalents 20 226’572 169’682<br />
Total current assets 411’312 348’660<br />
Total assets 738’819 640’081<br />
Equity and liabilities<br />
Share capital 21 267 267<br />
Own equity instruments – 283’720 – 234’800<br />
Legal reserves 21 218 218<br />
Other components of equity 854’766 691’983<br />
Equity attributable to equity holders of the parent 571’531 457’668<br />
Non-controlling interest 701 426<br />
Total equity 572’232 458’094<br />
Liabilities<br />
Employee benefi ts 26 – 207<br />
Derivatives arising from insurance contracts 27 84’588 96’618<br />
Deferred tax liabilities 17 2’034 –<br />
Other long-term liabilities 194 –<br />
Total non-current liabilities 86’816 96’825<br />
Trade payables 14’797 18’446<br />
Income taxes liabilities 17’649 21’425<br />
Accrued expenses 24 35’212 37’393<br />
Other current liabilities 25 12’113 7’898<br />
Total current liabilities 79’771 85’162<br />
Total liabilities 166’587 181’987<br />
Total equity and liabilities 738’819 640’081<br />
31
32<br />
CONSOLIDATED STATEMENT OF CHANGES IN EQUITY FOR THE<br />
YEARS ENDED 31 DECEMBER 2010 AND 2009<br />
In thousands of Swiss francs Other components of equity 2010<br />
Share Own equity<br />
capital instruments 1)<br />
Legal<br />
reserves<br />
(incl.<br />
Total other Attributable<br />
share<br />
compo- to equity Non-conpremi-<br />
Translation Retained nents of holders of trollingum)<br />
reserves earnings equity the parent interest Total<br />
Balance at 1 January 2010 267 – 234’800 218 – 18’677 710’660 691’983 457’668 426 458’094<br />
Transactions with owners, recorded<br />
directly in equity<br />
Contributions by and distributions to<br />
owners:<br />
Purchase of treasury shares – 268’095 – – 268’095 – 268’095<br />
Disposal of treasury shares 218’904 – 10’041 – 10’041 208’863 208’863<br />
Share-based payment expenses<br />
Tax effect resulting from equity settled<br />
271 15’234 15’234 15’505 15’505<br />
transactions 1’771 1’771 1’771 1’771<br />
Minority interest changes 13 13 13 112 125<br />
Dividends paid to shareholders<br />
Total contributions by and distribu-<br />
– 110’796 – 110’796 – 110’796 – 78 – 110’874<br />
tions to owners – – 48’920 – – – 103’819 – 103’819 – 152’739 34 – 152’705<br />
Total comprehensive income for the<br />
period<br />
Net profi t for the period 296’294 296’294 296’294 241 296’535<br />
Other comprehensive income:<br />
Exchange differences on translating foreign<br />
operations – 29’692 – 29’692 – 29’692 – 29’692<br />
Total other comprehensive income – – – – 29’692 – – 29’692 – 29’692 – – 29’692<br />
Total comprehensive income for the<br />
period – – – – 29’692 296’294 266’602 266’602 241 266’843<br />
Balance at 31 December 2010 267 – 283’720 218 – 48’369 903’135 854’766 571’531 701 572’232<br />
1) Own equity instruments include treasury shares and options of the Company.
CONSOLIDATED STATEMENT OF CHANGES IN EQUITY FOR THE<br />
YEARS ENDED 31 DECEMBER 2010 AND 2009 - CONTINUED<br />
In thousands of Swiss francs Other components of equity 2009<br />
Share Own equity<br />
capital instruments 1)<br />
Legal<br />
reserves<br />
(incl.<br />
Total other Attributable<br />
share<br />
compo- to equity Non-conpremi-<br />
Translation Retained nents of holders of trollingum)<br />
reserves earnings equity the parent interest Total<br />
Balance at 1 January 2009 267 – 225’492 218 – 17’608 599’134 581’526 356’519 392 356’911<br />
Transactions with owners, recorded<br />
directly in equity<br />
Contributions by and distributions to<br />
owners:<br />
Purchase of treasury shares – 144’020 – – 144’020 – 144’020<br />
Disposal of treasury shares 134’155 – 1’815 – 1’815 132’340 132’340<br />
Share-based payment expenses<br />
Tax effect resulting from equity settled<br />
557 10’786 10’786 11’343 11’343<br />
transactions 3’082 3’082 3’082 3’082<br />
Dividends paid to shareholders<br />
Total contributions by and distribu-<br />
– 105’365 – 105’365 – 105’365 – – 105’365<br />
tions to owners – – 9’308 – – – 93’312 – 93’312 – 102’620 – – 102’620<br />
Total comprehensive income for the<br />
period<br />
Net profi t for the period 204’838 204’838 204’838 34 204’872<br />
Other comprehensive income:<br />
Exchange differences on translating foreign<br />
operations – 1’069 – 1’069 – 1’069 – 1’069<br />
Total other comprehensive income – – – – 1’069 – – 1’069 – 1’069 – – 1’069<br />
Total comprehensive income for the<br />
period – – – – 1’069 204’838 203’769 203’769 34 203’803<br />
Balance at 31 December 2009 267 – 234’800 218 – 18’677 710’660 691’983 457’668 426 458’094<br />
1) Own equity instruments include treasury shares and options of the Company.<br />
33
34<br />
CONSOLIDATED CASH FLOW STATEMENT<br />
FOR THE YEARS ENDED 31 DECEMBER 2010 AND 2009<br />
In thousands of Swiss francs Note 2010 2009<br />
Operating activities<br />
Net profi t for the period 296’535 204’872<br />
Adjustments:<br />
Share of results of associates 14 – 3’650 – 2’942<br />
Net fi nance (income) and expense 10 – 78’328 – 866<br />
Income tax expenses 11 20’493 12’253<br />
Depreciation of property and equipment 12 2’936 2’633<br />
Amortization of intangible assets 13 4’688 2’712<br />
Share-based payment expenses<br />
Change in fair value of derivatives<br />
9 15’505 11’343<br />
arising from insurance contracts 27 3’436 5’580<br />
Change in fair value of assets held in experience account – 3’436 – 5’580<br />
Change in pension assets / obligations 26 – 1’034 – 166<br />
Gain / (loss) on derivatives 17’925 – 905<br />
Other non-cash items 124 – 433<br />
Operating cash fl ow before changes in working capital 275’194 228’501<br />
(Increase) / decrease in prepaid expenses, derivative assets and<br />
loans, trade and other receivables<br />
Increase / (decrease) in trade payables, accrued expenses and<br />
3’389 – 123’240<br />
other current liabilities 3’284 4’239<br />
Financial expenses (other than interest) paid – 449 – 262<br />
Cash generated from operations 281’418 109’238<br />
Income tax (paid) / received – 20’504 1’861<br />
Net cash provided by operating activities 260’914 111’099
CONSOLIDATED CASH FLOW STATEMENT FOR THE<br />
YEARS ENDED 31 DECEMBER 2010 AND 2009 – CONTINUED<br />
In thousands of Swiss francs Note 2010 2009<br />
Investing activities<br />
(Purchase) / disposal of marketable securities 10’774 6’512<br />
Proceeds on disposal of property and equipment 16 44<br />
Purchase of property and equipment 12 – 3’956 – 2’764<br />
Proceeds on disposal of intangible assets 13 – 56<br />
Purchase of intangible assets 13 – 2’393 – 2’147<br />
Proceeds from disposal of other investments 15 4’661 5’750<br />
Purchase of other investments 15 – 54’788 – 32’533<br />
Disposal of subsidiary, net of cash received 5 1’322 –<br />
Investments in assets held in experience account – 2’736 – 3’986<br />
Change in other fi nancial assets 2’407 2’520<br />
Interest received 16’677 10’241<br />
Dividends received 3’005 4’510<br />
Net cash used in investing activities – 25’011 – 11’797<br />
Financing activities<br />
Interest paid 10 – 26 – 36<br />
Proceeds from increase in non-controlling interest 112 –<br />
Dividends paid to non-controlling interest – 65 –<br />
Dividends paid to shareholders 21 – 110’796 – 105’365<br />
Purchase of own equity instruments – 268’095 – 144’020<br />
Disposal of own equity instruments 208’863 132’340<br />
Net cash used in fi nancing activities – 170’007 – 117’081<br />
Net increase / (decrease) in cash and cash equivalents 65’896 – 17’779<br />
Cash and cash equivalents at beginning of the period 20 169’682 186’845<br />
Effect of foreign exchange rate changes – 9’006 616<br />
Cash and cash equivalents at end of the period 20 226’572 169’682<br />
35
36<br />
NOTES TO THE CONSOLIDATED FINANCIAL STATEMENTS<br />
FOR THE YEARS ENDED 31 DECEMBER 2010 AND 2009<br />
1. REPORTING ENTITY<br />
<strong>Partners</strong> <strong>Group</strong> Holding AG (the Company) is a company domiciled in Switzerland. The address of the Company’s<br />
registered offi ce is Zugerstrasse 57, Baar-Zug. The consolidated fi nancial statements for the years ended 31 December<br />
2010 and 2009 comprise the Company and its subsidiaries (together referred to as the <strong>Group</strong>) and the <strong>Group</strong>’s<br />
interest in associates. The consolidated fi nancial statements were authorized for issue by the Board of Directors (BoD)<br />
on 1 March 2011 and are subject to approval at the annual general meeting of shareholders on 5 May 2011.<br />
The principal activities of the <strong>Group</strong> are described in note 6.<br />
The consolidated fi nancial statements present a true and fair view of the <strong>Group</strong>’s fi nancial position, results of operations<br />
and cash fl ows in accordance with International Financial Reporting Standards (IFRS) and comply with Swiss<br />
law.<br />
2. SUMMARY OF SIGNIFICANT ACCOUNTING POLICIES<br />
2.1 Basis of preparation<br />
The consolidated fi nancial statements are presented in Swiss francs, rounded to the nearest thousand. The fi gures<br />
referred to in text passages are shown in actual fi gures, rounded to the nearest Swiss franc unless otherwise stated.<br />
The statements are prepared on the historical cost basis, except that the following assets and liabilities are stated<br />
at their fair value: derivative fi nancial instruments, fi nancial instruments designated as at fair value through profi t<br />
or loss and fi nancial instruments classifi ed as available-for-sale. Non-current assets and disposal groups held for<br />
sale are stated at the lower of carrying amount and fair value less costs to sell.<br />
The preparation of fi nancial statements in conformity with IFRS requires management to make judgments, estimates<br />
and assumptions that affect the application of policies and reported amounts of assets and liabilities, income<br />
and expenses. The estimates and associated assumptions are based on historical experience and various other<br />
factors that are believed to be reasonable under the circumstances, the results of which form the basis of making<br />
judgments concerning carrying values of assets and liabilities that are not readily apparent from other sources.<br />
Actual results may differ from these estimates.<br />
The estimates and underlying assumptions are reviewed on an ongoing basis. Revisions to accounting estimates are<br />
recognized in the period in which the estimate is revised, if the revision affects only that period or in the period of<br />
the revisions and future periods, if the revision affects both current and future periods.<br />
Judgments made by management in the application of IFRS that have a signifi cant effect on the consolidated fi nancial<br />
statements and estimates with a signifi cant risk of material adjustment in the next year are discussed in note 3.<br />
The Board of Directors performed an assessment of the risks to which the <strong>Group</strong> is exposed to at its meeting on<br />
17 November 2010. The risk management covers in particular the strategic and business risks, operational risks,<br />
fi nancial risks (see note 4) as well as reputational risks. The Board of Directors has taken into consideration the<br />
internal control system designed to monitor and reduce the risks of the <strong>Group</strong> for its assessment.
NOTES TO THE CONSOLIDATED FINANCIAL STATEMENTS<br />
FOR THE YEARS ENDED 31 DECEMBER 2010 AND 2009<br />
2.2 Basis of consolidation<br />
(b) Subsidiaries<br />
Subsidiaries are all entities over which the <strong>Group</strong> has the power to govern the fi nancial and operating policies; this<br />
is generally accompanied by a shareholding of more than one half of the voting rights.<br />
The existence and effect of potential voting rights that are currently exercisable or convertible are considered when<br />
assessing whether the <strong>Group</strong> controls another entity. Subsidiaries are fully consolidated from the date on which<br />
control is transferred to the <strong>Group</strong>. They are de-consolidated from the date on which control ceases. The acquisition<br />
method of accounting is used to account for the acquisition of subsidiaries by the <strong>Group</strong>.<br />
Intercompany transactions, balances and unrealized gains on transactions between <strong>Group</strong> companies are eliminated.<br />
Unrealized losses are also eliminated unless the transaction provides evidence of an impairment of the asset<br />
transferred. The <strong>Group</strong>’s accounting policies are consistently applied by all subsidiaries.<br />
(b) Accounting for acquisitions of non-controlling interests<br />
Acquisitions of non-controlling interests are accounted for as transactions with owners in their capacity as owners<br />
and therefore no goodwill is recognized as a result of such transactions. The adjustments to non-controlling interests<br />
are based on a proportionate amount of the net assets of the subsidiary.<br />
Non-controlling interests are shown as a component of equity in the balance sheet and the share of the profi t attributable<br />
to non-controlling interest is shown as a component of profi t of the year in the income statement.<br />
(c) Associates<br />
Associates are all entities over which the <strong>Group</strong> has signifi cant infl uence but no control, generally accompanying<br />
a shareholding of between 20% and 50% of the voting rights. Investments in associates are accounted for by the<br />
equity method of accounting and are initially recognized at cost.<br />
The <strong>Group</strong>’s investment in associates includes goodwill (net of any accumulated impairment loss) identifi ed on acquisition<br />
(see note 2.11).<br />
The <strong>Group</strong>’s share of its associates’ post-acquisition profi ts or losses is recognized in the income statement, and its<br />
share of post-acquisition movements in reserves is recognized in reserves. The cumulative post-acquisition movements<br />
are included in the carrying amount of the investment.<br />
When the <strong>Group</strong>’s share of losses in an associate equals or exceeds its interest in the associate, including any other<br />
unsecured receivables, the <strong>Group</strong> does not recognize further losses, unless it has incurred obligations or made payments<br />
on behalf of the associate.<br />
Unrealized gains on transactions between the <strong>Group</strong> and its associates are eliminated to the extent of the <strong>Group</strong>’s<br />
interest in the associates. Unrealized losses are also eliminated unless the transaction provides evidence of an impairment<br />
of the asset transferred.<br />
(d) Other investments / special purpose entities<br />
In the course of offering structured products the <strong>Group</strong> may become the majority or sole shareholder of certain<br />
entities. These entities are managed for a certain period of time, but the <strong>Group</strong> is not the benefi cial owner of assets<br />
contained in these companies; in addition, the <strong>Group</strong>’s management decisions are strictly limited by separate contracts.<br />
Such entities fulfi ll the defi nition of special purpose entities and are accounted for by applying SIC 12 “Consolidation<br />
– Special Purpose Entities”. The same applies to limited partnerships, where the <strong>Group</strong> holds only a minor<br />
equity interest but acts as the General Partner on behalf of the entity’s investors, who are the limited partners. As<br />
the <strong>Group</strong> in both instances is not subject to the majority of risk and rewards these entities are not consolidated,<br />
but are designated as at fair value through profi t or loss.<br />
37
38<br />
NOTES TO THE CONSOLIDATED FINANCIAL STATEMENTS<br />
FOR THE YEARS ENDED 31 DECEMBER 2010 AND 2009<br />
2.3 Changes in accounting policies<br />
The accounting policies adopted for the year ended 31 December 2010 are consistent with those of the previous<br />
fi nancial year presented in this report, except where new or revised standards were adopted prospectively, as indicated<br />
below.<br />
2.3.1 Standards, amendments and interpretations effective in 2010<br />
The following revised standards related to business combinations are mandatory for the fi rst time for the fi nancial<br />
year beginning 1 January 2010:<br />
– IFRS 3 (revised), “Business Combinations”,<br />
– consequential amendments to IAS 27, “Consolidated and Separate Financial Statements” and<br />
– consequential amendments to IAS 28, “Investments in Associates”.<br />
The revised standard has resulted in the following changes:<br />
– acquisition-related costs are expensed as incurred;<br />
– for a business combination in which the <strong>Group</strong> achieves control without buying all of the equity of the acquiree,<br />
the non-controlling interests are measured either at fair value or at the non-controlling interests’ proportionate<br />
share of the acquiree’s net identifi able assets;<br />
– upon obtaining control in a business combination achieved in stages, the <strong>Group</strong> remeasures its previously held<br />
equity interest at fair value and recognizes a gain or a loss to the income statement; and<br />
– contingent consideration of an acquisition is measured at fair value. Changes are accounted for outside goodwill,<br />
in the income statement.<br />
The change in accounting policy has been applied prospectively and has had no material impact on the fi nancial position<br />
or result of the <strong>Group</strong>.<br />
The following new standards, amendments to standards and interpretations are mandatory for the fi rst time for the<br />
fi nancial year beginning 1 January 2010, but are not currently relevant to the <strong>Group</strong> (they may have an impact on<br />
the accounting for future transactions and events of the <strong>Group</strong>):<br />
– Improvements to IFRSs (2009)<br />
– IFRIC 16 (amendment), “Hedges of a Net Investment in a Foreign Operation”<br />
– IFRIC 17, “Distribution of Non-cash Assets to Owners”<br />
– IFRS 2 (amendments), “<strong>Group</strong> Cash-settled Share-based Payment Transactions”<br />
– IFRS 5 (amendment), “Non-current Assets Held for Sale and Discontinued Operations”
NOTES TO THE CONSOLIDATED FINANCIAL STATEMENTS<br />
FOR THE YEARS ENDED 31 DECEMBER 2010 AND 2009<br />
2.3.2 Standards, amendments and interpretations to existing standards, that are not yet effective and<br />
might be relevant for the <strong>Group</strong> but have not been early adopted<br />
The following new and revised standards and interpretations have been issued by the date the consolidated fi nancial<br />
statements were authorized for issue, but are not yet effective and are not applied early in these consolidated fi nancial<br />
statements. Their impact on the consolidated fi nancial statements of the <strong>Group</strong> has not yet been systematically<br />
analyzed. The expected effects as disclosed in the table below refl ect a fi rst assessment by <strong>Group</strong> management.<br />
Standard / Interpretation Effective date Planned application by<br />
<strong>Partners</strong> <strong>Group</strong><br />
IFRS 9, “Financial Instruments” *** 1 January 2013 Reporting year 2013<br />
Revised IAS 24 (revised), “Related party disclosures” ** 1 January 2011 Reporting year 2011<br />
IAS 32,(amendment), “Financial Instruments: Presentation”<br />
- “Classifi cation of rights issues”<br />
* 1 February 2010 Reporting year 2011<br />
IFRIC 19, “Extinguishing fi nancial liabilities with equity<br />
instruments”<br />
IFRIC 14, IAS 19 (amendment), “The limit on a defi ned<br />
benefi t asset, minimum funding requirements and their<br />
interaction”<br />
* 1 July 2010 Reporting year 2011<br />
* 1 January 2011 Reporting year 2011<br />
Improvements to IFRSs (2010) ** 1 January 2011 Reporting year 2011<br />
* No signifi cant impact is expected on the consolidated fi nancial statements of the <strong>Group</strong><br />
** Mainly additional disclosures or changes in the presentation are expected in the consolidated fi nancial statements of the <strong>Group</strong><br />
*** The impact on the consolidated fi nancial statements of the <strong>Group</strong> can not yet be determined with suffi cient reliability<br />
2.4 Segment reporting<br />
An operating segment is a component of the <strong>Group</strong> that engages in business activities from which it may earn revenues<br />
and incur expenses, including revenues and expenses that relate to transactions with any of the <strong>Group</strong>’s<br />
other components. All operating segments’ gross segment results are reviewed regularly by the <strong>Group</strong>’s Board of<br />
Directors to make decisions about resources to be allocated to the segment for which discrete fi nancial information<br />
is available and to assess its performance.<br />
2.5 Foreign currency translation<br />
(a) Functional and presentation currency<br />
Items included in the fi nancial statements of each of the <strong>Group</strong>’s entities are measured using the currency of the<br />
primary economic environment in which the entity operates (the “functional currency”). The consolidated fi nancial<br />
statements are presented in Swiss francs.<br />
(b) Foreign currency transactions<br />
Transactions in foreign currencies are translated at the foreign exchange rate ruling at the date of the transaction.<br />
Monetary assets and liabilities denominated in foreign currencies at the balance sheet date are translated to Swiss<br />
francs at the foreign exchange rate ruling at that date. Foreign exchange differences arising on translation are<br />
recognized in the income statement. Non-monetary assets and liabilities that are measured in terms of historical<br />
cost in a foreign currency are translated using the exchange rate at the date of the transaction. Non-monetary assets<br />
and liabilities denominated in foreign currencies that are stated at fair value are translated to Swiss francs at<br />
the applicable foreign exchange rates for the dates the fair value was determined.<br />
(c) Foreign operations<br />
The assets and liabilities of foreign operations, including goodwill and fair value adjustments arising on consolidation,<br />
are translated to Swiss francs at foreign exchange rates applicable at the balance sheet date. The revenues<br />
and expenses as well as cash fl ows of foreign operations are translated to Swiss francs at average rates.<br />
39
40<br />
NOTES TO THE CONSOLIDATED FINANCIAL STATEMENTS<br />
FOR THE YEARS ENDED 31 DECEMBER 2010 AND 2009<br />
Foreign currency translation differences are recognized in other comprehensive income, and presented in the translation<br />
reserve in equity. However, if the operation is a non-wholly-owned subsidiary, then the relevant proportionate<br />
share of the translation difference is allocated to the non-controlling interest. When the disposal or partial disposal<br />
of a foreign operation results in losing control or signifi cant infl uence over an entity (i.e. the foreign operation) the<br />
cumulative amount in the translation reserve (related to the specifi c foreign operation) is reclassifi ed to profi t or<br />
loss as part of gain or loss on disposal.<br />
When the partial disposal of an interest in a subsidiary that includes a foreign operation does not result in a change<br />
in control, the relevant proportion of the cumulative amount (in the translation reserve) is re-attributed to non-controlling<br />
interest.<br />
When the partial disposal of an interest in an associate that includes a foreign operation results in retaining signifi -<br />
cant infl uence, the relevant proportion of the cumulative amount is reclassifi ed to profi t or loss.<br />
(d) Applied foreign currency rates<br />
The <strong>Group</strong> applied the following currency rates against Swiss francs:<br />
Year Currency Balance sheet<br />
Average<br />
rate<br />
rate<br />
2010 EUR 1.2507 1.3820<br />
USD 0.9352 1.0428<br />
GBP 1.4597 1.6099<br />
SGD 0.7283 0.7648<br />
2009 EUR 1.4831 1.5098<br />
USD 1.0349 1.0852<br />
GBP 1.6711 1.6961<br />
SGD 0.7366 0.7460<br />
2.6 Accounting for derivative fi nancial instruments and hedging activities<br />
The <strong>Group</strong> uses derivative fi nancial instruments to economically hedge its exposure to foreign exchange risks arising<br />
from fi nancing and investment activities. The <strong>Group</strong> does not hold or issue derivative fi nancial instruments for<br />
trading purposes.<br />
Derivatives are recognized initially at fair value and attributable transaction costs are recognized in profi t or loss<br />
when incurred. Subsequent to initial recognition, derivatives are measured at fair value, and changes therein are<br />
accounted for as described below. The fair value of forward exchange contracts is the present value of the quoted<br />
forward price.<br />
2.7 Revenue recognition<br />
Revenue comprises the fair value of the sale of services, net of value-added tax and rebates and after eliminating<br />
sales within the <strong>Group</strong>. Revenue is recognized as follows:<br />
– Sales of services are recognized in the accounting period in which the services are rendered, with reference to<br />
completion of the specifi c transaction, assessed on the basis of the actual service provided as a proportion of the<br />
total services to be provided.<br />
– Ongoing investment management and advisory fees including all non-performance related fees are recognized<br />
when they were earned, based on the specifi c contracts. Performance fees are only recognized once they have<br />
been “locked-in” and cannot subsequently be reversed. As long as distributed performance fees are under a<br />
claw-back provision, they are recognized as deferred income and disclosed separately in note 25.<br />
– No revenue is recognized if there are signifi cant uncertainties regarding the recovery of consideration due or associated<br />
costs.
NOTES TO THE CONSOLIDATED FINANCIAL STATEMENTS<br />
FOR THE YEARS ENDED 31 DECEMBER 2010 AND 2009<br />
2.8 Expenses<br />
(a) Leases<br />
Leases where the lessor retains substantially all the risks and rewards of ownership are classifi ed as operating leases.<br />
Payments made under operating leases (net of any incentives received from the lessor) are charged to the income<br />
statement on a straight-line basis over the period of the lease. Lease incentives are recognized in the income<br />
statement as an integral part of total lease expense.<br />
(b) Net fi nance income and expense<br />
Other fi nance income / expense, net, comprises interest income on funds invested, dividend income, gains and losses<br />
on revaluations of held for trading and fair value through profi t or loss instruments, foreign exchange gains and<br />
losses, and gains and losses on derivative fi nancial instruments (see note 2.6) that are recognized in the income<br />
statement.<br />
Interest income is recognized in the income statement as it accrues, using the effective interest method. Dividend<br />
income is recognized in the income statement on the date the entity’s right to receive payments is established,<br />
which in the case of quoted securities is usually the ex-dividend date. The interest expense component of fi nance<br />
lease payments is recognized in the income statement using the effective interest method.<br />
2.9 Income tax<br />
Income tax on the profi t or loss for the year comprises current and deferred tax. Income tax is recognized in the income<br />
statement except to the extent that it relates to items recognized directly in equity, in which case it is recognized<br />
directly in equity.<br />
Current tax relates to the expected taxes payable on the taxable income for the year, using tax rates enacted or<br />
substantially enacted at the balance sheet date, and any adjustment to taxes payable in respect of previous years.<br />
Deferred income tax is recognized, using the balance sheet liability method, on temporary differences between the<br />
tax bases of assets and liabilities and their carrying amounts included in the consolidated fi nancial statements. The<br />
following temporary differences are not considered in accounting for deferred taxes: the initial recognition of goodwill,<br />
the initial recognition of assets or liabilities that affect neither accounting nor taxable profi t and differences relating<br />
to investments in subsidiaries to the extent that they will probably not be reversed in the foreseeable future.<br />
Deferred income tax is determined using tax rates (and laws) that have been enacted or substantially enacted as of<br />
the balance sheet date and are expected to apply when the related deferred income tax asset is realized or the deferred<br />
income tax liability is settled.<br />
Deferred income tax assets are recognized to the extent that it is probable that future taxable profi t will be available<br />
against which the temporary differences can be utilized.<br />
41
42<br />
NOTES TO THE CONSOLIDATED FINANCIAL STATEMENTS<br />
FOR THE YEARS ENDED 31 DECEMBER 2010 AND 2009<br />
2.10 Property and equipment<br />
All property and equipment are stated at cost less accumulated depreciation and impairment losses. Cost includes<br />
expenditure that is directly attributable to the acquisition of the items.<br />
Where parts of an item of property and equipment have different useful lives, they are accounted for as separate<br />
items of property and equipment.<br />
Subsequent costs are included in the asset’s carrying amount or recognized as a separate asset, as appropriate,<br />
only when it is probable that future economic benefi ts associated with the item will fl ow to the <strong>Group</strong> and the cost<br />
of the item can be measured reliably. All other repairs and maintenance are charged to the income statement during<br />
the fi nancial period in which they are incurred.<br />
Depreciation of assets is calculated using the straight-line method to allocate the cost of each asset to its residual<br />
value over its estimated useful life, as follows:<br />
– Interior fi ttings 5–10 years<br />
– Offi ce furniture 5 years<br />
– Equipment and IT fi ttings 3 years<br />
Major renovations are depreciated over the remaining useful life of the related asset or to the date of the next major<br />
renovation, whichever is sooner.<br />
The assets’ residual values and useful lives are reviewed, and adjusted if appropriate, at each balance sheet date.<br />
An asset’s carrying amount is written down immediately to its recoverable amount if the asset’s carrying amount is<br />
greater than its estimated recoverable amount (see note 2.15).<br />
Gains and losses on disposals are determined by comparing proceeds with the carrying amount and are included in<br />
the income statement.<br />
2.11 Intangible assets<br />
(a) Goodwill<br />
Goodwill arises upon the acquisition of subsidiaries and is included in intangible assets.<br />
The <strong>Group</strong> measures goodwill at the acquisition date as:<br />
– the fair value of the consideration transferred; plus<br />
– the recognized amount of any non-controlling interests in the acquiree; plus if the business combination is<br />
achieved in stages, the fair value of the existing equity interest in the acquiree; less<br />
– the net recognized amount (generally fair value) of the identifi able assets acquired and liabilities (including<br />
contingent liabilities) assumed.<br />
When the excess is negative, a bargain purchase gain is recognized immediately in profi t or loss.<br />
Goodwill is stated at cost less any accumulated impairment losses. Goodwill is allocated to cash-generating units<br />
and is not amortized but tested annually for impairment (see note 2.15).<br />
In respect of associates, the carrying amount of goodwill is included in the carrying amount of the investment in the<br />
associate.<br />
(b) Software<br />
Acquired software licenses are capitalized on the basis of the costs incurred to acquire and bring to use the specifi c<br />
software. Software recognized as an asset is carried at cost less accumulated amortization and impairment losses<br />
(see note 2.15).
NOTES TO THE CONSOLIDATED FINANCIAL STATEMENTS<br />
FOR THE YEARS ENDED 31 DECEMBER 2010 AND 2009<br />
(c) Placing expenses<br />
In the course of its business, the <strong>Group</strong> selectively uses placement agents to place some of its investment structures.<br />
The cost paid to such agents in relation to the amount placed is recognized as an asset in accordance with<br />
IAS 18 Appendix §14 b) (iii), since such expenses represent incremental costs, which are directly attributable to<br />
securing an investment management contract.<br />
(d) Cost of initial put option<br />
In 2006 the <strong>Group</strong> entered into an agreement with Swiss Re with regards to the extension of the term of the convertible<br />
bond issued by Pearl Holding Limited (“Pearl”) from 30 September 2010 to 30 September 2014 and an increase<br />
of the redemption amount of the bond from EUR 660 <strong>million</strong> to EUR 712.8 <strong>million</strong>. In this context, the <strong>Group</strong><br />
has committed to invest an additional EUR 33 <strong>million</strong> into the existing experience account until 30 September 2010<br />
to provide for further security. The payment of the present value of that amount was made in 2006. The <strong>Group</strong>’s<br />
risk associated with its exposure as policyholder for Pearl is still limited to the value of the experience account (see<br />
note 16); nevertheless this additional commitment increased the <strong>Group</strong>’s overall exposure and thus was recognized<br />
as additional derivative liability (see note 27). The <strong>Group</strong> considered the present value of the additional commitment<br />
also to be the incremental cost directly attributable to securing an investment management contract. This<br />
amount will be amortized using the straight-line method over the extension period from 1 October 2010 to 30 September<br />
2014 (see note 13 and note 27).<br />
(e) Client contracts<br />
Client contracts, which the <strong>Group</strong> acquired and are recognized as assets, have a defi nite useful life. Such intangible<br />
assets are carried at cost less accumulated amortization and impairment losses (see note 2.15).<br />
(f) Subsequent expenditure<br />
Subsequent expenditure on capitalized intangible assets is capitalized only when it increases the future economic<br />
benefi ts embodied in the specifi c asset to which it relates. All other expenditure is expensed as incurred.<br />
(g) Amortization<br />
Amortization is charged to the income statement on a straight-line basis over the estimated useful lives of intangible<br />
assets unless such lives are indefi nite. Goodwill and other intangible assets with an indefi nite useful life are at<br />
least annually tested for impairment at the balance sheet date (see note 2.15). Intangible assets with a determinable<br />
useful life are amortized from the date they are available for use.<br />
The estimated useful lives are as follows:<br />
– Computer software 3 years<br />
– Placing expenses 3–5 years<br />
– Cost of initial put option 4 years<br />
– Client contracts 3.5 years<br />
2.12 Investments<br />
The <strong>Group</strong> classifi es its investments in the following categories: fi nancial assets at fair value through profi t or loss,<br />
and loans and receivables. The classifi cation depends on the purpose for which the investments were acquired.<br />
Management determines the classifi cation of its investments at initial recognition.<br />
(a) Financial assets at fair value through profi t or loss<br />
This category has two sub-categories: fi nancial assets held for trading, and those designated at fair value through<br />
profi t or loss at inception. A fi nancial asset is classifi ed as held for trading if acquired principally for the purpose of<br />
selling in the short term. Derivatives are also categorized as held for trading. Financial instruments may be designated<br />
as at fair value through profi t or loss if the <strong>Group</strong> manages such investments and makes purchase and sale<br />
decisions based on their fair value. Assets in this category are classifi ed as current if they are either held for trading<br />
or are expected to be realized within 12 months of the balance sheet date.<br />
43
44<br />
NOTES TO THE CONSOLIDATED FINANCIAL STATEMENTS<br />
FOR THE YEARS ENDED 31 DECEMBER 2010 AND 2009<br />
(b) Loans and receivables<br />
Loans and receivables are non-derivative fi nancial assets with fi xed or determinable payments, which are not quoted<br />
in an active market and in respect of which there is no intention of trading. They are included in current assets<br />
(trade and other receivables, see note 2.13), except for amounts with maturities greater than 12 months after the<br />
balance sheet date, which are classifi ed as non-current assets (other fi nancial assets).<br />
(c) Recognition and measurement<br />
Purchases and sales of investments are recognized on the settlement date – the date on which the fi nancial asset is<br />
delivered to the entity that purchased it. Investments are initially recognized at fair value plus, in the case of fi nancial<br />
assets not carried at fair value through profi t or loss, transaction costs. Investments are derecognized when the<br />
rights to receive cash fl ows from the investments have expired or have been transferred and the <strong>Group</strong> has transferred<br />
substantially all risks and rewards of ownership. Financial assets at fair value through profi t or loss are subsequently<br />
carried at fair value. Loans and receivables are carried at amortized cost using the effective interest<br />
method. Realized and unrealized gains and losses arising from changes in the fair value of the “fi nancial assets at<br />
fair value through profi t or loss” category are included in the income statement in the period in which they arise.<br />
The fair values of quoted investments are based on current bid prices. If the market for a fi nancial asset is not active<br />
(and for unlisted securities), the <strong>Group</strong> establishes fair values by using valuation techniques. These include the<br />
use of recent arm’s length transactions, reference to other instruments that are substantially the same and discounted<br />
cash fl ow analysis refi ned to refl ect the issuer’s specifi c circumstances. Regarding further explanations in<br />
connection with the determination of fair value please refer to note 4.6.<br />
2.13 Trade and other receivables<br />
Trade and other receivables are recognized initially at fair value and subsequently measured at amortized cost using<br />
the effective interest method, less impairment losses. An impairment loss on trade receivables is recognized when<br />
there is objective evidence that the <strong>Group</strong> will not be able to collect all amounts due according to the original terms<br />
of the receivables.<br />
2.14 Cash and cash equivalents<br />
Cash and cash equivalents include cash in hand, call deposits held with banks and other short-term highly liquid investments<br />
with original maturities of three months or less. Bank overdrafts are shown within borrowings in current<br />
liabilities on the balance sheet.<br />
2.15 Impairment of assets<br />
(a) Financial assets (including receivables)<br />
A fi nancial asset not carried at fair value through profi t or loss is assessed at each reporting date to determine<br />
whether there is objective evidence that it is impaired. A fi nancial asset is impaired if objective evidence indicates<br />
that a loss event has occurred after the initial recognition of the asset, and that the loss event had a negative effect<br />
on the estimated future cash fl ows of that asset that can be estimated reliably.<br />
Objective evidence that fi nancial assets (including equity securities) are impaired can include default or delinquency<br />
by a debtor, restructuring of an amount due to the <strong>Group</strong> on terms that the <strong>Group</strong> would not consider otherwise,<br />
indications that a debtor or issuer will enter bankruptcy or the disappearance of an active market for a security. In<br />
addition for an investment in an equity security, a signifi cant or prolonged decline in its fair value below its cost is<br />
objective evidence of impairment.<br />
The <strong>Group</strong> considers evidence of impairment for receivables at both a specifi c asset and collective level. All individually<br />
signifi cant receivables are assessed for specifi c impairment. All individually signifi cant receivables found not to<br />
be specifi cally impaired are then collectively assessed for any impairment that has been incurred but not yet identifi<br />
ed. Receivables that are not individually signifi cant are collectively assessed for impairment by grouping together<br />
receivables with similar risk characteristics.
NOTES TO THE CONSOLIDATED FINANCIAL STATEMENTS<br />
FOR THE YEARS ENDED 31 DECEMBER 2010 AND 2009<br />
An impairment loss in respect of a fi nancial asset measured at amortized cost is calculated as the difference between<br />
its carrying amount and the present value of the estimated future cash fl ows discounted at the asset’s original effective<br />
interest rate. Losses are recognized in profi t or loss and refl ected in an allowance account against receivables.<br />
Interest on the impaired asset continues to be recognized through the unwinding of the discount. When a subsequent<br />
event causes the amount of impairment loss to decrease, the decrease in impairment loss is reversed<br />
through profi t or loss.<br />
(b) Non-fi nancial assets<br />
The carrying amounts of the <strong>Group</strong>’s non-fi nancial assets, other than investment property, inventories and deferred<br />
tax assets are reviewed at each reporting date to determine whether there is any indication of impairment. If any<br />
such indication exists, then the asset’s recoverable amount is estimated. For goodwill and intangible assets that<br />
have indefi nite useful lives or that are not yet available for use, the recoverable amount is estimated each year at<br />
the same time.<br />
The recoverable amount of an asset or cash-generating unit is the greater of its value in use and its fair value less<br />
costs to sell. In assessing the value in use, the estimated future cash fl ows are discounted to their present value<br />
using a pre-tax discount rate that refl ects current market assessments of the time value of money and the risks<br />
specifi c to the asset. For the purpose of impairment testing, assets that cannot be tested individually are grouped<br />
together into the smallest group of assets that generates cash infl ows from continuing use that are largely independent<br />
of the cash infl ows of other assets or groups of assets (the “cash-generating unit” or “CGU”). Subject to an<br />
operating segment ceiling test, for the purposes of goodwill impairment testing, CGUs to which goodwill has been<br />
allocated are aggregated so that the level at which impairment is tested refl ects the lowest level at which goodwill is<br />
monitored for internal reporting purposes. Goodwill acquired in a business combination is allocated to groups of<br />
CGUs that are expected to benefi t from the synergies of the combination.<br />
The <strong>Group</strong>’s corporate assets do not generate separate cash infl ows. If there is an indication that a corporate asset<br />
may be impaired, then the recoverable amount is determined for the CGU to which the corporate asset belongs.<br />
An impairment loss is recognized if the carrying amount of an asset or its CGU exceeds its estimated recoverable<br />
amount. Impairment losses are recognized in profi t or loss. Impairment losses recognized in respect of CGUs are allocated<br />
fi rst to reduce the carrying amount of any goodwill allocated to the units, and then to reduce the carrying<br />
amounts of the other assets in the unit (group of units) on a pro rata basis.<br />
An impairment loss in respect of goodwill is not reversed. In respect of other assets, impairment losses recognized<br />
in prior periods are assessed at each reporting date for any indications that the loss has decreased or no longer<br />
exists. An impairment loss is reversed if there has been a change in the estimates used to determine the recoverable<br />
amount. An impairment loss is reversed only to the extent that the asset’s carrying amount does not exceed<br />
the carrying amount that would have been determined, net of depreciation or amortization, if no impairment loss<br />
had been recognized.<br />
2.16 Share capital<br />
(a) Ordinary shares<br />
Ordinary shares are classifi ed as equity since the shares are non-redeemable and any dividends are discretionary.<br />
(b) Issuance of new shares<br />
Incremental costs directly attributable to the issue of new shares or options are shown in equity as a deduction from<br />
the proceeds, net of tax.<br />
45
46<br />
NOTES TO THE CONSOLIDATED FINANCIAL STATEMENTS<br />
FOR THE YEARS ENDED 31 DECEMBER 2010 AND 2009<br />
(c) Repurchase of share capital and options<br />
Where any <strong>Group</strong> company purchases the Company’s own equity instruments, the consideration paid, including any<br />
directly attributable incremental costs (net of income taxes), is deducted from equity attributable to the Company’s<br />
equity holders until the shares are cancelled, re-issued or disposed of. Where such shares are subsequently sold or<br />
re-issued, any consideration received, net of any directly attributable incremental transaction costs and the related<br />
income tax effects, is included in equity attributable to the Company’s equity holders.<br />
(d) Distribution of dividends<br />
The distribution of dividends to the Company’s shareholders is recognized as a liability in the consolidated fi nancial<br />
statements when the dividends are approved by the Company’s shareholders.<br />
2.17 Employee benefi ts<br />
(a) Pension obligations<br />
<strong>Group</strong> companies operate various pension schemes. The schemes are funded through payments to insurance companies<br />
or trustee-administered funds, determined by periodic actuarial calculations. The <strong>Group</strong> has both defi ned<br />
benefi t and defi ned contribution plans.<br />
A defi ned contribution plan is a pension plan under which the <strong>Group</strong> pays fi xed contributions into a separate entity.<br />
The <strong>Group</strong> has no legal or constructive obligations to pay further contributions if the fund does not hold suffi cient<br />
assets to pay all employees the benefi ts relating to employee service in the current and prior periods. A defi ned<br />
benefi t plan is a pension plan that is not a defi ned contribution plan. Typically, defi ned benefi t plans defi ne an<br />
amount of pension benefi t that an employee will receive on retirement, usually dependent on one or more factors<br />
such as age, years of service and compensation. The benefi ts paid to all employees in the <strong>Group</strong>’s home country<br />
qualify as a post-employment defi ned benefi t plan.<br />
The liability recognized in the balance sheet in respect of defi ned benefi t pension plans is the present value of the<br />
defi ned benefi t obligation at the balance sheet date less the fair value of plan assets, together with adjustments for<br />
unrecognized actuarial gains or losses and past service costs. The defi ned benefi t obligation is calculated annually<br />
by independent actuaries using the projected unit credit method. The present value of the defi ned benefi t obligation<br />
is determined by discounting the estimated future cash outfl ows using interest rates of high-quality corporate bonds<br />
that are denominated in the currency in which the benefi ts will be paid, and that have terms to maturity approximating<br />
to the terms of the related pension obligation.<br />
Cumulative actuarial gains and losses arising from experience adjustments and changes in actuarial assumptions in<br />
excess of the greater of 10% of the value of plan assets and 10% of the defi ned benefi t obligation are spread to income<br />
over the employees’ expected average remaining working lives.<br />
Past service costs are recognized immediately in income, unless the changes to the pension plan are conditional on<br />
the employees remaining in service for a specifi ed period of time (the vesting period). In this case, the past service<br />
costs are amortized on a straight-line basis over the vesting period.<br />
When the actuarial calculation results in a benefi t to the <strong>Group</strong>, the recognized asset is limited to the total of any<br />
unrecognized past service cost and the present value of economic benefi ts available in the form of any future refunds<br />
from the plan or reductions in future contributions to the plan. An economic benefi t is available to the <strong>Group</strong><br />
if it is realizable during the life of the plan, or on settlement of the plan liabilities.<br />
For defi ned contribution plans, the <strong>Group</strong> pays contributions to publicly or privately administered pension insurance<br />
plans on a mandatory, contractual or voluntary basis. The <strong>Group</strong> has no further payment obligations once the contributions<br />
have been paid. The contributions are recognized as an employee benefi t expense when they are due.
NOTES TO THE CONSOLIDATED FINANCIAL STATEMENTS<br />
FOR THE YEARS ENDED 31 DECEMBER 2010 AND 2009<br />
(b) Termination benefi ts<br />
Termination benefi ts are payable when employment is terminated before the normal retirement date, or when an<br />
employee accepts voluntary redundancy in exchange for these benefi ts. The <strong>Group</strong> recognizes termination benefi ts<br />
when it is demonstrably committed to either: terminating the employment of current employees according to a<br />
detailed formal plan without possibility of withdrawal; or providing termination benefi ts as a result of an offer made<br />
to encourage voluntary redundancy. Benefi ts falling due more than 12 months after balance sheet date are discounted<br />
to their present value.<br />
(c) Share-based payment transactions<br />
The grant date fair value of share-based payment awards granted to employees is recognized as an employee expense,<br />
with a corresponding increase in equity, over the period that the employees unconditionally become entitled<br />
to the awards. The amount recognized as an expense is adjusted to refl ect the number of awards for which the related<br />
service and non-market vesting conditions are expected to be met, such that the amount ultimately recognized<br />
as an expense is based on the number of awards that do meet the related service and non-market performance<br />
conditions at the vesting date. For share-based payment awards with non-vesting conditions, the grant date<br />
fair value share-based payment is measured to refl ect such conditions and there is no true-up for differences between<br />
expected and actual outcomes.<br />
The fair value of the amount payable to employees in respect of share appreciation rights, which are settled in cash,<br />
is recognized as an expense with a corresponding increase in liabilities, over the period that the employees unconditionally<br />
become entitled to payment. The liability is remeasured at each reporting date and at settlement date. Any<br />
changes in the fair value of the liability are recognized as personnel expense in profi t or loss.<br />
Share-based payment arrangements in which the <strong>Group</strong> receives goods or services as consideration for its own equity<br />
instruments are accounted for as equity-settled share-based payment transactions, regardless of how the equity<br />
instruments are obtained by the <strong>Group</strong>.<br />
2.18 Provisions<br />
Provisions are recognized when: the <strong>Group</strong> has a present legal or constructive obligation as a result of past events;<br />
it is more likely than not that an outfl ow of resources will be required to settle the obligation; and the amount can<br />
be estimated reliably.<br />
If the effect is material, provisions are determined by discounting the expected future cash fl ows at the pre-tax rate<br />
that refl ects current market assessments of the time value of money and, where appropriate, the risks specifi c to<br />
the liability.<br />
2.19 Non-current assets held for sale and discontinued operations<br />
Non-current assets and disposal groups classifi ed as held for sale are measured at the lower of their carrying<br />
amount and fair value less costs to sell. Non-current assets and disposal groups are classifi ed as held for sale<br />
if their carrying amounts will be recovered principally through a sale transaction rather than through continuing use.<br />
This condition is regarded as met only when the sale is highly probable and the asset or disposal group is available<br />
for immediate sale in its present condition. Management must be committed to the sale, which should be expected<br />
to qualify for recognition as a completed sale within one year from the date of classifi cation.<br />
Income and expenses from discontinued operations are reported separately from income and expenses related to<br />
continuing operations, down to the level of profi t after taxes, even when the <strong>Group</strong> retains a non-controlling interest<br />
in the subsidiary after the sale. The resulting profi t or loss (after taxes) is presented separately in the income statement.<br />
Property and equipment and intangible assets once classifi ed as held for sale are not depreciated or amortized.<br />
47
48<br />
NOTES TO THE CONSOLIDATED FINANCIAL STATEMENTS<br />
FOR THE YEARS ENDED 31 DECEMBER 2010 AND 2009<br />
3. CRITICAL ACCOUNTING ESTIMATES AND JUDGMENTS<br />
Estimates and judgments are based on historical experience and other factors, including expectations of future<br />
events that are believed to be reasonable under the circumstances.<br />
The <strong>Group</strong> makes estimates and assumptions concerning the future and exercises judgment in applying its accounting<br />
policies. The resulting accounting estimates will, by defi nition, seldom equal the related actual results. The<br />
estimates and assumptions that have a signifi cant risk of causing a material adjustment to the carrying amounts of<br />
assets and liabilities within the next fi nancial year as well as signifi cant judgments in applying accounting policies<br />
are discussed below.<br />
(a) Income taxes<br />
The <strong>Group</strong> is subject to income taxes in numerous jurisdictions. Some of the <strong>Group</strong>’s entities have losses carried<br />
forward from previous periods on the face of their balance sheet, which may result in a tax deductible in future<br />
periods. Wherever the <strong>Group</strong> is uncertain regarding the future development of such entities and thus the future<br />
utilization of such tax loss carry-forwards is questionable, the <strong>Group</strong> does not recognize corresponding deferred tax<br />
assets. Were all tax loss carry forwards utilizable, the <strong>Group</strong> would recognize an additional deferred tax asset of<br />
<strong>CHF</strong> 0.09 <strong>million</strong> (2009: <strong>CHF</strong> 3.7 <strong>million</strong>). The carrying amounts of deferred income tax assets are disclosed in note<br />
17 (see also note 11).<br />
(b) Derivatives arising from insurance contracts<br />
The <strong>Group</strong> entered into an agreement with Swiss Re to act as policyholder in connection with the insurance of the<br />
extended amount of the convertible bond issued by Pearl Holding Limited (refer to notes 2.11, 13 and 27). As explained,<br />
the <strong>Group</strong> has an exposure to the maximum extent of the value of the assets contained in the corresponding<br />
experience account.<br />
When determining the value of its effective exposure (which may be lower than the aforesaid assets), the <strong>Group</strong> applies<br />
a Black-Scholes model. However, as referred to in note 4.6, some of the parameters are subject to estimation<br />
and may differ from the fi nal result. For further details refer to note 27.<br />
(c) Applying the control concept to the consolidation of entities<br />
As referred to in note 2.2, the <strong>Group</strong> in the course of offering structured products may become the majority or sole<br />
shareholder of certain entities. These entities are managed for a certain period of time, but the <strong>Group</strong> is not the<br />
benefi cial owner of assets contained in these companies; in addition, the <strong>Group</strong>’s management decisions are strictly<br />
limited by separate contracts. Such entities fulfi ll the defi nition of special purpose entities and are accounted for<br />
by applying SIC 12 “Consolidation – Special Purpose Entities”. The same applies to limited partnerships, in which<br />
the <strong>Group</strong> holds only a minor equity interest but acts as the general partner on behalf of the entity’s investors, who<br />
are the limited partners.<br />
As the <strong>Group</strong> in both instances is not subject to the majority of risks and rewards these entities are not consolidated,<br />
but are designated as at fair value through profi t or loss. Whether an investment should be consolidated or not<br />
is carefully evaluated on a case by case basis taking into account the specifi c facts and circumstances.<br />
The carrying amounts of such investments are disclosed in note 15.<br />
(d) Revenue recognition<br />
The <strong>Group</strong> describes its policy of revenue recognition in notes 2.7 and 7. Although the application is straight-forward,<br />
instances may arise where the <strong>Group</strong> has to decide whether a revenue should be recognized or not. This mainly relates<br />
to performance fees, which are foreseeable, but have not yet been distributed to the <strong>Group</strong> or are subject to<br />
claw-back (see note 2.7). As long as distributed performance fees are under a claw-back provision, they are recognized<br />
as deferred income and disclosed separately in note 25.
NOTES TO THE CONSOLIDATED FINANCIAL STATEMENTS<br />
FOR THE YEARS ENDED 31 DECEMBER 2010 AND 2009<br />
(e) Accounting for share-based payment transactions<br />
In 2010 the <strong>Group</strong> has entered into share-based payment transactions with some of its employees, consisting of options<br />
and shares. For further details please refer to note 26. The determination of the value of the options granted<br />
for the services received is measured based on a Black-Scholes model, whereas the determination of the value of<br />
the shares granted for such services is measured by applying the stock price as of grant date. In regard of the option<br />
valuation the <strong>Group</strong> has made assumptions regarding the value of the Company as well as the parameters used<br />
in the Black-Scholes model. Instead of the contractual life of the option, the input to the model is based on the expected<br />
time of execution, taking into account the exercise restriction of the options. Since the Company’s stock has<br />
only been listed since 24 March 2006, the expected fi ve year volatility applied for the options granted in 2010 has<br />
been estimated by comparing the applicable historic volatility of the Company’s stock with the historic volatility of<br />
the MSCI World Index (“MXWO”). Based on this comparison the <strong>Group</strong> applied the respective ratio to the fi ve years<br />
historic volatility of the MXWO to derive the respective expected fi ve year volatility of the Company’s stock.<br />
Although the options and shares granted imply a service period of 5 years, the <strong>Group</strong> already as of grant date<br />
recognizes a sixth of the corresponding amount in the income statement since part of these securities granted are<br />
deemed to form part of the compensation for past services rendered by the benefi ciaries.<br />
The specifi c parameters used for the option as well as share valuation are disclosed in detail in note 26.<br />
(f) Fair value<br />
A signifi cant portion of the <strong>Group</strong>’s assets and liabilities are carried at fair value. The fair value of some of these assets<br />
(including “marketable securities”) is based on quoted prices in active markets or observable inputs.<br />
In addition, the <strong>Group</strong> holds fi nancial instruments for which no prices are available and which have little or no observable<br />
inputs. For these instruments, the determination of fair value requires subjective assessment and varying<br />
degrees of judgment depending on liquidity, concentration, pricing assumptions, the current economic and competitive<br />
environment and the risks affecting the specifi c instrument. In such circumstances, valuation is determined<br />
based on management’s own assumptions about the assumptions that market participants would use in pricing the<br />
asset or liability (including assumption about risk). These instruments include derivatives, private equity, private<br />
debt, private real estate and private infrastructure investments as well as other assets.<br />
The <strong>Group</strong> applies control processes to ensure that the fair value of the fi nancial instruments reported in the consolidated<br />
fi nancial statements, including those derived from pricing models, are appropriate and determined on a reasonable<br />
basis.<br />
These control processes include the review and approval of new investments, review of profi t and loss at regular intervals,<br />
risk monitoring and review, price verifi cation procedures and reviews of models used to estimate the fair<br />
value of fi nancial instruments by senior management and personnel with relevant expertise who are independent of<br />
the trading and investment functions.<br />
49
50<br />
NOTES TO THE CONSOLIDATED FINANCIAL STATEMENTS<br />
FOR THE YEARS ENDED 31 DECEMBER 2010 AND 2009<br />
4. FINANCIAL RISK MANAGEMENT<br />
4.1 Overview<br />
The <strong>Group</strong> has exposure to the following risks from its use of fi nancial instruments:<br />
– credit risk<br />
– liquidity risk<br />
– market risk<br />
This note presents information about the <strong>Group</strong>’s exposure to each of the above risks, the <strong>Group</strong>’s objectives, policies<br />
and processes for measuring and managing risk, and the <strong>Group</strong>’s management of capital. Further quantitative<br />
disclosures are included throughout these consolidated fi nancial statements.<br />
The Board of Directors has overall responsibility for the establishment and oversight of the <strong>Group</strong>’s risk management<br />
framework. The Board has established the Risk and Audit Committee, which is responsible for the developing<br />
and monitoring of the <strong>Group</strong>’s risk management policies. The committee reports regularly to the Board of Directors<br />
on its activities.<br />
The <strong>Group</strong>’s risk management policies are established to identify and analyze the risks faced by the <strong>Group</strong>, to set<br />
appropriate risk limits and controls, and to monitor risks and adherence to limits. Risk management policies and<br />
systems are reviewed regularly to refl ect changes in the market conditions and the <strong>Group</strong>’s activities. The <strong>Group</strong>,<br />
through its training and management standards and procedures, aims to develop a disciplined and constructive control<br />
environment in which all employees understand their roles and obligations.<br />
The <strong>Group</strong>’s Risk and Audit Committee oversees how management monitors compliance with the <strong>Group</strong>’s risk management<br />
policies and procedures and reviews the adequacy of the risk management framework in relation to the<br />
risks faced by the <strong>Group</strong>. The <strong>Group</strong>’s Risk and Audit Committee is assisted in its oversight role by internal audit.<br />
Internal audit undertakes both regular and ad-hoc reviews of risk management controls and procedures, the results<br />
of which are reported to the <strong>Group</strong>’s Risk and Audit Committee.<br />
4.2 Credit risk<br />
Credit risk is the risk of fi nancial loss to the <strong>Group</strong> if a customer or counterparty to fi nancial instruments fails to<br />
meet its contractual obligations, and arises principally from the <strong>Group</strong>’s receivables from customers and investment<br />
securities.<br />
(a) Trade and other receivables<br />
The <strong>Group</strong>’s exposure to credit risk is infl uenced mainly by the individual characteristics of each customer. The demographics<br />
of the <strong>Group</strong>’s customer base, including the default risk of the industry and country in which customers<br />
operate has less of an infl uence on credit risk.<br />
The <strong>Group</strong>’s counterparties are mostly regulated fi nancial institutions or institutional investors with a high credit<br />
quality. In addition the <strong>Group</strong> periodically reviews the client exposure and concentration. There is no substantial<br />
concentration of credit risk.<br />
The <strong>Group</strong> has never suffered from any material loss from its trade and other receivables; no allowance for individual<br />
exposures or a collective loss allowance is currently established.<br />
(b) Other<br />
The <strong>Group</strong>’s other credit risk arises from cash and cash equivalents, derivative fi nancial instruments, loans, other<br />
fi nancial assets (represents mainly restricted cash investments) and deposits with banks. The surplus cash (see note<br />
4.3) is transferred to the <strong>Group</strong>’s holding company for cash pooling. For these bank deposits only independently<br />
rated parties with a minimum rating of “A” are accepted.
NOTES TO THE CONSOLIDATED FINANCIAL STATEMENTS<br />
FOR THE YEARS ENDED 31 DECEMBER 2010 AND 2009<br />
The carrying amount of fi nancial assets represents the maximum credit exposure. The maximum exposure to credit<br />
risk at the reporting date was:<br />
Carrying amount<br />
In thousands of Swiss francs 2010 2009 1)<br />
Other fi nancial assets 88’502 100’638<br />
Loans 116’569 119’088<br />
Trade receivables 40’093 38’659<br />
Other receivables 1’391 3’389<br />
Marketable securities – 72<br />
Cash and cash equivalents 226’566 169’676<br />
Forward exchange contracts (derivative assets) 22’724 5’279<br />
495’845 436’801<br />
Positions included in balance sheet, but not subject to credit risk:<br />
Other receivables (VAT etc.) 839 316<br />
Marketable securities (equity securities) 488 10’098<br />
Cash and cash equivalents (petty cash) 6 6<br />
Prepaid expenses 2’636 2’077<br />
Split of trade receivables into counterparty risk categories:<br />
– invoiced to clients 10’080 12’351<br />
– to be collected by <strong>Group</strong> through management contracts 30’013 26’308<br />
40’093 38’659<br />
1) Presentation amended to be consistent with 2010 disclosures<br />
4.3 Liquidity risk<br />
Liquidity risk is the risk that the <strong>Group</strong> will not be able to meet its fi nancial obligations as they fall due. The <strong>Group</strong>’s<br />
approach to manage liquidity is to ensure, as far as possible, that it will always have suffi cient liquidity to meet its<br />
liabilities when due, under both normal and stressed conditions, without incurring unacceptable losses or risking<br />
damage to the <strong>Group</strong>’s reputation.<br />
In order to assess the development of its liquidity the <strong>Group</strong> uses a tool which is integrated in the budgeting and reporting<br />
process, assisting in monitoring cash fl ow requirements and optimizing its cash return on investments. Cash<br />
fl ow forecasting is performed on an overall level by the <strong>Group</strong>. Typically the <strong>Group</strong> ensures that it has suffi cient cash<br />
on demand to meet expected operational expenses, including the servicing of fi nancial obligations; this excludes the<br />
potential impact of extreme circumstances that cannot reasonably be predicted. Surplus cash held by the operating<br />
entities, over and above the balance required for working capital management, are transferred to the <strong>Group</strong>’s holding<br />
company. The <strong>Group</strong> invests surplus cash in interest bearing current accounts, time deposits, money market deposits<br />
and marketable securities, choosing instruments with appropriate maturities or suffi cient liquidity to provide<br />
suffi cient head-room as determined by the above mentioned forecasts. In addition, the <strong>Group</strong> maintains the following<br />
lines of credit:<br />
– An overall facility of <strong>CHF</strong> 50 <strong>million</strong> that can be used as follows:<br />
– <strong>CHF</strong> 30 <strong>million</strong> overdraft facility that is unsecured and can be used as current account overdrafts or as fi xed<br />
advances with a maturity of up to six months. Interest would be payable at current market rates.<br />
– <strong>CHF</strong> 50 <strong>million</strong> contingent commitments such as security guarantees and deposits.<br />
– <strong>CHF</strong> 50 <strong>million</strong> as margin for over-the-counter trades (used mainly for foreign exchange trading purposes)<br />
with a maturity of up to 12 months.<br />
51
52<br />
NOTES TO THE CONSOLIDATED FINANCIAL STATEMENTS<br />
FOR THE YEARS ENDED 31 DECEMBER 2010 AND 2009<br />
The debt covenants include a negative pledge clause. The debt covenants have been met throughout the current<br />
and prior period. The overall facility is currently used for rental deposits and for the margins for forward exchange<br />
contracts.<br />
The following are the fi nancial liabilities (including estimated interest) with their expected maturities:<br />
In thousands of Swiss francs 2010<br />
Carrying 6 months 6 – 12 1 – 2 2 – 5 More than<br />
amount or less months years years 5 years<br />
Trade payables 14’797 14’797<br />
Unfunded commitments 72’814 24’271 24’271 24’272<br />
87’611 14’797 24’271 24’271 24’272 –<br />
Positions included in balance sheet, but not<br />
subject to liquidity risk:<br />
Other current liabilities<br />
(VAT, social security liabilities, etc.)<br />
Accrued expenses (bonus accruals, deferred income,<br />
12’113 12’113<br />
etc.) 35’212 35’212<br />
Derivatives arising from insurance contracts 84’588 84’588<br />
In thousands of Swiss francs 2009 1)<br />
Carrying<br />
amount<br />
6 months<br />
or less<br />
6 – 12<br />
months<br />
1 – 2<br />
years<br />
2 – 5<br />
years<br />
More than<br />
5 years<br />
Trade payables 18’446 18’446<br />
Accrued expenses 202 202<br />
Unfunded commitments 81’526 20’382 20’382 40’762<br />
100’174 18’648 20’382 20’382 40’762 –<br />
Positions included in balance sheet, but not<br />
subject to liquidity risk:<br />
Other current liabilities<br />
(VAT, social security liabilities, etc.) 7’898 7’898<br />
Accrued expenses 37’191 37’191<br />
Derivatives arising from insurance contracts 96’618 96’618<br />
1) Presentation amended to be consistent with 2010 disclosures
NOTES TO THE CONSOLIDATED FINANCIAL STATEMENTS<br />
FOR THE YEARS ENDED 31 DECEMBER 2010 AND 2009<br />
4.4 Market risk<br />
Market risk is the risk that changes in market prices, such as foreign exchange rates, interest rates and equity prices<br />
will affect the <strong>Group</strong>’s income or the value of its holdings of fi nancial instruments. The objective of market risk<br />
management is to manage and control market risk exposures within acceptable parameters, while optimizing the<br />
return.<br />
The <strong>Group</strong> buys and sells derivatives, and also incurs fi nancial liabilities, in order to manage market risks. All such<br />
transactions are carried out within the guidelines defi ned within the rules of the organization and of operations<br />
(“ROO”), issued by the BoD.<br />
(a) Currency risk<br />
The <strong>Group</strong> is exposed to currency risk on revenues, purchases, expenses and borrowings that are denominated in a<br />
currency other than the respective functional currencies of <strong>Group</strong> entities, primarily the Euro (EUR), but also US<br />
Dollar (USD), Sterling (GBP) and Singapore Dollar (SGD).<br />
As a general guidance the <strong>Group</strong> economically hedges between 50% to 85% of its estimated future foreign currency<br />
exposure of the main currencies (i.e. EUR, USD, GBP, and SGD) in respect of forecast revenues, expenses and purchases<br />
over the following twelve months. The respective economic hedging ratio for each of the main currencies is<br />
reviewed and determined on a quarterly basis. The <strong>Group</strong> uses forward exchange contracts to economically hedge<br />
its currency risk, with a maturity of maximum one year from the reporting date. On a case by case basis the <strong>Group</strong><br />
may also economically hedge recognized assets and liabilities in foreign currencies.<br />
On a quarterly basis the <strong>Group</strong> reviews the estimated future foreign currency exposure, which is subject to changes<br />
due to the actual development of its revenues and expenses and adjusts its derivative contracts accordingly to refl<br />
ect the changes in the foreign currency exposure.<br />
53
54<br />
NOTES TO THE CONSOLIDATED FINANCIAL STATEMENTS<br />
FOR THE YEARS ENDED 31 DECEMBER 2010 AND 2009<br />
The table below shows the <strong>Group</strong>’s exposure to foreign currency risk (before elimination of intercompany balances,<br />
based on the balance sheets in local currencies of all the group entities and withouth considering the impact of the<br />
forward exchange contracts):<br />
In thousands of Swiss francs 2010<br />
<strong>CHF</strong> EUR USD GBP SGD<br />
Other fi nancial assets – – 1’373 – –<br />
Prepaid expenses and loans – 92’693 23’899 – –<br />
Trade receivables 338 40’652 6’813 56 –<br />
Other receivables – – 10’656 12’196 – 11’689 – 3’507<br />
Cash and cash equivalents 43 3’799 1’605 134 48<br />
Trade payables – 17 – 934 – 643 – –<br />
Accrued expenses – 16 – 3’566 – 472 – –<br />
Forward exchange contracts 16’080 7’105 – 264 – 196<br />
Total 348 138’068 51’876 – 11’763 – 3’655<br />
In thousands of Swiss francs 2009<br />
<strong>CHF</strong> EUR USD GBP SGD<br />
Other fi nancial assets – – 1’277 – –<br />
Prepaid expenses and loans – 104’517 14’762 71 –<br />
Trade receivables – 50’735 11’093 206 –<br />
Other receivables 4 – 24’137 10’249 9’800 – 1’750<br />
Marketable securities – 72 – – –<br />
Cash and cash equivalents 12 9’988 1’199 2’557 9<br />
Trade payables – 311 – 3’904 – 470 – 2 –<br />
Accrued expenses – – 4’279 – 824 – 78 –<br />
Forward exchange contracts 2’762 2’592 – 51 – 24<br />
Total – 295 135’754 39’878 12’503 – 1’765
NOTES TO THE CONSOLIDATED FINANCIAL STATEMENTS<br />
FOR THE YEARS ENDED 31 DECEMBER 2010 AND 2009<br />
Sensitivity analysis<br />
In order to analyze the impact of the currency fl uctuations on the profi t or loss respectively the equity of the <strong>Group</strong>,<br />
the <strong>Group</strong> has applied the given volatility for the individual currency pairs (i.e. <strong>CHF</strong>/EUR) in the respective reporting<br />
periods. This analysis assumes that all other variables, in particular interest rates, remain constant (e.g. the <strong>Group</strong><br />
examined the effect of an increase of the EUR against the <strong>CHF</strong> of 7.90% (2009: 5.63%), calculating the corresponding<br />
effect).<br />
Volatilities 2010 2009<br />
<strong>CHF</strong>/EUR 7.90% 5.63%<br />
<strong>CHF</strong>/USD 10.32% 12.05%<br />
<strong>CHF</strong>/GBP 10.74% 13.40%<br />
<strong>CHF</strong>/SGD 9.20% 10.10%<br />
EUR/USD 11.47% 11.73%<br />
EUR/GBP 9.33% 12.05%<br />
EUR/SGD 8.65% 8.39%<br />
USD/GBP 9.75% 13.41%<br />
USD/SGD 5.84% 5.86%<br />
GBP/SGD 8.05% 11.35%<br />
Profi t or loss<br />
Effect in thousands of <strong>CHF</strong> 2010 2009<br />
<strong>CHF</strong>/EUR – 16’919 – 8’684<br />
<strong>CHF</strong>/USD – 10’177 – 11’056<br />
<strong>CHF</strong>/GBP – 1’025 1’894<br />
<strong>CHF</strong>/SGD 342 430<br />
EUR/USD 407 397<br />
EUR/GBP 538 999<br />
USD/GBP 85 458<br />
Total – 26’749 – 15’562<br />
The above sensitivity analysis is based on the local balance sheet positions in the group entities, but taking into account<br />
the forward exchange contracts for the expected future revenue streams in foreign currencies.<br />
55
56<br />
NOTES TO THE CONSOLIDATED FINANCIAL STATEMENTS<br />
FOR THE YEARS ENDED 31 DECEMBER 2010 AND 2009<br />
Forward exchange contracts<br />
As of the balance sheet date the <strong>Group</strong> has no outstanding derivative instruments for which it applied hedge accounting.<br />
While it continues to economically hedge its future revenue streams in foreign currencies the effect of the revaluation<br />
of these contracts is directly recognized in profi t or loss.<br />
The net fair value of forward exchange contracts at the balance sheet date amounted to <strong>CHF</strong> 22.7 <strong>million</strong> with an<br />
outstanding volume of <strong>CHF</strong> 478 <strong>million</strong> (2009: <strong>CHF</strong> 5.3 <strong>million</strong>; volume <strong>CHF</strong> 393 <strong>million</strong>).<br />
(b) Interest rate risk<br />
The <strong>Group</strong>’s income and operating cash fl ows are substantially independent of changes in market interest rates. The<br />
<strong>Group</strong> is mainly exposed to cash fl ow interest rate risk with respect to its bank balances as well as its investment<br />
into the Pearl Experience Account, disclosed as other fi nancial assets (see note 16). Such cash fl ows are dependent<br />
on changes in short-term market interest rates. Currently, the <strong>Group</strong> does not manage its cash fl ow interest rate<br />
risk actively.<br />
As of the balance sheet date the <strong>Group</strong> has not entered into any borrowings with banks.<br />
At the reporting date the interest rate profi le of the <strong>Group</strong>’s interest-bearing fi nancial instruments was:<br />
In thousands of Swiss francs 2010 2009 1)<br />
Variable rate instruments<br />
Financial assets 311’154 266’295<br />
Financial liabilities – –<br />
311’154 266’295<br />
Fixed rate instruments<br />
Financial assets 120’483 123’180<br />
Financial liabilities – –<br />
1) Presentation amended to be consistent with 2010 disclosures<br />
120’483 123’180<br />
The <strong>Group</strong> does not designate any fi xed rate fi nancial assets or liabilities as at fair value through profi t or loss or as<br />
available-for-sale. Therefore changes in interest rates of fi xed rate instruments would not affect profi t or loss and<br />
equity.<br />
Cash fl ow sensitivity analysis for variable rate instruments<br />
A change of 50 basis points in interest rates at the reporting date would have increased (decreased) profi t or loss<br />
by the amounts shown below. This analysis assumes that all other variables, in particular foreign currency rates, remain<br />
constant. The analysis is performed on the same basis as for the previous year.<br />
Variable rate instruments<br />
In thousands of Swiss francs 2010 2009<br />
Profi t or loss<br />
50 bp increase 1’556 1’331<br />
50 bp decrease – 1’556 – 1’331
NOTES TO THE CONSOLIDATED FINANCIAL STATEMENTS<br />
FOR THE YEARS ENDED 31 DECEMBER 2010 AND 2009<br />
(c) Price risk<br />
The <strong>Group</strong> is exposed to equity securities price risk because of investments held by the <strong>Group</strong> and classifi ed on the<br />
consolidated balance sheet at fair value through profi t or loss. The <strong>Group</strong> is not exposed to commodity price risk.<br />
The majority of such investments are performed under existing investment management contracts whereby the<br />
<strong>Group</strong> invests alongside its investors in the private equity, private debt, private real estate or private infrastructure<br />
vehicles managed by the <strong>Group</strong>.<br />
In assessing the price risk associated with the <strong>Group</strong>’s investments, it applied a volatility ratio to each of its investments<br />
classifi ed as marketable securities or other investments. The <strong>Group</strong> used long-term data (at least 5 years) to<br />
assess the volatilities for each asset class. Based on the size of the investment as a proportion of the overall investment<br />
in the relevant asset class, the <strong>Group</strong> then calculated a weighted volatility for the respective asset class, summarized<br />
below:<br />
Carrying amount / volatility<br />
In thousands of Swiss francs 2010 Volatility 2009 Volatility<br />
Marketable securities<br />
Other investments:<br />
488 24% 10’098 20%<br />
– Private equity 111’339 15% 73’912 17%<br />
– Private debt 14’061 8% 12’238 8%<br />
– Private real estate 6’044 13% 2’390 13%<br />
– Other segments 49’036 11% 36’332 6%<br />
Total 180’968 134’970<br />
Based on the applied long-term volatility for the individual asset classes the <strong>Group</strong> is exposed to the following equity<br />
price risk:<br />
Profi t or loss<br />
In thousands of Swiss francs 2010 2009<br />
Marketable securities<br />
Other investments:<br />
118 2’043<br />
– Private equity 16’998 12’386<br />
– Private debt 1’087 932<br />
– Private real estate 768 319<br />
– Other segments 5’384 2’340<br />
Total 24’355 18’020<br />
57
58<br />
NOTES TO THE CONSOLIDATED FINANCIAL STATEMENTS<br />
FOR THE YEARS ENDED 31 DECEMBER 2010 AND 2009<br />
4.5 Capital management<br />
The BoD’s policy is to maintain a strong capital base so as to maintain investor, creditor and market confi dence and<br />
to sustain a future development of the business. The BoD monitors the level of dividends to ordinary shareholders.<br />
The BoD’s target is that each employee of the <strong>Group</strong> holds shares of the Company.<br />
From time to time the <strong>Group</strong> purchases its own shares on the market; the timing of these purchases depends on<br />
the market price. Primarily the shares are intended to be used for issuing shares/covering options under the <strong>Group</strong>’s<br />
share and option programs. Buy and sell decisions are made within the limits defi ned by the <strong>Group</strong>, however the<br />
BoD reviews the transactions quarterly. The <strong>Group</strong> does not have a defi ned share buy-back plan; however the annual<br />
general meeting of shareholders on 6 May 2010 approved the establishment of a second trading line at the SIX<br />
Swiss Exchange for the potential repurchase of up to 10% of the shares of the Company during the three year period<br />
to May 2013.<br />
There were no changes in the <strong>Group</strong>’s approach to capital management during the year.<br />
The <strong>Group</strong> or some of its subsidiaries are subject to the following externally imposed capital requirements:<br />
– The Financial Services Authority (FSA) requires that <strong>Partners</strong> <strong>Group</strong> (UK) Limited maintained GBP 1.0 <strong>million</strong><br />
minimum capital as of 31 December 2010 (2009: GBP 0.7 <strong>million</strong>)<br />
– The Guernsey Financial Services Commission requires that <strong>Partners</strong> <strong>Group</strong> (Guernsey) Limited maintained net<br />
assets of 25% of annual audited expenditure subject to a minimum of GBP 100’000 (2009: GBP 25’000) and that<br />
the other relevant Guernsey based <strong>Group</strong> entities maintained net assets of 25% of annual audited expenditure<br />
subject to a minimum of GBP 10’000 as of 31 December 2010<br />
– Article 1982 of the Law of 10th August 1915 on commercial companies requires that <strong>Partners</strong> <strong>Group</strong> (Luxembourg)<br />
S.àr.l., <strong>Partners</strong> <strong>Group</strong> Management I S.àr.l. and <strong>Partners</strong> <strong>Group</strong> Management II S.àr.l. maintain EUR<br />
12’395 minimum corporate capital as of 31 December 2010 (2009: EUR 12’395).<br />
All these capital requirements have been met during 2010.
NOTES TO THE CONSOLIDATED FINANCIAL STATEMENTS<br />
FOR THE YEARS ENDED 31 DECEMBER 2010 AND 2009<br />
4.6 Fair value estimation<br />
The <strong>Group</strong> measures fair values using the following fair value hierarchy that refl ects the signifi cance of the inputs<br />
used in making the measurements:<br />
– Quoted prices (unadjusted) in active markets for identical assets or liabilities (level 1)<br />
– Inputs other than quoted prices included within level 1 that are observable for the asset or liabilities, either directly<br />
(that is, as prices) or indirectly (that is, derived from prices) (level 2)<br />
– Inputs for the asset or liability that are not based on observable market data (that is, unobservable inputs)<br />
(level 3)<br />
The fair value of fi nancial instruments traded in active markets is based on quoted market prices at the balance<br />
sheet date. A market is regarded as active if quoted prices are readily and regularly available from an exchange and<br />
those prices represent actual and regularly occurring market transactions on an arm’s length basis. The quoted<br />
market price used for fi nancial assets held by the <strong>Group</strong> is the current bid price, the appropriate quoted market<br />
price for fi nancial liabilities is the current ask price; these instruments are included in level 1.<br />
The fair value of fi nancial instruments that are not traded in an active market (for example over the counter derivatives)<br />
is determined by using valuation techniques. These valuation techniques maximize the use of observable<br />
market data where it is available and rely as little as possible on entity specifi c estimates. If all signifi cant inputs required<br />
to fair value an instrument are observable, the instrument is included in level 2.<br />
If one or more of the signifi cant inputs is not based on observable market data the instrument is included in level 3.<br />
Specifi c valuation techniques used to value fi nancial instruments include:<br />
– Quoted market prices or dealer quotes for similar instruments<br />
– The fair value of forward foreign exchange contracts is determined using forward exchange market rates at the<br />
balance sheet date<br />
– Other techniques, such as discounted cash fl ow or multiple analysis are used to determine fair value for the remaining<br />
fi nancial instruments<br />
– The nominal value less estimated credit adjustments of trade receivables is assumed to approximate their fair<br />
values.<br />
The factors and assumptions for the determination of the fair value of derivatives arising from insurance contracts<br />
are described in note 27.<br />
Note that the majority of the <strong>Group</strong>’s fi nancial instruments are included in level 3.<br />
59
60<br />
NOTES TO THE CONSOLIDATED FINANCIAL STATEMENTS<br />
FOR THE YEARS ENDED 31 DECEMBER 2010 AND 2009<br />
In thousands of Swiss francs 2010<br />
Level 1 Level 2 Level 3 Total<br />
Other investments 10’149 170’331 180’480<br />
Marketable securities 488 488<br />
Derivative assets held for risk management 22’724 22’724<br />
10’637 22’724 170’331 203’692<br />
Derivatives arising from insurance contracts 84’588 84’588<br />
Derivative liabilities held for risk management – –<br />
– 84’588 – 84’588<br />
In thousands of Swiss francs 2009<br />
Level 1 Level 2 Level 3 Total<br />
Other investments 124’872 124’872<br />
Marketable securities 10’170 10’170<br />
Derivative assets held for risk management 5’279 5’279<br />
10’170 5’279 124’872 140’321<br />
Derivatives arising from insurance contracts 96’618 96’618<br />
Derivative liabilities held for risk management – –<br />
– 96’618 – 96’618<br />
The <strong>Group</strong> classifi es the majority of the “other investments” as level 3 investments. No other fi nancial instruments<br />
are classifi ed as level 3 investments and no other fi nancial instruments have been transferred into or out of level 3<br />
during the reporting period. Therefore please refer to the disclosures in note 15 for reconciliation from the beginning<br />
balances to the ending balances for fair value measurements in level 3 of the fair value hierarchy as well as the<br />
gains and losses that were recognized in profi t or loss. All gains and losses on “other investments” are attributable<br />
to investments that are held at the end of the reporting period.<br />
Although the <strong>Group</strong> believes that its estimates of fair value are appropriate, the use of different methodologies or<br />
assumptions could lead to different measurements of fair value. For fair value measurements in level 3 of the fair<br />
value hierarchy, the <strong>Group</strong> believes that by changing the weighted volatility (as the unobservable input) best refl<br />
ects the possible effects on profi t or loss for the “other investments”. Please refer to note 4.4.(c) for the (equity<br />
price risk) effects based on the weighted volatility.
NOTES TO THE CONSOLIDATED FINANCIAL STATEMENTS<br />
FOR THE YEARS ENDED 31 DECEMBER 2010 AND 2009<br />
4.7 Financial instruments by category<br />
The <strong>Group</strong>’s fi nancial instruments can be classifi ed into the respective categories as follows:<br />
In thousands of Swiss francs 2010 2009 1)<br />
Financial assets<br />
Financial assets at fair value through profi t or loss<br />
Designated upon initial recognition<br />
Other investments 180’480 124’872<br />
Other fi nancial assets 84’588 96’618<br />
Held for trading<br />
265’068 221’490<br />
Marketable securities 488 10’170<br />
Derivative assets (forward exchange contracts) 22’724 5’279<br />
23’212 15’449<br />
Loans and receivables<br />
Trade receivables 40’093 38’659<br />
Other receivables 2’230 3’705<br />
Loans 116’569 119’088<br />
Other fi nancial assets 3’914 4’020<br />
162’806 165’472<br />
Cash and cash equivalents<br />
Cash and cash equivalents 226’572 169’682<br />
226’572 169’682<br />
Total fi nancial assets 677’658 572’093<br />
Financial liabilities<br />
Financial liabilities at fair value through profi t or loss<br />
Derivatives arising from insurance contracts 84’588 96’618<br />
84’588 96’618<br />
Financial liabilities measured at amortized cost<br />
Trade payables 14’797 18’446<br />
14’797 18’446<br />
Total fi nancial liabilities 99’385 115’064<br />
1) Presentation amended to be consistent with 2010 disclosures<br />
61
62<br />
NOTES TO THE CONSOLIDATED FINANCIAL STATEMENTS<br />
FOR THE YEARS ENDED 31 DECEMBER 2010 AND 2009<br />
5. CHANGES IN SCOPE OF CONSOLIDATION<br />
(a) Incorporation of new <strong>Group</strong> entities<br />
– On 17 December 2010 the <strong>Group</strong> incorporated <strong>Partners</strong> <strong>Group</strong> Management (Scots) LLP, Scotland. The entity’s<br />
main purpose is to serve as investment manager/general partner for Scotland based investment vehicles.<br />
– On 1 March 2010 the <strong>Group</strong> incorporated Alternative Beta <strong>Partners</strong> AG, Switzerland. The entity’s main purpose is<br />
to serve as investment manager/adviser for alternative beta strategies and insurance linked securities and absolute<br />
return strategies. The <strong>Group</strong> holds an investment of 55% into the new and fully consolidated group entity.<br />
– On 11 December 2009 the <strong>Group</strong> incorporated <strong>Partners</strong> <strong>Group</strong> US Management LLC, Delaware (USA). The entity’s<br />
main purpose is to serve as investment manager/general partner for US based investment vehicles.<br />
– On 1 April 2009 the <strong>Group</strong> incorporated <strong>Partners</strong> <strong>Group</strong> Management XI Limited, Guernsey. The entity’s main<br />
purpose is to serve as investment manager/general partner for Scotland based investment vehicles.<br />
The effect of these formations on the <strong>Group</strong>’s consolidated fi nancial statements is not material.<br />
(b) Restructurings<br />
No restructurings took place during the reporting period.<br />
(c) Acquisition of subsidiaries<br />
The <strong>Group</strong> did not acquire additional subsidiaries in 2010 and 2009.<br />
(d) Disposal of subsidiaries<br />
On 5 March 2010 the <strong>Group</strong> sold <strong>Partners</strong> <strong>Group</strong> Fund Services Limited, Guernsey, to a third party for an amount of<br />
USD 1.3 <strong>million</strong> (<strong>CHF</strong> 1.4 <strong>million</strong>) in cash plus potential earn-out payments with effect from 1 January 2010. The<br />
sale of this previously fully consolidated <strong>Group</strong> company results in a profi t before tax of USD 1.0 <strong>million</strong> (<strong>CHF</strong> 1.0<br />
<strong>million</strong>) in the consolidated fi nancial statements and in proceeds net of cash and cash equivalents of USD 1.3 millon<br />
(<strong>CHF</strong> 1.3 <strong>million</strong>). <strong>Partners</strong> <strong>Group</strong> Fund Services Limited achieved a profi t of USD 1.1 <strong>million</strong> (<strong>CHF</strong> 1.2 <strong>million</strong>) for<br />
the twelve months ended 31 December 2009. As of the effective date, the balance sheet of <strong>Partners</strong> <strong>Group</strong> Fund<br />
Services Limited consisted of the following items (in thousands of USD):<br />
– Cash and cash equivalents 37<br />
– Other current assets 1’994<br />
– Current liabilities 1’738<br />
– Equity 293
NOTES TO THE CONSOLIDATED FINANCIAL STATEMENTS<br />
FOR THE YEARS ENDED 31 DECEMBER 2010 AND 2009<br />
6. SEGMENT INFORMATION<br />
The chief operating decision-maker (CODM) has been identifi ed as the BoD. The BoD reviews the <strong>Group</strong>’s internal<br />
reporting in order to assess performance and allocate resources. Management has determined the operating segments<br />
based on these reports.<br />
The BoD considers the business from a business line perspective. This results in an identifi cation of the following operating<br />
segments:<br />
– Private equity<br />
– Private debt<br />
– Private real estate<br />
– All other segments<br />
In these business lines the <strong>Group</strong> services its clientele with investment advisory and management services in the<br />
private markets spectrum, comprising structuring and investment advising as relates to investments in third party<br />
managed vehicles and direct investments in operating companies or assets, typically alongside specialized managers.<br />
In its advisory and management services, the <strong>Group</strong> offers diversifi ed as well as more focused investment programs<br />
as relates to investment styles, industry and geography of the investments in private markets. The majority<br />
of the investments are situated in the United States of America, Europe or Asia.<br />
Private equity<br />
Private equity refers to investments made in private – i.e. not publicly traded – companies. Private equity investments<br />
are characterized according to fi nancing stage, which refers to the stage of development of a company at the<br />
point of investment. Each fi nancing stage carries distinct risk, return and correlation characteristics. Accordingly,<br />
each fi nancing stage can play a different role within a diversifi ed private equity portfolio. <strong>Partners</strong> <strong>Group</strong> covers the<br />
full range of opportunities offered by this type of investment, from investments in venture and growth capital to<br />
buyouts and restructuring as well as other special situations opportunities.<br />
Private debt<br />
Private debt refers to debt fi nancing for private – i.e. not publicly traded – corporations or large projects. Private<br />
debt allows investors to access investment opportunities that are not available in the public corporate bond market.<br />
<strong>Partners</strong> <strong>Group</strong> mainly invests in subordinated debt associated with buyout transactions (mezzanine or second lien).<br />
Mezzanine directs are a direct infusion of capital into selected companies within the framework of corporate takeovers.<br />
Private real estate<br />
Private real estate refers to investments made in private – i.e. not publicly traded – real estate assets. Within this<br />
sector, there is a wide range of investment opportunities, from housing complexes and offi ce space to shopping<br />
centers and industrial buildings.<br />
All other segments<br />
All other segments include the <strong>Group</strong>’s private infrastructure activities and revenues from affi liated companies with<br />
activities in alternative beta strategies and private wealth management activities. None of these segments meet any<br />
of the quantitative thresholds for determining reportable segments in 2010 or 2009.<br />
The activities in all operating segments consist of:<br />
– Strategic asset allocation and portfolio management<br />
– Investment management and monitoring<br />
– Risk management<br />
– Reporting and portfolio administration<br />
– Relationship management<br />
– etc.<br />
63
64<br />
NOTES TO THE CONSOLIDATED FINANCIAL STATEMENTS<br />
FOR THE YEARS ENDED 31 DECEMBER 2010 AND 2009<br />
6. SEGMENT INFORMATION (CONTINUED)<br />
The BoD assesses the performance of the operating segments based on a segment result, determined from the allocation<br />
of directly attributable revenues and expenses for the respective operating segment. Therefore this result per<br />
operating segment does not include allocation of expenses which are not directly attributable, such as overhead and<br />
general operating expenses etc. All not directly attributable elements of the income statement are summarized in<br />
the “unallocated” column.<br />
Management believes that this reporting is most relevant in evaluating the results of its segments.<br />
The <strong>Group</strong> discloses no inter-segment transactions, as there are none; consequently no eliminations are necessary.<br />
In thousands of Swiss francs 2010<br />
Private Private Private All other Unallo-<br />
equity debt real estate segments cated Total<br />
Revenues from management and advisory services,<br />
net 273’006 42’890 35’323 21’333 – 372’552<br />
Share of results of associates 3’650 – – – – 3’650<br />
Net revenues 276’656 42’890 35’323 21’333 – 376’202<br />
Third party services – 428 – – 168 – 285 – 5’001 – 5’882<br />
Personnel expenses – 19’291 – 4’256 – 5’748 – 7’937 – 60’472 – 97’704<br />
General and administrative expenses – 207 – 86 – 30 – 167 – 13’779 – 14’269<br />
Marketing and representation expenses – 1’438 – 261 – 867 – 463 – 5’558 – 8’587<br />
Depreciation and amortization – 7’624 – 7’624<br />
Gross segment result 255’292 38’287 28’510 12’481 – 92’434 242’136<br />
Reconciliation to income statement:<br />
Change in fair value of derivatives arising from<br />
insurance contracts – 3’436<br />
Net fi nance income and expense 78’328<br />
Income tax expense – 20’493<br />
Net profi t for the period 296’535
NOTES TO THE CONSOLIDATED FINANCIAL STATEMENTS<br />
FOR THE YEARS ENDED 31 DECEMBER 2010 AND 2009<br />
6. SEGMENT INFORMATION (CONTINUED)<br />
In thousands of Swiss francs 2009<br />
Private<br />
equity<br />
Private Private<br />
debt real estate<br />
All other<br />
segments<br />
Unallocated<br />
Total<br />
Revenues from management and advisory services,<br />
net 264’201 27’190 14’001 16’389 321’781<br />
Share of results of associates 2’942 – – – – 2’942<br />
Net revenues 267’143 27’190 14’001 16’389 – 324’723<br />
Third party services – 880 – 103 – 134 – 2’082 – 1’842 – 5’041<br />
Personnel expenses – 22’930 – 5’036 – 5’747 – 11’801 – 28’178 – 73’692<br />
General and administrative expenses – 226 – 118 – 40 – 148 – 11’544 – 12’076<br />
Marketing and representation expenses – 841 – 222 – 703 – 573 – 4’394 – 6’733<br />
Depreciation and amortization – 5’342 – 5’342<br />
Gross segment result 242’266 21’711 7’377 1’785 – 51’300 221’839<br />
Reconciliation to income statement:<br />
Change in fair value of derivatives arising from<br />
insurance contracts – 5’580<br />
Net fi nance income and expense 866<br />
Income tax expense – 12’253<br />
Net profi t for the period 204’872<br />
As <strong>Partners</strong> <strong>Group</strong> pursues a fully integrated investment approach, most professionals engage in assignments<br />
across several segments within the private markets asset class. Thus only those few professionals entirely dedicated<br />
to a single segment have been allocated to the various segments, leading to the majority of personnel expenses being<br />
unallocated. The same applies to third party services, general and administrative expenses, marketing and representation<br />
expenses, as well as depreciation and amortization.<br />
65
66<br />
NOTES TO THE CONSOLIDATED FINANCIAL STATEMENTS<br />
FOR THE YEARS ENDED 31 DECEMBER 2010 AND 2009<br />
6. SEGMENT INFORMATION (CONTINUED)<br />
Geographical information<br />
The segments are managed on a worldwide basis with Guernsey as a general management hub. However, advisory<br />
services are provided from Switzerland whereas local offi ces ensure the access to worldwide markets. In presenting<br />
information on the basis of geographical segments, segment revenue is based on the geographical location where<br />
the respective revenues are accounted for; i.e. in which locations the revenues are shown in the <strong>Group</strong>’s entities’ fi -<br />
nancial statements.<br />
In thousands of Swiss francs<br />
Net revenues<br />
2010 2009<br />
Switzerland 161’649 132’671<br />
Guernsey 146’009 160’304<br />
North America 37’102 12’401<br />
Other European countries 15’974 7’952<br />
Rest of world 11’818 8’453<br />
Total revenues from management and advisory services, net 372’552 321’781<br />
No client of the <strong>Group</strong> is responsible for more than 10% of the <strong>Group</strong>’s revenues.
NOTES TO THE CONSOLIDATED FINANCIAL STATEMENTS<br />
FOR THE YEARS ENDED 31 DECEMBER 2010 AND 2009<br />
7. REVENUES FROM MANAGEMENT AND ADVISORY SERVICES,<br />
NET<br />
The <strong>Group</strong> acts in different businesses (see note 6). Within these different businesses, it earns income for its various<br />
functions, which are further explained and outlined below:<br />
Investment management<br />
Typically based on long-term contracts, the <strong>Group</strong> earns investment management fees for discretionary mandates.<br />
The fee is typically based on the commitments by investors into investment structures. The fees are typically payable<br />
quarterly in advance. The fees may include a performance-related remuneration. In the process of structuring<br />
new products, the <strong>Group</strong> often receives a fee for its services in connection with establishing investment vehicles and<br />
related legal and structuring work. These fees are always one-off fees, which are typically due when a new investor<br />
invests in the structure. Occasionally, the <strong>Group</strong> also derives transaction fee income relating to corporate fi nance<br />
activities for private market transactions. These fees are usually one-time occurring.<br />
Insurance premiums<br />
The private equity insurance premiums exclusively relate to Pearl Holding Limited where the <strong>Group</strong> acts as policyholder<br />
only, since European International Reinsurance Company Limited is the insurer and thus the <strong>Group</strong> forwards<br />
the entire amount to the insurer (see notes 16 and 27).<br />
Revenue deductions<br />
The revenue deductions represent the <strong>Group</strong>’s payments to third parties, who introduce clients to it as well as rebates<br />
paid to existing clients. Third party payments may be one-off payments or also recurring retainers, depending<br />
on individual agreements. Rebates to existing clients are mostly for fees charged which were earned when investing<br />
through a pooling vehicle, in order to avoid double charging of fees.<br />
67
68<br />
NOTES TO THE CONSOLIDATED FINANCIAL STATEMENTS<br />
FOR THE YEARS ENDED 31 DECEMBER 2010 AND 2009<br />
7. REVENUES FROM MANAGEMENT AND ADVISORY SERVICES,<br />
NET (CONTINUED)<br />
In thousands of Swiss francs 2010 2009<br />
Private equity<br />
Private equity investment management 315’339 305’747<br />
./. Revenue deductions – 42’333 – 41’546<br />
Net private equity investment management 273’006 264’201<br />
Private equity insurance premiums 21’322 25’527<br />
./. Insurance fees, where group acts as policyholder only – 21’322 – 25’527<br />
Net private equity insurance premiums – –<br />
Total revenues from private equity, net 273’006 264’201<br />
Private debt<br />
Private debt investment management 44’783 33’705<br />
./. Revenue deductions – 1’893 – 6’515<br />
Net private debt investment management 42’890 27’190<br />
Total revenues from private debt, net 42’890 27’190<br />
Private real estate<br />
Private real estate investment management 45’928 18’579<br />
./. Revenue deductions – 10’605 – 4’578<br />
Net private real estate investment management 35’323 14’001<br />
Total revenues from private real estate, net 35’323 14’001
NOTES TO THE CONSOLIDATED FINANCIAL STATEMENTS<br />
FOR THE YEARS ENDED 31 DECEMBER 2010 AND 2009<br />
7. REVENUES FROM MANAGEMENT AND ADVISORY SERVICES,<br />
NET (CONTINUED)<br />
In thousands of Swiss francs 2010 2009<br />
Other revenues<br />
Public markets – 13’785<br />
./. Revenue deductions – – 4’509<br />
Net public markets – 9’276<br />
Private infrastructure investment management 19’160 4’092<br />
./. Revenue deductions – 4’253 – 536<br />
Net private infrastructure investment management 14’907 3’556<br />
Revenues from affi litated companies 6’097 3’299<br />
./. Revenue deductions – 447 – 252<br />
Net revenues from affi liated companies 5’650 3’047<br />
Other revenues 776 510<br />
Total other revenues, net 21’333 16’389<br />
Revenues from management and advisory services, net 372’552 321’781<br />
In thousands of Swiss francs 2010 2009<br />
Summary<br />
Total gross revenues 453’405 405’244<br />
./. Revenue deductions – 59’531 – 57’936<br />
./. Insurance fees, where group acts as policyholder only – 21’322 – 25’527<br />
Revenues from management and advisory services, net 372’552 321’781<br />
69
70<br />
NOTES TO THE CONSOLIDATED FINANCIAL STATEMENTS<br />
FOR THE YEARS ENDED 31 DECEMBER 2010 AND 2009<br />
8. THIRD PARTY SERVICES<br />
In thousands of Swiss francs 2010 2009<br />
Consulting and legal fees – 5’204 – 4’384<br />
Sundry third party service expenses – 678 – 657<br />
Total third party expenses – 5’882 – 5’041<br />
9. PERSONNEL EXPENSES<br />
In thousands of Swiss francs 2010 2009<br />
Wages and salaries – 66’462 – 51’751<br />
Retirement schemes – defi ned contribution plans – 4’752 – 3’191<br />
Retirement schemes – defi ned benefi t plans – 1’660 – 1’620<br />
Other social security expenses – 6’077 – 3’257<br />
Share-based payment expenses – 15’505 – 11’343<br />
Sundry personnel expenses – 3’248 – 2’530<br />
Total personnel expenses – 97’704 – 73’692<br />
In addition to the expense recognized for non-vested shares and share options granted in 2010 (refer to note 26)<br />
the <strong>Group</strong> recognized the following expenses for grants in previous periods as well as expenses for shares granted<br />
to employees at start of employment:<br />
In thousands of Swiss francs 2010 2009<br />
Grant 2006 – 1’388 – 1’805<br />
Grant 2007 – 2’527 – 2’811<br />
Grant 2008 (options and non-vested shares) – 2’507 – 2’771<br />
Grant 2009 (options and non-vested shares) – 3’512 – 3’735<br />
Grant 2010 (options and non-vested shares) – 4’797 –<br />
Share grants at start of employment in the respective year – 774 – 221<br />
Total share-based payments – 15’505 – 11’343<br />
The average number of employees in 2010 was 404 (2009: 352).
NOTES TO THE CONSOLIDATED FINANCIAL STATEMENTS<br />
FOR THE YEARS ENDED 31 DECEMBER 2010 AND 2009<br />
10. NET FINANCE INCOME AND EXPENSE<br />
In thousands of Swiss francs 2010 2009<br />
Interest income on fair value through profi t or loss instruments<br />
Net gains / losses on:<br />
16’677 10’241<br />
Held for trading instruments 1’092 2’963<br />
Fair value through profi t or loss instruments 28’188 – 8’679<br />
Net change in fair value of other long-term liabilities – 11 –<br />
Net foreign exchange gain / (loss) 32’206 – 3’361<br />
Net gain on disposal of subsidiary 1’043 –<br />
Total other fi nance income / (expense), net 79’195 1’164<br />
Interest expense on fi nancial liabilities – 26 – 36<br />
Other fi nancial expense – 841 – 262<br />
Total fi nance cost – 867 – 298<br />
Net fi nance income and expense 78’328 866<br />
71
72<br />
NOTES TO THE CONSOLIDATED FINANCIAL STATEMENTS<br />
FOR THE YEARS ENDED 31 DECEMBER 2010 AND 2009<br />
11. INCOME TAX EXPENSE<br />
Recognized in the income statement:<br />
In thousands of Swiss francs 2010 2009<br />
Current tax expense:<br />
Current year 18’946 13’217<br />
Under / (over)provided in prior years – 196 – 729<br />
Total current tax expense 18’750 12’488<br />
Deferred tax expense / income:<br />
Deferred tax expense / income, net relating to the origination and<br />
reversal of temporary differences 1’743 – 235<br />
Total income tax expense 20’493 12’253<br />
In thousands of Swiss francs 2010 2009<br />
Profi t before tax 317’028 217’125<br />
Weighted average expected <strong>Group</strong> tax rate 7.61% 5.90%<br />
Expected tax expense 24’124 12’814<br />
Non-tax-deductible expense 434 176<br />
Applicable tax rates differing from expected rate – 312 –<br />
Utilization of unrecognized tax loss carry-forwards – 3’610 – 8<br />
Under / (over)provided in prior years – 196 – 729<br />
Other impacts 53 –<br />
20’493 12’253<br />
The <strong>Group</strong> calculates a weighted average tax rate for the whole <strong>Group</strong>, taking into account offi cial taxation rates of<br />
the individual companies in their specifi c locations and their contribution to the total profi t, which leads to the<br />
weighted average expected <strong>Group</strong> tax rate.<br />
Deferred tax assets and liabilities are disclosed separately in note 17.<br />
The <strong>Group</strong> regularly reviews the applied transfer pricing model. In 2010 the transfer pricing model was further developed<br />
with support from external consultants to refl ect the developments in the international OECD guidelines for<br />
transfer pricing as well as the growth and changes within the <strong>Group</strong>. This resulted in slight adjustments to the used<br />
model which led to an increased weighted average expected <strong>Group</strong> tax rate.
NOTES TO THE CONSOLIDATED FINANCIAL STATEMENTS<br />
FOR THE YEARS ENDED 31 DECEMBER 2010 AND 2009<br />
12. PROPERTY AND EQUIPMENT<br />
In thousands of Swiss francs 2010<br />
Offi ce furniture Interior fi ttings<br />
Equipment and<br />
IT fi ttings Total<br />
Cost<br />
Balance at 1 January 2010 4’819 7’259 6’527 18’605<br />
Additions (cash out) 558 777 2’621 3’956<br />
Disposals – – – 354 – 354<br />
Effect of movements in exchange rates – 137 – 120 – 214 – 471<br />
Balance at 31 December 2010 5’240 7’916 8’580 21’736<br />
Accumulated depreciation<br />
Balance at 1 January 2010 3’314 3’914 5’130 12’358<br />
Additions 689 914 1’333 2’936<br />
Disposals – – – 338 – 338<br />
Effect of movements in exchange rates – 93 – 94 – 133 – 320<br />
Balance at 31 December 2010 3’910 4’734 5’992 14’636<br />
Carrying amount<br />
At 1 January 2010 1’505 3’345 1’397 6’247<br />
At 31 December 2010 1’330 3’182 2’588 7’100<br />
Impairment losses incurred in 2010 nil<br />
73
74<br />
NOTES TO THE CONSOLIDATED FINANCIAL STATEMENTS<br />
FOR THE YEARS ENDED 31 DECEMBER 2010 AND 2009<br />
12. PROPERTY AND EQUIPMENT (CONTINUED)<br />
In thousands of Swiss francs 2009<br />
Offi ce<br />
furniture<br />
Interior<br />
Equipment<br />
and<br />
fi ttings IT fi ttings Cars Total<br />
Cost<br />
Balance at 1 January 2009 4’459 5’832 5’582 322 16’195<br />
Additions (cash out) 364 1’445 955 – 2’764<br />
Disposals – 7 – – – – 7<br />
Removals – – – – 322 – 322<br />
Effect of movements in exchange rates 3 – 18 – 10 – – 25<br />
Balance at 31 December 2009 4’819 7’259 6’527 – 18’605<br />
Accumulated depreciation<br />
Balance at 1 January 2009 2’692 3’153 3’871 322 10’038<br />
Additions 626 775 1’232 – 2’633<br />
Disposals – – 37 – 37<br />
Removals – – – – 322 – 322<br />
Effect of movements in exchange rates – 4 – 14 – 10 – – 28<br />
Balance at 31 December 2009 3’314 3’914 5’130 – 12’358<br />
Carrying amount<br />
At 1 January 2009 1’767 2’679 1’711 – 6’157<br />
At 31 December 2009 1’505 3’345 1’397 – 6’247<br />
Impairment losses incurred in 2009 nil
NOTES TO THE CONSOLIDATED FINANCIAL STATEMENTS<br />
FOR THE YEARS ENDED 31 DECEMBER 2010 AND 2009<br />
13. INTANGIBLE ASSETS<br />
In thousands of Swiss francs 2010<br />
Cost of Existing<br />
initial put client<br />
Placing<br />
option contracts Goodwill Software expenses 1) Total<br />
Cost<br />
Balance at 1 January 2010 42’200 885 10’315 5’478 10’877 69’755<br />
Additions – – – 1’367 1’026 2’393<br />
Effect of movements in exchange rates – 6’613 – 85 – 993 – 8 – 1’110 – 8’809<br />
Balance at 31 December 2010 35’587 800 9’322 6’837 10’793 63’339<br />
Accumulated amortization<br />
Balance at 1 January 2010 – 632 – 4’672 8’565 13’869<br />
Additions 2’458 255 – 713 1’262 4’688<br />
Effect of movements in exchange rates – 234 – 87 – – 3 – 944 – 1’268<br />
Balance at 31 December 2010 2’224 800 – 5’382 8’883 17’289<br />
Carrying amount<br />
Opening carrying amount 42’200 253 10’315 806 2’312 55’886<br />
Closing carrying amount 33’363 – 9’322 1’455 1’910 46’050<br />
Impairment losses incurred in 2010 nil<br />
1) relating to securing investment management contracts<br />
75
76<br />
NOTES TO THE CONSOLIDATED FINANCIAL STATEMENTS<br />
FOR THE YEARS ENDED 31 DECEMBER 2010 AND 2009<br />
13. INTANGIBLE ASSETS (CONTINUED)<br />
In thousands of Swiss francs 2009<br />
Cost of<br />
initial put<br />
option<br />
Existing<br />
client<br />
Placing<br />
contracts Goodwill Software expenses 1) Total<br />
Cost<br />
Balance at 1 January 2009 42’440 914 10’654 4’798 9’467 68’273<br />
Additions (cash out) – – – 680 1’467 2’147<br />
Effects of movement in FX – 240 – 29 – 339 – – 57 – 665<br />
Balance at 31 December 2009 42’200 885 10’315 5’478 10’877 69’755<br />
Accumulated amortization<br />
Balance at 1 January 2009 – 391 – 3’969 6’820 11’180<br />
Additions – 266 – 648 1’798 2’712<br />
Disposals – – – 56 – 56<br />
Effects of movement in FX – – 25 – – 1 – 53 – 79<br />
Balance at 31 December 2009 – 632 – 4’672 8’565 13’869<br />
Carrying amount<br />
At 1 January 2009 42’440 523 10’654 829 2’647 57’093<br />
At 31 December 2009 42’200 253 10’315 806 2’312 55’886<br />
Impairment losses incurred in 2009 nil<br />
1) relating to securing investment management contracts<br />
Initial put option<br />
The cost of the initial put option represents the incremental cost directly attributable to securing the extension of<br />
the investment management contract for Pearl Holding Limited (see note 27). The cost of the initial put option is<br />
amortized using the straight-line method over the extension period from 1 October 2010 to 30 September 2014;<br />
i.e. the fi rst part of the amortization is recognized in the current period.
NOTES TO THE CONSOLIDATED FINANCIAL STATEMENTS<br />
FOR THE YEARS ENDED 31 DECEMBER 2010 AND 2009<br />
13. INTANGIBLE ASSETS (CONTINUED)<br />
Placing expenses<br />
The <strong>Group</strong> selectively uses third party placing agents for the distribution of its investment structures (usually limited<br />
partnership structures). It is common to compensate such services with a one-off payment dependent on the<br />
amount of assets raised by such third party providers. The cost paid is recognized as incremental cost incurred in<br />
connection with the securing of investment management fees. This intangible asset is amortized using the straightline<br />
method over the duration of the investment period of the relevant product the cost was incurred for, usually<br />
between three to fi ve years (see note 2.11).<br />
Existing client contracts<br />
In the course of the acquisition of <strong>Partners</strong> <strong>Group</strong> Real Estate, LLC, the <strong>Group</strong> acquired existing client contracts. The<br />
<strong>Group</strong> has valued these contracts based on the contractual relationships, taking into account cancellation periods<br />
and nature of the contracts. The estimated future returns have been discounted at a rate of 11.16% to derive at the<br />
net present value of the intangible asset acquired. It was amortized using the straight-line method over the period<br />
from 1 July 2007 to 31 December 2010.<br />
Impairment testing for cash-generating unit containing goodwill<br />
For the purpose of impairment testing, goodwill is allocated to the <strong>Group</strong>’s operating division which represents the<br />
lowest level within the <strong>Group</strong> at which the goodwill is monitored for internal management purposes.<br />
The entire amount of goodwill has been allocated to the private real estate operating segment.<br />
The recoverable amount of the private real estate cash-generating unit was based on its value in use. The carrying<br />
amount of the unit was determined to be lower than its recoverable amount and thus no impairment of the goodwill<br />
was recognized. Value in use was determined by discounting the future cash fl ows generated from the continuing<br />
use of the unit and was based on the following key assumptions:<br />
– Cash fl ows were projected based on actual operating results and a 5-year business plan (2011–2015). Cash fl ows<br />
for the time thereafter were taken into account by calculating a terminal value based on the discount factor applied<br />
by the <strong>Group</strong>. No growth rate was applied.<br />
– Net profi t was projected based on the development of existing business, taking into account the generation of<br />
additional business in the years 2011 to 2015.<br />
– General expense as well as third party expense growth was considered at a constant rate of 10% p.a. (2009:<br />
20% p.a.)<br />
– Personnel expense growth was considered at a constant rate of 8% p.a. (2009: constant rate of 25% p.a.) plus<br />
additional personnel expenses for additional business revenues (i.e. 30% of additional revenues are expensed as<br />
additional personnel expense).<br />
– A pre-tax discount rate of 17.22% (2009: 13.18%) was applied in determining the recoverable amount of the<br />
unit. The discount rate did not take into account any cost for leverage, as the <strong>Group</strong> used no debt to fi nance the<br />
transaction. The <strong>Group</strong> applied a market interest rate of 3.45% (2009: 3.84%), adjusted by a market risk premium<br />
and an industry weighted average beta factor.<br />
Management believes that any reasonably possible change in any of the key assumptions would not cause the carrying<br />
value of goodwill to exceed the recoverable amount.<br />
77
78<br />
NOTES TO THE CONSOLIDATED FINANCIAL STATEMENTS<br />
FOR THE YEARS ENDED 31 DECEMBER 2010 AND 2009<br />
14. INVESTMENTS IN ASSOCIATES<br />
In thousands of Swiss francs Country<br />
Investment<br />
at cost<br />
Carrying<br />
value Ownership<br />
LGT Private Equity Advisers, Vaduz LI 400 3’902 40%<br />
In thousands of Swiss francs 2010 2009<br />
Balance at the beginning of the year 3’382 5’130<br />
Dividends received from investments in associates – 3’005 – 4’413<br />
Other movements – 125 – 277<br />
Share of results 3’650 2’942<br />
Balance at the end of the year 3’902 3’382<br />
Summary fi nancial information on associates – 100%:<br />
In thousands of Swiss francs<br />
Total<br />
assets<br />
Total<br />
liabilities Equity Revenues<br />
Profi t /<br />
(loss)<br />
2010<br />
LGT Private Equity Advisers, Vaduz 11’311 1’556 9’755 10’593 9’124<br />
2009<br />
LGT Private Equity Advisers, Vaduz 10’236 1’780 8’456 8’594 7’356
NOTES TO THE CONSOLIDATED FINANCIAL STATEMENTS<br />
FOR THE YEARS ENDED 31 DECEMBER 2010 AND 2009<br />
15. OTHER INVESTMENTS<br />
Other investments comprise investments into investment programs and investments in investment companies.<br />
Investment programs<br />
Investment programs are non-current investment holdings, which may have a long-term or temporary character.<br />
Investments of a long-term nature are participations the <strong>Group</strong> entered into in the due course of its business, where<br />
it enters a minority participation in order to act either as general partner, sponsor or holder of the management<br />
shares or similar participations. The <strong>Group</strong> performs an investment activity to the benefi t of external investors under<br />
a predetermined investment policy, and receives a predetermined management and performance fee for its<br />
services, which is signifi cantly less than the expected return to the investors. Those investment program entities are<br />
treated as special purpose entities, and since the majority of risks and rewards involved lie with the external investors,<br />
they are not consolidated.<br />
Investments with a temporary character are selected investments that the <strong>Group</strong> bridges for products, which are<br />
currently in the marketing phase and have not yet held a closing; i.e. these products do not yet have suffi cient cash<br />
available for entering into investments. Such bridged investments typically represent a small portfolio of investment<br />
programs and are transferred to the respective product once they have held their closing.<br />
Investments into investment programs are classifi ed as at “fair value through profi t or loss” and are measured at<br />
fair value (refer to note 2.12).<br />
Investment companies<br />
The <strong>Group</strong> holds a majority of the shares of a few investment companies managed by the <strong>Group</strong>; currently Pearl<br />
Holding Limited and <strong>Partners</strong> <strong>Group</strong> Private Equity Performance Holding Limited. However the <strong>Group</strong> is not the<br />
ultimate benefi cial owner of the assets held by these investment companies. The <strong>Group</strong> performs an investment<br />
activity to the benefi t of external investors under a predetermined investment policy, and receives a predetermined<br />
management and performance fee for its services, which is signifi cantly less than the expected return to the investors.<br />
These investment company entities are treated as special purpose entities, and since the majority of risks and<br />
rewards involved lie with the external investors, they are not consolidated.<br />
The investments in investment companies are classifi ed as at “fair value through profi t or loss” and measured at fair<br />
value.<br />
In thousands of Swiss francs 2010 2009<br />
Balance at 1 January 124’872 108’869<br />
Additions 54’788 32’533<br />
Disposals – 4’661 – 5’750<br />
Revaluation to fair value 1) 28’188 – 8’679<br />
Effect of movements in exchange rates – 22’707 – 2’101<br />
Balance at 31 December 180’480 124’872<br />
1) The revaluation of other investments is included in net fi nance income and expense (see note 10).<br />
79
80<br />
NOTES TO THE CONSOLIDATED FINANCIAL STATEMENTS<br />
FOR THE YEARS ENDED 31 DECEMBER 2010 AND 2009<br />
15. OTHER INVESTMENTS (CONTINUED)<br />
At the relevant balance sheet dates the <strong>Group</strong> was holding the following investments into investment programs and<br />
investments in following segments:<br />
In thousands of Swiss francs FV 2010 FV 2009<br />
Private Equity 111’339 73’912<br />
Private Debt 14’061 12’238<br />
Private Real Estate<br />
Other investments:<br />
6’044 2’390<br />
<strong>Partners</strong> <strong>Group</strong> managed 37’509 34’667<br />
Third party managed 11’527 1’665<br />
Total other investments 49’036 36’332<br />
Total investments 180’480 124’872
NOTES TO THE CONSOLIDATED FINANCIAL STATEMENTS<br />
FOR THE YEARS ENDED 31 DECEMBER 2010 AND 2009<br />
16. OTHER FINANCIAL ASSETS<br />
In thousands of Swiss francs 2010 2009<br />
Assets held in experience account:<br />
Restricted cash and cash equivalents 84’588 96’618<br />
Loans to directors and offi cers of the <strong>Group</strong> 3’217 3’697<br />
Other fi nancial assets 697 323<br />
Total 88’502 100’638<br />
Since the <strong>Group</strong> cannot access the assets held in the experience account, which serve as fi rst level coverage for<br />
the repayment of the convertible bond issued by Pearl Holding Limited, Guernsey, the assets are disclosed as noncurrent<br />
fi nancial assets and stated at fair value.<br />
The effective interest earned on the assets of the experience account was as follows:<br />
2010 2009<br />
Effective interest rate of restricted cash and cash equivalents 0.76% 1.67%<br />
Once the aforesaid convertible bond for Pearl Holding Limited, Guernsey, is fully repaid and a balance in the experience<br />
account remains, Pearl Management Limited is entitled to this amount.<br />
Pearl Management Limited is fully consolidated (see note 32). According to SIC 12, the company has to consolidate<br />
its benefi cial ownership in the experience account. The assets in the experience account are held in Euro. The assets<br />
increase over the duration of the convertible bond via:<br />
– Fund transfers by the <strong>Group</strong> and the issuer<br />
– Interest income on the funds held<br />
– Net gains on disposal of held for trading instruments<br />
– Net gains on fair value remeasurement of held for trading instruments<br />
Restricted securities are classifi ed at fair value through profi t or loss.<br />
The loans to directors and offi cers of the <strong>Group</strong> of <strong>CHF</strong> 3.2 <strong>million</strong> (2009: <strong>CHF</strong> 3.7 <strong>million</strong>) bear interest at market<br />
related interest rates.<br />
81
82<br />
NOTES TO THE CONSOLIDATED FINANCIAL STATEMENTS<br />
FOR THE YEARS ENDED 31 DECEMBER 2010 AND 2009<br />
17. DEFERRED TAX ASSETS AND LIABILITIES<br />
Deferred tax assets<br />
Taxable temporary differences arise (in accordance with IAS 12.68A) from the recognition of expenses for employee<br />
benefi ts (see note 26) in the applicable accounting period in accordance with IFRS 2, ‘Share-based Payment’, but<br />
the tax deduction based on these expenses is not received until the options and non-vested shares are exercised or<br />
vested, with the measurement of ther tax deduction based on the share price at the date of exercise or vesting.<br />
(2010: <strong>CHF</strong> 0.6 <strong>million</strong>; 2009: <strong>CHF</strong> 0.4 <strong>million</strong>)<br />
Deferred tax liabilities<br />
Taxable temporary differences arise from the application of IAS 28 and IAS 39 and the stating of the assets valued<br />
at “fair value through profi t or loss” at fair value (2010: <strong>CHF</strong> 1.9 <strong>million</strong>; 2009: <strong>CHF</strong> nil). The revaluation is included<br />
in net fi nance income and expense (see note 10).<br />
In addition the <strong>Group</strong> recognizes deferred tax liabilities in connection with its assets arising out of the application of<br />
IAS 19. (2010: <strong>CHF</strong> 0.1 <strong>million</strong>; 2009: <strong>CHF</strong> nil)<br />
Development of deferred tax assets and liabilities<br />
In thousands of Swiss francs 2010 2009<br />
Deferred tax assets<br />
Balance at 1 January 396 188<br />
Additions recognized in the income statement 330 235<br />
Used during reporting period – – 23<br />
Effect of movements in exchange rates – 80 – 4<br />
Balance as of 31 December 646 396<br />
Deferred tax liabilities<br />
Balance at 1 January –<br />
Additions recognized in the income statement 2’073<br />
Effect of movements in exchange rates – 39<br />
Balance as of 31 December 2’034 –<br />
The ultimate parent company is treated as a holding company under Swiss tax regulation and under certain conditions<br />
does not have to pay taxes on the disposal of these assets. In such circumstances a tax rate of 0% is applied.
NOTES TO THE CONSOLIDATED FINANCIAL STATEMENTS<br />
FOR THE YEARS ENDED 31 DECEMBER 2010 AND 2009<br />
17. DEFERRED TAX ASSETS AND LIABILITIES (CONTINUED)<br />
Tax loss carry-forwards<br />
Some <strong>Group</strong> companies generated net losses during the years under review, resulting in potential future deductions,<br />
once the companies generate a net profi t. The analysis of the net operating losses carried forward is as follows:<br />
In thousands of Swiss francs 2010 2009<br />
Tax relevant losses carried forward on 1 January 9’819 7’643<br />
Effect of movements in foreign exchange rates 59 – 281<br />
Additional losses in the current reporting period 2 2’708<br />
Utilized losses carried forward – 9’306 – 251<br />
Balance as of 31 December 574 9’819<br />
The losses carried forward expire within the following time frame:<br />
In thousands of Swiss francs 2010 2009<br />
5 years 553 –<br />
6 years – 1’640<br />
11 to 20 years 21 8’179<br />
Total losses carried forward 574 9’819<br />
Since the future utilization of the losses carried forward is uncertain, the <strong>Group</strong> does not recognize any deferred tax<br />
assets in respect of these amounts.<br />
The <strong>Group</strong> does not recognize a deferred tax liability for all taxable temporary differences associated with investments,<br />
branches, associated companies due to the tax status of the companies holding such investments, since<br />
upon realization of such differences no deferred tax would arise.<br />
83
84<br />
NOTES TO THE CONSOLIDATED FINANCIAL STATEMENTS<br />
FOR THE YEARS ENDED 31 DECEMBER 2010 AND 2009<br />
18. PREPAID EXPENSES, DERIVATIVE ASSETS, LOANS, TRADE<br />
AND OTHER RECEIVABLES<br />
In thousands of Swiss francs 2010 2009<br />
Derivative assets 22’724 5’279<br />
Other prepaid expenses 2’636 2’077<br />
Current loans 116’569 119’088<br />
Trade receivables 40’093 38’659<br />
Other receivables 2’230 3’705<br />
Total 184’252 168’808<br />
No material allowances were recognized during and at the end of the current and prior year. As of the reporting date<br />
no material receivables are overdue. The <strong>Group</strong> reviews its counterparty risk in trade receivables on a regular basis.<br />
As disclosed in Note 4.2, as of the balance sheet date the <strong>Group</strong> can collect 75% (2009: 69%) of the trade receivables<br />
based on discretionary management agreements; the remaining 25% (2009: 31%) is invoiced to clients who<br />
are mainly major institutional clients. As part of its risk management, the <strong>Group</strong> has reviewed all the major counterparties<br />
with respect to their current credit standing.<br />
“Current loans” includes loans to investment structures. Of the outstanding balance as of 31 December 2010, the<br />
majority relates to the following short-term fi nancing:<br />
As of 25 September 2009, one of the <strong>Group</strong> entities (<strong>Partners</strong> <strong>Group</strong> Finance <strong>CHF</strong> IC Limited, Guernsey) entered<br />
into 3-year term loans and revolving facilities available to three investment structures, namely Princess Private Equity<br />
Limited, Pearl Holding Limited and <strong>Partners</strong> <strong>Group</strong> Global Opportunities Limited. The credit facilities have been<br />
arranged by a large international bank and entered alongside other lenders including the arranging bank. Each facility<br />
forms part of syndicated term loan and revolving facilities of EUR 170 <strong>million</strong> in aggregate, which may, subject to<br />
certain minimum and maximum limits, be allocated across the three borrowers as per individual demand and as determined<br />
by <strong>Partners</strong> <strong>Group</strong> AG, in its capacity as allocation agent. The syndicated facilities comprise senior and<br />
junior facilities of EUR 85 <strong>million</strong> each. A borrower may not, fully or partially, repay any amount of its junior facility<br />
before its senior facility has been repaid in full. The credit facilities mature on 25 September 2012 unless they are<br />
repaid earlier.<br />
The <strong>Group</strong> participates with a maximum credit amount of EUR 101.3 <strong>million</strong> being comprised of EUR 69.3 <strong>million</strong> in<br />
the junior facilities and EUR 32 <strong>million</strong> in the senior facilities. As at the end of the reporting period, the junior facilities<br />
of EUR 69.3 <strong>million</strong> have been drawn.<br />
In relation to the senior facilities, interest on drawn amounts is calculated at a rate of 5% per annum (calculated as<br />
a margin of 2.75% on drawn amounts plus a facility fee of 2.25% on the applicable senior facility amount) above<br />
the applicable EURIBOR rate. In addition there is a facility fee of 2.25% per annum on the remaining undrawn applicable<br />
senior facility amount. The margin on drawn amounts under the junior facility is 8.75% per annum above<br />
EURIBOR. No facility fee is due under the junior facilities.<br />
In addition there is a one-off participation fee of 2% of the committed facility amount payable by the borrowers.<br />
This one-off participation fee has been received for the junior facilities as well as for EUR 18.8 <strong>million</strong> of the senior<br />
facilities. The facilities are, where applicable, secured, inter alia, by way of pledge of certain assets/investments,<br />
shares and bank accounts of the three borrowers.
NOTES TO THE CONSOLIDATED FINANCIAL STATEMENTS<br />
FOR THE YEARS ENDED 31 DECEMBER 2010 AND 2009<br />
19. MARKETABLE SECURITIES<br />
In thousands of Swiss francs 2010 2009<br />
Equity securities held for trading 488 10’098<br />
Debt securities held for trading – 72<br />
Total 488 10’170<br />
20. CASH AND CASH EQUIVALENTS<br />
In thousands of Swiss francs 2010 2009<br />
Bank balances 226’566 169’676<br />
Petty cash 6 6<br />
Total 226’572 169’682<br />
21. SHARE CAPITAL AND RESERVES<br />
In effective number of shares 2010 2009<br />
Issued at 1 January 26’700’000 26’700’000<br />
Issued during period – –<br />
Issued at 31 December – fully paid in 26’700’000 26’700’000<br />
The issued share capital comprises 26’700’000 registered shares (2009: 26’700’000) at <strong>CHF</strong> 0.01 each. The holders<br />
of ordinary shares are entitled to receive dividends as declared from time to time and are entitled to one vote per<br />
share at meetings of the Company.<br />
Legal reserves<br />
The legal reserves comprise the reserves which are to be maintained due to the legal requirements as indicated in<br />
the Swiss Code of Obligations. The <strong>Group</strong>’s legal reserves amounted to <strong>CHF</strong> 218’100 as of 31 December 2010<br />
(2009: <strong>CHF</strong> 218’100) consisting of <strong>CHF</strong> 217’100 (2009: <strong>CHF</strong> 217’100) for legal reserves from capital contributions<br />
and of <strong>CHF</strong> 1’000 (2009: <strong>CHF</strong> 1’000) for capital reserves.<br />
Own equity instruments<br />
Own equity instruments include treasury shares and share options of the Company. They are recognized at cost and<br />
presented separately within equity. At the balance sheet date the <strong>Group</strong> held 1’952’821 (2009: 1’953’389) of the<br />
Company’s issued shares.<br />
The <strong>Group</strong> holds treasury shares to provide for shares for existing share and option programs.<br />
Translation reserves<br />
The translation reserves comprise all foreign exchange differences arising from the translation of the fi nancial statements<br />
of foreign entities included in the consolidation.<br />
85
86<br />
NOTES TO THE CONSOLIDATED FINANCIAL STATEMENTS<br />
FOR THE YEARS ENDED 31 DECEMBER 2010 AND 2009<br />
21. SHARE CAPITAL AND RESERVES (CONTINUED)<br />
Dividends<br />
After the balance sheet date the Directors proposed a dividend distribution of <strong>CHF</strong> 133.5 <strong>million</strong> (<strong>CHF</strong> 5.00 per<br />
share). During the reporting period the Company has paid a dividend of <strong>CHF</strong> 110.8 <strong>million</strong> (<strong>CHF</strong> 4.50 per share)<br />
(2009: <strong>CHF</strong> 105.4 <strong>million</strong>, <strong>CHF</strong> 4.25 per share). The <strong>Group</strong>’s treasury shares were not eligible for a dividend payment.<br />
Outstanding shares<br />
The computation of the weighted average number of ordinary shares outstanding during the period is based on the<br />
following fi gures:<br />
In effective number of shares 2010<br />
Shares<br />
issued<br />
Treasury<br />
shares<br />
Outstanding<br />
Balance as of 1 January 2010 26’700’000 1’953’389 24’746’611<br />
Purchase of treasury shares for cash 1’892’257 – 1’892’257<br />
Sale of treasury shares for cash – 1’892’825 1’892’825<br />
Balance as of 31 December 2010 26’700’000 1’952’821 24’747’179<br />
Weighted average number of shares outstanding<br />
during the period (360 days) 24’811’400<br />
Shareholders above 5% (in % of shares issued) Shares held in %<br />
Gantner Alfred 3’790’326 14.20%<br />
Erni Marcel 3’790’326 14.20%<br />
Wietlisbach Urs 3’790’326 14.20%<br />
In effective number of shares 2009<br />
Shares<br />
Treasury<br />
Out-<br />
issued<br />
shares<br />
standing<br />
Balance as of 1 January 2009 26’700’000 1’972’246 24’727’754<br />
Purchase of treasury shares for cash 1’328’486 – 1’328’486<br />
Sale of treasury shares for cash – 1’347’343 1’347’343<br />
Balance as of 31 December 2009 26’700’000 1’953’389 24’746’611<br />
Weighted average number of shares outstanding<br />
during the period (360 days) 24’719’999<br />
Shareholders above 5% (in % of shares issued) Shares held in %<br />
Gantner Alfred 3’790’326 14.20%<br />
Erni Marcel 3’790’326 14.20%<br />
Wietlisbach Urs 3’790’326 14.20%
NOTES TO THE CONSOLIDATED FINANCIAL STATEMENTS<br />
FOR THE YEARS ENDED 31 DECEMBER 2010 AND 2009<br />
22. EARNINGS PER SHARE<br />
2010 2009<br />
Basic and diluted earnings per share<br />
Net profi t for the period (in thousands of Swiss francs) 296’294 204’838<br />
Weighted average number of ordinary shares outstanding 24’811’400 24’719’999<br />
Average fair value of one ordinary share during the period (in<br />
Swiss francs)<br />
Weighted average number of shares under option during the<br />
154.00 102.80<br />
period<br />
Weighted exercise price for shares under option during the<br />
4’280’478 4’776’497<br />
period (in Swiss francs) 97.00 82.65<br />
Per share Earnings<br />
2010<br />
Shares<br />
Net profi t for the period (in thousands of Swiss francs) 296’294<br />
Weighted average number of ordinary shares outstanding 24’811’400<br />
Basic earnings per share (in Swiss francs) 11.94<br />
Weighted average number of shares under option during the<br />
period 4’280’478<br />
Number of shares that would have been issued at fair value 1) – 2’660’227<br />
Diluted earnings per share (in Swiss francs) 11.21 26’431’651<br />
2009<br />
Per share Earnings Shares<br />
Net profi t for the period (in thousands of Swiss francs) 204’838<br />
Weighted average number of ordinary shares outstanding 24’719’999<br />
Basic earnings per share (in Swiss francs) 8.29<br />
Weighted average number of shares under option during the<br />
period 4’776’497<br />
Number of shares that would have been issued at fair value 1) – 3’070’386<br />
Diluted earnings per share (in Swiss francs) 7.75 26’426’110<br />
1) calculated on the basis of each individual share option grant<br />
87
88<br />
NOTES TO THE CONSOLIDATED FINANCIAL STATEMENTS<br />
FOR THE YEARS ENDED 31 DECEMBER 2010 AND 2009<br />
23. BORROWINGS<br />
As of the balance sheet date the <strong>Group</strong> had no borrowings outstanding (2009: nil). For information regarding the<br />
<strong>Group</strong>’s exposure to interest rate and foreign currency risk see note 4.4.<br />
24. ACCRUED EXPENSES<br />
In thousands of Swiss francs 2010 2009<br />
Bonus accruals – to be paid out in the following year 22’308 12’380<br />
Third party fees 1’653 16’295<br />
Outstanding invoices 2’952 2’322<br />
Derivative liabilities – 202<br />
Other accrued expenses 8’299 6’194<br />
Total accrued expenses 35’212 37’393<br />
25. OTHER CURRENT LIABILITIES<br />
In thousands of Swiss francs 2010 2009<br />
Deferred income 1’426 1’691<br />
Social securities and other taxes 8’209 4’509<br />
Other current liabilities 2’478 1’698<br />
Total other current liabilities 12’113 7’898
NOTES TO THE CONSOLIDATED FINANCIAL STATEMENTS<br />
FOR THE YEARS ENDED 31 DECEMBER 2010 AND 2009<br />
26. EMPLOYEE BENEFITS<br />
(a) Pension obligations<br />
Liability for defi ned benefi t obligations<br />
The <strong>Group</strong>’s only defi ned benefi t plan is the plan for its Swiss employees. The plan is maintained by Gemini Sammelstiftung,<br />
Zurich. The plan covers the minimum legal requirement under Swiss law including the legal coordination<br />
charge, which is also insured. The monthly premium is split equally between employer and employees.<br />
Balance sheet at 31 December<br />
In thousands of Swiss francs 2010 2009<br />
Fair value of plan assets 29’383 23’596<br />
Present value of benefi t obligation – 32’765 – 28’150<br />
Funded status – 3’382 – 4’554<br />
Unrecognized actuarial (gain) / loss 4’209 4’347<br />
Net asset / (liability) in balance sheet 827 – 207<br />
Movements in net asset / (liability) recognized in balance sheet<br />
In thousands of Swiss francs 2010 2009<br />
Net liability in balance sheet at 1 January – 207 – 373<br />
Expense recognized in the income statement – 1’660 – 1’620<br />
Employer’s contributions 2’694 1’786<br />
Net asset / (liability) in balance sheet at 31 December 827 – 207<br />
89
90<br />
NOTES TO THE CONSOLIDATED FINANCIAL STATEMENTS<br />
FOR THE YEARS ENDED 31 DECEMBER 2010 AND 2009<br />
26. EMPLOYEE BENEFITS (CONTINUED)<br />
Development of obligations and assets<br />
In thousands of Swiss francs 2010 2009<br />
Present value of benefi t obligation at 1 January – 28’150 – 25’829<br />
Service cost – 2’854 – 2’622<br />
Past service cost – 214 –<br />
Interest cost – 915 – 839<br />
Benefi ts paid 590 326<br />
Actuarial gain / (loss) on benefi t obligation – 1’222 814<br />
Present value of benefi t obligation at 31 December – 32’765 – 28’150<br />
In thousands of Swiss francs 2010 2009<br />
Fair value of plan assets at 1 January 23’596 19’730<br />
Expected return on plan assets 1’180 987<br />
Employer’s contributions 2’694 1’786<br />
Employees’ contributions 1’259 1’100<br />
Benefi ts paid – 590 – 326<br />
Actuarial gain / (loss) on plan assets 1’244 319<br />
Fair value of plan assets at 31 December 29’383 23’596<br />
Expense recognized in income statement<br />
In thousands of Swiss francs 2010 2009<br />
Service cost – 2’854 – 2’622<br />
Interest cost – 915 – 839<br />
Expected return on plan assets 1’180 987<br />
Actuarial gain / (loss) outside corridor recognized in year – 116 – 246<br />
Past service cost recognized in year – 214 –<br />
Periodic pension cost – 2’919 – 2’720<br />
Employees’ contributions 1’259 1’100<br />
Expense recognized in the income statement – 1’660 – 1’620<br />
The expense is recognized in personnel expenses (see note 9).<br />
Return<br />
2010 2009<br />
Actual return on plan assets 6.90% 8.91%
NOTES TO THE CONSOLIDATED FINANCIAL STATEMENTS<br />
FOR THE YEARS ENDED 31 DECEMBER 2010 AND 2009<br />
26. EMPLOYEE BENEFITS (CONTINUED)<br />
Principal actuarial assumptions at 31 December<br />
2010 2009<br />
Discount rate 2.75% 3.25%<br />
Expected net return on plan assets 3.50% 5.00%<br />
Average future salary increases 2.00% 2.00%<br />
Future pension increases 0.50% 0.50%<br />
Asset allocation at 31 December<br />
In thousands of Swiss francs 2010 2009<br />
Expected long-term<br />
rate of return<br />
Contribution to rate<br />
of return<br />
Cash 5.60% 1.70% 1.00% 0.06%<br />
Bonds 27.30% 40.60% 2.00% 0.55%<br />
Equities 19.40% 29.50% 6.00% 1.16%<br />
Property 0.00% 0.00% 4.00% 0.00%<br />
Other 47.70% 28.20% 5.00% 2.39%<br />
Total 100.00% 100.00% 4.15%<br />
Cost, rounding – 0.65%<br />
Net return 3.50%<br />
Entity’s own transferable bonds n/a n/a<br />
Entity’s own transferable equities n/a n/a<br />
Property occupied by entity n/a n/a<br />
Other assets used by entity n/a n/a<br />
Development of defi ned benefi t pension plans<br />
In thousands of Swiss francs 2010 2009 2008 2007 2006<br />
Fair value of plan assets 29’383 23’596 19’730 17’563 15’400<br />
Present value of benefi t obligation – 32’765 – 28’150 – 25’829 – 21’380 – 16’969<br />
Funded / (unfunded) status – 3’382 – 4’554 – 6’099 – 3’817 – 1’569<br />
Change in assumptions gain / (loss) on plan liabilities – 1’921 – 50 – 914 –<br />
Experience gain / (loss) on plan liabilities 699 864 – 948 – 1’803 1’389<br />
Experience gain / (loss) on plan assets 1’244 319 – 4’753 – 143 959<br />
Total actuarial gain / (loss) 22 1’133 – 5’701 – 1’032 2’348<br />
The expected employer’s contribution in 2011 amounts to <strong>CHF</strong> 1.3 <strong>million</strong>.<br />
91
92<br />
NOTES TO THE CONSOLIDATED FINANCIAL STATEMENTS<br />
FOR THE YEARS ENDED 31 DECEMBER 2010 AND 2009<br />
26. EMPLOYEE BENEFITS (CONTINUED)<br />
(b) Share-based payments<br />
Options and share grants<br />
The <strong>Group</strong> started to establish share option programs in 2000. Up until 30 June 2006 the option grants have been<br />
vested at grant. Thereafter the <strong>Group</strong> implemented vesting conditions consisting of a fi ve respectively six year<br />
service period. For more junior employees, the <strong>Group</strong> implemented a new plan with vesting conditions of a two year<br />
service period for 35% of the non-vested shares granted in 2010.<br />
Option and non-vested share grants Grant date<br />
Number of<br />
instruments Vesting conditions Expiry date<br />
Options 31.12.2002 4’779’300 none 30.06.2010<br />
Options 31.12.2003 1’393’740 none 30.06.2010<br />
Options 31.12.2004 1’229’535 none 30.06.2010<br />
Options 31.12.2005 1’738’170 none 31.12.2015<br />
Options 30.06.2006 26’700 none 30.06.2016<br />
Options 16.08.2006 26’700 5 years’ service 16.08.2016<br />
Options 09.10.2006 26’700 5 years’ service 09.10.2016<br />
Options 30.11.2006 8’549 none 30.11.2016<br />
Options 30.11.2006 324’720 5 years’ service 30.11.2016<br />
Options 30.11.2006 507’300 6 years’ service 30.11.2016<br />
Options 19.11.2007 921’140 5 years’ service 19.11.2017<br />
Options 24.11.2008 743’840 5 years’ service 24.11.2018<br />
Non-vested shares 24.11.2008 185’960 5 years’ service indefi nite<br />
Options 26.11.2009 4’070 none 26.11.2019<br />
Options 26.11.2009 269’880 5 years’ service 26.11.2019<br />
Non-vested shares 26.11.2009 134’940 5 years’ service indefi nite<br />
Options 17.11.2010 219’450 5 years’ service 17.11.2020<br />
Non-vested shares 17.11.2010 90’869 5 years’ service indefi nite<br />
Non-vested shares 17.11.2010 18’856 2 years’ service indefi nite<br />
Non-vested shares<br />
Total options / non-vested shares<br />
17.11.2010 10’905 2.3 yrs’ service indefi nite<br />
granted 12’661’324<br />
Options / non-vested shares expired /<br />
forfeited since inception – 523’148<br />
Repurchase / redemption of options 2004 – 1’201’500<br />
Exercised alongside IPO 2006 – 5’493’525<br />
Exercised 2007 – 160’200<br />
Exercised 2008 – 56’070<br />
Exercised 2009 – 53’400<br />
Exercised<br />
Net options outstanding as of<br />
2010 – 426’132<br />
31 December 2010 4’747’349
NOTES TO THE CONSOLIDATED FINANCIAL STATEMENTS<br />
FOR THE YEARS ENDED 31 DECEMBER 2010 AND 2009<br />
26. EMPLOYEE BENEFITS (CONTINUED)<br />
In 2010, the <strong>Group</strong> has further granted 5’330 (2009: 2’885) shares to new employees of the <strong>Group</strong>. These shares<br />
are subject to a vesting period of one year. However, the shares are in addition subject to a restriction period of<br />
maximum fi ve years, which will be shortened if the employee resigns from the <strong>Group</strong> before this date.<br />
Share grants Date<br />
Number of<br />
instruments Vesting conditions<br />
Shares 2006 13’241 1 year service<br />
Shares 2007 4’812 1 year service<br />
Shares 2008 5’070 1 year service<br />
Shares 2009 2’885 1 year service<br />
Shares 2010 5’330 1 year service<br />
The number and weighted average exercise prices of share options and non-vested shares are as follows:<br />
Weighted average<br />
Weighted average<br />
exercise price<br />
Number of exercise price<br />
Number of<br />
(in <strong>CHF</strong>)<br />
instruments<br />
(in <strong>CHF</strong>)<br />
instruments<br />
In effective number of options 2010 2010 2009 2009<br />
Outstanding at the beginning of the period 83.58 5’051’479 82.04 4’835’909<br />
Forfeited during the period 105.99 – 218’078 110.65 – 139’920<br />
Exercised during the period 3.91 – 426’132 1.87 – 53’400<br />
Granted during the period – options 209.00 219’450 150.00 273’950<br />
Granted during the period – shares – 120’630 – 134’940<br />
Outstanding at the end of the period 93.38 4’747’349 83.58 5’051’479<br />
Exercisable at the end of the period 1’602’890 395’160<br />
Of the outstanding 4’747’349 options and non-vested shares under the diverse programs of the <strong>Group</strong>, 1’602’890<br />
options are exercisable immediately and all other options are subject to a restriction period of at least until 30 June<br />
2011.<br />
The fair value of services in return for share options granted are measured by reference to the fair value of share<br />
options granted. The estimate of the fair value of the services received is measured based on a Black-Scholes model.<br />
Instead of the contractual life of the option, the input to the model is based on the expected time of execution,<br />
taking into account the exercise restriction of the options.<br />
93
94<br />
NOTES TO THE CONSOLIDATED FINANCIAL STATEMENTS<br />
FOR THE YEARS ENDED 31 DECEMBER 2010 AND 2009<br />
26. EMPLOYEE BENEFITS (CONTINUED)<br />
Fair value of share options and non-vested shares granted in 2010, and related assumptions<br />
Options Non-vested shares Non-vested shares Non-vested shares<br />
Date of grant 17.11.2010 17.11.2010 17.11.2010 17.11.2010<br />
Fair value per option / non-vested share at<br />
measurement date (in <strong>CHF</strong>) 27.60 174.20 174.20 174.20<br />
Share price (in <strong>CHF</strong>) 174.20 174.20 174.20 174.20<br />
Exercise price (in <strong>CHF</strong>) 209.00 – – –<br />
Expected volatility 33.90%<br />
Expected term of execution 5 years<br />
Expected dividend ratio<br />
Risk-free interest rate (based on Swap<br />
3.70%<br />
rates) 0.89%<br />
Total options/non-vested shares granted<br />
Amount to be recognized as service ex-<br />
219’450 90’869 18’856 10’905<br />
pense (in <strong>CHF</strong>) 6’056’820 14’246’442 2’956’244 1’709’686<br />
Amount recognized in current year (in<br />
<strong>CHF</strong>) 1’009’470 2’374’407 985’415 427’421<br />
Total amount recognized in current<br />
year (in <strong>CHF</strong>) 4’796’713<br />
As the Company’s stock has only been listed since 24 March 2006, the expected fi ve year volatility applied for the<br />
options granted in 2010 has been estimated by comparing the applicable historic volatility of the Company’s stock<br />
with the historic volatility of the MSCI World Index (“MXWO”). Based on this comparison the <strong>Group</strong> applied the respective<br />
ratio to the fi ve years historic volatility of the MXWO to derive the respective expected fi ve year volatility of<br />
the Company’s stock.<br />
Furthermore in 2010, the <strong>Group</strong> granted “non-vested shares” together with options. These shares are subject to<br />
vesting periods of either two years, two and one-third years, or fi ve years since they were granted.<br />
The <strong>Group</strong> already as of granting date recognized a sixth of the corresponding amount in the income statement in<br />
the year of grant. For the non-vested shares with a service period of 2 years, the <strong>Group</strong> already as of granting date<br />
recognized a third of the corresponding amount in the income statement.
NOTES TO THE CONSOLIDATED FINANCIAL STATEMENTS<br />
FOR THE YEARS ENDED 31 DECEMBER 2010 AND 2009<br />
27. DERIVATIVES ARISING FROM INSURANCE CONTRACTS<br />
(a) Introduction<br />
Pearl Holding Limited<br />
In 2000, the <strong>Group</strong> entered into an agreement with Pearl Holding Limited (“Pearl”) through its fully consolidated<br />
subsidiary Pearl Management Limited (“PML”), to act as a policyholder for an insurance entered into by a subsidiary<br />
of Swiss Re, insuring the repayment of the principal amount of a convertible bond issued by Pearl.<br />
PML only acts as policyholder and pays certain amounts into an experience account which serves as fi rst-level-coverage<br />
in the case of a default of Pearl. The <strong>Group</strong>’s exposure is dependent on the value development of the outstanding<br />
portfolio of Pearl and thus is classifi ed as a derivative fi nancial instrument. Given the exposure is limited to<br />
the value of the assets contained in the experience account, the <strong>Group</strong> has no net exposure left anymore relating<br />
to the agreement with Pearl.<br />
On 30 March 2006 the <strong>Group</strong> entered into an additional agreement with Swiss Re with regards to the extension of<br />
the term of the aforesaid bond from 30 September 2010 to 30 September 2014 and an increase of the redemption<br />
amount of the bond from EUR 660 <strong>million</strong> to EUR 712.8 <strong>million</strong>. The agreement became effective on 1 January<br />
2006. Under this agreement the <strong>Group</strong> has committed to invest an additional EUR 33 <strong>million</strong> into the experience<br />
account until 30 September 2010 to provide for further security. The discounted amount of EUR 28.5 <strong>million</strong> (<strong>CHF</strong><br />
44.8 <strong>million</strong> at the time) was paid into the experience account on 20 December 2006. The <strong>Group</strong>’s risk associated<br />
with its exposure as policyholder for Pearl is still limited to the value of the experience account; but the additional<br />
payment was recognized as an additional intangible asset (see note 13) and an additional derivative liability.<br />
(b) Basic assumptions<br />
The derivative is valued applying a Black-Scholes model. The following assumptions have been made for the input<br />
parameters of the model:<br />
2010 2009<br />
Net asset value (in relation to bond notional) 100% 88%<br />
Strike price (in <strong>million</strong>s) EUR 712.8 EUR 712.8<br />
Dividend yield 4.42% 5.07%<br />
Risk free interest rate (government bonds) 2.57% 2.44%<br />
Implicit volatility 12% 12%<br />
Term of option 30.09.2014 30.09.2014<br />
95
96<br />
NOTES TO THE CONSOLIDATED FINANCIAL STATEMENTS<br />
FOR THE YEARS ENDED 31 DECEMBER 2010 AND 2009<br />
27. DERIVATIVES ARISING FROM INSURANCE CONTRACTS<br />
(CONTINUED)<br />
Share price<br />
The share price refl ects the net asset value of the investment company as of the relevant balance sheet date.<br />
Strike price<br />
The strike price refl ects the redemption amount of the bond.<br />
Dividend yield<br />
The dividend yield refl ects the outfl ows of the investment company with regards to investment management fee,<br />
insurance premium and administration fees. The investment management fees as well as the insurance premium<br />
take into account a potential over-commitment of the product, as the fees are based on the higher of “net asset<br />
value of the investment company” or “net asset value of private equity assets invested plus unfunded commitments”.<br />
Since the second base may be higher than the net assets of the company, the dividend yield has to be adjusted<br />
accordingly to refl ect it.<br />
Implicit volatility<br />
The implicit volatility is based on the historic volatility for a comparable private equity portfolio, refl ecting the given<br />
level of diversifi cation in terms of stages, vintage years, industries and geographies.<br />
(c) Derivative liabilities arising from insurance contracts<br />
In thousands of Swiss francs 2010 2009<br />
Balance at beginning of period 96’618 91’654<br />
Change in fair value 3’436 5’580<br />
Effect of movements in exchange rates – 15’466 – 616<br />
Balance at end of period 84’588 96’618
NOTES TO THE CONSOLIDATED FINANCIAL STATEMENTS<br />
FOR THE YEARS ENDED 31 DECEMBER 2010 AND 2009<br />
28. OPERATING LEASES<br />
Leases as a lessee<br />
Non-cancelable operating lease rentals are payable as follows:<br />
In thousands of Swiss francs 2010 2009<br />
Less than one year 6’035 3’030<br />
Between one and fi ve years 25’043 15’026<br />
More than fi ve years 11’703 835<br />
Total 42’781 18’891<br />
The <strong>Group</strong> classifi es its offi ce rental liabilities under operating leases. The offi ce leases typically run for an initial<br />
period of two to fi ve years, with an option to renew the lease after that date. None of the leases include contingent<br />
rentals.<br />
During the current year <strong>CHF</strong> 4.3 <strong>million</strong> was recognized as an expense in the income statement in respect of operating<br />
leases (2009: <strong>CHF</strong> 4.3 <strong>million</strong>).<br />
29. CAPITAL COMMITMENTS<br />
As of 31 December 2010 the <strong>Group</strong> had capital commitment contracts for <strong>CHF</strong> 173.3 <strong>million</strong> (2009: <strong>CHF</strong> 165.8 <strong>million</strong>),<br />
whereof <strong>CHF</strong> 72.8 <strong>million</strong> (2009: <strong>CHF</strong> 81.5 <strong>million</strong>) were not yet called by the relevant investment manager.<br />
The capital commitments are called over time, usually between one to fi ve years since subscription for the commitment.<br />
In addition the <strong>Group</strong> may selectively enter into capital commitment contracts to bridge investments for investment<br />
products managed by the <strong>Group</strong> (see note 15).<br />
As described in note 18, the <strong>Group</strong> entered into 3-year term loans and revolving facilities with three investment<br />
structures. Currently the <strong>Group</strong> participates with a maximum credit amount of EUR 101.3 <strong>million</strong> of which EUR 69.3<br />
<strong>million</strong> have been drawn as at the end of the reporting period. Therefore a further EUR 32.0 <strong>million</strong> is still available<br />
to the three investment structures.<br />
30. CONTINGENCIES<br />
The <strong>Group</strong> currently has contingent assets resulting from the sale of <strong>Partners</strong> <strong>Group</strong> Fund Services Limited, Guernsey,<br />
where the transaction price includes potential earn-out payments. Currently the future fi nancial impact cannot<br />
be assessed.<br />
The <strong>Group</strong> currently has no contingent liabilities.<br />
97
98<br />
NOTES TO THE CONSOLIDATED FINANCIAL STATEMENTS<br />
FOR THE YEARS ENDED 31 DECEMBER 2010 AND 2009<br />
31. RELATED PARTY TRANSACTIONS<br />
The <strong>Group</strong> has a related party relationship with its subsidiaries (see note 32), associates (see note 14), investment<br />
companies/vehicles (see note 15 and 16), with its pension funds (see note 26) and with its management and significant<br />
shareholders.<br />
Associates purchased services from the <strong>Group</strong> in the amount of <strong>CHF</strong> 0.3 <strong>million</strong> (2009: <strong>CHF</strong> 0.3 <strong>million</strong>) and at<br />
the balance sheet date associates owed <strong>CHF</strong> 75’000 to the <strong>Group</strong> (2009: <strong>CHF</strong> nil). The <strong>Group</strong> received dividends of<br />
<strong>CHF</strong> 3.0 <strong>million</strong> (2009: <strong>CHF</strong> 4.4 <strong>million</strong>) from associates.<br />
Loans to directors and offi cers of the <strong>Group</strong> amount to <strong>CHF</strong> 3.2 <strong>million</strong> (2009: <strong>CHF</strong> 3.7 <strong>million</strong>) and are included in<br />
“other fi nancial assets” (see note 16).<br />
The <strong>Group</strong> purchased treasury shares from its shareholders as follows (see also note 21):<br />
In effective number of shares 2010 2009<br />
From shareholders, which are employed by the <strong>Group</strong> 642’384 411’964<br />
642’384 411’964<br />
Purchase price per share <strong>CHF</strong> 128.57 <strong>CHF</strong> 118.44<br />
The <strong>Group</strong> is managed by the Board of Directors of the Company and the Executive Board of the <strong>Group</strong>. The total<br />
personnel expenses for the Board of Directors of the Company as well as the Executive Board of the <strong>Group</strong> included<br />
in personnel expenses (see note 9) amounts to:<br />
In thousands of Swiss francs 2010 2009<br />
Board members of <strong>Partners</strong> <strong>Group</strong> Holding AG:<br />
Short-term employment benefi ts 1’100 800<br />
Post-employment benefi ts 143 129<br />
Share-based payment expenses – 100<br />
Executive Board:<br />
1’243 1’029<br />
Short-term employment benefi ts 6’941 4’415<br />
Post-employment benefi ts 614 578<br />
Share-based payment expenses 2’247 1’164<br />
9’802 6’157<br />
Total Board members and Executive Board 11’045 7’186<br />
The <strong>Group</strong> provides the members of the Board of Directors and the Executive Board who hold investments in <strong>Partners</strong><br />
<strong>Group</strong> products with a partial rebate on management fees (i.e. preferential management fee rates are granted).<br />
The same conditions apply to all employees.
NOTES TO THE CONSOLIDATED FINANCIAL STATEMENTS<br />
FOR THE YEARS ENDED 31 DECEMBER 2010 AND 2009<br />
31. RELATED PARTY TRANSACTIONS (CONTINUED)<br />
The Board of Directors of the Company and the Executive Board of the <strong>Group</strong> can also participate in the <strong>Group</strong>’s<br />
share option program (see note 26). At the relevant balance sheet date, they were entitled to the following number<br />
of options, non-vested shares and shares:<br />
In effective number of options and non-vested shares 2010 2009<br />
Board members 9’331 9’331<br />
Members of the Executive Board 942’298 942’500<br />
Total 951’629 951’831<br />
Outstanding shares<br />
In effective number of shares 2010 2009<br />
Board members 11’380’978 11’380’978<br />
Members of the Executive Board 1’381’490 1’709’350<br />
Total 12’762’468 13’090’328<br />
For further information in accordance with Art. 663bbis and 663c Swiss Code of Obligations refer to the entity accounts<br />
of <strong>Partners</strong> <strong>Group</strong> Holding AG.<br />
99
100<br />
NOTES TO THE CONSOLIDATED FINANCIAL STATEMENTS<br />
FOR THE YEARS ENDED 31 DECEMBER 2010 AND 2009<br />
32. GROUP ENTITIES<br />
Name<br />
Country of<br />
incorporation Ownership interest<br />
2010 2009<br />
(a) Signifi cant subsidiaries<br />
(full consolidation)<br />
<strong>Partners</strong> <strong>Group</strong> AG Switzerland 100% 100%<br />
Asset Management <strong>Partners</strong> AG Switzerland 84% 84%<br />
Alternative Beta <strong>Partners</strong> AG Switzerland 55% n/a<br />
<strong>Partners</strong> <strong>Group</strong> (Luxembourg) S.à r.l. Luxembourg 100% 100%<br />
<strong>Partners</strong> <strong>Group</strong> Management I S.à r.l. Luxembourg 100% 100%<br />
<strong>Partners</strong> <strong>Group</strong> Management II S.à r.l. Luxembourg 100% 100%<br />
<strong>Partners</strong> <strong>Group</strong> Management (Deutschland) GmbH 1) Germany 100% 100%<br />
<strong>Partners</strong> <strong>Group</strong> (Guernsey) Limited Guernsey 100% 100%<br />
<strong>Partners</strong> <strong>Group</strong> Management Limited Guernsey 100% 100%<br />
<strong>Partners</strong> <strong>Group</strong> Management II Limited Guernsey 100% 100%<br />
<strong>Partners</strong> <strong>Group</strong> Management III Limited Guernsey 100% 100%<br />
<strong>Partners</strong> <strong>Group</strong> Management IV Limited Guernsey 100% 100%<br />
<strong>Partners</strong> <strong>Group</strong> Management V Limited Guernsey 100% 100%<br />
<strong>Partners</strong> <strong>Group</strong> Management VI Limited Guernsey 100% 100%<br />
<strong>Partners</strong> <strong>Group</strong> Management VII Limited Guernsey 100% 100%<br />
<strong>Partners</strong> <strong>Group</strong> Management VIII Limited Guernsey 100% 100%<br />
<strong>Partners</strong> <strong>Group</strong> Management IX Limited Guernsey 100% 100%<br />
<strong>Partners</strong> <strong>Group</strong> Management X Limited Guernsey 100% 100%<br />
<strong>Partners</strong> <strong>Group</strong> Management XI Limited Guernsey 100% 100%<br />
<strong>Partners</strong> <strong>Group</strong> Fund Services Limited Guernsey n/a 100%<br />
<strong>Partners</strong> <strong>Group</strong> Finance ICC Limited Guernsey 100% 100%<br />
<strong>Partners</strong> <strong>Group</strong> Finance <strong>CHF</strong> IC Limited Guernsey 100% 100%<br />
<strong>Partners</strong> <strong>Group</strong> Finance EUR IC Limited Guernsey 100% 100%<br />
<strong>Partners</strong> <strong>Group</strong> Finance GBP IC Limited Guernsey 100% 100%<br />
<strong>Partners</strong> <strong>Group</strong> Finance USD IC Limited Guernsey 100% 100%<br />
Pearl Management Limited Guernsey 100% 100%<br />
Penta Management Limited Guernsey 100% 100%<br />
Princess Management Limited Guernsey 100% 100%<br />
<strong>Partners</strong> Private Equity Management Limited Guernsey 100% 100%<br />
<strong>Partners</strong> Private Equity Management Inc. Cayman Islands 100% 100%<br />
<strong>Partners</strong> <strong>Group</strong> (Scotland) Limited Scotland 100% 100%<br />
<strong>Partners</strong> <strong>Group</strong> Management (Scots) LLP Scotland 100% n/a<br />
<strong>Partners</strong> <strong>Group</strong> (UK) Limited UK 100% 100%<br />
<strong>Partners</strong> <strong>Group</strong> (USA) Inc. USA 100% 100%<br />
<strong>Partners</strong> <strong>Group</strong> Real Estate LLC USA 100% 100%<br />
<strong>Partners</strong> <strong>Group</strong> US Management LLC USA 100% 100%<br />
<strong>Partners</strong> <strong>Group</strong> (Singapore) Pte Limited Singapore 100% 100%<br />
(b) Investments in associates<br />
(equity method)<br />
LGT Private Equity Advisers Liechtenstein 40% 40%<br />
1) formerly known as: <strong>Partners</strong> <strong>Group</strong> (Deutschland) GmbH
NOTES TO THE CONSOLIDATED FINANCIAL STATEMENTS<br />
FOR THE YEARS ENDED 31 DECEMBER 2010 AND 2009<br />
33. SUBSEQUENT EVENTS<br />
No events took place between 31 December 2010 and 1 March 2011 that would require material adjustments to the<br />
amounts recognized in these consolidated fi nancial statements.<br />
101
102<br />
This page has been left blank intentionally.
INDEX TO THE FINANCIAL STATEMENTS PARTNERS GROUP<br />
HOLDING AG AND REPORT OF THE AUDITORS<br />
1. Report of the Auditors on the Financial Statements of <strong>Partners</strong> <strong>Group</strong> Holding AG 104<br />
2. Financial Statements of <strong>Partners</strong> <strong>Group</strong> Holding AG<br />
– Income statement for the years ended 31 December 2010 and 2009 106<br />
– Balance sheet as of 31 December 2010 and 2009 107<br />
– Notes to the fi nancial statements for the years ended 31 December 2010 and 2009 108<br />
3. Proposal by the Board of Directors of <strong>Partners</strong> <strong>Group</strong> Holding AG<br />
for the appropriation of available earnings as of 31 December 117<br />
103
104<br />
R E P O R T O F T H E A U D I T O R S O N T H E F I N A N C I A L S T A T E M E N T S<br />
O F P A R T N E R S G R O U P H O L D I N G A G
R E P O R T O F T H E A U D I T O R S O N T H E F I N A N C I A L S T A T E M E N T S<br />
O F P A R T N E R S G R O U P H O L D I N G A G<br />
105
106<br />
INCOME STATEMENT OF PARTNERS GROUP HOLDING AG<br />
FOR THE YEARS ENDED 31 DECEMBER 2010 AND 2009<br />
In thousands of Swiss francs 2010 2009<br />
Income from fi nancial investments 208’771 235’421<br />
Value adjustments on fi nancial investments 2’292 3’461<br />
Other fi nancial income 11’637 2’147<br />
Total income 222’700 241’029<br />
Personnel expenses – – 2<br />
General and administrative expenses – 635 – 679<br />
Other fi nancial expenses – 42’524 – 7’920<br />
Profi t before taxes 179’541 232’428<br />
Taxes – 9’051 – 1’207<br />
Net profi t for the period 170’490 231’221
BALANCE SHEET OF PARTNERS GROUP HOLDING AG<br />
AS OF 31 DECEMBER 2010 AND 2009<br />
In thousands of Swiss francs Note 2010 2009<br />
Assets<br />
Current assets<br />
Cash and cash equivalents 172’859 163’515<br />
Securities 488 10’170<br />
Treasury shares 3 172’388 169’019<br />
Accounts receivables<br />
Other receivables:<br />
70 18<br />
– third parties 197 13’332<br />
– group companies 46’922 33’172<br />
Deferred expenses and accrued income 51’062 54’205<br />
Total current assets 443’986 443’431<br />
Non-current assets<br />
Financial investments:<br />
– participations 2 342’013 237’296<br />
– loans to employees 3’146 3’664<br />
– other fi nancial assets 5’774 5’645<br />
Total non-current assets 350’933 246’605<br />
Total assets 794’919 690’036<br />
Liabilities and shareholders’ equity<br />
Liabilities<br />
Other current liabilities:<br />
– third parties 9’428 581<br />
– group companies 120’226 85’511<br />
Accrued expenses 1’742 115<br />
Total liabilities 131’396 86’207<br />
Shareholders’ equity<br />
Share capital<br />
General legal reserves:<br />
267 267<br />
– legal reserves 1 218<br />
– legal reserves from capital contributions 217 –<br />
– reserves for treasury shares 3 257’043 206’617<br />
– reserves for options granted<br />
Available earnings:<br />
100 100<br />
– retained earnings 4 235’405 165’406<br />
– net profi t for the period 170’490 231’221<br />
Total shareholders’ equity 663’523 603’829<br />
Total liabilities and shareholders’ equity 794’919 690’036<br />
107
108<br />
NOTES TO THE FINANCIAL STATEMENTS<br />
OF PARTNERS GROUP HOLDING AG<br />
1. ACCOUNTING PRINCIPLES<br />
These fi nancial statements have been estatblished according to the accounting, presentation and valuation principles<br />
of the Swiss Code of Obligations.<br />
2. COMMITMENTS AND CONTINGENT LIABILITIES<br />
In thousands of Swiss francs 2010 2009<br />
Guarantees<br />
Guarantees for subsidiaries 53’035 30’840
NOTES TO THE FINANCIAL STATEMENTS<br />
OF PARTNERS GROUP HOLDING AG<br />
3. PARTICIPATIONS<br />
Share capital Ownership interest<br />
In thousands of currency units 2010 2009 2010 2009<br />
<strong>Partners</strong> <strong>Group</strong> AG, Baar <strong>CHF</strong> 200 <strong>CHF</strong> 200 100% 100%<br />
Princess Management Limited, Guernsey USD 600 USD 600 100% 100%<br />
<strong>Partners</strong> <strong>Group</strong> (USA) Inc, New York USD 75 USD 75 100% 100%<br />
<strong>Partners</strong> <strong>Group</strong> (Guernsey) Limited, Guernsey GBP 40 GBP 40 100% 100%<br />
<strong>Partners</strong> <strong>Group</strong> (UK) Limited, London GBP 450 GBP 450 100% 100%<br />
<strong>Partners</strong> <strong>Group</strong> (Luxembourg) S.à r.l., Luxembourg EUR 4’985 EUR 4’985 100% 100%<br />
<strong>Partners</strong> <strong>Group</strong> (Singapore) Pte Limited, Singapore SGD – SGD – 100% 100%<br />
Pearl Management Limited, Guernsey EUR 20 EUR 20 100% 100%<br />
<strong>Partners</strong> <strong>Group</strong> Fund Services Limited, Guernsey n/a n/a USD 200 n/a 100%<br />
Penta Management Limited, Guernsey EUR 20 EUR 20 100% 100%<br />
<strong>Partners</strong> Private Equity Management Inc, Cayman Island USD – USD – 100% 100%<br />
<strong>Partners</strong> Private Equity Management Limited, Guernsey <strong>CHF</strong> – <strong>CHF</strong> – 100% 100%<br />
LGT Private Equity Advisers AG, Vaduz<br />
<strong>Partners</strong> <strong>Group</strong> Private Equity Performance Holding<br />
<strong>CHF</strong> 1’000 <strong>CHF</strong> 1’000 40% 40%<br />
Limited, Guernsey EUR 10 EUR 10 100% 100%<br />
Pearl Holding Limited, Guernsey EUR 10 EUR 10 100% 100%<br />
<strong>Partners</strong> <strong>Group</strong> Management Limited, Guernsey EUR 20 EUR 20 100% 100%<br />
<strong>Partners</strong> <strong>Group</strong> Management II Limited, Guernsey EUR 20 EUR 20 100% 100%<br />
<strong>Partners</strong> <strong>Group</strong> Management III Limited, Guernsey EUR 20 EUR 20 100% 100%<br />
<strong>Partners</strong> <strong>Group</strong> Management IV Limited, Guernsey EUR 20 EUR 20 100% 100%<br />
<strong>Partners</strong> <strong>Group</strong> Management V Limited, Guernsey USD 20 USD 20 100% 100%<br />
<strong>Partners</strong> <strong>Group</strong> Management VI Limited, Guernsey EUR 20 EUR 20 100% 100%<br />
<strong>Partners</strong> <strong>Group</strong> Management VII Limited, Guernsey USD 20 USD 20 100% 100%<br />
<strong>Partners</strong> <strong>Group</strong> Management VIII Limited, Guernsey EUR 20 EUR 20 100% 100%<br />
<strong>Partners</strong> <strong>Group</strong> Management IX Limited, Guernsey EUR 20 EUR 20 100% 100%<br />
<strong>Partners</strong> <strong>Group</strong> Management X Limited, Guernsey USD 20 USD 20 100% 100%<br />
<strong>Partners</strong> <strong>Group</strong> Management XI Limited, Guernsey USD 28 USD 28 100% 100%<br />
<strong>Partners</strong> <strong>Group</strong> Management I S.à r.l., Luxembourg EUR 31 EUR 31 100% 100%<br />
<strong>Partners</strong> <strong>Group</strong> Management II S.à r.l., Luxembourg<br />
<strong>Partners</strong> <strong>Group</strong> Management (Deutschland) GmbH, Munich<br />
EUR 31 EUR 31 100% 100%<br />
1) EUR 25 EUR 25 100% 100%<br />
<strong>Partners</strong> <strong>Group</strong> Finance ICC Limited, Guernsey <strong>CHF</strong> – <strong>CHF</strong> – 100% 100%<br />
Asset Management <strong>Partners</strong> AG, Baar <strong>CHF</strong> 200 <strong>CHF</strong> 200 84% 84%<br />
Alternative Beta <strong>Partners</strong> AG, Baar <strong>CHF</strong> 100 n/a n/a 55% n/a<br />
1) formerly known as: <strong>Partners</strong> <strong>Group</strong> (Deutschland) GmbH<br />
109
110<br />
NOTES TO THE FINANCIAL STATEMENTS<br />
OF PARTNERS GROUP HOLDING AG<br />
4. NUMBER OF TREASURY SHARES AS OF 31 DECEMBER<br />
Number of<br />
shares<br />
Average<br />
price<br />
In Swiss francs<br />
Total<br />
value<br />
In thousands of<br />
Swiss francs<br />
Balance as of 1 January 2009 2’044’446<br />
Purchase of treasury shares for cash 1’328’486 108.41 144’020<br />
Exercised options – 80’100 11.23 – 900<br />
Sale of treasury shares for cash – 1’339’443 101.74 – 136’277<br />
Balance as of 31 December 2009 1’953’389<br />
Purchase of treasury shares for cash 1’876’385 142.88 268’095<br />
Shares forfeited during the period 15’872 77.86 1’236<br />
Shares granted during the period – 118’037 161.93 – 19’114<br />
Exercised options – 399’432 2.54 – 1’016<br />
Sale of treasury shares for cash – 1’375’356 151.12 – 207’848<br />
Balance as of 31 December 2010 1’952’821<br />
The shares are valued at the lower of transactions or market price. The average value per share amounts to <strong>CHF</strong><br />
88.28 (31 December 2009: <strong>CHF</strong> 86.53).<br />
The company has 4’747’349 (31 December 2009: 5’051’479) outstanding employee options (including non-vested<br />
shares) which will vest over the next 10 years (see also note 26 of the consolidated fi nancial statements).<br />
5. RETAINED EARNINGS<br />
In thousands of Swiss francs 2010 2009<br />
Balance as of 1 January 165’406 43’694<br />
Allocation of previous year’s result 231’221 215’237<br />
Payment of dividend<br />
Net treasury shares bought in period /<br />
– 110’796 – 105’365<br />
reallocation to reserve for treasury shares – 50’426 11’840<br />
Balance as of 31 December 235’405 165’406<br />
6. GENERAL LEGAL RESERVES<br />
Due to new regulations, <strong>Partners</strong> <strong>Group</strong> Holding AG split the legal reserves into legal reserves of <strong>CHF</strong> 1’000 and legal<br />
reserves from capital contributions of <strong>CHF</strong> 217’100 as of 31 December 2010.
NOTES TO THE FINANCIAL STATEMENTS<br />
OF PARTNERS GROUP HOLDING AG<br />
7. CONDITIONAL CAPITAL<br />
The annual general meeting on 27 April 2007 approved the increase of the conditional capital for employee options<br />
to:<br />
2010 2009<br />
Number of registered shares 4’005’000 4’005’000<br />
Par value (in Swiss francs) 40’050 40’050<br />
8. SHAREHOLDERS ABOVE 5% (IN % OF SHARES ISSUED)<br />
2010 2009<br />
Gantner Alfred 14.20% 14.20%<br />
Erni Marcel 14.20% 14.20%<br />
Wietlisbach Urs 14.20% 14.20%<br />
111
112<br />
NOTES TO THE FINANCIAL STATEMENTS<br />
OF PARTNERS GROUP HOLDING AG<br />
9. RISK ASSESSMENT DISCLOSURE IN ACCORDANCE WITH ART.<br />
663B PAR. 12 SWISS CODE OF OBLIGATIONS<br />
The Board of Directors performed an assessment of the risks to which <strong>Partners</strong> <strong>Group</strong> Holding AG is exposed to at<br />
its meeting on 17 November 2010. The risk management covers in particular the strategic and business risks, operational<br />
risks, fi nancial risks as well as reputational risks. The Board of Directors has taken into consideration the internal<br />
control system designed to monitor and reduce the risks of the company for its assessment.
NOTES TO THE FINANCIAL STATEMENTS<br />
OF PARTNERS GROUP HOLDING AG<br />
10. MANAGEMENT COMPENSATION IN ACCORDANCE<br />
WITH ART. 663B BIS SWISS CODE OF OBLIGATIONS<br />
In thousands of Swiss francs 2010<br />
Base<br />
compensation<br />
(cash)<br />
Variable<br />
compensation<br />
(cash bonus)<br />
Other<br />
compensation 1)<br />
Options/<br />
shares Total4) Board of Directors<br />
Gantner Alfred, Executive Chairman 300 – 36 – 336<br />
Erni Marcel, Executive Vice Chairman 300 – 43 – 343<br />
Wietlisbach Urs, Executive Vice Chairman 300 – 44 – 344<br />
Fehring Ulrich 50 – 2 – 52<br />
Wuffl i Peter 100 – 14 – 114<br />
Zürcher Wolfgang 50 – 4 – 54<br />
Total Board of Directors 1’100 – 143 – 1’243<br />
Executive Board<br />
Meister Steffen, Chief Executive Offi cer 270 630 71 344 1’315<br />
Wenger Jürg, Chief Operating Offi cer 270 330 51 – 651<br />
Wipfl i Cyrill, Chief Financial Offi cer 220 230 41 229 720<br />
Alsterlind Pamela 261 365 26 8713) 1’523<br />
Biner Rene 250 350 45 – 645<br />
Birchler Kurt 270 330 44 – 644<br />
Gysler Philipp 2) 250 350 109 – 709<br />
Haldner Felix 270 380 67 344 1’061<br />
Näf Stefan 270 430 64 459 1’223<br />
Schäli Stephan 270 430 48 – 748<br />
Trommsdorff Tilman 270 245 48 – 563<br />
Total Executive Board 2’871 4’070 614 2’247 9’802<br />
1) Amounts include payments by the <strong>Group</strong> for pension and other benefi ts<br />
2) Member of Executive Board until 30 September 2010<br />
3) Not provided under the regular equity incentive system within the annual compensation of 2010 but in conjunction with the acquisition of PCA Real<br />
Estate Asset Management LLC as of 1 July 2007<br />
4) Amounts include payments of all <strong>Group</strong> entities<br />
113
114<br />
NOTES TO THE FINANCIAL STATEMENTS<br />
OF PARTNERS GROUP HOLDING AG<br />
10. MANAGEMENT COMPENSATION IN ACCORDANCE WITH<br />
ART. 663B BIS SWISS CODE OF OBLIGATIONS (CONTINUED)<br />
In thousands of Swiss francs 2009<br />
Base<br />
compensation<br />
(cash)<br />
Variable<br />
compensation<br />
(cash bonus)<br />
Other<br />
compensation 1)<br />
Options/<br />
shares Total<br />
Board of Directors<br />
Gantner Alfred, Executive Chairman 250 – 87 – 337<br />
Erni Marcel, Executive Vice Chairman 250 – 55 – 305<br />
Wietlisbach Urs, Executive Vice Chairman 250 – 92 – 342<br />
Fehring Ulrich 50 – 2 – 52<br />
Wuffl i Peter – – – 50 50<br />
Zürcher Wolfgang – – – 50 50<br />
Total Board of Directors 800 – 236 100 1’136<br />
Executive Board<br />
Meister Steffen, Chief Executive Offi cer 263 387 45 – 695<br />
Wenger Jürg, Chief Operating Offi cer 270 210 59 – 539<br />
Birchler Kurt, Chief Financial Offi cer 270 180 64 291 805<br />
Biner Rene 250 190 59 291 790<br />
Gysler Philipp 250 250 112 – 612<br />
Haldner Felix 250 250 59 – 559<br />
Näf Stefan 270 205 62 291 828<br />
Schäli Stephan 270 230 64 291 855<br />
Trommsdorff Tilman 270 150 54 – 474<br />
Total Executive Board 2’363 2’052 578 1’164 6’157<br />
1) Amounts include payments by the <strong>Group</strong> for pension and other benefi ts (including fee rebates on personally held <strong>Partners</strong> <strong>Group</strong> products)
NOTES TO THE FINANCIAL STATEMENTS<br />
OF PARTNERS GROUP HOLDING AG<br />
11. MANAGEMENT SHARE OWNERSHIP IN ACCORDANCE<br />
WITH ART. 663C SWISS CODE OF OBLIGATIONS<br />
Number of shares / options held as of 31 December 2010 2010<br />
Share<br />
ownership<br />
Non-vested<br />
shares Options<br />
Board of Directors<br />
Gantner Alfred, Executive Chairman 3’790’326 – –<br />
Erni Marcel, Executive Vice Chairman 3’790’326 – –<br />
Wietlisbach Urs, Executive Vice Chairman 3’790’326 – –<br />
Fehring Ulrich 2’500 – 3’288<br />
Wuffl i Peter 6’000 – 2’035<br />
Zürcher Wolfgang 1’500 – 4’008<br />
Executive Board<br />
Meister Steffen, Chief Executive Offi cer 467’250 7’900 188’800<br />
Wenger Jürg, Chief Operating Offi cer 160’000 1’600 33’100<br />
Wipfl i Cyrill, Chief Financial Offi cer 13’450 5’200 66’900<br />
Alsterlind Pamela 1’540 9’998 52’200<br />
Biner Rene 61’200 5’000 99’800<br />
Birchler Kurt 40’000 1’800 83’700<br />
Haldner Felix 347’100 4’700 95’900<br />
Näf Stefan 66’750 8’600 136’900<br />
Schäli Stephan 144’200 5’800 99’700<br />
Trommsdorff Tilman 80’000 1’600 33’100<br />
Total 12’762’468 52’198 899’431<br />
115
116<br />
NOTES TO THE FINANCIAL STATEMENTS<br />
OF PARTNERS GROUP HOLDING AG<br />
11. MANAGEMENT SHARE OWNERSHIP IN ACCORDANCE<br />
WITH ART. 663C SWISS CODE OF OBLIGATIONS<br />
(CONTINUED)<br />
Number of shares / options held as of 31 December 2009 2009<br />
Share<br />
ownership<br />
Non-vested<br />
shares Options<br />
Board of Directors<br />
Gantner Alfred, Executive Chairman 3’790’326 – –<br />
Erni Marcel, Executive Vice Chairman 3’790’326 – –<br />
Wietlisbach Urs, Executive Vice Chairman 3’790’326 – –<br />
Fehring Ulrich 2’500 – 3’288<br />
Wuffl i Peter 6’000 – 2’035<br />
Zürcher Wolfgang 1’500 – 4’008<br />
Executive Board<br />
Meister Steffen, Chief Executive Offi cer 534’000 6’400 185’800<br />
Wenger Jürg, Chief Operating Offi cer 168’900 1’600 33’100<br />
Birchler Kurt, Chief Financial Offi cer 121’300 1’800 83’700<br />
Biner Rene 66’200 5’000 99’800<br />
Gysler Philipp 152’500 3’200 92’900<br />
Haldner Felix 347’100 3’200 92’900<br />
Näf Stefan 13’350 6’600 186’300<br />
Schäli Stephan 196’000 5’800 99’700<br />
Trommsdorff Tilman 110’000 1’600 33’100<br />
Total 13’090’328 35’200 916’631
PROPOSAL FOR THE APPROPRIATION OF<br />
AVAILABLE EARNINGS<br />
PROPOSAL BY THE BOARD OF DIRECTORS OF PARTNERS GROUP<br />
HOLDING AG FOR THE APPROPRIATION OF AVAILABLE<br />
EARNINGS AS OF 31 DECEMBER<br />
In thousands of Swiss francs 2010 2009<br />
Profi t for the year 170’490 231’221<br />
Retained earnings 235’405 165’406<br />
Available earnings 405’895 396’627<br />
Proposal by the Board of Directors to the General Meeting:<br />
To be distributed to shareholders – 133’500 – 110’796<br />
To be carried forward 272’395 285’831<br />
117
118<br />
IN SEARCH OF INVESTMENT<br />
OPPORTUNITIES AROUND THE WORLD<br />
Rene Biner Head Private Finance, Juri Jenkner Head London and Manuel Martiny<br />
Investment Solutions Germany.
CORPORATE GOVERNANCE<br />
<strong>Partners</strong> <strong>Group</strong> is committed to meeting high standards<br />
of corporate governance, with the aim of guiding our<br />
company to further success. <strong>Partners</strong> <strong>Group</strong> bases its<br />
corporate governance on the “Swiss Code of Best Practice<br />
for Corporate Governance” issued by economiesuisse<br />
and the “Directive on Information relating to Corporate<br />
Governance” issued by the SIX Swiss Exchange.<br />
The Corporate Governance section contains information<br />
on the following:<br />
1. <strong>Group</strong> structure and shareholders<br />
2. Capital structure<br />
3. Board of directors<br />
4. Executive board<br />
5. Compensation, shareholdings and loans<br />
6. Shareholders’ participation<br />
7. Changes of control and defense measures<br />
8. Auditors<br />
9. Information policy<br />
Operating<br />
companies<br />
Other<br />
investment<br />
management<br />
companies<br />
Special purpose<br />
vehicles,<br />
joint ventures,<br />
investment<br />
companies<br />
100%<br />
<strong>Partners</strong> <strong>Group</strong><br />
AG<br />
(Switzerland)<br />
100%<br />
<strong>Partners</strong> <strong>Group</strong><br />
Management<br />
(Deutschland)<br />
GmbH<br />
(Germany)<br />
100%<br />
<strong>Partners</strong> <strong>Group</strong><br />
Management<br />
Ltd.<br />
(Guernsey)<br />
100%<br />
<strong>Partners</strong> <strong>Group</strong><br />
Management X<br />
Ltd.<br />
(Guernsey)<br />
LGT Private<br />
Equity<br />
Advisers AG<br />
(Liechtenstein)<br />
<strong>Partners</strong> <strong>Group</strong><br />
(UK) Ltd.<br />
(England)<br />
Pearl Holding<br />
Ltd.<br />
(Guernsey)<br />
100%<br />
<strong>Partners</strong> Private<br />
Equity<br />
Management Ltd.<br />
(Guernsey)<br />
100%<br />
<strong>Partners</strong> <strong>Group</strong><br />
Management II<br />
Ltd.<br />
(Guernsey)<br />
<strong>Partners</strong> <strong>Group</strong><br />
Management XI<br />
Ltd<br />
(Guernsey)<br />
100%<br />
<strong>Partners</strong> <strong>Group</strong><br />
(Singapore)<br />
Pte. Ltd.<br />
(Singapore)<br />
100%<br />
<strong>Partners</strong> Private<br />
Equity<br />
Management Inc.<br />
(Cayman Isl.)<br />
100% 100%<br />
100%<br />
<strong>Partners</strong> <strong>Group</strong><br />
Management III<br />
Ltd.<br />
(Guernsey)<br />
Princess<br />
Management Ltd.<br />
(Guernsey)<br />
100%<br />
40% 100% 100%<br />
<strong>Partners</strong> <strong>Group</strong><br />
Private Equity<br />
Performance<br />
Holding Ltd.<br />
(Guernsey)<br />
<strong>Partners</strong> <strong>Group</strong><br />
Holding AG<br />
(Switzerland)<br />
84%<br />
<strong>Partners</strong> <strong>Group</strong><br />
(Luxembourg)<br />
S.àr.l.<br />
(Luxembourg)<br />
Pearl<br />
Management Ltd.<br />
(Guernsey)<br />
100%<br />
100%<br />
<strong>Partners</strong> <strong>Group</strong><br />
Management IV<br />
Ltd.<br />
(Guernsey)<br />
100%<br />
<strong>Partners</strong> <strong>Group</strong><br />
Management I<br />
S.à r.l.<br />
(Luxembourg)<br />
In this corporate governance report, references to<br />
“<strong>Partners</strong> <strong>Group</strong>”, “<strong>Partners</strong> <strong>Group</strong> Holding”, the “fi rm”,<br />
the “company”, “we”, “us” and “our” are to <strong>Partners</strong><br />
<strong>Group</strong> Holding AG together with its consolidated subsidiaries,<br />
unless the context requires otherwise.<br />
1. <strong>Group</strong> structure and shareholders<br />
1.1 <strong>Group</strong> structure<br />
<strong>Partners</strong> <strong>Group</strong> Holding operates through majority or<br />
wholly owned subsidiaries in Switzerland, the United<br />
Kingdom, the United States, Singapore, Guernsey and<br />
other jurisdictions. The chart below provides an overview<br />
of the group structure as of 31 December 2010.<br />
1.1.1 Listed companies belonging to the <strong>Group</strong><br />
<strong>Partners</strong> <strong>Group</strong> Holding is a stock corporation incorporated<br />
under Swiss law with its registered offi ce and<br />
headquarter at Zugerstrasse 57, 6341 Baar-Zug. <strong>Partners</strong><br />
<strong>Group</strong> Holding is listed on the SIX Swiss Exchange<br />
under Swiss Security Number 002460882 and ISIN<br />
number CH0024608827. The market capitalization of<br />
55%<br />
Alternative Beta<br />
<strong>Partners</strong> AG<br />
(Switzerland)<br />
100%<br />
Penta<br />
Management<br />
Ltd.<br />
(Guernsey)<br />
<strong>Partners</strong> <strong>Group</strong><br />
Management V<br />
Ltd.<br />
(Guernsey)<br />
100%<br />
100%<br />
<strong>Partners</strong> <strong>Group</strong><br />
Management II<br />
S.à r.l.<br />
(Luxembourg)<br />
84%<br />
Asset<br />
Management<br />
<strong>Partners</strong> AG<br />
(Switzerland)<br />
100%<br />
<strong>Partners</strong> <strong>Group</strong><br />
Finance ICC Ltd.<br />
(Guernsey)<br />
<strong>Partners</strong> <strong>Group</strong><br />
Management VI<br />
Ltd.<br />
(Guernsey)<br />
100%<br />
<strong>Partners</strong> <strong>Group</strong><br />
(Guernsey) Ltd.<br />
(Guernsey)<br />
100%<br />
<strong>Partners</strong> <strong>Group</strong><br />
Management<br />
(Scotland) Ltd.<br />
(Scotland)<br />
100%<br />
<strong>Partners</strong> <strong>Group</strong><br />
Management VII<br />
Ltd.<br />
(Guernsey)<br />
100%<br />
100%<br />
<strong>Partners</strong> <strong>Group</strong><br />
(USA) Inc.<br />
(USA)<br />
100%<br />
<strong>Partners</strong> <strong>Group</strong><br />
Management<br />
(Scots) LLP<br />
(Scotland)<br />
<strong>Partners</strong> <strong>Group</strong><br />
Management VIII<br />
Ltd.<br />
(Guernsey)<br />
100%<br />
100%<br />
<strong>Partners</strong> <strong>Group</strong><br />
Real Estate, LLC<br />
(USA)<br />
100%<br />
<strong>Partners</strong> <strong>Group</strong><br />
US Management<br />
LLC<br />
(USA)<br />
<strong>Partners</strong> <strong>Group</strong><br />
Management IX<br />
Ltd.<br />
(Guernsey)<br />
100%<br />
119
120<br />
CORPORATE GOVERNANCE<br />
the company as of 31 December 2010 is <strong>CHF</strong> 4.7 billion.<br />
All other group companies are privately held.<br />
1.1.2 Unlisted companies belonging to the <strong>Group</strong><br />
For more detailed information on the unlisted subsidiaries<br />
of the group, including names, domiciles, share<br />
capital and ownership interests, please see note 32 to<br />
the consolidated fi nancial statements and note 3 to the<br />
fi nancial statements of <strong>Partners</strong> <strong>Group</strong> Holding AG in<br />
the annual report 2010.<br />
1.2 Signifi cant shareholders<br />
<strong>Partners</strong> <strong>Group</strong> Holding has three shareholders holding<br />
over 3% of the shares and voting rights of the company<br />
as of 31 December 2010. Dr. Marcel Erni and<br />
Messrs. Alfred Gantner and Urs Wietlisbach each hold<br />
3’790’326 shares, corresponding to 14.20% of the total<br />
share capital each. At year-end <strong>Partners</strong> <strong>Group</strong> Holding<br />
held 1’952’821 treasury shares, corresponding to<br />
7.31% of the total share capital.<br />
During the reporting year, a group of shareholders<br />
composed of Dr. Marcel Erni and Messrs. Alfred Gantner<br />
and Urs Wietlisbach along with 26 other <strong>Partners</strong> of<br />
<strong>Partners</strong> <strong>Group</strong> owning 17.68% of the total share capital<br />
as of 24 March 2009 was dissolved for administrative<br />
reasons on 18 June 2010. This group was formed<br />
at the time of the IPO of <strong>Partners</strong> <strong>Group</strong> and has now<br />
been substituted with all involved signing a non-compete<br />
agreement which expires at the end of March<br />
2013.<br />
In addition, William Blair & Company LLC, 222 W Adams,<br />
Chicago IL 60606, USA disclosed an acquisition of<br />
shares resulting in a shareholding of 801’519 shares,<br />
corresponding to 3.0019% of the total share capital, on<br />
22 January 2010. On 22 July 2010, William Blair disclosed<br />
a sale of shares resulting in a shareholding of<br />
624’856 shares, corresponding to 2.34% of the total<br />
share capital.<br />
All disclosures according to art. 20 of the Stock Exchange<br />
Act (SESTA) in 2010 can be found on the SIX<br />
Swiss Exchange homepage:<br />
http://www.six-exchange-regulation.com/obligations/<br />
disclosure/major_shareholders_en.html<br />
1.3 Cross-shareholdings<br />
<strong>Partners</strong> <strong>Group</strong> Holding has no cross-shareholdings<br />
with another company or group of companies.<br />
2. Capital structure<br />
2.1 Capital<br />
The issued nominal share capital of <strong>Partners</strong> <strong>Group</strong><br />
Holding amounts to <strong>CHF</strong> 267’000, comprising<br />
26’700’000 fully paid in registered shares with a nominal<br />
value of <strong>CHF</strong> 0.01 each.<br />
2.2 Authorized and conditional share capital<br />
<strong>Partners</strong> <strong>Group</strong> Holding currently has no authorized<br />
capital.<br />
Since 30 June 2000, <strong>Partners</strong> <strong>Group</strong> Holding has established<br />
regular share and option programs that entitle<br />
management personnel as well as a large number of<br />
employees to purchase and/or hold shares in the entity.<br />
The options can be settled either by the issuance of<br />
conditional capital or by the delivery of existing shares.<br />
Please see note 26 (b) to the consolidated fi nancial<br />
statements in the annual report 2010 for comprehensive<br />
information on the employee shares and options.<br />
In order to be able to cover all outstanding options at<br />
any point in time, even on a fully diluted basis, the extraordinary<br />
general meeting of shareholders held on 14<br />
December 2005 approved the creation of a conditional<br />
capital of a maximum of <strong>CHF</strong> 13’350, divided into<br />
1’335’000 fully paid-in registered shares of a nominal<br />
value of <strong>CHF</strong> 0.01 each. Furthermore, the annual general<br />
meeting of shareholders held on 27 April 2007 approved<br />
the increase of the conditional capital to a maximum<br />
of <strong>CHF</strong> 40’050, divided into 4’005’000 fully<br />
paid-in registered shares of a nominal value of <strong>CHF</strong><br />
0.01 each.<br />
The share capital may be increased through the exercise<br />
of options granted to the members of the board of<br />
directors and employees of <strong>Partners</strong> <strong>Group</strong> in the aggregate<br />
amount of the conditional capital. Pre-emptive<br />
rights as well as the shareholders’ advance subscription<br />
rights are excluded in favor of the option holders. The<br />
board of directors will determine all details of the terms<br />
of any issue of conditional capital, such as each amount<br />
of issue, date of dividend entitlement, and kind of contributions,<br />
and will establish the related equity investment<br />
plan. The acquisition of the registered shares by<br />
exercising the option rights and the further transfer of<br />
the shares are subject to the transfer restrictions set<br />
forth in section 2.6 below.<br />
<strong>Partners</strong> <strong>Group</strong> has disclosed all details of its option<br />
plan according to art. 20 SESTA on the SIX Swiss Exchange:<br />
http://www.six-exchange-regulation.com/<br />
obligations/disclosure/major_shareholders_en.html
CORPORATE GOVERNANCE<br />
2.3 Changes in capital<br />
Apart from the increase of the conditional capital as described<br />
in section 2.2 above, no further changes in capital<br />
have occurred during the last three years.<br />
2.4 Shares and participation certifi cates<br />
<strong>Partners</strong> <strong>Group</strong> Holding has issued 26’700’000 fully<br />
paid-in registered shares with a nominal value of <strong>CHF</strong><br />
0.01 each and transferability in accordance with our articles<br />
of association, as described in section 2.6 below.<br />
The shares have been issued in form of book-entry securities.<br />
Shareholders do not have the right to ask for<br />
printing and delivery of share certifi cates. A shareholder<br />
may, however, at any time demand that <strong>Partners</strong><br />
<strong>Group</strong> Holding issue a confi rmation of such shareholder’s<br />
holding.<br />
Each share carries one vote at shareholders’ meetings.<br />
All shares have equal rights. Voting rights and certain<br />
other non-economic rights attached to the shares, including<br />
the right to call and to attend shareholders’<br />
meetings, may be exercised only after a shareholder<br />
has been registered in the share register of <strong>Partners</strong><br />
<strong>Group</strong> Holding as a shareholder with voting rights.<br />
Such registration requires the approval of the board of<br />
directors and is restricted, see section 2.6 below. All<br />
shares are entitled to full dividend rights.<br />
<strong>Partners</strong> <strong>Group</strong> Holding has not issued (non-voting)<br />
participation certifi cates.<br />
2.5 Profi t sharing certifi cates<br />
<strong>Partners</strong> <strong>Group</strong> Holding has not issued any profi t sharing<br />
certifi cates.<br />
2.6 Limitations on transferability and nominee<br />
registration<br />
Any transfer of shares will not be recognized for purposes<br />
of having voting rights with respect to such<br />
shares unless a transfer is approved by the board of directors.<br />
This limitation also applies to the establishing<br />
of a usufruct. If the application of a transferee for recognition<br />
is not declined by the board of directors within<br />
20 days, this transferee is deemed to have been recognized<br />
as a shareholder. According to art. 6 of the articles<br />
of association, the board of directors may refuse to<br />
register a transferee as a shareholder with voting rights<br />
to the extent that said transferee’s total shareholding<br />
would exceed 10% of the total share capital as registered<br />
in the commercial register. The board of directors<br />
may also refuse to register a transferee as a shareholder<br />
with voting rights if the transferee does not expressly<br />
declare that it has acquired the shares in its own<br />
name and for its own account. If the shares pass by in-<br />
heritance or matrimonial property law, the transferee<br />
may not be refused as a shareholder with voting rights.<br />
Entries in the share register may be canceled if they<br />
are based on false information on the part of the transferee.<br />
<strong>Partners</strong> <strong>Group</strong> Holding has issued special provisions<br />
for the registration of nominees. Nominees may be entered<br />
in the share register with voting rights for a maximum<br />
of 5% of the total share capital as set forth in<br />
the commercial register. The board of directors may allow<br />
a nominee to exceed this limit if such nominee discloses<br />
the name, address and shareholding of any person<br />
for whose account it is holding 0.5% or more of the<br />
share capital as set forth in the commercial register.<br />
The board of directors shall conclude agreements with<br />
such nominees concerning disclosure requirements,<br />
representation of shares and exercise of voting rights.<br />
Any reversal or amendment of the statutory rules governing<br />
the transfer limitation require a quorum of at<br />
least two-thirds of the represented votes at the shareholders’<br />
meeting and the absolute majority of the represented<br />
nominal value of shares.<br />
2.7 Convertible bonds and options<br />
<strong>Partners</strong> <strong>Group</strong> Holding currently has no convertible<br />
bonds outstanding.<br />
Since 30 June 2000, <strong>Partners</strong> <strong>Group</strong> Holding has established<br />
regular share and option programs that entitle<br />
management personnel as well as a large number of<br />
employees to purchase and/or hold shares in the entity.<br />
The options can be settled either by the issuance of<br />
conditional capital or by the delivery of existing shares.<br />
Please see note 26 (b) to the consolidated fi nancial<br />
statements in the annual report 2010 for comprehensive<br />
information on the employee shares and options.<br />
<strong>Partners</strong> <strong>Group</strong> Holding has not issued any further options<br />
or warrants.<br />
121
122<br />
CORPORATE GOVERNANCE<br />
The table below shows the current composition of the board of directors:<br />
Name Director Term<br />
Nationality Age Committee<br />
since<br />
expires<br />
membership1 Function<br />
Alfred Gantner 1997 2013 Swiss 42 RAC, NCC, BDC2 Director,<br />
Executive Chairman<br />
Dr. Marcel Erni 1997 2011 Swiss 45 BDC Director,<br />
Executive Vice Chairman<br />
Urs Wietlisbach 1997 2012 Swiss 49 BDC Director,<br />
Executive Vice Chairman<br />
Ulrich Fehring 1998 2011 German 69 NCC2 Director<br />
Dr. Peter Wuffl i 2009 2013 Swiss 53 RAC2 Director<br />
Dr. Wolfgang Zürcher 2005 2012 Swiss 46 RAC, NCC Director<br />
1 Detailed information on committees is provided in section 3.3 below<br />
RAC: Risk and audit committee<br />
NCC: Nomination and compensation committee<br />
BDC: Business development committee<br />
2 Committee chair<br />
3. Board of directors<br />
The board of directors of <strong>Partners</strong> <strong>Group</strong> Holding is entrusted<br />
with the ultimate strategy and direction of the<br />
company and the supervision of the management. As<br />
of 31 December 2010, the board of directors consists<br />
of six members, of which three are executive members.<br />
3.1 Members of the board of directors<br />
The executive members of the board of directors are<br />
Dr. Marcel Erni and Messrs. Alfred Gantner and Urs Wietlisbach.<br />
Apart from Dr. Marcel Erni’s mandates as<br />
member of the board of IHAG Holding AG, Zurich, and<br />
Perennius Capital, Milan, the executive members of the<br />
board of directors of <strong>Partners</strong> <strong>Group</strong> Holding do not<br />
hold any management positions or any board memberships<br />
outside the <strong>Partners</strong> <strong>Group</strong> Holding group or associated<br />
companies, nor do they hold any offi cial functions<br />
or political posts. The texts below provide<br />
information on the professional history and education<br />
of each member of the board of directors, including<br />
other activities and functions such as mandates on<br />
boards of important corporations, organizations and<br />
foundations, or permanent functions for important interest<br />
groups.<br />
Alfred Gantner is a co-founder of<br />
<strong>Partners</strong> <strong>Group</strong> and serves as the<br />
fi rm’s Executive Chairman, leading<br />
the business strategy and corporate<br />
development of the fi rm. He is chairman<br />
of the business development<br />
committee and a member of the<br />
global portfolio investment committee<br />
and the private infrastructure investment<br />
committee. Prior to founding <strong>Partners</strong> <strong>Group</strong>,<br />
he worked for Goldman Sachs & Co. where, after stays<br />
in New York and London, he built up an institutional client<br />
business in Switzerland. He started his career in<br />
the securities trading department of the UBS Private<br />
Banking <strong>Group</strong> (Cantrade) in Zurich and Geneva. He<br />
holds an MBA from the Marriott School of Management<br />
at Brigham Young University.<br />
Dr. Marcel Erni is a co-founder of<br />
<strong>Partners</strong> <strong>Group</strong> and serves as Executive<br />
Vice Chairman, having responsibility<br />
for the fi rm’s investment<br />
strategy and development. He is a<br />
member of the business development<br />
committee and the global<br />
portfolio investment committee. He<br />
is also a member of the private equity<br />
Asia, MENA and emerging markets investment<br />
committee, the private equity North America investment<br />
committee and the private equity directs investment<br />
committee, as well as of the private real estate<br />
investment committee. Prior to founding <strong>Partners</strong><br />
<strong>Group</strong>, he was a banker at Goldman Sachs & Co. and a
CORPORATE GOVERNANCE<br />
management consultant at McKinsey & Co. He is a<br />
member of the board of directors of IHAG Holding AG,<br />
Zurich and of Perennius Capital, Milan. He holds an<br />
MBA from the University of Chicago and a PhD and<br />
master’s degree in fi nance and banking from the University<br />
of St. Gallen (HSG).<br />
Urs Wietlisbach is a co-founder of<br />
<strong>Partners</strong> <strong>Group</strong> and serves as an Executive<br />
Vice Chairman, having responsibility<br />
for the international<br />
business development of the fi rm.<br />
He is a member of the business development<br />
committee, the global<br />
portfolio investment committee as<br />
well as the private equity Asia,<br />
MENA and emerging markets investment committee<br />
and the private debt investment committee. He was initially<br />
responsible for the fi rm’s partnership investment<br />
activities and was instrumental in building <strong>Partners</strong><br />
<strong>Group</strong>’s private equity funds portfolio and a global industry<br />
network. Later, he also focused on business development<br />
responsibilities, fi rst in Europe, and subsequently<br />
in the US and the Asia-Pacifi c region. Prior to<br />
founding <strong>Partners</strong> <strong>Group</strong>, he was an executive director<br />
at Goldman Sachs & Co. where, after assignments in<br />
London and New York, he was appointed head of the<br />
fi rm’s institutional clients business in Switzerland. Previously,<br />
he was a relationship manager for multinational<br />
corporate clients at Credit Suisse in New York and<br />
Zurich. He holds a master’s degree in business administration<br />
from the University of St. Gallen (HSG).<br />
Ulrich Fehring has been an advisor to<br />
and member of the board of directors<br />
of <strong>Partners</strong> <strong>Group</strong> since 1998 and is<br />
chairman of the nomination and<br />
compensation commitee. Previously,<br />
he served in various capacities with<br />
the Warburg <strong>Group</strong>, Schröder Münchmeyer<br />
Hengst, Bank in Liechtenstein<br />
and Credit Suisse Deutschland. His<br />
last assignment with Credit Suisse Deutschland was as<br />
Chief Executive Offi cer of the group’s activities in Germany.<br />
His assignments were in Switzerland, Germany,<br />
New York and London. Ulrich Fehring holds a board<br />
mandate (Aufsichtsratvorsitzender) with LUPUS alpha<br />
KaG, Frankfurt (asset management fi rm). Mr. Fehring<br />
holds a commercial apprenticeship degree. Apart from<br />
his advisory capacity and function at <strong>Partners</strong> <strong>Group</strong><br />
(Deutschland) GmbH as mentioned above, neither Mr.<br />
Fehring nor any of his close family members have ever<br />
been members of the senior management of <strong>Partners</strong><br />
<strong>Group</strong> Holding or any of its subsidiaries, nor do they<br />
have any signifi cant business connections with either<br />
<strong>Partners</strong> <strong>Group</strong> Holding or one of its subsidiaries. Mr.<br />
Fehring does not exercise any offi cial functions or hold<br />
a political post. Mr. Fehring does not have any permanent<br />
management/consultancy functions for signifi cant<br />
domestic and foreign interest groups.<br />
Dr. Peter Wuffl i has been a member<br />
of the board of directors of <strong>Partners</strong><br />
<strong>Group</strong> since 2009 and is chairman of<br />
the risk and audit commitee. Dr.<br />
Wuffl i holds mandates in various<br />
other organizations. He chairs the<br />
philanthropic elea Foundation for<br />
Ethics in Globalization that he established<br />
together with his wife in<br />
2006. He is also the designated chairman (as of 1 April<br />
2011) of the board of the International Institute of<br />
Management Development IMD in Lausanne/Switzerland<br />
and vice chairman of the Zurich Opera House. Peter<br />
Wuffl i studied economics at the University of St.<br />
Gallen where he gained his PhD in 1984. From 1984 to<br />
1993 he worked for McKinsey & Company as a management<br />
consultant where he became a Partner and<br />
member of the Swiss offi ce leadership team in 1990. In<br />
1994 he joined the Swiss Bank Corporation (today<br />
UBS) as Chief Financial Offi cer. Following the merger of<br />
the Swiss Bank Corporation and the Union Bank of<br />
Switzerland in 1998, he continued to serve as Chief Financial<br />
Offi cer until 1999 when he became Chairman<br />
and CEO of UBS Global Asset Management. From 2001<br />
he was President and from 2003 onwards <strong>Group</strong> CEO of<br />
UBS until his resignation in 2007. Neither Dr. Wuffl i nor<br />
any of his close family members have ever been members<br />
of the senior management of <strong>Partners</strong> <strong>Group</strong> Holding<br />
or any of its subsidiaries, nor do they have any signifi<br />
cant business connections with either <strong>Partners</strong><br />
<strong>Group</strong> Holding or one of its subsidiaries. Dr. Wuffl i does<br />
not exercise any offi cial functions, hold a political postor<br />
have any permanent management/consultancy functions<br />
for signifi cant domestic and foreign interest<br />
groups.<br />
Dr. Wolfgang Zürcher, LL.M. a member<br />
of the board of directors of <strong>Partners</strong><br />
<strong>Group</strong> since 2005, is a member<br />
of the risk and audit and the nomination<br />
and compensation committees<br />
and a partner at Wenger & Vieli,<br />
Attorneys-at-Law. He advises<br />
national and international clients<br />
with respect to mergers and acquisitions, capital mar-<br />
123
124<br />
CORPORATE GOVERNANCE<br />
kets and banking law. Before joining Wenger & Vieli in<br />
1996, Dr. Zürcher worked as an assistant at the chair<br />
of corporate and banking law at the University of Zurich<br />
and with an international law fi rm in the United<br />
States. Wolfgang Zürcher holds a doctorate in law from<br />
the University of Zurich as well as an LL.M. degree<br />
from the University College, London. Apart from his advisory<br />
capacity as mentioned above, neither Dr. Zürcher<br />
nor any of his close family members have ever been<br />
members of the senior management of <strong>Partners</strong> <strong>Group</strong><br />
Holding or any of its subsidiaries, nor do they have any<br />
signifi cant business connections with either <strong>Partners</strong><br />
<strong>Group</strong> Holding or one of its subsidiaries. Dr. Zürcher<br />
does not exercise any offi cial functions or hold a political<br />
post. Dr. Zürcher does not have any permanent<br />
management/consultancy functions for signifi cant domestic<br />
and foreign interest groups.<br />
3.2 Elections and terms of offi ce<br />
The board of directors consists of at least three members,<br />
all of which are elected individually (staggered renewal)<br />
by the shareholders’ meeting, usually for a term<br />
of three years, unless the shareholders’ meeting establishes<br />
different terms of offi ce for individual members.<br />
The year of fi rst appointment to the board of directors<br />
and the expiry of the current term of each member are<br />
listed in the table in section 3.1. There are no limits on<br />
terms of offi ce.<br />
3.3 Internal organizational structure<br />
The board of directors has adopted written internal<br />
regulations for the management of the company and of<br />
its subsidiaries pursuant to article 716b of the Swiss<br />
Code of Obligations, the rules of the SIX Swiss Exchange<br />
and the company’s articles of association.<br />
The board of directors has ultimate responsibility for<br />
the management of <strong>Partners</strong> <strong>Group</strong> Holding. While<br />
three members are non-executive, the three executive<br />
members of the board of directors also assume management<br />
responsibilities.<br />
Once a year, during the fi rst board meeting following<br />
the annual general meeting of shareholders, the board<br />
of directors appoints its chairman from amongst its<br />
members, and appoints its secretary, who need not be<br />
a member of the board of directors. The board of directors<br />
meets as often as business requires, but no less<br />
than once a year; in 2010, four meetings were held,<br />
which each lasted approximately three hours. The external<br />
auditors attended one meeting of the board of<br />
directors in 2010. The board of directors can deliberate<br />
if the majority of its members are present. Resolutions<br />
are adopted with the majority of the votes of the members<br />
present. In the event of a tie, the chairman casts<br />
the deciding vote. Resolutions by circular letter require<br />
the absolute majority of all members of the board of<br />
directors.<br />
The board of directors has established three sub-committees:<br />
the risk and audit committee, the nomination<br />
and compensation committee and the business development<br />
committee. Each committee advises the board<br />
of directors on the matters specifi ed below, often with<br />
the assistance of the executive board and others involved<br />
in the management of <strong>Partners</strong> <strong>Group</strong> Holding.<br />
The members and chairmen of these committees are<br />
determined by the board of directors.<br />
Any of the committee members may call committee<br />
meetings. In order for resolutions to be valid, the majority<br />
of a committee’s members must be present<br />
(physically or by phone / video conference) at the<br />
meeting or the resolution must be adopted by way of<br />
a circular resolution.<br />
Risk and audit committee<br />
The risk and audit committee is in charge of ensuring<br />
diligent performance of internal and external auditing<br />
as well as fi nancial controlling in addition to performing<br />
other tasks related to risk management. In particular,<br />
the risk and audit committee (i) approves internal audit’s<br />
organization and tasks, (ii) orders the performance<br />
of specifi c audits, (iii) supervises internal audit’s<br />
activities, (iv) ensures the execution of the external<br />
audit, (v) monitors the fi nancial review processes and<br />
(vi) ensures the review of the management and internal<br />
control processes. The role of the risk and audit<br />
committee is primarily supervisory and its decision<br />
making authority is limited to those areas which are<br />
ancillary to its supervisory role (see also section<br />
3.5.1.2). As of 31 December 2010, the members of the<br />
risk and audit committee were Dr. Peter Wuffl i (chair),<br />
Mr. Alfred Gantner and Dr. Wolfgang Zürcher. The risk<br />
and audit committee held four meetings in 2010, which<br />
each lasted approximately two hours and were all also<br />
attended by internal audit. In addition, the external auditors<br />
attended one meeting of the risk and audit committee<br />
in 2010. The chief executive offi cer, chief<br />
fi nancial offi cer and chief risk offi cer regularly attend<br />
risk and audit committee meetings. The majority of the<br />
committee members were present at all meetings.<br />
Nomination and compensation committee<br />
The nomination and compensation committee advises<br />
the board of directors and the executive board regard-
CORPORATE GOVERNANCE<br />
ing: (i) the composition of the board of directors and<br />
(ii) the remuneration policy and strategy for directors<br />
and personnel. As of 31 December 2010, the members<br />
of the nomination and compensation committee were<br />
Messrs. Ulrich Fehring (chair), Alfred Gantner and Dr.<br />
Wolfgang Zürcher. The nomination and compensation<br />
committee met once in November 2010 for approximately<br />
four hours to discuss the annual compensation<br />
for the board of directors and the executive board as<br />
well as to confi rm the overall compensation policy.<br />
Business development committee<br />
The business development committee advises the<br />
board of directors on strategic matters and decides on<br />
general policy and strategies within the current set of<br />
guidelines and practices. The business development<br />
committee instructs and directs the executive board on<br />
these issues and their implementation. As of 31 December<br />
2010, the members of the business development<br />
committee were Messrs. Alfred Gantner (chair),<br />
Urs Wietlisbach and Dr. Marcel Erni. The chief executive<br />
offi cer, chief fi nancial offi cer, chief operating offi cer and<br />
the co-head of the investment solutions team participate<br />
in meetings of the business development committee,<br />
although they do not have voting rights. The business<br />
development committee meets bi-weekly for<br />
approximately two hours to discuss strategic matters of<br />
the fi rm. The majority of the meetings throughout the<br />
year were attended by all committee members, as well<br />
as by the non-voting advisers.<br />
3.4 Defi nition of areas of responsibility<br />
The board of directors has delegated the day-to-day<br />
management to the executive board unless provided<br />
otherwise by law, the articles of association or as described<br />
below. The board of directors has the right to<br />
issue specifi c rules for this purpose and to form the<br />
respective committees to determine the principles of<br />
business policy, the risk policy of the various business<br />
sectors as well as the authority and responsibilities of<br />
each of the company’s bodies. The positions of the<br />
chairman of the board of directors and the chief executive<br />
offi cer are held by two separate persons, thus<br />
ensuring a system of internal checks and balances and<br />
an independence of the board of directors from the<br />
day-to-day management of the company.<br />
Apart from the non-transferable functions mentioned in<br />
the law and in the articles of association, the board of<br />
directors has a number of additional duties and powers,<br />
including (among other things) resolutions regarding<br />
the establishment of branch offi ces, all transactions in<br />
connection with real estate (outside of investment ac-<br />
tivities), establishment of employment policies, all<br />
activities pertaining to the shareholder register, acceptance<br />
of audit reports and budgets and the periodic<br />
review of internal organization structures.<br />
Responsibilities delegated to the executive board of<br />
<strong>Partners</strong> <strong>Group</strong> Holding include the following:<br />
1. direct management and conduct of the company’s<br />
business, ongoing monitoring of transactions within<br />
the scope of and with reference to the rules,<br />
directives, authority and responsibilities, individual<br />
resolutions and limits issued by the board of directors;<br />
2. entering into business transactions to the extent<br />
these are within the limits established by rules, directives,<br />
authority and responsibilities, individual<br />
resolutions and limits set by the board of directors;<br />
3. preparation and activation of directives, policies<br />
and job descriptions for employees to the extent<br />
this responsibility is not reserved to the board of<br />
directors;<br />
4. employment and termination of employees within<br />
the scope of the limits established;<br />
5. fi ling of lawsuits within the limits established, and<br />
entering into settlements up to such limits;<br />
6. organization, management and implementation of<br />
accounting, fi nancial planning and reporting including<br />
preparation of the management report and the<br />
annual fi nancial statements for the attention of the<br />
board of directors;<br />
7. preparation of the annual group budget for approval<br />
by the board of directors;<br />
8. execution of the resolutions adopted by the board<br />
of directors;<br />
9. organization, attendance to and coordination of<br />
pension benefi t institutions;<br />
10. organization of insurance management;<br />
11. organization of risk management;<br />
12. informing all executives regarding resolutions<br />
adopted by the board of directors and by the executive<br />
board concerning them;<br />
13. introduction of motions regarding any business to<br />
be submitted to the board of directors; and<br />
14. exercising the rights of the company as a shareholder<br />
in other group companies, which includes<br />
voting in relation to the composition of management<br />
teams, approving respective fi nancial statements<br />
and related matters.<br />
125
126<br />
CORPORATE GOVERNANCE<br />
3.5 Information and control instruments vis-à-vis the<br />
senior management<br />
The board of directors is kept informed of the activities<br />
of the executive board through a number of information<br />
and control instruments. The chief executive offi cer,<br />
chief fi nancial offi cer and chief operating offi cer are<br />
in a regular dialogue with the executive members of<br />
the board of directors (at least bi-weekly through the<br />
business development committee) about the general<br />
course of business, the fi nancial situation of the company<br />
and any developments or events of importance to<br />
the company and its business. In the event of extraordinary<br />
incidents or developments, the executive board<br />
will notify the chairman without delay.<br />
The executive board must submit decisions beyond the<br />
ordinary management or decisions that carry major<br />
implications to the business development committee or<br />
the board of directors, including (but not limited to)<br />
decisions specifi cally reserved to the business development<br />
committee or the board of directors.<br />
The general counsel attends executive board meetings<br />
and takes an advisory role in order to ensure the compliance<br />
with all legal and regulatory requirements. The<br />
general counsel is in particular responsible for the internal<br />
control of and compliance with regulatory obligations<br />
of the group entities as well as products and<br />
mandates.<br />
<strong>Group</strong><br />
operational risk<br />
management<br />
3.5.1 <strong>Group</strong> risk management<br />
<strong>Partners</strong> <strong>Group</strong> Holding is aware that the proper assessment<br />
and control of risks are critical for the continued<br />
success of the company. The board of directors<br />
holds the ultimate responsibility for the establishment<br />
of a framework relating to the group risk management,<br />
which comprises the following elements, (i) risk management,<br />
(ii) risk control and audit, and (iii) strategy<br />
risk control. The overall risk management of <strong>Partners</strong><br />
<strong>Group</strong> Holding is illustrated below.<br />
3.5.1.1 Risk management<br />
The ongoing risk management is delegated to the executive<br />
board, which provides an annual risk assessment<br />
and risk management report to the board of directors.<br />
In establishing appropriate processes regarding<br />
the risk management, a distinction is made between<br />
group operational risk management, group legal and<br />
regulatory risk management and group fi nancial risk<br />
management. In these areas, <strong>Partners</strong> <strong>Group</strong> has created<br />
internal task control systems for product obligations<br />
and procedures (POPs), regulatory obligations<br />
and procedures (ROPs) and fi nancial obligations and<br />
procedures (FOPs).<br />
3.5.1.2 Risk control and audit<br />
The risk control and audit of <strong>Partners</strong> <strong>Group</strong> Holding<br />
is delegated to the risk and audit committee, which<br />
establishes appropriate processes regarding fi nancial<br />
review, internal and external audit. The risk and audit<br />
committee provides a risk control and audit report to<br />
the board of directors.<br />
Executive Board Risk & Audit Committee Business Development Committee<br />
Annual risk assessment<br />
<strong>Group</strong><br />
fi nancial risk<br />
management<br />
Financial<br />
review<br />
Board of Directors<br />
Risk management Risk control and audit Strategy risk control<br />
<strong>Group</strong> legal &<br />
regulatory risk<br />
management<br />
(compliance)<br />
Internal<br />
audit<br />
Annual risk report<br />
by Chief Risk Offi cer<br />
External<br />
audit<br />
Strategy<br />
risk<br />
control<br />
Annual strategy risk assessment
CORPORATE GOVERNANCE<br />
Internal audit supports the board of directors, the risk<br />
and audit committee and the executive board of the<br />
company in their supervisory and risk management<br />
tasks. In doing so, internal audit provides an independent<br />
view based on objective analysis regarding material<br />
risks and quality issues at <strong>Partners</strong> <strong>Group</strong>, and it develops<br />
and suggests recommendations for improvement.<br />
Internal audit reports to the chairman of the board of<br />
directors and works closely with the chairman of the<br />
risk and audit committee as well as the chief executive<br />
offi cer, chief fi nancial offi cer and chief operating offi cer.<br />
The scope, responsibilities, tasks and priorities of internal<br />
audit are regularly discussed with and approved by<br />
the risk and audit committee. Audit fi ndings will be reported<br />
in a standard format together with the comments<br />
of the responsible line management. Appropriate<br />
measures for avoiding or mitigating risks will be suggested<br />
to management. A systematic process tracks<br />
the timely resolution of audit issues, measures and action<br />
plans.<br />
3.5.1.3 Strategy risk control<br />
The business development committee of the board of<br />
directors has the responsibility to establish appropriate<br />
processes regarding the group strategy risk control.<br />
The business development committee provides a strategy<br />
risk control report to the board of directors on an<br />
annual basis.<br />
3.5.1.4 Risk report<br />
On an annual basis the chief risk offi cer provides a risk<br />
report to the board of directors based on a risk assessment<br />
of the executive board, risk and audit committee<br />
and the business development committee.<br />
3.5.2 Management information system<br />
<strong>Partners</strong> <strong>Group</strong> Holding has a management information<br />
system (MIS) in place to further support internal controls<br />
and information procedures as well as the fi nancial<br />
controlling of the fi rm. A comprehensive report is<br />
generated out of the fi rm’s reporting system and provided<br />
to the chief executive offi cer, chief fi nancial offi cer<br />
and chief operating offi cer on a monthly basis and to<br />
the board of directors on a quarterly basis while ad hoc<br />
reports can be generated as needed.<br />
3.5.3 Confl ict resolution<br />
<strong>Partners</strong> <strong>Group</strong> strives to avoid situations that result in<br />
confl icts of interest. However, in certain situations confl<br />
icts cannot be avoided and for such instances the confl<br />
ict resolution board has been appointed by the group<br />
companies as the governing committee for handling all<br />
confl icts of interest within the group. The members of<br />
the confl ict resolution board are the executive chairman<br />
(chair), the chief executive offi cer, the chief fi nancial<br />
offi cer and the general counsel.<br />
127
128<br />
CORPORATE GOVERNANCE<br />
The table below shows the current composition of the executive board:<br />
Name Joined <strong>Partners</strong><br />
<strong>Group</strong> in<br />
4. Executive board<br />
4.1 Members of the executive board<br />
As mentioned in section 3.4 above, the board of directors<br />
has delegated the operational management of the<br />
company to the executive board, unless otherwise required<br />
by law, the articles of association or otherwise<br />
defi ned in section 3.4. The general counsel attends executive<br />
board meetings and takes an advisory role in<br />
order to ensure the compliance with all legal and regulatory<br />
requirements.<br />
Steffen Meister is a Partner, Chief<br />
Executive Offi cer (CEO) of <strong>Partners</strong><br />
<strong>Group</strong> and leads the executive<br />
board. He is a non-voting member<br />
of the business development committee,<br />
as well as a member of the<br />
global portfolio investment committee<br />
and of the private equity secondaries<br />
investment committee.<br />
Previously, he served as deputy CEO<br />
of <strong>Partners</strong> <strong>Group</strong> and prior to that, he was head of the<br />
investment structures team, where he was responsible<br />
for developing and structuring the fi rm’s transactions<br />
and investment products. Prior to joining <strong>Partners</strong><br />
<strong>Group</strong>, he spent fi ve years at Credit Suisse Financial<br />
Products (CSFP) in London and Zurich, where he<br />
worked as a derivatives specialist focusing on structured<br />
solutions for corporate fi nance transactions. Previously,<br />
he had several assignments at Swiss Reinsurance<br />
Company and the Department of Mathematics of<br />
the Swiss Federal Institute of Technology (ETH). He<br />
holds a master’s degree in mathematics from the Swiss<br />
Federal Institute of Technology, Zurich.<br />
Nationality Age Position<br />
Steffen Meister 2000 Swiss 40 Chief Executive Offi cer<br />
Pam Alsterlind 2007 American 47 Co-Head Private Real Estate<br />
René Biner 1999 Swiss 40 Head Private Finance<br />
Kurt Birchler 1997 Swiss 42 Head Product Operations<br />
Felix Haldner 2001 Swiss 47 Head Investment Structures<br />
Stefan Näf 2000 Swiss 37 Co-Head Investment Solutions<br />
Dr. Stephan Schäli 1999 Swiss 42 Head Private Equity<br />
Tilman Trommsdorff 1999 Swiss 47 Head Portfolio & Risk Management<br />
Jürg Wenger 1999 Swiss 51 Chief Operating Offi cer<br />
Dr. Cyrill Wipfl i 2002 Swiss 37 Chief Financial Offi cer<br />
Pam Alsterlind is a Partner, co-head<br />
of the private real estate business<br />
department and a member of the<br />
executive board and the private real<br />
estate investment committee. She is<br />
responsible for the day-to-day operations<br />
of the private real estate investment<br />
team, and also oversees<br />
the real estate investment activities<br />
in the Asia-Pacifi c region. Prior to joining <strong>Partners</strong><br />
<strong>Group</strong> in the San Francisco offi ce, she was a Managing<br />
Director serving key clients in all aspects of real estate<br />
investing, and acting as Chief Operating Offi cer for real<br />
estate at Pension Consulting Alliance, a global leader in<br />
real estate asset management. Previously, she was a<br />
Senior Manager in the real estate consulting practice at<br />
Kenneth Leventhal & Company, and its successor, Ernst<br />
& Young, LLP, as well as an investment manager for<br />
Prudential Realty <strong>Group</strong> in Boston and involved in all<br />
aspects of managing a large real estate portfolio. She<br />
holds an MBA in fi nance and marketing from the University<br />
of Michigan.<br />
René Biner is a Partner, head of the<br />
private fi nance business department<br />
and a member of the executive<br />
board and the global portfolio investment<br />
committee. He is chairman<br />
of the private debt investment committee<br />
and also a member of the<br />
private infrastructure investment<br />
committee. He previously worked on<br />
private equity direct investments<br />
and transactions before taking on responsibility for<br />
partnership investments in Europe and later, relocating
CORPORATE GOVERNANCE<br />
to <strong>Partners</strong> <strong>Group</strong>’s New York offi ce where he was cohead<br />
of the fi rm’s US private equity investment activities.<br />
Following his return to <strong>Partners</strong> <strong>Group</strong>’s principal<br />
offi ce in Zug, he was assigned responsibility for the<br />
fi rm’s private debt investment management activities.<br />
Prior to joining <strong>Partners</strong> <strong>Group</strong>, he spent fi ve years at<br />
PricewaterhouseCoopers in Zurich with responsibility in<br />
the due diligence and audit practice and assignments to<br />
IPO projects. He holds a master’s degree in economics<br />
and business administration from the University of Fribourg,<br />
and is a Swiss Certifi ed Public Accountant.<br />
Kurt Birchler is a Partner, co-head of<br />
the product operations business department<br />
and a member of the executive<br />
board. He joined the fi rm<br />
shortly after its inception. In his previous<br />
role as the fi rm’s Chief Financial<br />
Offi cer, he was instrumental in<br />
building the group-wide fi nance department<br />
of <strong>Partners</strong> <strong>Group</strong> and all<br />
its relevant processes and systems,<br />
including reporting and controlling. Prior to joining<br />
<strong>Partners</strong> <strong>Group</strong>, he worked for KPMG in the audit team<br />
serving US and Japanese banks. Previously, he worked<br />
as a credit offi cer and recovery manager for mid-size<br />
companies in the real estate and trading sector at UBS<br />
and the Cantonal Bank of Zurich. He holds a Swiss Federal<br />
Diploma in banking and an executive master’s degree<br />
in corporate fi nance from the University of Central<br />
Switzerland.<br />
Felix Haldner is a Partner, head of<br />
the investment structures business<br />
department and a member of the<br />
executive board. He is materially involved<br />
in private market deal structuring<br />
and execution, respectively<br />
for advice on tax, legal, regulatory<br />
and structural matters, relating to<br />
direct and fund investments. He has<br />
developed and launched many major alternative investment<br />
products for <strong>Partners</strong> <strong>Group</strong>’s institutional and<br />
private clients in Europe and overseas. Prior to joining<br />
<strong>Partners</strong> <strong>Group</strong>, he was a Partner at Pricewaterhouse-<br />
Coopers where he advised multinational insurance<br />
companies, investment management and banking clients<br />
on strategic tax planning matters and investment<br />
products. He holds a master’s degree in business law<br />
from the University of St. Gallen (HSG), is admitted to<br />
the Swiss Bar and is a Certifi ed Swiss Tax Expert.<br />
Stefan Näf is a Partner, co-head of<br />
the investment solutions business<br />
department and a member of the<br />
executive board. The investment solutions<br />
team is globally responsible<br />
for investment origination, business<br />
development and client relationship<br />
management. He established and<br />
subsequently managed <strong>Partners</strong><br />
<strong>Group</strong>’s London offi ce. Previously he worked in the<br />
fi rm’s private equity team with a focus on European investments.<br />
He holds a master’s degree in fi nance from<br />
the University of St. Gallen (HSG) and a degree in economics<br />
from the American River College.<br />
Dr. Stephan Schäli is a Partner, head<br />
of the private equity business department<br />
and a member of the executive<br />
board. He is chairman of the<br />
global portfolio investment committee<br />
and the private equity secondaries<br />
investment committee. In addition,<br />
he is a member of the private<br />
equity North America investment<br />
committee. He played a key role in<br />
the fi rm’s primary investment activities and was instrumental<br />
in building the fi rm’s portfolio of secondary<br />
transactions and in establishing a network of deal<br />
sources. Prior to joining <strong>Partners</strong> <strong>Group</strong>, he worked for<br />
UBS, where he was a business and management associate<br />
with assignments in the fi rm’s strategic project<br />
group. He holds an MBA degree from the University of<br />
Chicago and a PhD and master’s degree in business administration<br />
from the University of St. Gallen (HSG).<br />
Tilman Trommsdorff is a Partner,<br />
head of the portfolio & risk management<br />
business department and a<br />
member of the executive board. He is<br />
chairman of the portfolio management<br />
committee and a member of<br />
the global portfolio investment committee.<br />
He started his career at <strong>Partners</strong><br />
<strong>Group</strong> in the private equity team<br />
with responsibilities in buyout partnerships selection.<br />
Subsequently, he had senior responsibilities within the<br />
fi rm’s trading and operations activities. Prior to joining<br />
<strong>Partners</strong> <strong>Group</strong>, he headed the institutional asset management<br />
division at the Cantonal Bank of Zug and worked<br />
as a trader and investment manager at the Industrial<br />
Bank of Japan and Bank Leu in Zurich. He holds a<br />
degree from the Swiss Finance Institute in Zurich.<br />
129
130<br />
CORPORATE GOVERNANCE<br />
Jürg Wenger is a Partner, Chief Operating<br />
Offi cer, a member of the executive<br />
board and a non-voting<br />
member of the business development<br />
committee and head of the resources<br />
business department. He<br />
has been instrumental in building<br />
<strong>Partners</strong> <strong>Group</strong>’s investment administration,<br />
accounting and reporting<br />
systems and operations. Prior to<br />
joining <strong>Partners</strong> <strong>Group</strong>, he spent 11 years with UBS,<br />
where he was head of the Central Switzerland resources<br />
division. Previously, he managed the private clients<br />
and management support unit at UBS in Zug. He holds<br />
a master’s degree in business law from the University<br />
of Zurich.<br />
Dr. Cyrill Wipfl i is a Partner, chief fi -<br />
nancial offi cer, a member of the executive<br />
board and a non-voting<br />
member of the business development<br />
committee, and is head of the<br />
communications (investor relations<br />
and public relations) team. Previously,<br />
he was a member of the private<br />
equity team, concentrating on<br />
investment due diligence for venture, buyout and mezzanine<br />
investments, followed by an assignment focused<br />
on strategic development activities within the markets<br />
department. Prior to joining <strong>Partners</strong> <strong>Group</strong>, he was a<br />
consultant at McKinsey & Co. and a fi nancial analyst at<br />
Venture Capital Finance and the Swiss Federal Committee<br />
for Technology and Innovation. He holds a doctorate<br />
in fi nance and banking from the University of St.<br />
Gallen (HSG).<br />
4.2 Other activities and vested interests<br />
None of the members of the executive board is a member<br />
of governing or supervisory bodies of important<br />
Swiss or foreign organizations outside of <strong>Partners</strong><br />
<strong>Group</strong>. None of the members hold permanent management<br />
or consultancy functions for important Swiss or<br />
foreign interest groups, and none of the members have<br />
offi cial functions or hold political posts. None of the<br />
members of the executive board have carried out tasks<br />
for <strong>Partners</strong> <strong>Group</strong> prior to joining the fi rm, except Felix<br />
Haldner, who acted for <strong>Partners</strong> <strong>Group</strong> in a consultant<br />
capacity during his employment at Pricewaterhouse-<br />
Coopers.<br />
4.3 Management contracts<br />
<strong>Partners</strong> <strong>Group</strong> Holding has not entered into any management<br />
contracts with companies or individuals not<br />
belonging to the group.
CORPORATE GOVERNANCE<br />
5. Compensation, shareholdings and loans<br />
5.1 Overall compensation approach<br />
The compensation for all employees of the fi rm is<br />
based on overall compensation guidelines set out by<br />
the board of directors, and is focused on ensuring team<br />
members retain a long-term perspective. Shares and/<br />
or options are granted to all employees of the company,<br />
though not every year, thereby placing a strong<br />
emphasis on the company’s long-term success and<br />
further incentivizing all team members to participate in<br />
delivering superior performance to clients and strong<br />
results to shareholders. We believe our employees<br />
consider our reward structures fair and attractive,<br />
which is essential in ensuring <strong>Partners</strong> <strong>Group</strong> can<br />
continue to attract and retain talent.<br />
<strong>Partners</strong> <strong>Group</strong>’s compensation structure for senior<br />
management is focused on ensuring the alignment of<br />
long-term value creation interests between clients,<br />
shareholders and senior management. The bulk of the<br />
fi nancial incentivization for the fi rm’s senior management<br />
results from equity participation programs that<br />
can provide capital gains in the case of a long-term<br />
share price increase as a result of future investment<br />
success with clients. In addition, a large part of the<br />
annual total fi nancial consideration of senior management<br />
is based on dividend payments resulting from<br />
signifi cant existing shareholdings in the company.<br />
Within this philosophy, <strong>Partners</strong> <strong>Group</strong> pays a total<br />
compensation which includes the following individual<br />
components: (i) base salary, (ii) additional employee<br />
benefi ts (pension fund, expense allowance etc.) (iii)<br />
variable bonus payment and (iv) equity participation<br />
program.<br />
In defi ning the total compensation awarded to any<br />
member of the board of directors or the executive<br />
board, no set formula is applied but rather the<br />
compensation is at the full discretion of the board. In<br />
the interests of disclosure the fi rm strives to describe<br />
the compensation process in as detailed a manner as<br />
possible. A number of factors are taken into consideration<br />
which are however not mechanically weighted and<br />
also not necessarily included in compensation deliberations<br />
for each individual. These include but are not<br />
limited to (i) the development of the company’s yearend<br />
EBITDA as compared to the previous years, (ii) the<br />
amount of performance fee generated during the<br />
fi nancial year under review and (iii) the successful<br />
implementation of <strong>Partners</strong> <strong>Group</strong>’s cost conscious<br />
operations, carefully balanced with (iv) a detailed and<br />
thorough review of the respective individual, department<br />
and company achievements for the year.<br />
5.2. Decision process for defi ning compensation paid to<br />
the members of the board of directors and of the<br />
executive board<br />
The compensation of the members of the board of<br />
directors and of the executive board is set by the board<br />
of directors, which is advised in these matters by the<br />
nomination and compensation committee. Please also<br />
see section 3.3 for further information regarding the<br />
nomination and compensation committee.<br />
At its annual meeting, the nomination and compensation<br />
committee discusses the group’s general compensation<br />
guidelines for the current year and the salary<br />
policy for the coming year and provides a proposal to<br />
the board of directors for approval. After having set<br />
this framework of the overall compensation strategy for<br />
the current year’s bonus and equity incentives and the<br />
coming year’s fi xed annual salary, the proposed compensation<br />
for the members of the board of directors<br />
and of the executive board is reviewed individually in a<br />
second step. As well as proposing compensation<br />
changes, if any, for the members of the board of<br />
directors, the committee proposes the coming year’s<br />
fi xed annual salary for the members of the executive<br />
board and the variable component (bonus and stock<br />
options) for the current year. Additionally, important<br />
decisions such as senior management promotions are<br />
approved by the full board of directors.<br />
5.3. Compensation for members of the board of<br />
directors<br />
The compensation of the members of the board of<br />
directors has been set at the full discretion of the<br />
board. The basic remuneration of the members of the<br />
board of directors consists of a fi xed annual compensation<br />
of <strong>CHF</strong> 50’000 with no variable component, which<br />
is paid in either cash or options. Board members may<br />
receive a higher annual compensation should they be<br />
assigned additional tasks and responsibilities. Any<br />
compensation above <strong>CHF</strong> 50’000 awarded to a board<br />
member is again at the full discretion of the board,<br />
advised by the nomination and compensation<br />
committee.<br />
131
132<br />
CORPORATE GOVERNANCE<br />
The chairman of the risk and audit committee receives<br />
an additional fi xed salary of <strong>CHF</strong> 50’000 with no variable<br />
component, with his total compensation thus<br />
amounting to <strong>CHF</strong> 100’000. This has been awarded at<br />
the board’s discretion to refl ect the workload stemming<br />
from the additional responsibilities in this position.<br />
The executive members of the board of directors<br />
receive an additional annual fi xed compensation of <strong>CHF</strong><br />
250’000 with no variable component, resulting in a<br />
total overall compensation of <strong>CHF</strong> 300’000. This<br />
additional element stems from their role as executives<br />
at <strong>Partners</strong> <strong>Group</strong> contributing to the fi rm’s success on<br />
a daily basis and has been set on a discretionary basis.<br />
As co-founders of <strong>Partners</strong> <strong>Group</strong>, all three executive<br />
members of the board of directors hold signifi cant<br />
shareholdings in the company. This compensation<br />
structure further underlines the commitment of the<br />
executive members of the board of directors to focus<br />
on long-term value creation for shareholders and<br />
clients.<br />
5.4. Compensation for members of the executive board<br />
The compensation of the members of the executive<br />
board has been set at the full discretion of the board of<br />
directors.<br />
The annual remuneration of the members of the<br />
executive board is proposed by the nomination and<br />
compensation committee and approved by the board of<br />
directors. The compensation consists of a base salary<br />
which is paid in cash on a monthly basis as well as a<br />
variable bonus and may also include shares and options,<br />
which are typically awarded to each individual<br />
member of the executive board every two to three<br />
years. The variable portion is performance-based and<br />
approved at the board’s absolute discretion. The members<br />
of the executive board were selectively granted<br />
stocks and options in the employee participation plan<br />
during the reporting year. Please see note 10 to the<br />
notes to the fi nancial statements of <strong>Partners</strong> <strong>Group</strong><br />
Holding AG included in the annual report 2010 for a<br />
complete overview of the compensation paid to the<br />
members of the executive board in 2010. The ratio of<br />
the executive board’s variable component (cash bonus,<br />
equity incentives and other compensation) compared to<br />
the base compensation ranged from 109% to 387% in<br />
the reporting year (2009: 76% to 217%). The alignment<br />
of interests with clients and shareholders and the<br />
focus on long-term value creation are further ensured<br />
by members of the executive board also participating in<br />
the success of the company through their signifi cant<br />
shareholdings in the fi rm.<br />
5.5. Equity participation program<br />
<strong>Partners</strong> <strong>Group</strong> options are awarded free of charge and<br />
out of the money (typically 20%) and both these as<br />
well as shares awarded are subject to a cliff vesting or<br />
blocking period of typically fi ve years, followed by a<br />
two year non-compete period. The vesting parameters<br />
of equity incentives are rather stringent. Any holder of<br />
blocked shares leaving the fi rm has the obligation to<br />
render his or her blocked interest back to the company<br />
and any option holder leaving the fi rm will forfeit his or<br />
her unvested options. Granting stock option and share<br />
awards to the members of the executive board as well<br />
as other <strong>Partners</strong> <strong>Group</strong> employees is considered on an<br />
annual basis at the absolute discretion of the board.<br />
Further information on duration, exercise price etc. of<br />
<strong>Partners</strong> <strong>Group</strong>’s stock option program can be found in<br />
note 26 (b) to the consolidated fi nancial statements<br />
included in the annual report 2010.<br />
5.6. Provisions for departure of a member of senior<br />
management<br />
There are no special provisions such as severance<br />
payments, “golden parachutes”, reduced option vesting<br />
periods etc. in place in case of departure of a member<br />
of the board of directors or of the executive board.<br />
5.7. Compensation report<br />
Pursuant to Art. 663b bis and 663c of the Swiss Code<br />
of Obligations (i) the total compensation paid in 2010<br />
to the members of the board of directors and to the<br />
executive board, (ii) the shares and the options held or<br />
vested by the members of the board of directors and<br />
the executive board and (iii) the loans, if any, granted<br />
to the members of the board of directors and to the<br />
executive board, need to be disclosed in the notes to<br />
the fi nancial statements. <strong>Partners</strong> <strong>Group</strong> goes beyond<br />
these requirements and discloses the full compensation<br />
paid to each individual member of the board of<br />
directors and the executive board. In this regard,<br />
please see notes 10 and 11 to the notes to the fi nancial<br />
statements of <strong>Partners</strong> <strong>Group</strong> Holding AG included in<br />
the annual report 2010.
CORPORATE GOVERNANCE<br />
6. Shareholders’ participation<br />
6.1 Voting rights & representation measures<br />
Each share entitles one vote. Entitled to attend shareholders’<br />
meetings and to exercise voting rights are<br />
shareholders recorded with voting rights in the shareholder<br />
register as of a qualifying date prior to the<br />
shareholders’ meeting set by the board of directors.<br />
Registration in the shareholder register with the attached<br />
voting rights is restricted by the limits on transferability<br />
and nominee registration as set forth in section<br />
2.6 above. All registered shareholders are invited<br />
to attend shareholders’ meetings. If they do not wish<br />
to attend, any shareholder may be represented at the<br />
shareholders’ meeting by (i) a legal representative who<br />
needs not be a shareholder, (ii) a representative of the<br />
company, (iii) an independent proxy or (iv) their bank.<br />
The board of directors will decide as to whether the authority/proxy<br />
is recognized.<br />
6.2 Statutory quorums<br />
The articles of association for <strong>Partners</strong> <strong>Group</strong> Holding<br />
provide that, unless provided otherwise by mandatory<br />
provisions of law, the following resolutions of the<br />
shareholders’ meeting require at least two-thirds of the<br />
represented votes and the absolute majority of the represented<br />
nominal value of shares:<br />
– the cases provided for by law in Art. 704 para. 1 of<br />
the Swiss Code of Obligations;<br />
– reversal or amendment of the transfer limitation as<br />
set forth in section 2.6 above.<br />
Votes and elections in the shareholders’ meeting are<br />
open unless provided otherwise by the chairman or decided<br />
otherwise by the shareholders’ meeting.<br />
6.3 Convocation of shareholders’ meetings<br />
The annual general meeting of shareholders (AGM)<br />
takes place within six months after the close of the<br />
fi nancial year. All registered shareholders receive a<br />
written invitation to the AGM including detailed descriptions<br />
of the items to be discussed and the motions<br />
of the board of directors no later than 20 days before<br />
the date of the AGM. In 2011, the AGM is scheduled for<br />
5 May.<br />
Shareholders representing at least one-tenth of the<br />
share capital may at any time request that a shareholders’<br />
meeting be called. The request for calling a<br />
meeting must be submitted in writing at least 45 days<br />
ahead of the meeting by stating the item on the<br />
agenda and the motions to be introduced by the<br />
shareholders.<br />
6.4 Placing of items on the agenda<br />
Shareholders representing at least one-tenth of the<br />
share capital may submit proposals to be placed on the<br />
agenda at a shareholders’ meeting, provided these<br />
items are received by the board of directors no later<br />
than 45 days prior to the meeting by stating the item<br />
on the agenda and the motions to be introduced by the<br />
shareholders.<br />
6.5 Inscriptions into share register<br />
The general rules for registration as a shareholder apply<br />
as described above in sections 2.4 and 2.6. The<br />
qualifying date for the registration of shares is defi ned<br />
by the board of directors for every shareholder meeting.<br />
133
134<br />
CORPORATE GOVERNANCE<br />
7. Changes of control and defense measures<br />
7.1 Opting-out<br />
<strong>Partners</strong> <strong>Group</strong> Holding has elected to opt out of the<br />
rule that an investor acquiring 33 1/3% of all voting<br />
rights has to submit a public offer for all outstanding<br />
shares.<br />
7.2 Clauses on change of control<br />
The employment contracts with the members of both<br />
the board of directors and the executive board do not<br />
contain any clauses activated by a change in control.<br />
<strong>Partners</strong> <strong>Group</strong> Holding also has no provisions for<br />
“golden parachutes” in place.<br />
8. Auditors<br />
8.1 Duration of mandate and term of offi ce<br />
The consolidated fi nancial statements and the statutory<br />
accounts of <strong>Partners</strong> <strong>Group</strong> Holding are audited by<br />
KPMG AG. The statutory and group auditors are elected<br />
for one year periods at the annual general meeting of<br />
shareholders. KPMG AG was fi rst elected statutory and<br />
group auditor on 21 November 2001. The lead auditor,<br />
Christoph Gröbli, has been in charge of the mandate<br />
since 27 August 2010 and is subject to a seven-year<br />
rotation interval.<br />
8.2 Auditing Fees<br />
In the fi nancial year 2010, KPMG AG and other KPMG<br />
companies received a total of <strong>CHF</strong> 0.5 <strong>million</strong> for audit<br />
services.<br />
8.3 Additional fees<br />
In addition, KPMG AG and other KPMG companies received<br />
T<strong>CHF</strong> 192 in fees for consulting services (tax,<br />
regulatory and IFRS) rendered to <strong>Partners</strong> <strong>Group</strong> Holding<br />
and its subsidiaries in the fi nancial year 2010.<br />
8.4 Supervision and control vis-à-vis the external auditors<br />
The board of directors is responsible for the acceptance<br />
and processing of the reports from the statutory and<br />
group auditors. In this, the board of directors is supported<br />
by the risk and audit committee, which periodically<br />
monitors the qualifi cation, independence and performance<br />
of the external auditors.<br />
The risk and audit committee primarily bases its evaluation<br />
on a presentation of all audit fi ndings by KPMG<br />
AG, which is presented on an annual basis. The assessment<br />
further includes documents such as the management<br />
letter as well as oral and written statements<br />
made by KPMG AG concerning individual aspects or<br />
factual issues in connection with the accounting and<br />
the audit. During the fi nancial year 2010, the external<br />
auditors participated in one meeting of the risk and audit<br />
committee in order to discuss audit processes and<br />
issues. Among others, evaluated issues include risk<br />
factors and processes.
CORPORATE GOVERNANCE<br />
Key factors in assigning the external audit mandate to<br />
KPMG AG were:<br />
– detailed audit budget proposal containing expected<br />
hours and the relevant hourly rate<br />
– comprehensive debriefi ng after completion of audit,<br />
during which improvement suggestions on both<br />
sides are discussed<br />
– quality of service provided<br />
– international expertise in regard to audit and accounting<br />
– independence and reputation of the audit fi rm<br />
– industry knowledge and qualifi cations<br />
– competitive fees<br />
The risk and audit committee reviews and assesses the<br />
auditor’s performance on an annual basis. In this context<br />
and in the spirit of upholding a good corporate<br />
governance, <strong>Partners</strong> <strong>Group</strong> Holding conducted an extensive<br />
review of the audit mandate during the fi nancial<br />
year 2008, in which in particular budget issues<br />
were reviewed in order to ensure audit fees were kept<br />
at a competitive level in the best interests of shareholders.<br />
KPMG AG as well as a further company were<br />
invited to submit a budget proposal. Following this review,<br />
the board of directors was confi rmed in again<br />
proposing KPMG AG to shareholders for re-election for<br />
a further term of one year at the annual general meeting.<br />
Please also refer to the sections concerning the risk<br />
and audit committee (3.3) as well as internal audit<br />
(3.5.1.2) above.<br />
9. Information policy<br />
As a company listed on the SIX Swiss Exchange, <strong>Partners</strong><br />
<strong>Group</strong> Holding is committed to pursuing an open,<br />
transparent and consistent communication strategy visà-vis<br />
its shareholders as well as the fi nancial community.<br />
Key dates for 2011 are as follows:<br />
Event Date<br />
Annual general meeting<br />
of shareholders<br />
Pre-close announcement<br />
AuM as of 30 June 2011<br />
5 May 2011<br />
14 July 2011<br />
Publication semi-annual report 6 September 2011<br />
<strong>Partners</strong> <strong>Group</strong> Holding’s semi-annual and annual reports<br />
are available for download on the website at<br />
http://www.partnersgroup.com/fi nancialreports<br />
<strong>Partners</strong> <strong>Group</strong> Holding also distributes all current news<br />
via regular press releases. All published press releases<br />
are available on the website at<br />
http://www.partnersgroup.com/pressreleases<br />
To receive all information automatically upon publication<br />
via email, shareholders and other interested parties<br />
may subscribe to press releases at<br />
http://www.partnersgroup.com/subscriptionform<br />
For all investor enquiries Philip Sauer can be reached<br />
as follows:<br />
<strong>Partners</strong> <strong>Group</strong><br />
Philip Sauer<br />
Zugerstrasse 57<br />
6341 Baar-Zug<br />
Switzerland<br />
Phone +41 41 768 86 60<br />
Fax +41 41 768 85 58<br />
philip.sauer@partnersgroup.com<br />
135
136<br />
EVALUATING AN INVESTMENT IN THE<br />
HEALTHCARE SECTOR<br />
David Layton Private Equity Directs & Primaries, Hans-Ulrich Müller Technology<br />
Investments and Guy Waller Investment Solutions Europe.
CONTACTS<br />
Investor relations<br />
Philip Sauer<br />
Phone +41 41 768 86 60<br />
Email philip.sauer@partnersgroup.com<br />
Media relations<br />
Dr. Anna Hollmann<br />
Phone +41 41 768 83 72<br />
Email anna.hollmann@partnersgroup.com<br />
www.partnersgroup.com<br />
partnersgroup@partnersgroup.com<br />
Zug:<br />
Zugerstrasse 57<br />
6341 Baar-Zug<br />
Switzerland<br />
Phone: +41 41 768 85 85<br />
Fax: +41 41 768 85 58<br />
New York:<br />
450 Lexington Avenue<br />
39th Floor<br />
New York, NY 10017<br />
USA<br />
Phone: +1 212 763 47 00<br />
Fax: +1 212 763 47 01<br />
London:<br />
1 Angel Court<br />
19th Floor<br />
London EC2R 7HJ<br />
United Kingdom<br />
Phone: +44 20 7260 1700<br />
Fax: +44 20 7260 1701<br />
Luxembourg:<br />
55, Avenue de la gare<br />
1611 Luxembourg<br />
Phone: +352 27 48 28 1<br />
Fax: +352 27 48 28 28<br />
Dubai:<br />
Dubai International Financial Center<br />
Offi ce No. 24, Level 3, Gate Village 10<br />
P.O. Box 125115<br />
Dubai UAE<br />
Phone: +971 4 401 9143<br />
Fax: +971 4 401 9142<br />
Beijing:<br />
Excel Center<br />
#1105, No 6 Wudinghou Street<br />
Xicheng District<br />
Beijing 100140<br />
China<br />
Phone: +86 10 8356 1600<br />
Fax: +86 10 8356 1601<br />
Tokyo:<br />
Daido Seimei Kasumigaseki<br />
Building 5F<br />
1-4-2 Kasumigaseki, Chiyoda-ku<br />
Tokyo 100-0013<br />
Japan<br />
Phone: +81 3 5532 2030<br />
Fax: +81 3 5532 2040<br />
San Francisco:<br />
150 Spear Street<br />
18th Floor<br />
San Francisco, CA 94105<br />
USA<br />
Phone: +1 415 537 85 85<br />
Fax: +1 415 537 85 58<br />
São Paulo:<br />
Rua Joaquim Floriano<br />
1052 Conj. 142<br />
CEP 04534-014<br />
São Paulo<br />
Brazil<br />
Phone: +55 11 3074 0346<br />
Fax: +55 11 3074 0349<br />
Guernsey:<br />
Tudor House, 3rd Floor<br />
Le Bordage<br />
St Peter Port GY1 1BT<br />
Guernsey<br />
Phone: +44 1481 711 690<br />
Fax: +44 1481 730 947<br />
Munich:<br />
Gundelindenstraße 2<br />
80805 Munich<br />
Germany<br />
Phone: +49 89 38 38 92 0<br />
Fax: +49 89 38 38 92 99<br />
Singapore:<br />
71 Robinson Road<br />
Level 13<br />
Singapore 068895<br />
Phone: +65 6671 3500<br />
Fax: +65 6671 3501<br />
Seoul:<br />
#<strong>302</strong>6 Floor ASEM Tower<br />
159-1, Samsung-dong, Gangnamgu<br />
Seoul 135-798<br />
South Korea<br />
Phone: +82 2 6001 3183<br />
Fax: +82 2 6001 3186<br />
Sydney:<br />
Aurora Place<br />
Level 33, 88 Philip Street<br />
Sydney, NSW 2000<br />
Australia<br />
Phone: +61 2 8216 1900<br />
Fax: +61 2 8216 1901<br />
137
Passion for Private Markets<br />
ZUG | SAN FRANCISCO | NEW YORK | SAO PAULO | LONDON | GUERNSEY | LUXEMBOURG | MUNICH | DUBAI | SINGAPORE | BEIJING | SEOUL | TOKYO | SYDNEY