Desk Monitoring Guide - National Reporting System
Desk Monitoring Guide - National Reporting System
Desk Monitoring Guide - National Reporting System

Create successful ePaper yourself
Turn your PDF publications into a flip-book with our unique Google optimized e-Paper software.
<strong>Desk</strong> <strong>Monitoring</strong>:Improving Program PerformanceBy:Larry CondelliSteve ColemanDahlia ShaewitzAMERICAN INSTITUTES FOR RESEARCH ®1000 Thomas Jefferson, Street, NWWashington, DC 20007This guide was prepared for the project:Enhancing Performance Through AccountabilityContract # ED-04-CO-0025/0001For:U.S. Department of EducationOffice of Vocational and Adult EducationDivision of Adult Education and LiteracyCheryl Keenan, DirectorDivision of Adult Education and LiteracyMike Dean, Program SpecialistDivision of Adult Education and LiteracyMay 2007
ContentsChapter 1 Introduction to <strong>Desk</strong> <strong>Monitoring</strong>...........................................................................................1Importance of <strong>Monitoring</strong> Performance ............................................................................................1<strong>Desk</strong> <strong>Monitoring</strong> ............................................................................................................................2An Approach to <strong>Desk</strong> <strong>Monitoring</strong> .................................................................................................4<strong>Desk</strong> <strong>Monitoring</strong> Tool ...............................................................................................................4Overview of <strong>Guide</strong> ....................................................................................................................5Chapter 2 Essential Elements: Designing a <strong>Desk</strong> <strong>Monitoring</strong> Tool......................................................7Before You Start… ............................................................................................................................7Measures ............................................................................................................................................8Outcome Measures.........................................................................................................................8Data Process Measures ..................................................................................................................9Program Process Measures ..........................................................................................................12Performance Standards and Performance Evaluation......................................................................19Continuous Improvement Model: Trends Over Time..................................................................20Relative Ranking Model: Comparisons With Mean Performance...............................................20External Criteria Model: Uniform Standards...............................................................................20Putting It All Together: Summative Rubric.....................................................................................21Develop a Scoring Scheme ..........................................................................................................22Assign Scores and Test Rubric ....................................................................................................23Examples From the States............................................................................................................23Chapter 3 Planning, Implementing, and Using <strong>Desk</strong> <strong>Monitoring</strong>.......................................................27Planning and Development ..............................................................................................................27Review and Refine Your <strong>Monitoring</strong> <strong>System</strong>..............................................................................28Collaborate During Development ................................................................................................28Field Test and Train Staff ............................................................................................................29<strong>Desk</strong> <strong>Monitoring</strong>: Improving Program Performancei
Implementation ................................................................................................................................30Provide Sufficient Resources.......................................................................................................30Support With Data <strong>System</strong>...........................................................................................................31Build Acceptance and Buy-in of Local Staff...............................................................................32Evaluate and Modify....................................................................................................................32Use and Results................................................................................................................................33Identify High- and Low-Performing Programs............................................................................33Reward and Sanction ...................................................................................................................34Provide Technical Assistance ......................................................................................................35Improve Local Data Use and State Planning ...............................................................................36Summary: Tips for Developing, Implementing and Using <strong>Desk</strong> <strong>Monitoring</strong> .................................36Appendix A: State Summaries.......................................................................................................... A-1ii<strong>Desk</strong> <strong>Monitoring</strong>: Improving Program Performance
List of ExhibitsExhibit 1-1. Advantages and Disadvantages of <strong>Desk</strong> <strong>Monitoring</strong> ....................................................3Exhibit 1-2.Exhibit 2-1.Fitting <strong>Desk</strong> <strong>Monitoring</strong> into a Program Improvement <strong>System</strong>....................................3Measures of Outcomes, Data Processes and Program Processes for<strong>Desk</strong> <strong>Monitoring</strong> Tool...................................................................................................9Exhibit 2-2. Kansas Program Quality Indicators for <strong>Monitoring</strong> ................................................13Exhibit 2-3. Summary of Suggested Measures for <strong>Desk</strong> <strong>Monitoring</strong> .............................................17Exhibit 2-4.Exhibit 2-5.Exhibit 2-6.Exhibit 2-7.Ohio’s <strong>Desk</strong> <strong>Monitoring</strong> Form....................................................................................18Performance Standard-Setting Models........................................................................19Developing a Summative Scoring Rubric...................................................................22Summative Rubrics: Examples From Three States.....................................................25Exhibit 3-1. <strong>Desk</strong> <strong>Monitoring</strong> Planning, Development, Implementation and Use .........................26Exhibit 3-2.Tips for Planning, Developing, Implementing,and Using a <strong>Desk</strong> <strong>Monitoring</strong> <strong>System</strong>.........................................................................36<strong>Desk</strong> <strong>Monitoring</strong>: Improving Program Performanceiii
CHAPTER 1INTRODUCTION TO DESK MONITORINGIn recent years, the role of data in assessing performance has entered center stage in adulteducation. Beginning with the implementation of the <strong>National</strong> <strong>Reporting</strong> <strong>System</strong> (NRS) in 2000,states have had to report to the U.S. Department of Education outcome data on students attendinglocal adult literacy programs, including educational gain, entry into employment, transition topostsecondary education, and attainment of a secondary school credential. In addition, many stateshave their own reporting requirements, sometimes more rigorous than that of the NRS. Programs,schools, and teachers must demonstrate they are reaching their targets for student achievement,enrollment goals, contact and service hours, and other performance goals by collecting andsubmitting data to state education agencies. Although the Workforce Investment Act (WIA), whichestablishes federal funding for adult literacy programs, does not require it, several states have alsoimplemented performance-based funding. As a result of these trends, the monitoring of local programperformance and program activities has become an essential element of state accountability systems.The rationale behind these requirements is the belief that quality programs produce goodoutcomes and, conversely, that a focus on these outcomes will result in higher quality programs.Although a relationship certainly exists between outcomes and good program practice, therelationship is complex and does not happen automatically. For students to acquire literacy skills andachieve measurable outcomes, for example, there must be effective instruction, professionaldevelopment to train teachers, and valid and reliable assessment. In addition, the program must havegood data collection and reporting procedures. The complexities of these processes—which occurwithin the uneven resources, varying staffing patterns, and students with widely varying skills andgoals that are typical of most adult education programs—often create a tenuous relationship betweenprocesses and outcomes.Importance of <strong>Monitoring</strong> PerformanceTo understand what programs do and how their procedures affect performance, statesmonitor local program activities and outcomes. Data on program staffing, instruction, contact hours,student characteristics, student outcomes, professional development, and financial informationcollected through monitoring activities allow states not only to evaluate program outcomes but alsoto ensure that programs are meeting grant requirements, following required procedures and policies,and providing quality services. States use information derived from monitoring in the followingways.• Meet state and NRS accountability requirements. Student outcome data frommonitoring can tell states how programs are doing toward NRS and state accountabilitygoals and whether they are meeting performance standards set by the state or in grantrequirements.• Implement and evaluate progress toward state policy objectives. States canimplement policy by setting requirements for program activities and performance andgauge the success of these policies with monitoring data. For example, if state policy isfor programs to provide more intensive instruction to achieve educational gains,monitoring data on related measures can help the state track and evaluate progress towardthese goals.<strong>Desk</strong> <strong>Monitoring</strong>: Improving Program Performance 1
• Promote program improvement. Data from monitoring allows states to evaluate andrank program performance in multiple ways and to identify lower-performing programsfor technical assistance. This information also allows states to identify areas in need ofassistance and thereby target assistance more efficiently.• Identify effective programs and practice. Just as states can use monitoring data toidentify programs and areas of low performance, the same information will help identifygood performance. By focusing on programs that are successful, states can identifyeffective practice to transfer to other programs. States can also enlist staff from moresuccessful programs to help their peers adopt better practices.Program monitoring is nothing new. Oversight of local programs has always been a routinepart of administrative procedures. States review grant applications, periodic progress reports, andfinancial reports and conduct on-site monitoring of local programs. A team of staff from the stateoffice periodically visits programs and typically interviews staff, observes classes, speaks withstudents, and reviews procedures to ensure compliance with state requirements, to check that theprogram is providing quality service, and to identify technical assistance needs. Because of the timeand expense required to conduct monitoring visits, these visits occur annually or less frequently,especially in large states where it may take state staff two to three years to visit all programs.<strong>Desk</strong> <strong>Monitoring</strong>With the advent of increased accountability requirements, however, the need for data todemonstrate high performance has substantially increased the monitoring burden for states. At thesame time, funding for adult education programs has remained level or decreased in some states,while transportation and travel costs have increased significantly. The time and cost of on-sitemonitoring make it impossible for states to use it as their sole or primary way of tracking programperformance and compliance. Fortunately, all states now have data systems and can use these data toperform many monitoring functions. Through the use of these data, desk monitoring is becoming aneffective and efficient way to assist states in meeting their monitoring needs.<strong>Desk</strong> monitoring is an approach to reviewing and tracking program performance by usingdata from your state system and other quantitative data. Using a structured format, local programsprovide these data regularly (e.g., monthly, quarterly) to the state office where state staff can reviewthem to guide program review activities, inform technical assistance plans, and promote programimprovement.<strong>Desk</strong> monitoring offers significant advantages over on-site monitoring. Because it reliesprimarily on data that programs already collect and report, it is inexpensive to implement and, onceestablished, requires little additional burden to local programs. Programs can submit dataelectronically, eliminating the need for travel and staff time out of the office. Because deskmonitoring uses quantitative data, you can use it to establish trends and compare programs’performance over time or to state standards. With desk monitoring reports, state staff cancommunicate on a regular basis with local staff about performance, technical assistance, andanticipated changes, rather than only once a year or more, as might occur with infrequent on-sitemonitoring.Despite its significant advantages, desk monitoring can never completely substitute foron-site monitoring because desk monitoring cannot collect direct information on a program’sprocesses and procedures. Program activities such as goal setting, instruction, and assessment2 <strong>Desk</strong> <strong>Monitoring</strong>: Improving Program Performance
procedures cannot be quantified, and you can evaluate them only through observation. Moreover,desk monitoring does not allow interaction with program staff or students or allow first-handobservation of the program environment and setting. Such experiences often add an insight intoprograms that desk monitoring cannot provide. Exhibit 1-1 summarizes the advantages anddisadvantages of desk monitoring reviews.Exhibit 1-1Advantages and Disadvantages of <strong>Desk</strong> <strong>Monitoring</strong>AdvantagesPrograms can submit data and reportselectronically.State can make more efficient use of stafftime; reviews can be built into regularworkloads over time.Data are quantitative and can be comparedwith previous years’ data or with statestandards. Most data are already collectedfor NRS and other accountabilityrequirements.No travel is required; there is no time out ofthe office and no travel expenses.DisadvantagesAssumes data are accurate; requires gooddata quality and trust in the data.Does not allow for the voices/perspectives ofmultiple local staff members.Cannot collect qualitative measures orinteraction (e.g., intake processes,professional development activities, andinstructional measures).Gives static view of program without dynamicinteraction with local program staff in context.<strong>Desk</strong> monitoring works most effectively when it is integrated with the state’s system foron-site monitoring and technical assistance approach to promoting program improvement.Exhibit 1-2 illustrates the relationship among the types of monitoring, technical assistance, andprogram improvement efforts. You can use the findings from desk reviews to focus themore-intensive on-site reviews and to identify technical assistance needs. Alternatively, on-sitereviews can identify the need for more-intensive desk monitoring. Coordinating both approaches willallow states to make the most efficient use of data to evaluate programs and promote yourimprovement efforts.<strong>Desk</strong> <strong>Monitoring</strong>: Improving Program Performance 3
An Approach to <strong>Desk</strong> <strong>Monitoring</strong>We prepared this guide for state and local adult education staff interested in developing adesk monitoring approach within their state. We present a comprehensive approach to developing,implementing, and using desk monitoring that includes four steps.1. Design a monitoring tool. A desk monitoring tool is a reporting format that includesall the measures you will use and a basis for evaluating programs, such asperformance targets, past years’ trends or performance of other programs, and asummative rubric. The rubric allows for summary scores of performance based on allor a selective weighting of the measures.2. Plan and develop desk monitoring procedures. Introducing desk monitoring isoften a significant change for local programs and requires an approach to planningand development that includes integrating it into your overall monitoring andadministrative procedures, collaborating with local program staff, field testing, andtraining.3. Implement desk monitoring. Once developed, getting desk monitoring to work tohelp improve program performance requires sufficient resources, including staff andtime to review data and work with programs, a data system that allows state and localstaff easy and timely access to data and reports, and acceptance of the system as avaluable improvement to performance monitoring.4. Use and evaluate desk monitoring. When used effectively, desk monitoringprovides an objective basis for identifying high- and low-performing programs, abasis for rewarding and sanctioning programs on the basis of performance, and a wayto identify technical assistance needs.To inform this approach and other recommendations in this guide, we consulted with fivestates—Colorado, Kansas, Massachusetts, Ohio, and Texas—that have developed and are usingaspects of desk monitoring as part of their state monitoring approach. We have synthesized theirwisdom and insights into our guidance and illustrate many of our recommendations with concreteexamples from their experiences. The appendix to the guide includes detailed summaries of theapproach of each state. We also consulted with New York state staff on their monitoring approach,many aspects of which are relevant to desk monitoring.<strong>Desk</strong> <strong>Monitoring</strong> ToolTo assist states in designing desk monitoring procedures, we developed the NRS <strong>Desk</strong><strong>Monitoring</strong> Tool, a series of spreadsheets that includes more than 25 measures of student outcomes,data collection procedures, and program processes that are important for program monitoring. Usingthe tool, you can select the measures most relevant to your state and design a desk monitoring reportthat you can use to collect data from local programs. You can also design the report to include trends,comparison data, or performance targets to use to evaluate local performance.The desk monitoring tool provides a simple way to explore different approaches to deskmonitoring. Once the report is designed, you can integrate it into your state data system so that localprograms can generate and submit it regularly to the state office. You can also develop formats fordisplaying the data so that state and local staff can easily understand and review their data, track their4 <strong>Desk</strong> <strong>Monitoring</strong>: Improving Program Performance
ongoing progress, and monitor program improvement efforts. To assist in reporting, we have alsodeveloped two templates to use with the desk monitoring tool to illustrate ways to display and usedata.Overview of <strong>Guide</strong>The remainder of this guide explains our four-step approach for developing and using deskmonitoring. In chapter 2, Essential Elements: Designing a <strong>Desk</strong> <strong>Monitoring</strong> Tool, we discuss how todevelop a reporting tool that captures data essential for desk monitoring from local programs. Wediscuss what outcome, data process, and program process measures to include and also discuss theimportance of including evaluative criteria, such as trend data or state performance standards, as abasis for comparison of local performance. A successful monitoring tool also has a rubric tosummarize the performance data collected from local programs.Chapter 3, Planning, Implementing, and Using <strong>Desk</strong> <strong>Monitoring</strong>, reviews the processes ofstarting and sustaining desk monitoring in your state and using desk monitoring data. It discusses theimportance of integrating desk monitoring into on-site monitoring and other types of approaches totracking program performance, obtaining support and buy-in from local program staff, pilot testing,and training. The chapter also reviews the importance of a good data system for desk monitoring andoffers ideas for using data to reward program performance and identify technical assistance needs.Throughout this chapter, we draw on the experiences from the states we consulted that havedeveloped and use desk monitoring to inform our guidance. Appendix A to this guide containssummaries of the desk monitoring approaches of the five states we consulted that use deskmonitoring approaches.This guide is the seventh in a series of guides designed to assist states in implementing theNRS and using NRS data to promote program improvement. The NRS project staff at the AmericanInstitutes for Research developed all these guides through projects funded by the Office ofVocational and Adult Education (OVAE), Division of Adult Education and Literacy (DAEL).Readers interested in more information about the NRS, including requirements and policy, shouldconsult the NRS Implementation <strong>Guide</strong>lines or the NRS project website, www.nrsweb.org.<strong>Desk</strong> <strong>Monitoring</strong>: Improving Program Performance 5
CHAPTER 2ESSENTIAL ELEMENTS: DESIGNINGA DESK MONITORING TOOLA desk monitoring approach to tracking and evaluating local program performance isattractive to state administrators because of its relative ease and efficiency of implementation. Statestaff can design monitoring tools that put into a structured format the information that local programsalready submit and allows both state and local staff to track program activities and progress. <strong>Desk</strong>monitoring also provides a mechanism for regular communication between state and local programsregarding unanticipated changes or needs for technical assistance.How well a desk monitoring approach succeeds in these functions, however, depends onwhether the process includes a monitoring tool that incorporates essential elements of a good deskmonitoring system. In this chapter, we review these essential elements:1. Measures tied to state priorities that accurately reflect performance,2. Evaluative standards or other benchmarks that define good performance, and a3. A summative rubric that characterizes overall program performance.The chapter presents a comprehensive set of measures to include in a desk monitoring tooland explains how to use the measures to evaluate program performance.Before You Start…A monitoring tool serves as a reporting format through which local programs submit data tothe state office. The first step in developing this tool is to decide on the measures you will use toevaluate program performance. Some of the measures you select will be those required by the NRS,grant requirements, or other accountability needs. However, you will want to include other measuresto help you understand your local programs’ procedures and how the programs collect data.Developing a desk monitoring tool requires the state to select a manageable number of measures thatwill meet these goals.To guide the selection of measures, your state needs a clear policy and direction forprograms. You need to have a clear idea of the outcomes you want programs to achieve that willdefine quality. For example, state policies on contact hours, number and type of students a programshould enroll, and the outcomes expected, such as completing educational levels or promoting GEDtest passage, will guide the selection of measures. The old adage “you measure what you treasure”sums it up.Data quality is a second critical consideration guiding the selection of measures. Make surethat local programs are able to collect and report the information required by desk monitoring in avalid and reliable way. The measures will not help—or worse, will hinder—efforts at programimprovement if they do not accurately reflect performance. Often it takes a year or two of using deskmonitoring before data quality is satisfactory for some measures, an issue to which we return in moredetail in Chapter 3.<strong>Desk</strong> <strong>Monitoring</strong>: Improving Program Performance 7
MeasuresThe nature of desk monitoring requires quantitative measures of program performance andactivities. While the level of quantification can be minimal—a percentage, or the presence or absenceof an activity, for example—only quantitative measures will allow you to collect the objectiveindicators needed to take advantage of the positive aspects of the desk monitoring process. Use ofquantitative measures means that you cannot evaluate some areas related to program performancethrough desk monitoring, but does not limit you as much as may first appear. An effective deskmonitoring tool can include quantitative indicators that reflect many critical program activities andprocedures.However, having the right measures in your desk monitoring instrument is much moreimportant than whether the measures are quantitative or qualitative. Measures that reflect statepolicies and goals can help you understand how the program is performing and help you implementprogram improvement efforts; they are the measures that make desk monitoring effective.Three types of measures are needed for an effective data monitoring instrument: outcome measures,data process measures, and program process measures.Exhibit 2-1 summarizes the types of measures and their interrelationship. Outcome measuresreport on student performance and reflect the ultimate goals of adult literacy education: teachingliteracy skills and helping students achieve their educational goals. Data process measures are notdirect measures of data collection activities but provide indicators of the procedures that programsfollow to collect data. Likewise, program process measures are indicators of the program activitiesthat are the basis of an adult education program and that affect student performance, such asrecruitment, instruction, and professional development.Outcome MeasuresStudent outcomes are the central element of desk monitoring. <strong>Desk</strong> monitoring instrumentsmust include the core NRS outcome measures of educational gain and the follow-up measures ofreceipt of a secondary credential, entry into postsecondary education, and entered and retainedemployment. Because these are required NRS measures, all programs already collect them and canreport them in a desk monitoring approach. For educational gain, programs simply record the numberof students enrolled and the number who advanced one or more levels in each of the 12 NRS levelsand additional state-specific levels, if any. For the follow-up measures, a basic monitoring instrumentcollects the number of students with the outcome goal and information on whether they achieved thatgoal.Many states have additional outcome measures that also should be included in deskmonitoring if they are important for assessing and understanding local performance. For example,some states measure family literacy outcomes, success in passing the citizenship test or achievingcitizenship, and student gains in earning following employment.8 <strong>Desk</strong> <strong>Monitoring</strong>: Improving Program Performance
Data Process MeasuresAlthough a desk monitoring instrument can consist solely of outcome measures, thesemeasures by themselves are not usually sufficient for understanding program performance. Measuresof data processes will greatly enhance your ability to assess how programs are collecting the outcomemeasures and whether they are following procedures that affect data quality. For this reason, severalstates require local programs to demonstrate they are following prescribed data collection proceduresthat are monitored.The data process measures used for desk monitoring should have a relationship to dataquality to be effective; the closer the relationship, the more powerful the measure. The NRS<strong>Guide</strong>lines, <strong>Guide</strong> for Improving NRS Data Quality, and the NRS Data Quality Checklist provideguidance on the types of measures of data collection processes that are important for deskmonitoring. Such measures should reflect program assessment procedures that affect educationalgain and goal setting and follow-up procedures that affect postsecondary enrollment, employment,and postsecondary credential attainment measures.Assessment procedures. Determining educational gain requires programs to pre- andposttest students with standardized assessments. Programs must follow the state NRS assessmentpolicy that describes which assessment the programs can use, when to administer the pretest, when toposttest, and how to match scores on the assessment to NRS levels. Obtaining posttests of students is<strong>Desk</strong> <strong>Monitoring</strong>: Improving Program Performance 9
a critical element of educational gain measures because programs cannot determine NRS educationallevel advancement or completion without a posttest. Other factors that affect valid assessmentinclude using equated alternate forms of the same test for pre- and posttesting (or using acomputer-adapted test that ensures students get minimal non-overlapping items) and training staff ontest administration.As a state monitor, you want to know whether programs are following the state assessmentpolicies, especially in regard to the number and percentage of students that are pre- and posttestedand the time between the two assessments. Programs that pre- and posttest high percentages of theirstudents at the appropriate times will have more accurate and valid measures of educational gainacross the levels. The following quantitative measures reflecting these assessment processes areamenable to a desk monitoring approach.• Number and percentage of students pretested by a set time. Knowing the proportionof students pretested within a certain time (e.g., at intake, two weeks after enrollment, bycontact hours) allows you to ensure that programs are pretesting all students in a timelyway. A percentage that is too low may indicate a problem with assessment procedures,and data quality will suffer.• Number and percentage pre- and posttested. If the program is not posttesting asufficient number of students, educational gain will be too low. A poor posttestingpercentage also may indicate problems with student retention.• Average contact hours between pre- and posttest. Publishers of standardizedassessments provide guidelines for the minimum number of instructional hours beforeposttesting can detect gains. State NRS assessment policy should establish the time,based on these guidelines, when programs are to posttest. A measure of average contacthours between pre- and posttesting allows a desk monitor to determine whether programsare adhering to this time.A desk monitoring tool can include these measures by level, separately for ABE and ESLstudents, or aggregated for the program overall. If programs vary in the assessments they use, it isalso be advisable to have separate measures for each assessment.A desk monitoring approach can also track whether programs follow the other NRSrequirements for valid assessments (e.g., using a state NRS–approved assessment, using alternateforms or items in the pre- posttesting process, using scores to place students within NRS levels), butit is better to do so through quality control procedures within the program. For example, the NRSdata system could have error checks to verify the use of correct assessments and alternate forms andautomatically assign students into levels on the basis of test scores. Problems in these areas requireimmediate correction and would take too long to identify and correct through desk monitoring.Training local staff in the proper administration of assessment, also a critical part of valid assessmentprocedures, is a professional development issue, which we will discuss later.Goal setting and orientation. The NRS follow-up measures of entered and retainedemployment, entry into postsecondary education or training, and receipt of a secondary credential areoften the most difficult measures for local programs because collecting them involves severalcomplicated and interrelated procedures. Programs must have a good orientation and goal-settingprocess to ensure that appropriate follow-up goals are set, and they need procedures for trackingstudents. Programs that use the survey method for collecting follow-up measures must also have10 <strong>Desk</strong> <strong>Monitoring</strong>: Improving Program Performance
procedures for contacting students and achieving a sufficient response rate for a valid survey. Fordata matching approaches, it is critical to ensure that programs collect students’ Social Securitynumbers accurately.It is especially important to monitor local program procedures in each of these areasfrequently because of the timely nature of the follow-up measures. If programs do not identifyproblems and errors early in the process, too much time may elapse before students can be identifiedand contacted for correction, resulting in lost information. <strong>Desk</strong> monitoring can provide theinformation needed to prevent this problem.Programs’ goal-setting and orientation procedures are complex and difficult to capturequantitatively. A full review and understanding of them require observation and discussion withprogram staff. Nonetheless, a monitoring instrument can include some indicators that provide usefulinformation about the outcome of the process. Like other measures, you can use these measures tohelp you understand data quality and as a way to induce programs to follow good goal-settingprocedures. Three simple measures will serve these purposes.• Number of students who completed the goal-setting process. Besides being goodprogram practice, goal setting is essential for identifying students with NRS follow-upgoals. Although this measure cannot tell the quality of the goal-setting process, knowingthe number of students who completed it can indicate how thoroughly the program isperforming goal setting. A low number can alert you to problems.• Time goal setting was completed. Programs need to conduct goal setting as part of theenrollment process or soon thereafter. Student goals also change over time, and programsmay need to revise them. A measure of when the goal setting occurred relative to studentenrollment allows a state monitor to verify that the process was at an appropriate time.Program can report this time in contact hours or days after student intake.• Number of students with goals. On the one hand, it is tempting to underreport follow-upgoals by setting few of them or setting goals only for students who are very likely toachieve them. This approach saves programs from having to conduct follow-up activitiesand helps ensure that a higher percentage of students achieve the goal. On the other hand,overreporting the number of students with follow-up goals by setting theminappropriately results in unnecessary follow-up and artificially low performance.Tracking the number of students who have each of the four follow-up goals provides agauge for whether goal setting is reasonable and appropriate for a program, in light of itspast performance and type of students it serves.As with the assessment measures, a desk monitoring tool can include these measures bylevel, separately for ABE and ESL students, or aggregated for the program overall.Follow-up procedures. A second data process related to the NRS follow-up measures are theprocedures programs used to keep track of students and collect the measures after students exit theprogram. Collecting these measures requires programs to contact students through a phone survey orrequires the state to use data matching, in which student record are matched with another data base(e.g., unemployment insurance records, GED test records) to verify whether the student achieved theoutcome. Many states use a combination of methods.To provide valid data, telephone surveys must have a high response, which for the NRS is aminimum of 50 percent. The most challenging aspect of conducting surveys is locating students after<strong>Desk</strong> <strong>Monitoring</strong>: Improving Program Performance 11
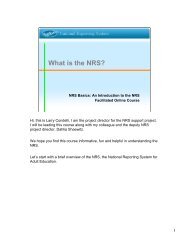
they exit to collect data and achieve this level of response. In addition, the NRS employmentmeasures are time bound: entered employment must be collected after the first quarter after exit andretained employment after the third post-exit quarter. States relying on data matching are sparedhaving to conduct a survey but must collect students’ Social Security numbers. These requirementssuggest two measures for desk monitoring.• Number of students contacted by time. Data on how many students the program isreaching and whether it is contacting the students regularly and within the correct timeframe allow desk monitors to know whether the survey is on track toward reachingstudents and achieving a good response rate. Programs could report this number in totalor broken down by each of the four follow-up measures.• Number of students with Social Security numbers. The biggest obstacle to collectingfollow-up measures through data matching is missing students’ Social Security numbers.Regularly monitoring the proportion of Social Security numbers programs have collectedallows staff to identify and correct potential problems before it is too late.Keeping track of survey response rates, when programs conduct their surveys, and whetherprograms are collecting Social Security numbers will minimize missing data and improve the validityof follow-up measures.Program Process MeasuresProgram process measures provide indicators of the services that programs provide and howthe program works—the procedures and services performed that affect outcomes. Although outcomemeasures tell us what students are achieving and data process measures provide indicators ofprocedures affecting data collection, program process measures indicate what actually goes on in theprogram to produce the outcomes. Accountability systems like the NRS assume that good outcomesresult from good programs. Including measures of program processes in desk monitoring allows youto verify this assumption. These measures also help you understand why a program is performing theway it is and offer clues for identifying reasons for good and poor performance to guide programimprovement efforts.Most states have general indicators of good program performance that they use in monitoringand evaluating programs. In the early 1990s, the <strong>National</strong> Literacy Act (NLA) required states todevelop model indicators of program quality for adult education. Using the model indicatorsdeveloped by OVAE, most states developed quality indicators to define good program policy andpractice in the following areas:• Recruitment and enrollment• Retention and attendance• Professional development and staff• Curriculum and instruction• Support servicesMany states continue to use these indicators to guide their program monitoring and programimprovement efforts.A thorough examination of program process based on quality indicators requires more directobservation and contact with programs through on-site monitoring. However, you can include in a12 <strong>Desk</strong> <strong>Monitoring</strong>: Improving Program Performance
desk monitoring instrument several simple measures of program process that can provide goodindicators of program quality. Integrating such measures into desk monitoring creates acomprehensive approach to program monitoring that integrates program processes with studentoutcomes. Kansas, for example, uses quality indicators as part of its desk monitoring approach, assummarized in Exhibit 2-2.Program DesignExhibit 2-2Kansas Program Quality Indicators for <strong>Monitoring</strong>• The program design and program processes for all program sites incorporate the ComprehensiveAdult Education Planner.• The program services, including instructional activities and support services, and scheduling reflectthe needs of the community.Technology• The program has a technology plan and incorporates the use of current technology into instruction.• The Program provides technology-specific instruction including current computer applications anduse of internet.Teacher Quality• Paid instructional and administrative staff has appropriate educational backgrounds.• Paid instructional and administrative staff is currently Kansas Adult Education Association (KAEA)credentialed.• Professional development provided with federal funds results in the program meeting its programimprovement plan.Collaboration with Partners• The program collaborates with multiple partners to provide quality services to adult learners.• The program seeks and responds to input from local stakeholders regarding planning for localservices.Cost Effectiveness• The program provides quality adult education services at a cost per outcome that is aligned with thestate average.Recruitment and enrollment. The type of student a program serves affects many aspects ofprogram performance. For example, programs that serve students at higher literacy levels will usedifferent instruction and outcomes than programs that serve low-literate students. For this reason,states often set enrollment requirements for programs as a way to implement policy goals, such asimproving service to specific populations and increasing employment or postsecondary transition.Knowing student characteristics provides a context for understanding the program and its outcomesand is also a means for monitoring program compliance toward enrollment goals set in grantrequirements.A desk monitoring instrument can include the total enrollment of students and the numberand proportion of students by characteristics of interest, for example, age, ethnicity, or literacy level.Measures on student enrollment in a program provide an indicator of recruitment practices, andproblems can raise a red flag that such practices may need to improve.Retention and attendance. Measures of student attendance and retention allow you to trackwhether students are receiving sufficient number of contact hours to make gains. If educational level<strong>Desk</strong> <strong>Monitoring</strong>: Improving Program Performance 13
completions are low, for example, you can examine the number of student attendance hours to seewhether they also are too low to expect gains. In addition, a review of contact hours also gives a statemonitor a convenient way to verify that a local program is providing the number of instructionalhours required by its grant. Requiring programs to report through desk monitoring their average totalstudent attendance hours, and hours broken down by NRS level or student demographics factors, is asimple way to obtain this information.Another measure helpful in monitoring retention is the number and percentage of studentswho exit the program before completing a level. Regular monitoring of this information will alertprograms of the need for changes and improvements in their student retention practices. Manyprograms try to improve retention by contacting students after a certain number of absences. If this isa policy in your state or program, you can track your performance in trying to reach students byreporting the number and percentages of students contacted after being absent as a third retentionmeasure.A fourth measure of retention is suggested by the fact that adult literacy students often “stopout” of class. That is, they attend for some time, stop attending, but then return. A way to measurethis pattern of attendance is to have programs report on the percentage of scheduled class hoursstudents attend (the proportion of attended hours by scheduled hours). This measure provides anindication of intensity or regularity of attendance that a raw total does not. For example, if a studentattends for 50 hours of a class scheduled for 100 hours, the measure would be 50%, or 0.5. However,another student in a different program who attends 50 hours in a class scheduled for 150 hours wouldget a rating of 0.33. Both students would be recorded as getting 50 hours of instruction, which mightlead you to believe that both programs have the same level of retention. An examination of theproportion of scheduled hours attended, however, reveals a different pattern and leads to a differentconclusion about the students and programs.Professional development and staff. A quality adult education program requireswell-trained and experienced teachers who participate regularly in professional developmentactivities. Because of the importance of good teaching and professional development, many states’data systems include information about teachers. A desk monitoring tool can capture these data tohelp ensure that programs have well-trained staff and that teachers are receiving adequate training.A quantitative desk monitoring approach can neither capture the type and quality ofprofessional development nor assess teachers’ skills and abilities. However, the following simplemeasures will provide a general picture of a program’s staff and professional development activitiesfor desk monitoring.• Number of credentialed teachers. Teaching credentials and college degrees are themost common indicators of trained teachers, but your state or programs may want toknow about other certification or training that teachers have to meet the needs of thestudent population. These may include certification in adult education or teaching Englishas second language; expertise in subject areas, such as reading or mathematics; orlanguages spoken or other specialized skills.• Number of teachers by ethnicity. This measure is informative if your state wants totrack whether programs have culturally diverse teachers or compare teacher and studentcharacteristics.14 <strong>Desk</strong> <strong>Monitoring</strong>: Improving Program Performance
• Mean hours of professional development received. Your state may have requirementsfor teachers to receive professional development annually that this measure can track.Including the specific topic areas covered in the training provides additional informationthat you may need for monitoring if your state has required training areas(e.g., assessment, NRS requirements, reading, ESL issues).This information can help identify programs that need additional training or technicalassistance.Curriculum and instruction. The issue of whether a program is providing effective andquality instruction is too complex for a desk monitoring approach, which requires unambiguousquantitative measures. Among the factors affecting instruction are whether the content andapproaches match the needs of students; the balance of ABE and ESL classes at appropriate levels;and its quality, duration, content, and pedagogy. Many states have implemented or are developinginstructional content standards to improve quality.<strong>Desk</strong> monitoring is not an effective way of measuring these critical elements of instruction.However, you can monitor:• the number and types of classes offered by educational functioning level or subject and• the number of instructional hours offered for types of classes.Such data are useful for monitoring compliance with grant requirements and for getting apicture of the type of classes and intensity of instruction offered. When examined alongside outcomeand retention measures, this information can suggest explanations for performance patterns and whatmay be working well, as well as identify areas in need of improvement. For example, fewinstructional hours and classes offered may explain low retention and educational gain within aprogram.Support services. Support services promote student attendance and learning by removingbarriers to participation and providing additional assistance to aid learning. Job requirements,conflicting schedule demands, transportation, and child care issues are the most common reasons forlow attendance and retention. When programs can address these problems, they can often improvetheir overall performance and retention. A measure of the number of students using these servicescan provide a way to assess both the need for these services and whether students are using them.Support services are costly, and most programs do not provide them directly. Instead,programs often have partnerships with service agencies to which they refer students. Partnershipsmay be informal or may be formalized through agreements such as memorandum of understanding.Collecting information on the number of students receiving or referred to support services givesstates a straightforward way to evaluate how and whether programs are providing such services.Costs and expenditures. Assessing a program in terms of its cost efficiency is one of themost frequently used evaluation methods in all fields of service delivery. In a field such as adultliteracy education, where resources are almost always scarce, there is great emphasis on providinghigh-quality service at lowest cost. This tension between quality and cost is what makes evaluationon the basis of cost measures always controversial. There is also resistance, especially in educationand other human service areas, to reduce program effectiveness to mere dollars and cents. Yet, noneof us can really ever ignore costs, and if used effectively, measures of cost or expenditure can be<strong>Desk</strong> <strong>Monitoring</strong>: Improving Program Performance 15
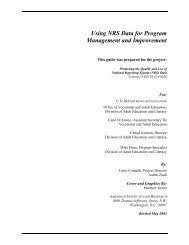
successful drivers of program improvement. Expenditure is a more accurate term to use with suchmeasures because costs are calculated according to the funding that is actually spent by the program.Developing a good measure of expenditure seems easy: typically it is the total budget orexpenditure divided by the unit of interest (e.g., student, instructional hour). Unfortunately, it is oftendifficult to determine both numerator and denominator of this ratio. Programs sometimes receivestate, local, and federal money and may also have in-kind contributions. To develop a fair and usefulmeasure, you must first decide which funds to include and apply this fairly to all programs. In-kindcontributions are often especially difficult to calculate and if unevenly distributed across programsmay give an inaccurate estimate of actual expenditures.Once you have decided on the total budget calculation to apply to programs, what you use asthe unit of analysis for the denominator depends on what you want to know about your program’sexpenditures. Each measure provides different information and offers different policy implications.We focus on four:• Expenditure per student• Expenditure per outcome• Expenditure per instructional hour• Expenditure per student instructional hourExpenditure per student provides a very general, undifferentiated measure of a program’sexpenditure and works well when all programs being compared are similar in the amount ofinstruction and services offered. Adult education programs, however, often differ significantly, andexpenditure per student can be misleading as a measure of quality. For example, if two programshave the same budget but one serves more students than the other, that program may seem cheaperbut may achieve that low expenditure through a low retention rate. Cost per outcome is powerful inenvironments that emphasize achieving outcomes efficiently. However, this measure can favorprograms with more-advanced students who can achieve outcomes faster because time in program isnot considered.Many people prefer expenditure per instructional hour as a measure because it helps focus onintensity of instruction, regardless of the number of students served or outcomes achieved. Aprogram providing more hours of instruction will be less expensive with this measure regardless ofhow many students it serves than a program with the same budget that provides fewer hours. Theexpenditure per student instructional hour measure uses the average instructional hour per student asthe unit of analysis. This approach is attractive to states and programs that want to promote retentionbecause programs with higher average attendance per student have lower expenditures on thismeasure.Because expenditure is calculated using measures already collected for other reasons, it iseasy to examine with desk monitoring if the program budget is known. States can use several or all ofthe measures, depending on their needs and priorities. States that use expenditure measures reportthat the measures often make programs think about costs in new ways. Colorado, for example, notedthat its measure of expenditure per learner hour of instruction was its best predictor of performancebecause it encouraged student retention.Exhibit 2-3 presents a summary of all the measures discussed in this section. Exhibit 2-4shows Ohio’s desk monitoring form. Appendix A provides complete information about the measuresused by five states.16 <strong>Desk</strong> <strong>Monitoring</strong>: Improving Program Performance
Outcome MeasuresExhibit 2-3Summary of Suggested Measures for <strong>Desk</strong> <strong>Monitoring</strong>• Educational level completion (one for each NRS or state level or combined)• Receipt of secondary credential (adult high school diploma or GED test)• Entry into postsecondary education• Entered employment• Retained employmentData Process Measures• Number and percentage of students pretested by a set time• Number and percentage pre- and posttested• Average contact hours between pre- and posttest• Number of students who completed the goal-setting process• Time the goal setting was completed• Number of students with goals• Number of students contacted by time• Number of students with Social Security numbersProgram Process Measures• Total enrollment• Enrollment by subgroups (e.g., educational level, demographic variables)• Average attendance hours• Average hours by subgroups• Proportion of scheduled hours attended• Number of credentialed teachers• Number of teachers by ethnicity• Average hours of professional development received• Number and types of classes offered by educational functioning level or subject• Number of instructional hours offered for types of classes• Number of students receiving or referred to support services• Number and type of agencies with which programs partner for support services• Expenditure per student• Expenditure per outcome• Expenditure per instructional hour• Expenditure per student instructional hour<strong>Desk</strong> <strong>Monitoring</strong>: Improving Program Performance 17
Exhibit 2-4Ohio’s <strong>Desk</strong> <strong>Monitoring</strong> Form18 <strong>Desk</strong> <strong>Monitoring</strong>: Improving Program Performance
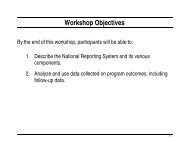
Performance Standards and Performance EvaluationThe measures you select to include in a desk monitoring tool define what your state believesis important about program quality and performance. Measures also reflect state policy because theyare the basis by which the state judges and funds adult literacy services. Although measures definewhat is important, they do not define a level of performance that is acceptable. In addition, bythemselves they are not informative about how well programs are performing. The next step indeveloping a desk monitoring tool is to select the performance standards or other evaluative criteriayour state will use to assess program performance.You are probably familiar with standard setting because all states negotiate performancestandards with OVAE for the core NRS measures. OVAE’s standard setting is based on your state’spast performance and reflects a model of continuous improvement. However, this type ofstandard-setting model is just one approach—and it may not always be the most appropriateapproach for desk monitoring. Because setting performance goals for measures often changes localprogram operations in key areas affected by the measures, standard setting is not only a means topromote quality but also a powerful method to change behavior to implement state policy.Standard-setting models are tools that can implement policy and change program operation indifferent ways. Standards will be most effective when the model matches your policy goals.Exhibit 2-5 summarizes three standard-setting models that are appropriate for desk monitoring. Theguide on NRS Data <strong>Monitoring</strong> for Program Improvement discusses standard setting in greater detail.Exhibit 2-5Performance Standard-Setting ModelsModel Policy Strategy Example Advantage DisadvantageContinuousImprovement.Standard isbased onprogram’s pastperformance.RelativeRanking.Standard is themean or medianstateperformance.ExternalCriteria.Standard is setby formula orexternal policycriteria.Designed tomake allprogramsimprovecompared withthemselves.Used forrelativelystablemeasures, forwhich medianperformance isacceptable.Promotesadoption of apolicy goal toachieve auniform higherstandard ofperformance.Program will showa 10 percentincrease from lastyear in the numberof studentsadvancing to low–intermediate ESL.Percentage ofstudents passingthe GED in theprogram will beequal to or greaterthan the stateaverage.Programs willachieve at least a50 percentresponse rate onthe follow-upsurvey.Works well whenthere is stabilityand a history ofperformance onwhich to basethe standard.Focusesprogramimprovementmainly onlow-performingprograms.Appropriate toensure anaccepted level ofquality and forstrategies whenlargeimprovementsare needed,sometimes overthe long term.Ceiling isreached overtime so that littleadditionalimprovement ispossible.Higherperformingprograms havelittle incentive toimprove.If set withoutconsideringpastperformance,may beunrealistic andunachievable.<strong>Desk</strong> <strong>Monitoring</strong>: Improving Program Performance 19
Continuous Improvement Model: Trends Over TimeThe simplest and most popular way to set standards is to set them according to pastperformance. The program’s performance over the last several years is reviewed, and a standard isset above the previous year’s level or above its average. The level increase is determined by policyand by what is realistic and desirable from the program. With this approach, every program’sstandards must be set individually, and all programs usually have different standards. Each programmust improve continually, but each program’s improvement efforts are judged only against its ownpast performance.One reason for the popularity of this approach is that most program managers consider it afair way to evaluate their improvement efforts. Comparing the program against its own pastperformance controls for factors such as student characteristics, local conditions, and factorsunrelated to program quality that might affect performance, assuming that the program remainsstable in these areas. Consequently, it is easy to evaluate whether increased performance on thestandards is related to program improvements.The major disadvantage of this model is that eventually, programs reach a ceiling at whichcontinued improvement is very difficult or no longer possible. There is ultimately an upper limit forperformance (at most, 100 percent, although usually much lower), and over time this strategy is nolonger effective or possible. However, it can be an effective model when you can be confident thatthe program is not near its peak performance—in other words, when you know there is room toimprove.Relative Ranking Model: Comparisons With Mean PerformanceIn this model, the standard is the median or mean on the performance measure. This averagecan be for the state overall or can be set for types of programs. All programs have the same standardfor the measure, and about half the programs will fall below the standard and half will be above.This model is effective when the goal is to maintain a stable, uniform, or similar level ofperformance among all programs. Because performance is focused on the average, variation amongprograms on the measure lessens over time as program performance becomes increasingly similar.The disadvantage, however, for the higher performing programs—those already above the average—is that they have little incentive to improve performance. Because performance has already exceededthe standard, the staff may perceive that there is little advantage to further program improvementefforts. Unlike the continuous improvement model, in which all programs are always under pressureto improve, the relative ranking model challenges only half of the programs to improve.Given the characteristics of the relative ranking model, it is most appropriate when you wantto direct program improvement efforts more toward the half of the programs that are below thestandard. This approach may be desirable when you want to create a more homogenous system orwhen resources for program improvement are limited and thus are directed only to programs most inneed. The model also may work when you believe that the higher performing programs are already ator near their peak or do not need further improvement.External Criteria Model: Uniform StandardsPast performance is the basis for performance standard setting under the two models justdiscussed. You use the external criteria model when the basis for the standard is not performance but20 <strong>Desk</strong> <strong>Monitoring</strong>: Improving Program Performance
a policy or other mandated requirement imposed on the program. Policymakers use this approach toset a strategic goal for mobilizing programs to adopt a policy goal and achieve a uniform higherstandard of performance. Sometimes the goal is set in response to a perceived crisis or politicalobjective. For example, states may adopt a policy to improve pass rates on the GED tests or improveemployment placements and require programs to achieve these rates, regardless of past performance.Using the external criteria model may be a good approach for bringing attention to asystemic, underlying problem and mobilizing efforts to make changes to achieve a uniform higherstandard for performance. Two common uses of this type of standard in adult education are surveyresponse rates and contact hours. For programs that use the survey method for collecting follow-upmeasures, the NRS requires at least a 50 percent response rate. States often require this standard fromlocal programs regardless of their prior record. Likewise, grant requirements usually requireprograms to provide a minimum number of instructional hours that may not be determined by theprograms’ past performance. However, when using this standard-setting approach, it is important toconsider what is reasonable and achievable. If standards are set at an unrealistic level, program staffmay not take them seriously or may resort to counterproductive or dishonest methods to achieve theperformance standard.Whatever model you adopt, it is essential to keep in mind that a performance standard-settingmodel represents a policy statement on the relationship between performance and quality that youwant to instill in programs. Using a continuous improvement model, for example, means that youwant the program quality to improve for every program, whereas the relative ranking model implies apolicy of a more uniform level of quality across programs. External criteria can motivate programstaff toward a broad overarching goal, such as meeting higher state performance standards or policyinitiatives.Putting It All Together: Summative RubricA desk monitoring tool will provide you with performance measures and information on theprogram’s relative standing on each measure according to the evaluative criteria or standards youuse. Although this information is invaluable for understanding program processes and outcomes, it ishard to get an overall sense of a program’s performance with so many diverse measures and ratings.To do this, you need a summative rubric that allows you to make an overall rating of programperformance. This summative rating permits easy recognition of strong performance andidentification of programs that need to improve.Unlike those for selecting measures and choosing evaluative criteria, procedures fordeveloping a summative rubric are more ambiguous. The right approach for your state depends onthe state’s needs, policy, and goals. How you put together the pieces of desk monitoring into acoherent whole says much about what your state values and the direction you want programs to take.Developing a summative rubric requires reflection and decisions about these critical issues. Weprovide a general approach for developing a summative rubric in Exhibit 2-6 and illustrate belowdifferent scoring schemes with examples from states.<strong>Desk</strong> <strong>Monitoring</strong>: Improving Program Performance 21
Develop a Scoring SchemeDepending on what monitoring tool you choose, you might have a dozen or more measuresof program performance and procedures. To develop a scoring scheme, you might begin by reducingthe number of measures and organizing them into categories that match your state interests andpriorities. In our discussion of measures in this chapter we used three categories: outcome, dataprocess, and program process. Each of these categories can be subdivided further. For example, youcan group outcome measures by educational functioning level measures and follow-up measures tocreate two measures. If you want more fine-grained measures, you can focus on specific levels oroutcomes or examine each educational functioning level and follow-up measure separately. You maynot even want to include all the measures on your monitoring tool in the overall scoring. By reducingand combining measures, you will end up with a limited set of measures for the monitoring tool thatyou can combine for a total score or a set of subscores for each category of measure.To create a total score, you need to first develop a scoring scale. Begin by deciding on arange of possible scores with a lower and an upper end to define the minimum and maximumpossible total score. For example, you might create a 100-point scale because it promotes the use ofpercentages and has an intuitive appeal. Within the scale, define levels of performance:• Define an unacceptable level. Set a number that you would find unacceptable forperformance on the measure, for example, less than 25 on a scale of 100.• Define the lowest level of acceptable performance. Set a score or range of scores todefine an absolute minimum performance. For example, you could set the minimum as25 to 50 points on a scale of 0–100.• Define an intermediate level between the highest and lowest scores. An intermediatelevel on a 100-point scale can be 50–75, for example.You can continue with this process for as many categories as you need, setting the highestnumbers on the scale as the exemplary or top level of performance.22 <strong>Desk</strong> <strong>Monitoring</strong>: Improving Program Performance
When you assign a score, it is also important to consider the number of students orindividuals counted in the calculation of the measure. When few people are reflected in a measure,the resulting scores are not likely to be valid and will fluctuate highly from year to year. Forexample, if there are too few students in an educational functioning level, it is probably best toexclude that level from the score.Assign Scores and Test RubricThe final step in the process is to assign values to each measure or set of measures to fit intothe scale you developed. For each measure, assign points by whether the program performance hasmet or exceeded its standard for the measure. You can also create a ranked distribution and scoreprograms according to where they fall on the ranking (e.g., at the state average, top quartile). It ishere that state policy and priorities again play a critical role because measures with more points willhave greater importance and effect on program performance related to that measure. For example,assigning 4 points to programs that exceed performance on educational gains measures and 1 point toother measures signals to local programs the relative importance of level completions. Weightingscores on measures is therefore a way to enforce policy. Summing the scores across all measures willgive you the total performance measure for the program.The complexity of your scale is also a key consideration. Usually more complex scales allowa more fine-grained comparisons of programs. For example, New York divides programs intoquartiles and then calculates a score that includes an indication of where the program falls within thequartile. Colorado also has a complex scoring system that adjusts its comparisons according toprogram size. The drawback to complex scoring approaches is that the scores may not be intuitiveand are difficult to explain to program staff or outsiders. Simple scoring methods, such as those usedby Massachusetts, are more easily understandable. The approach you adopt will depend on thedegree of discrimination among programs that you want.After you have created the scale, apply the categories and scoring rubric to the data fromyour monitoring tool and note the distribution of your programs. Closely examine performance to seewhether it matches your scoring scheme. Programs with the better outcomes and overall performanceshould be your highest categories, for example. Likewise, if a large majority of programs score onthe high end of your scale and none or few are in the lowest, you probably need to make adjustments.An effective scoring rubric defines performance along a continuum of quality.Look at the distribution of programs along your scoring rubric in light of the weighting andpoint assignments you made to ensure that it corresponds to state policies and the direction you wantprograms to take. The outcome measures with the highest point assignments or weightings will havegreater impact on the program’s score. Before you finalize the scoring rubric, you might want to trydifferent weightings and point assignments. For example, you could weight educational gain highlyor follow-up measures, such as GED passage rates. Programs rankings will change depending on theweighting and different programs may come out on top. Closely examine these rankings and considerthe implications on performance and whether your state goals and priorities are well served by theapproach chosen.Examples From the StatesTo help prepare this guide, we consulted with several states that use desk monitoring. InExhibit 2-7 we present the summative scoring rubrics of three of these states—Colorado, Ohio, andMassachusetts—to illustrate ways of putting together the measures and to highlight the policy<strong>Desk</strong> <strong>Monitoring</strong>: Improving Program Performance 23
statement implications reflected in the rubrics. The appendix explains the use of the measures andcomputation of the scores in more detail.Colorado’s rubric has a total possible score of 100, with 45 percent weight given to theeducational level completion. Enrollment and expenditure per learner instruction make up anadditional 45 percent. This scoring approach emphasizes the importance of increasing studentlearning gains and maintaining enrollment to local programs. With the expenditure measure,programs must either retain students longer or keep costs down, so retention is also a state priority.GED completions give programs only 5 percent of the score, and the other NRS outcomes are notincluded in the scoring.Ohio includes all the NRS measures in its scoring rubric. These outcomes, averaged withother measures, account for two-thirds of a program’s score on a 100-point scale. The other measuresinclude family literacy outcomes, enrollment, and percentage of students who are pre-and posttested.Ohio includes program measures related to meeting administrative requirements to fill out the rubric,and these include completing reports on time data and fulfilling data matching requirements.Massachusetts differs by using an 18-point scale but, like Colorado, puts an emphasis onNRS educational functioning level completions. Programs receive half the points if they meet thestate target of 57 percent completions overall and must obtain at least 36 percent to get 3 points.Unlike the other two states, Massachusetts does not include meeting enrollment targets in the overallscore but counts attendance to promote effective outreach, screening, and placement. To promotestudent persistence and measure intensity of instruction, the state includes average attendance hours.Although these states have several similarities in their approaches, the scoring rubrics,computation, and weighting reflect unique programmatic and policy concerns within each state. Inthe next chapter, we draw further on state expertise and approaches as we turn toward issues relatedto implementing desk monitoring.24 <strong>Desk</strong> <strong>Monitoring</strong>: Improving Program Performance
Exhibit 2-7Summative Rubrics: Examples From Three StatesColoradoEnrollmentUp to 10 points for meeting enrollment projects and up to 10 points forenrollment most in needExpenditure per learner instructional hourUp to 25 points for expenditure of federal funds relative to other programsLevel completionPoints awarded according to program’s overall level of completion performancecompared with state average and according to program’s meeting of itsindividual targets, adjusted for enrollment in levelsGED completionUp to 5 points for meeting targets for students obtaining adult secondarydiploma or passing GED testsPre- and posttestingUp to 5 points for meeting targets for percentage of students pre- andposttestedOhioStudent achievementPoints awarded according to program’s meeting targets for• level completion (each NRS level taught)• GED, postsecondary transition, entered and retained employment• family literacy measures• enrollment• students pre- and posttested• pre-test dataBonus points for exceeding state overall completion average and exceedingpre- and posttesting targetAdministrative requirementsPoints awarded according to program’s timely completion of state administrativerequirementsMassachusettsAttendancePoints awarded according to actual and plannedattendance hoursAverage hours attendedPoints awarded for meeting or exceeding state standardsPre- and posttesting percentagePoints awarded for meeting or exceeding state standardsLearner gainsTotal percentage of students who show learner gains that meet or exceed statestandards.20 percent25 percent45 percent5 percent5 percent67 percent33 percent3 points3 points3 points9 points<strong>Desk</strong> <strong>Monitoring</strong>: Improving Program Performance 25
CHAPTER 3PLANNING, IMPLEMENTING, ANDUSING DESK MONITORINGA desk monitoring tool defines the outcomes, measures, and standards your state will use toguide program evaluation and improvement efforts. As you develop the tool, you must consider NRSand state accountability requirements, state policy goals, program priorities, and the capabilities ofyour local providers and delivery system. The successful planning and development of deskmonitoring, however, also require thought into how to integrate the process into your state’s overallapproach to monitoring and technical assistance to local programs. Before procedures are in place,you also need a plan for implementing the procedures and for using desk monitoring data. Onceprocedures are working, you will want to evaluate whether your approach is working as planned orneeds some tweaking. Exhibit 3-1 summarizes these steps.In this chapter we offer guidance on planning, implementing, using, and evaluating deskmonitoring. After a brief discussion of the key issues to consider in each of these areas, we illustratedifferent approaches by using examples from eight states that use desk monitoring that we consultedin writing this chapter. The appendix provides detailed summaries of the desk monitoring approachesof the states we consulted.Planning and DevelopmentLike any significant activity, good planning will go a long way toward ensuring the successof your efforts. Deciding on what you want desk monitoring to accomplish and how it fits into yourbroader state system for monitoring and program improvement will facilitate the development andimplementation of the desk monitoring tool and help ensure that it is used effectively. Planning anddeveloping desk monitoring also include collaborating with those who will be responsible for its use<strong>Desk</strong> <strong>Monitoring</strong>: Improving Program Performance 27
and implementation, including local staff. Field testing of the monitoring tool and a plan for trainingstate and local staff on the purpose and use of desk monitoring will ease implementation.Review and Refine Your <strong>Monitoring</strong> <strong>System</strong>A good place to begin developing desk monitoring is to reexamine thoroughly your state’srequirements and expectations about what local programs must do and report. For example, programsusually have requirements to serve certain numbers and types of students, provide a set number ofinstructional hours, offer specific instructional and support services, demonstrate outcomes, andreport on these activities in different ways. Mapping out these requirements and how you currentlycollect them—through on-site monitoring, monthly grant reports, or data submission—will help youplan how to fit desk monitoring into your overall system.Your review may uncover ways to build components of a desk review into other aspects ofyour overall state administrative systems. For example, Ohio changed its local grant applicationprocess to match its desk reviews. In this way, states set expectations for accountability requirementsand prepare programs to address all the components. The desk monitoring requirements then come asno surprise to local programs, and they know how their state will evaluate their performance from thevery start.As discussed in the previous chapter, desk monitoring uses quantitative measures, many ofwhich can come from your state data system. However, good planning of desk monitoring includes acareful consideration of the policy goals when deciding which measures to use. First take stock ofhow you want to use desk monitoring data and what policy message you want to convey to andenforce among local programs. In the states we consulted, desk monitoring was a means to focusprograms on specific outcomes. Massachusetts, for example, established continuous programimprovement as its guiding principle. It used desk monitoring to “turn the ship” toward an emphasison educational gain and retention, and measures reflecting these outcomes are dominant in thatstate’s approach. Colorado also emphasizes education level completions and includes a measure ofexpenditure per learner instructional hour. Ohio includes a broader set of NRS outcome and otherperformance measures that reflect its policy goals.All states we consulted mentioned the time- and resource-saving benefits of desk monitoring,which allows programs to convey a great deal of information to the state office at little cost. Butalthough desk monitoring can make the overall performance monitoring system more efficient, it cando so only through the judicious use of a set of measures that match state priorities. Have a reason forusing all measures that you include in desk monitoring. Texas learned, for example, that requiringtoo much information in quarterly reports was too burdensome and counter-productive. Programsresisted because they saw it as overly burdensome, and the state found the frequency of receiving theinformation not helpful. When the state eased reporting requirements, the process worked much moresmoothly.Collaborate During DevelopmentAn inclusive planning process that involves others with a stake in the desk monitoringprocess will help acceptance, implementation, and use of desk monitoring and will help identify andavoid potential problems. Although the state office led the development of desk monitoring in all thestates we consulted, several states also have planning and review committees. Massachusetts set up atask force that helped decide on measures, performance standards, and principles that would guide itsdesk monitoring. A key principle decided by the task force was that the desk monitoring system28 <strong>Desk</strong> <strong>Monitoring</strong>: Improving Program Performance
should be as simple as possible so that local programs could easily understand and use it. Acommittee that included three local practitioners (a teacher and two directors) then worked out thedetails of designing the system and then presented it to the field for input.Kansas uses an advisory committee to help guide its monitoring approach. Each year, thecommittee reviews the measures, including the indicators of program quality, in the desk monitoringand suggests revised measures that are based on past experience and new policy priorities. The statenotifies programs of changes a year in advance to give them a chance to adjust their goals andprocedures.After a few years of working on its desk monitoring approach, Ohio formed an accountabilitytask force to guide the approach. This group, which meets quarterly, includes state and fieldrepresentatives who provide input on key issues related to the NRS and state accountability issues.Over the last year, the task force had to approve all revisions to the desk monitoring process. Thetask force advised the state of the need to inform the field about changes prior to the beginning of theyear of implementation of the new requirements. It also advised the state to roll out new measuresfirst as bonus points and then in the following year to integrate changes into the scoring system.Texas spent several months with different activities to build in support and understanding ofits monitoring tools, including local program report cards, which the state includes in its deskmonitoring. For example, the state held a three-day retreat with local program directors, who had toenter their own data and interpret and explain their program outcomes to their peers, using themonitoring tools. The directors then had to train their local staff on using and interpreting the data.This experience helped them understand and support the process and the state approach towardprogram improvement.New York’s experience implementing its local program report cards (which also serves as adesk monitoring tool) highlights the importance of collaborating with local programs. In the haste toget the report cards implemented, the state initially had little collaboration with the field.Consequently there was some resistance, with many programs feeling blindsided by the process. Insubsequent changes and enhancements to the report cards, New York has had greater collaborationwith better results and more acceptance.Field Test and Train StaffAlthough input from the field and other stakeholders is important to good planning, pilottesting of the system is essential to ensure that your state’s approach will work. The desk monitoringapproach of using data may be new to your local programs. Several states emphasize the need to testdifferent versions of the monitoring tool with different measures and formats to get local programsused to the process. Pilot testing gives local programs the opportunity to gauge the impact on theirprocedures, allows the programs to see how the state will evaluate them, and gives them theopportunity to make changes to implement the new reporting requirements that desk monitoringbrings. Pilot testing is also another opportunity for getting local buy-in to the process. New York, forexample, had local programs try procedures for the first year with a limited set of measures and withno consequences before the state fully implemented its approach.Distributing to local programs draft versions of your desk monitoring tool, procedures, andreports is another way to evaluate your approach before full implementation. Draft report templatesthat include blank data tables or simulated data will allow local staff to see the measures planned fordesk monitoring. Including sample reports with graphs and charts to illustrate the way the state will<strong>Desk</strong> <strong>Monitoring</strong>: Improving Program Performance 29
display and interpret the data will also help local staff understand how the state plans to use the dataand evaluate performance. Ohio, for example, found local feedback on its templates to be mosthelpful in developing its desk monitoring and building understanding of the approach.The importance of sound training and professional development is essential forunderstanding and using desk monitoring, as it is for all state initiatives. A common error is to have a“build it and they will come” mentality—that creating reports and providing access to data mean thatprograms will understand and use them. With the competing demands and limited resources of mostadult education programs, staff will often lack the time needed to understand data and will havelimited understanding of its purpose. The calculation of the summative rubric and how your state willuse the rubric is sometimes misunderstood by local staff, and misunderstanding rises in proportion tothe complexity of the rubric. Colorado, for example, has a complex rubric and used multiplestrategies to explain the basics of its rubric calculations and the underlying reasons. State staffprovided training at directors’ meetings and followed up with individual explanations to local staffduring site visits. Other states provided reports with graphs and highlighted points to local staff andwalked through these reports in person and in conference calls to explain the approach and the use ofthe data.All states we contacted stressed that training should not be a one-time event but a continuous,ongoing process. Ongoing training has the added benefit of allowing local staff a means forproviding additional input into the desk monitoring approach that you can use to improve the systemfurther. After the first year of implementation, states have found that additional explanation andfollow-up are required. For example, Ohio held regional training on Understanding Your <strong>Desk</strong>Review and walked programs through the system. This training was so successful that the statecontinued it the next year, focusing on new local staff. By the third year, programs had improved somuch that the state was able to focus training on using data to improve instruction and to presentinformation on instructional strategies.In Texas, training is continued by encouraging local staff that receives training to trainsomeone else in their program. In addition, the state directs its training efforts to staff who actuallydeal with data—and those staff members are not allowed to delegate their responsibility. The statealso relies on frequent training and provides online resources to local staff that they can consult asneeded.ImplementationWith good planning that includes field testing and training, you will be well prepared tobegin implementing your desk monitoring system. Complete implementation takes time—most statesreport that integrating desk monitoring takes a minimum of two years—with revision and fine tuningcontinuing for several more years. Implementation brings its own set of challenges, but through ourdiscussions with state staff who have implemented desk monitoring, we have identified four areas toaddress that will help smooth the path toward successful implementation: providing sufficientresources, having a supportive data system, building acceptance and buy-in of local staff, andevaluating and modifying after implementation.Provide Sufficient ResourcesIt takes time and resources, especially staff, to implement a desk monitoring systemsuccessfully. Often it takes several years to generate the high-quality data necessary for effective30 <strong>Desk</strong> <strong>Monitoring</strong>: Improving Program Performance
decision making. The states we interviewed reported that after providing local programs with twoyears of detailed feedback and training, programs generally reported reliable data by the third year.It is also essential to have staff dedicated to your desk monitoring system. Without dedicatedstaff, you may be unable to keep up with reviewing the continuous flow of data that desk monitoringproduces, and you will be unable to respond to local programs in a timely way. Without thisfeedback, local programs may think that the state does not examine or value the data, which will havea detrimental effect on your whole system of desk monitoring.You may want to create a state staff position to focus solely on monitoring programs, if youare a large state or can afford it. For example, New York has a state liaison who is responsible forprogram monitoring and technical assistance, including desk monitoring. Although most statescannot afford a full-time position of this type, it is essential to have dedicated staff that is responsiblefor reviewing desk monitoring reports, identifying high- and low-performing programs, andcoordinating technical assistance.Support With Data <strong>System</strong>One of the goals of desk monitoring is to motivate local programs to use their data forongoing program improvement. To do this, they must have timely access to data, allowing them tomake midcourse corrections on the basis of current data instead of making changes on the basis ofout-of-date-data. A real-time web-based system is the best way to accomplish this goal. It provides away to regularly and quickly collect data, keep track of local programs’ timeliness in entering data,and report the results in a timely manner. For example, one state was able to identify which localprograms held off entering data on students until the students showed actual gain.Within a web-based system, local program directors should have the ability to run their ownreports and to generate those reports that will be useful to them. Massachusetts’s data system, forexample, allows local staff to select from preprogrammed reports or to generate their own reportsusing real-time data. Below are some examples of features used by states we consulted that local staffhave found useful.• Provide options for comparing data. Build in data from other programs or by class, orprior data that allow programs to compare themselves. For example, Colorado is lookingto build into its system ways for programs to compare performance in one EFL level withthat in another within the program.• Automate comparisons to the evaluative standards (state averages or targets). Buildinto your system ways that system users at all levels can compare their data withbenchmarks, such as the state averages or targets, to allow programs to monitor their ownperformance toward goals.• Provide the ability to export into a variety of formats. This feature makes it easier forlocal programs to use the data for their own program improvement needs. For example,Massachusetts’s data system allows users to export into Excel as well as other databaseformats.Because of the central importance to desk monitoring of having quality data, it is alsoessential to build data checks into your state system. Checks built into data collection, such aslimiting the allowable test score values that can be entered into the system to only those that are valid<strong>Desk</strong> <strong>Monitoring</strong>: Improving Program Performance 31
scores for a particular test, will help increase the quality of the data collected. A web-based system,by allowing those at the local level to enter and check data immediately, makes timely identificationand correction of errors possible.Build Acceptance and Buy-in of Local StaffGetting local buy-in to support desk monitoring is as important during implementation as it isfor getting collaboration during the planning and development phase. Increasing local buy-in will payoff in many ways because local program staff that has had some say in implementation is more likelyto accept the final results. Even if they do not agree with every aspect of implementation, they willbetter understand the reasons behind it. Also, local programs’ perspectives allow the programs toanticipate problems and potential solutions that may elude staff at the state level. For example, Ohiogot input from locals on drafts of desk monitoring reports with the result that they addressed issuesprior to the official release of the reports.The more transparent the system, the more local programs are likely to trust the results. Forexample, Colorado put considerable time and effort into explaining to local program staff theformulas it uses to generate the points for its summative rubric and how to interpret the reports mean.In walking programs through the process, Colorado increased local understanding and acceptance ofthe results. Giving program directors control over the kinds of data and reports they can generate isalso likely to increase their investment in the system and to increase the quality of the data becauseprogram directors and their staff become more familiar with the data and thus more likely to catcherrors.Evaluate and ModifyRegardless of how carefully you have planned and implemented the desk monitoring system,there will be a continuing need to refine and improve your desk monitoring approach after you andyour programs have experience using it. State policies may change, measures that were onceimportant may be replaced with ones of greater importance, and you may have to change your rubricto account for program realities or new policies. Such changes are to be expected, and if wellmanaged, with input from the field, will improve make your overall monitoring and technicalassistance approach.You will need to reevaluate the impact of your desk monitoring system and modify it,especially during the first two years after implementation. You should provide ongoing opportunitiesfor local feedback because locals are likely to have a valuable perspective on implementation issues.While remaining flexible in responding to local feedback, you should not make unnecessary orarbitrary changes. Too many changes also risk your having locals tune out the whole system, figuringthat they just need to wait out the current changes and make it more difficult for local programs to dolong-term planning.With careful attention and appropriate modification, you are likely to see improvement in theuse of desk monitoring and program improvement over time. Ohio presents an excellent example ofcontinuous improvement. Program ratings on the desk monitoring rubric have improved dramaticallyover the past four years. Although in the first year there were many programs with “Not Acceptable”ratings, after more intensive training and fine tuning the program ratings fell into a bell curve. By thethird year, ratings were so high that the state was able to focus training on improving instructionalstrategies. At the state level, state staff was freed to begin research into links between data andperformance and are now looking further into the quality of instruction and program improvement.32 <strong>Desk</strong> <strong>Monitoring</strong>: Improving Program Performance
Although the states we consulted report good results with desk monitoring over time, therecan be unintended negative consequences. For example, programs may cut back on serving thestudents most in need because those students may be less likely to show the same gains for the sameinvestment of resources than students in less need. Although these types of effects are not unusualwith accountability systems, you can avoid them by following the steps we have recommended inthis guide, including collaboration with local programs, pilot testing, training, and ongoingevaluation during implementation.More-direct tactics to avoid unintended effects also help, including providing incentives forserving more difficult students or achieving specific outcomes or through using different comparisonbases for programs (see chapter 2). Colorado, for example, has addressed unintended effects byawarding points to programs that serve a greater percentage of students defined as most in need.Most states have also compared program performance with similar programs that serve similarpopulations to increase fairness and decrease the likelihood of skimming.States we interviewed also made changes to their desk monitoring system afterimplementation to move programs in a new direction or to reflect changes in state policy. Ohio andColorado have incrementally changed the weighting of points assigned to different measures so thatprogram performance better reflects state policy. Kansas continuously reallocates the number ofpoints needed for specific measures to move programs toward continuous program improvement andannounces these changes in advance to give local programs adequate time to plan. Texas is planningto revise its desk monitoring tool to incorporate fiscal data so that cost effectiveness can beevaluated.Use and ResultsThrough the implementation of desk monitoring approach, you will have regular and timelyaccess to data and information that is critical to helping you manage and improve your programs. Byapplying the summative rubric you developed with the desk monitoring tool, you can readily identifyhigh- and low-performing programs. Once you are confident in your program rankings, your statemay choose to reward programs that reach their goals, sanction programs that fail to meet their goals,and provide technical assistance and professional development to some or all of your programs. Inaddition, desk monitoring can have other impacts on state policies, such as to indicate the need to setnew standards and policies or shift the focus of state efforts for program improvement.Identify High- and Low-Performing Programs<strong>Desk</strong> monitoring data will enable state staff to rank programs according to the summativerubric or other means, using the measures and criteria from the desk monitoring tool. One of yourfirst, most crucial, steps in examining these data, especially in the first months or years ofimplementing desk monitoring, is to assess the validity of these rankings, using your knowledge ofthe programs. Identify the programs at the extremes—the highest and lowest performing programs—and consider the validity of this ranking. If the programs that rank highest and lowest are not the onesyou expect, it is worth exploring the reasons. Incongruities may arise because you never beforeexamined these data and applied the desk monitoring evaluation criteria on them—or they could bedue to data quality issues. Examine each program’s data in comparison with the data of otherprograms to help you assess validity. It will also be helpful to examine data trends over the pastseveral years to see whether there have been sudden changes.<strong>Desk</strong> <strong>Monitoring</strong>: Improving Program Performance 33
Several states report finding data quality issues during the first year of using desk monitoringin this way. One state found that these problems were due to noncompliance with NRS requirements,poor training of local staff, and data entry problems. Because good data quality is essential tosuccessful desk monitoring approach, you must resolve these issues first, before the approach willwork in your state.Reward and SanctionWhen local programs have resolved data quality issues and your state has confidence in thedata, you can use desk monitoring results to reward and recognize good performance in a number ofways. Often when we think about rewarding high-functioning programs we think of usingperformance-based funding. However, of the states we consulted, only Kansas usedperformance-based funding of local programs. Although all the other states are consideringimplementing this approach in the near future, staff expressed concerns about the impact on thedelivery system. For example, states like New York find that some programs that perform poorlymay be the only programs available to adult education students. There is also a concern among manystates that a shift to performance-based funding may shift the population served away fromlow-literacy students to students at higher functioning levels.The states were creative, however, in implementing multiple ways to reward high-performingprograms. In Ohio, for example, programs that achieve successes receive bonus points to reflect theirperformance. The state also uses “incentive funds,” whereby programs that earn higher pointsreceived additional funding, and only the highest performing programs can apply for this additionalfunding. In several states, programs that show high performance avoid the need for an on-sitemonitoring visit. Providing positive feedback to local programs and recognizing their successesindividually and statewide are other ways to reward high performance.Several states have found that public acknowledgment and recognition of good performanceis a powerful reward. Kansas and New York have created report cards that correspond to the resultsof their monitoring reviews that outline the program’s progress. These report cards can be sharedwith the community and other stakeholders involved with the program. Programs tend to respondwell to the positive recognition that they receive.Many states warned that it is better to wait until the system is stable (e.g., three years) beforelinking rewards and recognition to performance. States that rewarded programs too early in theprocess often reported that either the wrong programs were rewarded (due to poor data quality thatmade them appear better than they were) or there were perceptions of bias (other programs did notbelieve the data).How a state responds to poor performance depends on its long-term goals, the resourcesavailable, and the needs of adult education students. Sanctions used by states are often related tofunding. For example, in the states we consulted, programs that fail to meet performance standardsmay be de-funded. In Ohio, programs that perform poorly do not have the opportunity to apply foradditional “incentive” funds that high-performing programs may obtain. Kansas de-funded sixprograms in the most recent fiscal year; however, these decisions were preceded by placing theprogram on provisional funding and intensive technical assistance provided by the state. Only afterthese programs showed no improvement did the state remove funding.34 <strong>Desk</strong> <strong>Monitoring</strong>: Improving Program Performance
Provide Technical AssistanceAs discussed earlier, desk monitoring is part of your state’s overall approach to programmonitoring and improvement and is an efficient way to identify programs that need technicalassistance. Although desk monitoring does not replace the need for on-site monitoring andassistance—all programs require periodic on-site visits to verify data quality and examine otheraspects of program performance—it will help you prioritize which programs and issues to address.States we consulted select local programs with poor performance for on-site reviews andprovide additional technical assistance. To identify programs in need of assistance, many states, suchas Massachusetts, rely on programs’ overall score of the desk monitoring rubric. Programs that scorebelow 12 points (out of a total of 18) must write a continuous improvement plan, and the stateprovides technical assistance in areas that are below standards. Other states use a more targetedapproach. Kansas, for example, provides intensive technical assistance in particular areas that are ofmost importance to the state. The state office offers professional development, combined withquarterly desk reviews and site visits, to help program performance rise to the state average.A third way to identify areas in need of technical assistance is to focus on areas that will mostaffect overall state performance. For example, if the state is performing poorly on completion ofsome of the educational functioning levels, you could identify the programs with poor performanceon these measures that appear to have the greatest impact on state performance and provideassistance to improve performance on these measures. New York sometimes follows this assistancestrategy.With limited staff and funding available for technical assistance, an approach that has localstaff from higher performing programs help their lower performing peer can be effective in terms ofboth cost and impact. Local staff may often be more receptive to their peers than to state staff. Someexamples of this peer approach follow:• Organize regional professional development training based on the most commonproblems in low-performing programs, using program staff that has resolved theseproblems.• Tap high-performing programs to provide individual technical assistance tolow-performing programs with additional support from the state.• Ask local programs to share their stories about how they have shown either continuous ormarked improvement, challenges they faced and overcame, and tips for other programs ata statewide conference. New York state staff has found this strategy works well becauseprograms are interested in and open to ideas from their colleagues at the local level.Using the desk monitoring report as a starting place, peers groups can help a programdevelop an appropriate improvement plan. For example, Colorado uses the second day of site visitsfor peer discussions. State staff finds out in advance which topics the program wants to target andbring in peers doing well in those areas. Peer approaches have the added benefit of rewardinghigh-performing programs with recognition and elevation to state “expert,” while also providingdirect assistance to low-performing programs.<strong>Desk</strong> <strong>Monitoring</strong>: Improving Program Performance 35
Improve Local Data Use and State PlanningIn addition to helping promote improved program performance and to providing technicalassistance more effectively, states that are currently using desk monitoring report several otherpositive impacts. The most important is the enhanced focus by local programs on their data. Allstates we consulted reported that local program staff is much more focused on data, resulting inimprovements in data quality and increased attention to performance.In Kansas, for example, state staff report that local programs enjoy the quarterly checks andmore-frequent calls from the state because staff members interpret this attention as evidence that thestate cares about what is going on in their program. State staff can drill down to the classroom leveland know the names of students and teachers. The result has been an improvement in the state-localprogram relationship and a better understanding about activities in each program. Programs havelearned to value their data.In Ohio, the largest impact of desk monitoring has been to focus programs on the importanceof proper goal setting, pre- and posttesting, and improved student engagement in the teaching andlearning process. The goal is to help students achieve their goals and to document these achievementsfully. Overall, there has been a systematic improvement in program performance, with programsshowing increases in ratings every year.Over time, desk monitoring has helped enhance the entire process for monitoring, technicalassistance, and program improvement in the states we consulted. Data from desk monitoring can helpstates plan the future focus of state efforts to improve quality by identifying areas where programsfall short. With the enhanced information they have available, New York and Texas are better able toestimate the number of state monitoring visits and types of technical assistance needed over the year.Kansas’s advisory committee has identified new priorities for adult education and mandatedadjustments in its state indicators of program quality based on its annual review of desk monitoringdata.Summary: Tips for Developing, Implementing and Using <strong>Desk</strong><strong>Monitoring</strong>In Exhibit 3-2, we provide a summary of the guidance presented in this chapter aroundplanning, developing, implementing, and using desk monitoring. We derived these tips from theadvice of the states we consulted that have several years of experience with desk monitoringapproaches. In considering this advice, please note the several themes that emerge as crucial to thesuccess of a desk monitoring system.Careful planning stands out as essential to development and implementation. Good planningbegins with reviewing the overall state administrative system for management, monitoring programperformance and technical assistance, and fitting desk monitoring within this system. Ensuring thatdesk monitoring supports state policy and goals is also essential. Planning also requires collaborationwith local staff to give them a role in developing and improving the system and to help themunderstand it purpose. Local staff may have initial resistance to the ongoing oversight that deskmonitoring brings, but states can overcome this by involving local staff as full partners in programimprovement. Ongoing training about desk monitoring is central to helping build this collaborationand understanding.36 <strong>Desk</strong> <strong>Monitoring</strong>: Improving Program Performance
The importance of time and resources in developing and implementing desk monitoring alsostands out. Every state we consulted emphasized the need for several years of staged implementationfor the system to work. Also crucial to the process are dedicated state staff members who can spendthe time to review data; work with programs in planning, implementing, and using desk monitoring;and provide technical assistance.Data quality and a strong data system are the basis for the success of desk monitoring. In theearly stages of development and implementation, it is not uncommon for data quality issues to arise.This time serves as an opportunity to weed out and correct these problems. A web-based data systemthat gives locals real-time access to data and reports also is a central element to making deskmonitoring work. Without easy data access, local program staff may become disengaged or evenhostile to the process.Using desk monitoring data for program improvement is the ultimate goal of all of the hardwork that goes into desk monitoring. The data give states an efficient way to identify areas of lowperformance on which to focus improvement efforts, while allowing a basis for rewarding programsthat do well as an incentive to excellence. States can also tap into the knowledge and experience ofstaff from high-performing programs to help their peers resolve problems and develop well-runprograms.Planning and DevelopmentExhibit 3-2Tips for Planning, Developing, Implementing, and Usinga <strong>Desk</strong> <strong>Monitoring</strong> <strong>System</strong>• Build components of desk review into your overall administrative system. Fit the elements ofdesk monitoring into on-site reviews, grant applications, and monitoring. When requirements are partof an overall system, it sets expectations appropriately and prepares programs to address all thecomponents.• Start an accountability task force. This group will help plan your measures and approach andshould include state and field representatives who provide input on key issues related to the NRSand state accountability issues. The group also can continue through implementation.• Have a plan for using every piece of information requested. Programs will become frustrated ifno one uses the data they collect, undermining confidence in the value of desk monitoring.• Produce templates and draft reports. Produce blank drafts of the graphs and reports you wouldlike to get before finalizing your system. If you link to your grant system, for example, you may wantto be able to run statewide reports, which may not be possible if linked to program-level datasystems.• Pilot test. Try out the desk monitoring approach for a year or so without tying it to rewards orsanctions. The pilot can use a limited set of measure or apply only to some programs. Give and getfeedback to programs and refine based on this experience.• Have ongoing training for local staff. Do not assume that simple access to data and reportsmeans that programs will use the information. Providing reports with graphs and highlighted pointsand walking through the reports with staff make a big difference in whether they will use the data.<strong>Desk</strong> <strong>Monitoring</strong>: Improving Program Performance 37
ImplementationExhibit 3-2Tips for Planning, Developing, Implementing, and Usinga <strong>Desk</strong> <strong>Monitoring</strong> <strong>System</strong> (continued)• Know that implementation takes three years or more. It will take time to get quality data and towork out the kinks. The states we interviewed reported that if they gave detailed feedback andprovided training across the first two years, programs generally reported reliable data by the thirdyear.• Assign state staff to focus on monitoring programs. Assign at least one staff person the job ofdesk monitoring. The staff person can focus on reviewing data and working with programs.• Use a real-time data system. Those states that have real-time systems report increased uses at theprogram and state levels. For example, programs can use it to look at weekly progress, and statesmay use it to assess progress.• Use a web-based system or at least one that can be accessed across the state. If programs usethe system for day-to-day data entry, the state learns a great deal about timeliness of data entry andmay be alerted to questionable practices. For example, one state was able to identify which localprograms held off entering data on students until the students showed actual gain.• Ensure that program directors have the ability to run their own reports. Ask them what theywould like to be able to generate. Programs should be able to access their data/performance on aregular basis for the information to be of use for program improvement.• Provide comparisons or the ability to choose comparisons. Build into your system ways thatsystem users at all levels can compare their data against benchmarks, such as the state averages orstandards.• Provide options for comparisons to other programs, classes, etc. Build into the system ways forprograms to compare performance with the performance of other programs or within a local program.• Transparency in how the system works is important to local buy-in. It allows program staff tounderstand and trust what you are doing. The more complex your system, the greater challenge itwill have to get local buy-in. If the system is not intuitive and takes much description, it can be donebut is simply a harder sell.• Watch out for unintended effects. Programs may try to improve performance in ways thatundermine program improvement. For example, local programs can improve performance by servingfewer harder-to-serve-students or changing goal setting to have fewer students in goal categories—approaches that do not promote program improvement.
Use and ResultsExhibit 3-2Tips for Planning, Developing, Implementing, and Usinga <strong>Desk</strong> <strong>Monitoring</strong> <strong>System</strong> (continued)• Identify highest and lowest performing programs, based on the rubric. Assess the validity ofthese rankings by using other knowledge of the program to identify possible data quality issues andassess how well the rubric works.• Resolve data quality issues. <strong>Desk</strong> monitoring may reveal data quality issues arising from a lack ofcompliance with state or NRS policy, data entry problems, or inadequate training.• Provide rewards for good performance. States we consulted provided extra funding forhigh-performing programs or used performance-based funding.• Sanction low-performing programs. States we consulted required low-performing programs todevelop a program improvement plan, and they defund programs that do not improve after a set timeperiod.• Recognition may be just as motivating as money. Several states reported that simple recognition(e.g., labeling programs as “exemplary”) and certificates were enough to motivate programs to dowell.• Have a strategy to determine which programs get technical assistance. Strategies includesetting a minimum score on the rubric, focusing on areas important to state policy concern(e.g., educational gain, postsecondary transition), or using measures that most affect overall stateperformance.• Use the system to determine technical assistance needs. Use the data from desk monitoring tosee what issues come up year after year or affect most programs.• Consider using a program’s peers to provide technical assistance. Ask staff fromhigh-performing programs to help lower-performing programs or use staff members who haveresolved performance problems to help other program staff with the same problems.<strong>Desk</strong> <strong>Monitoring</strong>: Improving Program Performance 39
Appendix AState Summaries
Colorado’s Annual Performance FactorBackgroundFollowing concerns voiced by state staff and local program leaders on the lack ofcoordination between Colorado’s monitoring and accountability processes, the Office of AdultEducation and Family Literacy reviewed its approach to program evaluation and accountability andidentified two areas for improvement: the local program monitoring process (then known as ProgramEvaluation and Educational Review, or PEER) and local funding criteria. The monitoring processwas updated, revised, renamed (Program Accountability and Improvement Review, or PAIR) andtied to technical assistance and program improvement requirements.Concurrently, state staff began discussing the adoption of performance-based funding. Aninitial step in that direction is the Annual Performance Factor (APF), which provides an annualsnapshot of individual local program performance as well as a comparative view of all programs. Thefactors that comprise APF are gathered from multiple sources: the data collection system, the stateGED database, and programs’ annual performance financial reports. The state conducts PAIR sitevisits with each local program on a 3-year rotation. Through directly observed evidence and in-depthquestioning, the state is able to further illuminate APF offsite monitoring results.DesignBelow is a description of each of the five areas covered by APF and the number of pointsassigned to each. Following the descriptions is a table showing examples of how APF is applied to asample program.Enrollment—20 pointsPrograms make annual enrollment projections. Ten of the 20 points assigned to enrollmentare awarded according to the ratio of the program’s actual enrollment to its projected enrollment. Theremaining 10 points are awarded based on the percentage of students a program serves that aredesignated as “most in need,” defined as those students in the following levels: ESL 0–1, 2, 3, 4, andABE 0–1.9, 2-3.9, and 4–5.9.Expenditure per learner hour of instruction—25 pointsTwenty-five points are awarded to a program for its average expenditure per learner hour ofinstruction compared to that of other programs. Expenditures are based on the total Adult EducationFamily and Literacy Act (AEFLA) and EL Civics grants amounts and do not take into considerationadditional revenues. A program will earn proportionately more or fewer points depending on itsexpenditure per learner hour of instruction compared to that of all other programs. In cases where aprogram has an expenditure per learner hour of instruction double that of similar sized programs,negative points are assigned.By awarding points based on spending per learner hour of instruction rather than on thenumber of learners, APF encourages programs to focus on learner retention rather than just servingthe greatest number of students. Limiting the cost calculation to AEFLA and EL/Civics fundingrewards programs that have obtained additional funding—and encourages programs to diversify theirfunding resources.<strong>Desk</strong> <strong>Monitoring</strong>: Improving Program Performance A-1
To compensate for the considerable variations in program size, APF compares programs ofsimilar size when calculating expenditure per learner hour of instruction: small programs arecompared to small programs and large programs are compared to large programs.Level completion—45 pointsLocal programs are responsible for local implementation of the state’s negotiatedperformance targets. This measure is assigned the highest weight of the five areas, with a total of45 points. The points are divided into three parts that are then summed for the total score:• Twenty-two and a half points are rewarded according to the number of levels at whichthe program meets or exceeds the level completion targets compared to the total numberof levels served. For example, if a program served students at 12 educational functioninglevels (EFLs), and they met or exceeded the level completion targets for 6 of those levels,than the program would receive 11.25 points (22.5 * 6/12).• Twenty points are assigned according to the ratio of a program’s overall level completionperformance to the state target. For example, in (PY06), the overall target was 49.4%. Soa program that has an average completion rate of 55% across all EFLs would receive21 points (20 * (.55 + 1 - .494)). It is possible to get more than 20 points for this measure.• The final 2½ points are awarded based on the number of adult learners who completedtwo or more levels during the year out of the total number who completed a level.A program in which 100 students completed two or more levels out of 337 completed alevel would receive 0.74 point (100/337 * 2.5)GED completion—5 pointsFive points are assigned according to the number of adult learners who earned a GED (andhad it as a goal) out of the total who cited it as a goal. The target in PY06 was 47%.Pre- and post-testing: 5 pointsThe final five points are awarded based on the program’s pre-/post-test rate relative to thestate target. For PY06 the target was 65%.The table that follows shows an example of applying APF to a hypothetical program. It liststhe variables, the means of computation, and the values for each variable. Points are summed andthen converted into a percentage. The total in this example is 85 points, or 85%.A-2 <strong>Desk</strong> <strong>Monitoring</strong>: Improving Program Performance
LabelVariableSample APF CalculationComputation(The general formula is followedby the actual calculation) Value NotesA Program name Program XB Projected enrollment 625C Total enrollment (actual) 627DMost in need (MIN)enrollmentE Learners completing a level 337FLearners completing2+ levelsG Total AEFLA grant amount $189,138H Student levels served 12IJKTotal levels made byprogramRatio of levels made tolevels servedOverall level completionpercentage425100I/H; 6/12 0.5L GED ratio Percentage of studentscompleting GEDMTotal learner attendance(hours)60.54 This is compared to thestate target of 49.6% byadding it to (1 - 496)0.533,063N Pre-/post-test percentage 0.65OPQRRatio of actual enrollmentto projectedRatio of MIN enrollment tototalExpenditure per learnerhourRatio of programexpenditures to stateC/B; (627/625) 1D/C; 425/627 0.68G/M; 189,138/33,0363) $5.72R/average similar sizedprogramsS Enrollment (20%) (O * 10) + (P * 10); 10 + 6.8 16.8TUExpenditure per learnerhour (25%)Level completion factor(45%)25 * R; 25 * 1 25(J * 22.5) +( (K+(1 - .496) * 20)+ ((F/E) * 2.5); (.5 * 22.5) +(.54 + .504) * 20) + (.297 * 2.5)132.87 State target is 49.6%(1 - .496 = .504)V GED (5%) (L /0.47) * 5; (.5/.47) * 5 5.32 State target is 47%W Pre-/post-test factor (5%) (N/.65) * 5; (.65/.65) * 5 5 State target is 65%XTotal annual performance(100%)S + T + U + V + W;16.8+25+ 32.87 + 5.32 + 585 points,or 85%Sum all factors<strong>Desk</strong> <strong>Monitoring</strong>: Improving Program Performance A-3
Implementation and Buy-InIn introducing APF 4 years ago, the state encountered several challenges. Foremost amongthese was local understanding and acceptance of the concept. Initially the APF formula was a “hardsell” in part because of its complexity. The means of calculating many of the APF factors are notimmediately intuitive and require some explanation. For example, local programs had particularconcerns with the factor expenditure per learner hour. Most programs were not accustomed toconsidering cost-effectiveness in running a program.Transparency in how the system works was an invaluable aid to achieving local buy-in. Tohelp locals better understand the APF formula, the state used several different approaches. Forexample, state staff explained the APF calculations using the particular program’s data and explainedthe reasoning behind each factor at state directors’ meetings. State staff also approached individualprogram directors for their input. Finally, during onsite visits state staff walked local program staffthrough the APF calculations as applied to their program.The state incorporated input from local program staff when revising the system. For example,in response to locals programs’ frustration at getting the results of the APF calculations just once atthe end of the fiscal year, the state decided to develop a new data collection and reporting system.Locals indicated that getting this information on a more frequent and regular basis would help themuse the results to guide improvement efforts.Usage and ImpactAs expected, instituting APF got local programs’ attention. It sharpened programs’ focus onoutcomes, particularly level completion, and brought cost-effectiveness to the fore. By incrementallychanging the weighting of the different factors, the state has been able to move programs’ prioritiesin a desired direction. Performance on the cost-effectiveness factor has been the chief indicator ofultimate score on APF results. This is true despite the fact that it is not weighted the most.APF scoring has become high stakes to local programs even without financialrewards/sanctions tied to it. The ranking and comparison between programs provided by APF hasbeen very motivating. At the end of the 1st year of implementation, four programs of six that hadscored below 70% on APF now scored above 70% and were removed from program improvement.Even programs not at immediate risk of falling below the 70% threshold started to use APF towardprogram improvement. In the past, local program grant applications have included a rather weak andnonquantifiable past performance component. In the next round of competition for AEFLA funding,APF performance will be a factor in evaluating applications.Future DirectionsBecause Colorado’s data collection system has been fraught with problems, it has not beenpossible to integrate all the state’s accountability processes into one “desk monitoring” tool.However, one of the goals of the current redesign of the data system is to “automate” the state’sability to monitor program performance and to allow local programs to monitor themselves on anongoing basis.A-4 <strong>Desk</strong> <strong>Monitoring</strong>: Improving Program Performance
Under consideration/discussion:• Not calculating APF for individual levels that have very few students in them. Currently,small programs can have very few students at a particular level. Calculations based onsuch a small number are not very reliable and are likely to fluctuate highly from year toyear.• Comparing performance within a local program of one EFL level with other levels. Thiswould provide information on how programs are doing at specific levels. This is notpossible in the current APF system.• Refining the definition of most in need.• Developing a policy and process that ties APF results directly to funding.• Adding policy compliance factors to the formula.• Considering the “flex” or “X” factor: adding a short-term factor that changes dependingon state focus/priorities.• Considering additional factors based on survey data collected for Federal <strong>Reporting</strong>Table 5 and goal-setting for specific outcomes.For More Information• Colorado Adult Education and Family Literacy Web site:http://www.cde.state.co.us/index_adult.htm• APF Calculations for PY06 (http://www.cde.state.co.us/cdeadult/APF.htm)• Level Completion Targets (http://www.cde.state.co.us/cdeadult/assessment.htm#Targets)<strong>Desk</strong> <strong>Monitoring</strong>: Improving Program Performance A-5
Kansas <strong>Desk</strong> <strong>Monitoring</strong> <strong>System</strong>BackgroundPrior to 2000, Kansas adult education programs did not collect or submit data to the state.Instead, the state conducted full 1-day onsite monitoring visits for 20% of all programs each year.Onsite visits included interviews and a review of the physical structure of the program. The state,however, did not collect in-depth knowledge of what the programs were doing, how well they wereadministered, how well the students were doing, or what programs needed. Seven years ago, the statealso developed a new set of quality indicators and tied these indicators to the monitoring system.Indicators were developed in collaboration with the state and local program staff.The desk monitoring process was developed as part of the overall monitoring system thatusually includes annual site visits to all local programs. Originally, the state intention was to conducta data-driven monitoring process that was completely quantitative; however, the state felt it wasimportant to include many qualitative programmatic measures to get a more complete sense ofprogram quality. As a result, although the majority of the measures can be checked through the deskmonitoring system, the remaining measures require an onsite review.The process for determining what makes a program high quality and then ascribing points toeach indicator was long and arduous. Although local programs were able to define a high-qualityprogram, they had more difficulty agreeing on how best to measure quality. The benefit of engaginglocal programs in the process has been local program buy-in for the monitoring system. The resulthas been that local program staff believes that the system is fair and that desk monitoring ensures thatthe state views all programs through the same lens. Local programs also brought insight to thedevelopment of the monitoring process. Local programs are proud of the system because they wereinvolved in its creation. When adult education staff compares themselves to staff in the K–12 system,they see that they are ahead of their colleagues in understanding the value of data and using data forprogram improvement.DesignThe desk monitoring system uses a Web-based management information system (MIS)through which the state and local programs see the same real-time data entered by local programs.<strong>Desk</strong> monitoring is closely tied to the <strong>National</strong> <strong>Reporting</strong> <strong>System</strong> (NRS) and federal regulations andis integrated with onsite monitoring. It focuses on quantifiable outcome measures, while onsitemonitoring focuses on qualitative process and programmatic measures.Kansas Indicators of a Quality Adult Education Program describes the measures that Kansascollects though desk monitoring and onsite monitoring. Kansas developed the measures 7 years agowhen the current monitoring system was created. The measures fall into 10 main categories andreflect the core NRS outcome measures, process measures, and programmatic measures. Thecategories are (a) population served, (b) educational gain, (c) goal setting and goal attainment,(d) program design and implementation, (e) technology use and technology instruction, (f) localfinancial support, (g) teacher quality, (h) collaboration with partners, (i) data collection system use,and (j) cost-effectiveness.Each measure is assigned some number of points based on how well the local program meetsthe measure. Points for each measure are assigned according to three categories: high, medium, andlow, with the exception of cost-effectiveness, which has a broader scoring range. Several of the<strong>Desk</strong> <strong>Monitoring</strong>: Improving Program Performance A-7
categories—program design, teacher quality, and collaboration with partners—include onlyqualitative indicators that are collected through onsite monitoring. The remaining categories includemeasures collected through both desk monitoring and onsite monitoring. The system requiresquarterly state reviews, but points and funding are awarded annually.Below is a list of the quantifiable measures collected through desk monitoring, followed bythe total number of points possible for each:• The program serves participants representative of the ethnic diversity of theundereducated population in the program’s service area, including limited Englishproficient adults. (2 points)• The program serves participants at the lowest levels of educational attainment. (8 points)• The program demonstrates a commitment to serve a larger percentage of undereducatedadults in the community over previous years. (10 points)• Participants make significant educational gains. (10 points)• The program provides workplace readiness instruction, confirmed through standardizedassessments, to participants. (6 points)• Participants spend a significant amount of time in instructional activities. (4 points)• The number of participants with up to four program goals is directly proportionate to thenumber of participant outcomes (i.e., achieved program goals). (8 points)• The program meets or exceeds its goal for the number of participants it will serve and thenumbers and percentages of core outcomes that participants will achieve. (8 points)• The program provides quality adult education services at a cost per outcome that isaligned with the state average (mean) cost per outcome. (10 points)The following is an example of the specific standards used to assign points as applied to thesecond measure.Measure 1.2The program serves participants at the lowest levels of educational attainment. (8 points)High(8 points)Medium(4 points)35% or more of participants enter at one of the six “Beginning Levels” (Levels 1,2, 7, 8, 9 or 10 in Outcomes Measures Definitions).25% to 34% of participants enter at one of the six “Beginning Levels” (Levels 1,2, 7, 8, 9 or 10 in Outcomes Measures Definitions).LowLess than 25% of participants enter at one of the six “Beginning Levels” (Levels(0 points) 1, 2, 7, 8, 9 or 10 in Outcomes Measures Definitions).Note. Retrieved from Kansas Indicators of a Quality Adult Education Program, Effective July 1, 2006.Funding is based on the total number of quality points assigned to each program. The totalamount of funding available is divided by the total number of points that all programs receive afterthe programs have been reviewed. This results in a dollar value assigned to each quality point. Theindividual program’s total of quality points is multiplied by the dollar value to determine how muchfunding it receives. This formula is presented below:A-8 <strong>Desk</strong> <strong>Monitoring</strong>: Improving Program Performance
Step 1Step 2FormulaTotal funding ($) ÷ Total points = Pointvalue ($)Point value ($) x Program points = Programfunding ($)Example$500,000 ÷ 2,500 points = $200 per point$200 x 96 points (for Program X) = $19,200funding for Program XIn addition, the percentage required to achieve a “high” (the maximum number of points)assigned to a measure is raised as programs’ performances improve over time. If the majority ofprograms are reaching “high” or “medium” levels of quality on a particular measure, then thepercentages that are required to achieve a “high” or a “medium” are increased (For example, inMeasure 1.2 above, the percentage required for a “high” rating has increased from 25% in programyear 2000 (PY2000) to 35% in PY07). Similarly, the point value assigned to a measure may increaseor even decrease from one year to the next year. The intention behind changing the point value fromyear to year is to push programs to continuously improve by ensuring that they focus on areas thatneed improvement. Also, the state may revise the indicators to refocus programs in areas that arebecoming important in the state. For example, Kansas is looking more closely at math instructionstatewide, so the indicators may change based on revised legislation, which will lead to a revisedstate adult education plan.Kansas Indicators of a Quality Adult Education Program is a “living document” that isrevised annually by an advisory committee. Programs receive the revised indicators 1 year inadvance of implementation, so that they have the chance to adjust their goals to achieve the newpoint values for each indicator. Kansas continues to try and make the indicators as objective aspossible by including indicators that can be quantitatively measured.Implementation and Buy-InLocal participation in the implementation of the desk monitoring process began with thedevelopment of quality indicators. The quarterly review provided by the state gives local programs achance to address issues early on in the program year. This early intervention helps local programsidentify problem areas, update their plans, improve the quality of their data, and ultimately improvethe quality of their services. Most importantly, programs view the desk monitoring process asproviding a level playing field—“it keeps everyone honest.”Local program staff members like the desk monitoring system, which allows them to tracktheir data at any time to see how well they are doing. They can use the data to improve the quality oftheir programs and ultimately increase their funding. <strong>Desk</strong> monitoring has reduced the preparationtime required for the onsite review process, which in turn has created a less burdensome process forlocal programs.Additionally, both the state and local programs find that with the desk monitoring systemthere are no surprises. All staff can view the most recent and accurate data. With a strong MISsystem that has built-in checks and balances and with the indicators clearly defined, the state andlocal staff trust and understand the data in the system.Usage and Impact<strong>Desk</strong> monitoring results play a significant role in determining the amount of federal and statefunding awarded to each adult education program in Kansas. All programs in the state compete forthe same funds. The entire amount of federal flow-through funding is awarded based on<strong>Desk</strong> <strong>Monitoring</strong>: Improving Program Performance A-9
performance, with half based on programs’ performances on the core outcomes and the other halfawarded based on programs’ performances on the quality indicators. In Kansas, half of the statefunding is awarded equally to all programs, so that all programs receive the same base fundingamount. The remaining half of the state funds is awarded based on performance using the formuladescribed above. Essentially, 40% of Kansas’ federal funding allocation is awarded to local programsaccording to quantitative results that are obtained through the desk monitoring process. Ten percentof the state’s federal funding requires an onsite monitoring visit to assess the qualitativeachievements of each program. The remaining 50% of federal funds is allocated to local programsbased on the number of core outcomes achieved by program participants.In addition to funding, each local program receives a report card that outlines its progress.The report card is sent to local program, community, and state stakeholders, as well as all otherprograms. All of the local programs know their status in comparison to other programs—not only interms of funding received but also in terms of the quality of their programs. This recognition servesas an additional reward. Programs enjoy receiving recognition for their efforts, although the highestachieving/scoring program for the past several years has been inundated with requests for visits andconsultation from other programs that want to learn how to improve their results.On the other hand, underperforming programs receive reduced funding and have the potentialof being defunded. Prior to the desk monitoring process, local programs were rarely if ever defunded;however, the state determined that it was not a good use of limited federal and state resources tocontinue to fund programs that were not performing well. These programs are first put on provisionalfunding and receive intensive technical assistance. If they do not improve, then they are defunded.Six out of 37 programs have been defunded in the past 7 years.Each local program is required to set program improvement objectives each year. Thoseobjectives must be measurable and based on data collected in the desk monitoring system. In PY05,only 7 of 31 programs achieved their objectives, and a few more made some incremental progress.This led the state to conduct intensive professional development and training and influenced the stateto raise the point value of performance indicators that matched program objectives. In PY06,24 programs met their objectives.In addition, the state uses the desk monitoring process to determine specific areas ofweakness in local programs. The state provides intensive technical assistance and creates initiativesin those areas identified as needing improvement to bring underperforming local programs up to thestate average.With real-time access, state and local program staff reviews data frequently. As a result, localprograms have learned to value and use their data. They review their data to analyze their programsand look for ways to improve, they use the report cards and fact sheets generated by the state to showstakeholders and community members what they are achieving and accomplishing, and programs usetheir results to request more funding.In PY 2005–2006, 13 of 37 programs required an onsite review; 3 of these were programs onprovisional funding and 10 others had scored low on a specific indicator related to standardizedassessment protocol and procedures. In 2007, all programs will receive full onsite monitoring visits.<strong>Desk</strong> monitoring has generated a huge amount of data for the state and locals to digest.Although the desk monitoring system saves time and reduces the number and burden of onsitemonitoring visits, it also can take up more staff time in reviewing and analyzing the data. State stafflearned, though, that local programs really appreciate and enjoy the quarterly checks and moreA-10 <strong>Desk</strong> <strong>Monitoring</strong>: Improving Program Performance
frequent calls from the state office. Local programs realize that the state cares about what is going onin their program, and state staff can drill down to the classroom level and know the names of studentsand teachers. This builds the state–local program relationship while increasing accountability. Andthe state understands much more about what is going on in each program.For More InformationLinks and materials• Kansas Indicators of a Quality Adult Education Program:http://www.kansasregents.org/download/adultEd/indqaaeprgFY07.pdf<strong>Desk</strong> <strong>Monitoring</strong>: Improving Program Performance A-11
Massachusetts <strong>Desk</strong> Review <strong>System</strong>BackgroundMassachusetts instituted a desk review system in 2003, though many of the elements havebeen in place since 1999. The system grew out of a task force charged with determining whatperformance standards in adult education should look like and identifying the principles that shouldguide developing a desk review system. The task force determined that the guiding principle shouldbe continuous program improvement and that, to promote this principle, the system needed to besimple and understandable so that local programs could use it. According to the state director, it wasalso intended to “turn the ship” toward a focus on outcomes and retention rather than capture everydetail of a program’s performance.Massachusetts’ desk review system is designed to encourage continuous programimprovement and better services for students and to track progress of local programs. To achievethese goals, it establishes standards and assigns points to six areas viewed as especially important:attendance, average attended hours, pre-/post-testing percentage, learner gain, student goals andcompletion of <strong>National</strong> <strong>Reporting</strong> <strong>System</strong> (NRS) educational functioning levels. According to statestaff, the “standards have been informed by statistical analysis of multiple years of data, a goals pilot,and input from the field of [adult basic education (ABE)] practitioners in multiple task groups andworkshops at statewide conferences. Each of the standards is set at or near the Massachusetts stateaverage for performance.”DesignThe state has migrated its desk review system to a Web-based reporting system (COGNOS) afew years ago. The web-based system allows programs ongoing access to their data, both to enterdata and to view their progress throughout the year. However, programs can view their scores only atthe end of the fiscal year. The system is relatively easy to navigate and understand, and it has thecapacity to export into Excel as well as other database formats.The six performance standards—attendance, average attended hours, pre-/post-testingpercentage, learner gain, student goals, and completion of NRS educational functioning levels—areone part of a larger system of accountability to encourage continuous improvement, effectiveprogram administration, and positive student outcomes. The standards are set at or near theMassachusetts state average for performance to encourage low-performing programs to improve.The criteria and points applied to each of the six areas covered by the Massachusetts deskreview system are listed on the following pages. (Two of the six described do not have anyassociated points for fiscal year 2006 (PY06). These are student goals and educational functioninglevel completion. The state will assign points to these two measures in PY07.)• Attendance:Definition: Total number of attended student hours divided by the total number of plannedstudent hours.<strong>Desk</strong> <strong>Monitoring</strong>: Improving Program Performance A-13
CriteriaPoints77% and above 366% to 76% 255% to 65% 1Below 55% 0Purpose: Promote effective outreach, screening, orientation, assessment, placement procedures,and instruction that are relevant to students’ needs.• Average Attended Hours:Definition: Total number of actual attended student hours divided by the total number ofstudents.CriteriaPoints132 hours and above 3117 to 131 hours 291 to 116 hours 1Fewer than 90 hours 0Purpose: Promote student persistence and learner gain and measure intensity of students’instructional time.• Pre-/Post-Testing Percentage:Definition: Total number of students who are pre- and post-tested divided by the total number ofstudents enrolled in a program for the year.CriteriaPoints77% and above 366% to 76% 255% to 65% 1Less than 55% 0If a program post-tests less than 50% of eligible students,performance points for the learner gains performance standardare reduced by 50%.Purpose: Promote retention of students long enough to achieve learning gains and goals.• Learner Gains:Definition: Total percentage of students who demonstrate learner gain on TABE, MAPT, REEP,or BEST Plus assessments (based on student’s primary assessment).A-14 <strong>Desk</strong> <strong>Monitoring</strong>: Improving Program Performance
CriteriaPoints57% and above 947% to 56.99 636% to 46.99% 3Less than 36% 0Purpose: Promote student learning gains.• Student Goals:Programs receive points for both setting and meeting student goals. Goals are divided into threecategories: A, B, and C. The categories denote a range of goals, with A being those that are mosteasily verified or quantified and C being those that are least easily verified or quantified. Anexample of a goal in Category A is obtaining a GED; an example of a goal in Category C isreading to a child.Definition:Set goals—Total number of goals set divided by the number of students enrolled in the program.Met goals—Total number of goals met divided by the number of students enrolled in theprogram.SetgoalsMetgoals• 2 or more goals per student• Fewer than 2 goals per studentCriteria• Program meets at least one goal per student, and the majority of goals arein Categories A and B• Program meets, on average, half a goal per student, and the majority ofgoals are in Categories A or B• Program meets at least one goal per student in Category CPoints10321Purpose: Encourage students from across the program to set and meet goals and to ensure thatstudent goals drive curricula and instruction.• Educational Functioning Level Completion:Definition: Total number of students completing one or more educational functioning levels(EFLs)—excluding High ASE—divided by the total number of enrolled students.CriteriaPoints33% and above 1Less than 33% 0Purpose: Meet U.S. Department of Education reporting requirements that measure programeffectiveness as the state level.A program can earn up to 25 points for the six measures starting in PY07. At the end of thefiscal year programs can view their score son the six measures and compare them to the state averageas well as to other programs.<strong>Desk</strong> <strong>Monitoring</strong>: Improving Program Performance A-15
Programs must meet the following minimum standards for each area, for a minimum of15 points (as of PY 2006):• Attendance 66%–76% (2 points)• Average attended tours 117–131 (2 points)• Pre-/post-testing percentage 66%–76% (2 points)• Learner gains 47%–56% (6 points)• Student goals Set at least one goal per student per year.Meet at least 1 goal per student per year.Majority of students meet goals inCategories A or B (3 points)*• EFL completion at least 33% (1 point)**Points will be applied in PY07.Below are two data tables from Massachusetts’ Web-based system. The first shows a sampleof the performance standard on learner gain for multiple programs. It shows gains for each programin the state along with the points earned for that measure. Cut points for each of the measures appearabove the table. The second example shows a summary of one program’s performance. It includes allfour performance standards, the points earned for each, plus the two measures that do not receivepoints. The total number of points out of a possible 18 for PY06 is shown at the bottom.Adult and Community Learning ServicesPerformance Standards Report—PY06 Learning Gains: By Project57% AND ABOVE 9 47% TO 56.99 6 36% TO 46.99% 3 LESS THAN 36% 0Note: If the percentage in the pre/post report is less than 50%, then the points will be cut in half.ProjectSignificant GainStudentsTotalStudentsGainPercentagePointsABCD Adult Education <strong>System</strong> 94 150 63% 9ABCD/Mattapan 21 69 30% 0ACCCESS–Cape Cod Comm.College189 339 56% 6Asian American Civic Association 32 65 49% 6Attleboro Adult Basic Ed 28 65 43% 3A-16 <strong>Desk</strong> <strong>Monitoring</strong>: Improving Program Performance
Adult and Community Learning ServicesPerformance Standards Report—PY06 Summary ReportPROJECT: XXXXXXXXXXXXXXXXXXXXXXXXXPerformanceMeasure Percentage/Average Performance PointsAttendance 68.55% 2Averageattended hoursPre-/post-testingpercentage114 hours 176% 2Learner gains 62% 9Student goalsSet goals: 1 per studentMet goals: 1 per studentin Category C*Table 4 EFLcompletion35% *Total Points 14*Points will be applied in PY07.Note: This report gives the summary of all the other performance standards reports.Those programs that fail to meet the standards in any of the four areas must write acontinuous program improvement plan, and the state will provide them with technical assistance.Technical assistance includes dissemination of promising practices, work with the program specialist,assistance developing an action plan for improvement where needed, and professionaldevelopment/support. During an open and competitive RFP process, the state considers the numberof points a program earns under desk review.Implementation and Buy-InThe state’s intention was to create a simple and understandable system that local programswould buy into and use. The state also wanted the system to be seen as helping with programimprovement, not as punitive. Some local programs have exhibited nervousness that it would bepunitive, despite the state’s reassurances. State staff indicated that only after programs went througha funding cycle and realized they would not be defunded would their fears be allayed. According tostate staff, the state assigns points to a relatively small number of measures because those are themeasures it wants to emphasize and because of the difficulty of quantifying some of the othermeasures.That local programs have regular access to the COGNOS system has helped with buy-in.This access allows local programs to see the same data the state sees, increasing transparency andallowing programs to follow their progress throughout the year. This has helped local programs seethe benefits of the system.<strong>Desk</strong> <strong>Monitoring</strong>: Improving Program Performance A-17
The state spent considerable time on planning and testing how to report out the results. Muchof that feedback was incorporated into how points are assigned. State staff indicated that in the nearfuture the state will be making fewer changes in how points are assigned to increase measurementconsistency from year to year.Usage and ImpactAccording to state staff, people are “so much more aware of data now” than before institutingthe current desk review system. Even programs that are not in danger of falling below the statestandards look closely at their data to improve their performance. Local programs are taking moreownership of the monitoring process. The transparency of the system has helped local programs seeand understand how the state calculates their performance and increases their confidence in thatprocess. Most programs are filled to capacity and have waiting lists of students and have attributedthis, at least in part, to improvements due to program monitoring.Anecdotal evidence indicates that teachers are participating in greater numbers inprofessional development workshops to improve learner gains as a result of the greater focus onoutcomes.For More InformationMassachusetts Department of Education Adult and Community Learning Services Web site:http://www.doe.mass.edu/acls/default.htmThe following documents are located on the state’s Web site.• Performance Standards (http://www.doe.mass.edu/acls/pawg/)• 2006–2010 Performance Standards for Community Adult Learning Centers(http://www.doe.mass.edu/acls/pawg/fc340_345_359.html)A-18 <strong>Desk</strong> <strong>Monitoring</strong>: Improving Program Performance
BackgroundOhio <strong>Desk</strong> Review <strong>System</strong>The Ohio Department of Education’s (ODE’s) desk review system has been in place for4 years. Using ABLELink, Ohio’s adult education data management system, the state program officegenerates all the information needed to assess each program. The Ohio desk review was developed tostructure the review process and to focus programs on areas of importance to the state office. Inaddition, the state provides some award funds to exemplary programs (see discussion of incentivefunding in “Usage and Impact” section). Although still tweaking the system, ODE has not wanted tomake too many changes; rather, it has “tried to maintain the baseline [integrity] but tightened upaccountability and made the process fairer.”DesignThe state office has developed an extensive indicator and scoring system and attachedweights according to its priorities. The Ohio desk review system covers two main areas:a) Student achievement (67% of points)b) Administrative Requirements (33% of points)The details of the scoring system are described below.Student AchievementThe student achievement score is based on four components: educational functioning level(EFL) completion; overall level completion; core indicators of performance completion; and otherperformance measures, such as retention, enrollment, and pre-/post-testing rates. Each of these andhow it is calculated are described below.Educational Functioning Level Completion: Programs earn one point for each EFL forwhich students’ performance meets or exceeds the state’s minimum performance level (MPL)targets. Points are totaled and divided by the total number of EFLs in which students were enrolled.The percentage is recorded.must:Overall Level Completion: To receive a maximum of an additional five points, a program• Administer the number of post-tests equal to or exceeding the number of studentscompleting an EFL and• Meet or exceed the state overall completion averageThe number who completed any EFL (number of post-tests must equal or exceed numbercompleted) is divided by the total number enrolled. Because there are bonus points, a negativepercentage of the overall level completion compared to the state overall completion average will notinfluence the overall desk review rating.Core Indicators of Performance Completion: Credit is given for each indicator(postsecondary education or training, employment, employment retention, GED, and family literacy)for which the program meets or exceeds the state’s MPL. These indicators are only measured for<strong>Desk</strong> <strong>Monitoring</strong>: Improving Program Performance A-19
students who had the indicator as a goal. In addition, a program will only receive credit forachievement of indicators for which it was approved during the grant process (with the exception ofGED completion). For example, if a program reports achievement in the family literacy indicators,but is not approved in family literacy, the program will not receive credit for achievement of thoseindicators. However, if students receive their GEDs, a program will receive credit regardless ofwhether this measure is approved.The number of students who achieved the goal is divided by the number who had the goal.The percentage is recorded.Other Performance Measures: Programs are rated (given a percentage) based on scores onfive other measures related to student performance. Achievement of a measure is worthone to two points. After scoring each of the measures, the state determines an overall percentage bydividing the score by the number of measures (five). Because some of the measures are worth morethan one point, a program could score more than 100%.• Enrollment—If enrollment meets 100% of the projected enrollment or exceeds theprevious year’s actual enrollment, the program receives one point. If the program exceedsthe projected enrollment by more than 10%, then the program receives one and one-halfpoints.• Retention—If a retention rate of 75% or above is achieved, the program receivesone point.• Pre-test information—If the complete pre-test data entered in ABLELink meet or exceed98% of the number of students enrolled, the program receives one point.• Post-test versus completers—If the number of post-tests meets or exceeds the number ofstudents completing an EFL, the program receives two points.• Pre- and post-tests—If the number of students post-tested equals or exceeds 50% of thestudents pre-tested using a standardized assessment, the program receives one point. Ifthe percentage is greater than 75%, the program receives one and one-half points.Calculation: The total number of points earned for the five measures divided by the numberof elements (five).MeasureExample of Calculating Other Performance MeasuresAchievement LevelPoint(s)EarnedPossiblePointsEnrollment Met 100% of FY06 projected enrollment 1 1 or 1.5Retention Rate was 95.8% 1 1Pre-test informationPost-test versuscompletersPre-test and posttestNumber tested matches 98.8% of the numberenrolledNumber of students post-tested equals 96.9% ofstudents completing a level1 10 2Program post-tested 79.5% of the number pre-tested 1.5 1 or 1.5Total points received 4.5 7Percentage score* 90%* Total points received in this example is 4.5. Because some elements are worth more than 1 point, the total possibleis 7; however, the total points received is divided by the number of elements, which is 5. In this case, 4.5 points ÷5elements = 90%.A-20 <strong>Desk</strong> <strong>Monitoring</strong>: Improving Program Performance
Administrative RequirementsThis second area of the Ohio desk review includes the percentage of administrativerequirements met by local programs. There are 13 administrative items evaluated for all programsand one additional item, attendance at the New ABLE Directors’ Orientation, which only applies tosome programs. The table below lists the administrative items that are tracked by the state fortimeliness and completeness.Administrative ItemsData Certification ChecklistFirst Data MatchFirst Interim ReportAnnual Performance Report (APR)Fall Directors’ MeetingFinal Expenditure Report (FER)FY06 Schedule A (Report of Local Funds)New ABLE Directors’ Orientation, if applicable** This item does not apply to all programs.Program Professional Development Plan(PPDP)Second Data MatchSecond Interim ReportFinal Data MatchSpring Directors’ MeetingLD Policy and Planning <strong>Guide</strong>Combined Scores and Overall RatingsTo compute a final desk review score and obtain an overall rating for the program, the stateenters the student achievement and administrative item scores into a format similar to that shown inthe example below. Student achievement is weighted twice as much as administrative requirements.Example of Combined Score and Overall Rating1. Student Achievement (67% of overall score) 84.4 * 2 = 168.8EFL Completion 10 EFLs achieved ÷ 12 attempted 83.3%Overall LevelCompletionCore IndicatorsOther PerformanceMeasuresExtra points earned 5%3 areas exceeded minimum performance levels ÷ 4 areasattempted75%4.5 points out of 5 (+2 bonus) on other measures 90%Average (83.3 + 75 + 90 + 5) ÷ 3 84.42. Administrative Requirements (33% of overall score) 92.913 or 14 elements 13 ÷ 14 = 92.9% of requirements were met 92.9%TOTAL PointsPercentageOverall Rating261.7÷ 3 = 87.2%Superior<strong>Desk</strong> <strong>Monitoring</strong>: Improving Program Performance A-21
Below is the rubric used to assign the program a superior rating based on the overallpercentage of indicators met:DesignationExemplary 95–100%Superior 85–94%Acceptable 70–84%State Indicators MetNot acceptable Below 70%Implementation and Buy-InIn the past 2 years of the desk review process, ODE utilized the assistance of anAccountability Task Force (ATF), comprising local program personnel, to revise this tool. The stateoffice gave programs an early draft of the annual monitoring report to allow program directors toprovide comment and correct any errors. This was a critical step that allowed ODE to address all themajor issues while still in the draft stage of the report. The feedback provided during that initialfeedback stage resulted in a number of changes to the report. ODE continues to collect feedback fromlocal programs through the ATF (discussed below).After the 1st year of implementation, ODE conducted regional training on “UnderstandingYour <strong>Desk</strong> Review” and walked programs through the new system. Trainings continued into the3rd and 4th years of implementation that focused on administrative, data entry, and instructionalstrategies.Other changes made over the 4 years include:• Increased weights on post-test data. Early in the desk review process, many programshad high completion rates but were not showing those numbers in their assessment data.So, the state increased the point values for completers with post-tests.• Added “Program Service” section to report. Last year, the state added a section to thereport that summarizes the contributions the program and its staff have made at the statelevel (e.g., director and staff participating on task forces). It was a recommendation fromthe field to acknowledge state-level contributions and apparently went over very well,because the reports are sent back to agency superintendents and CEOs.• Increased focus through greater weighting on learner gain. The state noticed that itneeded to change its emphasis to “make sure that there was clear evidence of learnergain.” As a result, greater weight was given to student outcomes.• Changed grant application process to match desk review. As the state made changesto the desk review, it made sure to align those changes with the grant application process.This helped programs become prepared for the data collection and monitoringrequirements.• Created an Accountability Task Force. The ATF is composed of state and fieldrepresentatives who provide input on key issues related to the <strong>National</strong> <strong>Reporting</strong> <strong>System</strong>(NRS) and state accountability. The revisions to the desk review process described abovewere presented to the ATF for review. The ATF advised ODE to implement severalideas, including:o Inform the field about changes prior to the beginning of the year, so that programscan anticipate how to implement new requirements.A-22 <strong>Desk</strong> <strong>Monitoring</strong>: Improving Program Performance
o Roll out changes first as bonus points, and then integrate those points within theactual scoring system the following year.o Use the bonus points as incentives instead of subtracting points for poor performance,which might serve as a disincentive.The ATF meets quarterly.Usage and ImpactThe Ohio desk review process has encouraged programs to address data quality, teacherquality, and program management. The biggest impact of the desk review system has been toencourage programs to focus on the importance of proper goal setting, pre-/post-testing, datamonitoring, accurate data entry, and full student engagement in the teaching and learning process.Program ratings have improved dramatically over the past 4 years. In the 1st year, there weremany not acceptable overall ratings. In the 2nd year, the state saw more of a bell curve in ratings andcontinued to offer training, particularly to new staff. By the 3rd year, programs continued to improve,and ODE focused its training and technical assistance on instructional strategies. Additionally, thequality of the data improved allowing ODE to research links between data and performance. Thestate is now looking further into improving the quality of instruction and programs.When ODE first rolled out the desk review system 4 years ago, all the calls fromsuperintendents/CEOs of local programs were positive; previously they had not realized the status oftheir program (whether doing well or not), and they learned information about their programsthrough the reports. Program administrators also have greater faith that their data are an accuratereflection of true performance and seem more accepting of performance rewards and technicalassistance. A natural consequence of the process has been that the program administrators and staffare paying more attention to performance data at their levels.Incentive fundsFor the 4 years the review system has operated, programs have received incentive funds ofvarying amounts based on how much the state has been able to pull together from a variety ofsources. The 1st year was an open application process. Any program could apply for funds, and mostdid apply. Because the state only had enough funding to support the top scoring programs this causedsome ill will. In subsequent years, ODE stipulated that only those programs that earned a rating ofsuperior or exemplary were allowed to apply. The proposals were reviewed and fully funded ifselected. (A cap per program was announced in advance.) Also, the state provided suggestedactivities suitable for additional funding and allowed programs to propose other options.ODE continues to make changes to the desk review system to increase accountability. ODE,in conjunction with the ATF, is in the process of developing program profiles. These profiles willpresent outcomes, demographics, and other program information. The state had avoided taking thisstep until now because of concerns about data quality.When programs do report dissatisfaction with the desk review process, they often citeproblems with the data management system—ABLELink. The state has learned that in these cases itis often a result of data entry problems. For example, the data entry person may be new or needadditional training. After providing this support, the programs are likely to make improvements.<strong>Desk</strong> <strong>Monitoring</strong>: Improving Program Performance A-23
Future DirectionsNext, ODE will work with the ATF to develop performance-based funding (PBF). However,the state also is concerned about unintended consequences, such as programs shifting the populationthey serve from low-literate to higher academic functioning adults.For More Information• ODE’s desk and onsite review materials are available online at:http://www.ode.state.oh.us/GD/Templates/Pages/ODE/ODEDetail.aspx?page=3&TopicRelationID=882&ContentID=6828&Content=12998A-24 <strong>Desk</strong> <strong>Monitoring</strong>: Improving Program Performance
Texas <strong>Desk</strong> Review <strong>System</strong>BackgroundThe Texas Education Agency (TEA) found that in serving a large state it required a deskreview system to effectively maintain regular contact between the state office and local programs. Anexisting hard-copy monitoring tool was used as the basis for developing an online desk reviewsystem.The Texas desk review system, which is in its 3rd year of use, represents the interest of TEAto switch from a compliance to a performance focus, while still addressing some core complianceissues. Currently, the desk review system awards points to programs based on four core performanceindicators (retention, demonstrated gain, completion level, and follow-up) and two complianceindicators ( teacher quality and data quality). The system also has space to enter narrative on studentsuccesses and program innovation.DesignTEA uses the online management information system (MIS), AEGIS, to generate a quarterlyreport, or Compliance Review, on each program at the state office. Twenty-four hours after eachreport is generated, absent intervention from the state program manager, the report is sent to thestate’s seven managers (each manager reviews more than 20 programs, including TANF,Corrections, EL Civics and Even Start). The managers are required to look at each of their reportsevery quarter (usually with the exception of the 1st quarter report). The managers also visit 20% ofprograms each year, and they bring the desk review reports with them during these visits.Figure 1 is an example of a quarterly report that is sent to the seven mangers. It includes ascore for the program, whether a program is in compliance, and a list of areas or “issues” for which aprogram is out of compliance.Figure 1. Example Compliance Review<strong>Desk</strong> <strong>Monitoring</strong>: Improving Program Performance A-25
After each quarter, when Compliance Reviews are finalized, AEGIS sends an e-mail alert tolocal program managers telling them how to log in to view the Compliance Review report. Figure 2is an example of an alert.Figure 2. Example Compliance Review AlertTable 1 below provides a list of the performance indicators that TEA uses to generate its deskreview reports. Indicators are generated in four areas: retention, demonstrated gain, completion level,and follow-up. Each of these four areas is further divided into subindicators. A program earns a pointfor meeting or exceeding the target set by the state for each of the subindicators. The target is basedon performance targets negotiated with the U.S. Department of Education. Texas continually updatesthe goals for the indicators. For example, last year 60% of students had to have post-tests; this yearthe goal was raised to 65%. To be in compliance, a program must earn a point for each indicator. Thetotal number of possible points varies by type of program. For example, because EL Civics does notserve adult basic education (ABE) or adult secondary education (ASE), it is not scored for thesemeasures.In addition to the score generated from the core measures above, the quarterly desk reviewreports include:• Teacher quality, for example, teacher training, new staffing, pre-service.• Data quality review (coupled with an AEGIS report): At the end of each quarter, the localprogram director must sign off that the data (by class) are reliable.• Student success and program innovation stories typed in by programs, so this informationis captured for the federal reports. State managers review these summaries each quarterand paste similar issues together.The desk review system is linked to the Texas e-grant system (used for competitive orcontinuation funding). This allows the state to easily monitor quarterly fund draw-down within eachfunding category.Implementation and Buy-InIn the 1st year of the desk review system, much of the attention was on data quality andlooking for unintended consequences. The first implementation year included some bumps. ForA-26 <strong>Desk</strong> <strong>Monitoring</strong>: Improving Program Performance
Indicator IDTable 1. Performance IndicatorsAdult Education Compliance/Performance Indicator1.0 RETENTION—The program has met its goal for:1.1 The number and percentage of adult learners who have participated in baselineassessment and who have attended at least 12 hours of instruction1.2 The number and percentage of adult learners who have participated in baselineassessment and who have participated in progress testing2.0 DEMONSTRATED GAIN—The program has met its goal for:2.1 Percentage of students who demonstrated gain in TABE Reading2.2 Percentage of students who demonstrated gain in TABE Language2.3 Percentage of students who demonstrated gain in TABE Mathematics2.4 Percentage of students who demonstrated gain in BEST Oral Interview2.5 Percentage of students who demonstrated gain in BEST Literacy Skills3.0 COMPLETION LEVEL—The program has met its goal for:3.1 Percentage of students who completed the ABE Beginning Literacy3.2 Percentage of students who completed the Beginning ABE3.3 Percentage of students who completed the ABE Intermediate Low3.4 Percentage of students who completed the ABE Intermediate High3.5 Percentage of students who completed the ESL (English as Secondary Language)Beginning Literacy3.6 Percentage of students who completed the Beginning ESL3.7 Percentage of students who completed the ESL Intermediate Low3.8 Percentage of students who completed the ESL Intermediate High3.9 Percentage of students who completed the ESL Advanced Low3.10 Percentage of students who completed the ESL Advanced High3.11 Percentage of students who completed the ASE Low4.0 FOLLOW-UP—The program has met its goal for:4.1 The percentage of all adult students who have the goal of achieving a GED or highschool diploma and achieved a GED or high school diploma4.2 The percentage of adult learners in ASE who achieved a GED or high schooldiploma4.3 The percentage of adult learners with a goal of entering postsecondary education ortraining who entered postsecondary education or job training4.4 The percentage of adult learners who were unemployed at the time of enrollment andhave a goal of obtaining employment, and entered employment4.5 The percentage of adult learners who were employed at the time of enrollment andretained employmentexample, TEA promoted desk review as a tool for program performance with some monitoringcapacity. During roll-out, however, the results were presented as compliance reports, and allprograms were considered to be either in or out of compliance. In addition, the program reports weredistributed to program directors and a list of additional stakeholders, such as bosses of program<strong>Desk</strong> <strong>Monitoring</strong>: Improving Program Performance A-27
directors, CEOs, college deans, et al. These stakeholders received the quarterly report at the sametime as program directors. This caused an outcry on the part of the local programs in the cases whereprograms were designated “out of compliance.” As a result, the programs requested that the statesend the reports only to the program directors, who would then distribute it to others. In the 3rd yearof the system, the reports only go to directors who use them for program improvement and are notposted publicly.TEA has made some adjustments to the desk review system based on the 1st year ofimplementation and, as a result, the 2nd and 3rd years have gone more smoothly. For example, TEAhas changed their requirements for how local programs will respond to the report. In the 1st year,programs had to write responses to any out-of-compliance issues every quarter. Now, the finalend-of-the-year report is the only one that indicates whether a program is out of compliance, andprogram directors write responses once a year. In their responses, directors must detail theirstrategies for improvement and include any requests for help from the state office. The state officekeeps a history of the out-of-compliance issues, and managers can see which issues arise year afteryear.Usage and ResultsLocal programs reported learning a lot through the reports. The state director remarked thatthe impact of desk review “really woke people up to look at their data more. . . . They really look atthe data sign-off sheet. . . . We’ve had it [in its old format] for years [but] now they are payingattention. . . . We also take them to task over the issues where they are out of compliance. It’s nolonger a chore; it’s something that lives and breathes.”The state managers found that the desk review system is a helpful aid during site visits,particularly those requiring a short turnaround. The quarterly reports show the state managers(a) whether the programs are entering data, and (b) how successful programs are for key factors suchas post-test percentages.TEA currently does not tie performance awards or funding to the system. However, over thenext 2 years, TEA will likely move to a performance-based reward system using AEGIS. In addition,the state office acknowledges programs with high program scores by recognizing them withcertificates at annual business meetings. The state director reports that these certificates “are prettyimportant to the programs; it’s a big deal to them. They talk about it for years to come.”Future DirectionsIn the future, TEA is seeking to put a number of improvements in place, including thefollowing:• Developing a statewide reporting capability linked to the e-grant system that would allowTexas to compare like programs to help with program improvement. Currently, thereports can only be run by individual programs, so comparisons among programs are notpossible.• Looking into efficiency indicators, such as cost per student or cost per GED. Becausefiscal data are linked, building these indicators into the quarterly reports will be relativelystraightforward.A-28 <strong>Desk</strong> <strong>Monitoring</strong>: Improving Program Performance
• Giving program directors control to define and run reports. Giving program directorsaccess and control would empower programs.• Looking across programs to give needs summaries to regional training centers.For More InformationFor more information, see the Texas Education Agency’s Web pages on Adult andCommunity Education, http://www.tea.state.tx.us/adult/. From there, you can link to TexasLEARNS, which includes training resources and an Adult Education Administrators’ Manual:http://www-tcall.tamu.edu/texaslearns/05admanual/cover.htm.<strong>Desk</strong> <strong>Monitoring</strong>: Improving Program Performance A-29