Baseline U.S Economic Outlook Summary Table*
2iWoUQa
2iWoUQa

You also want an ePaper? Increase the reach of your titles
YUMPU automatically turns print PDFs into web optimized ePapers that Google loves.
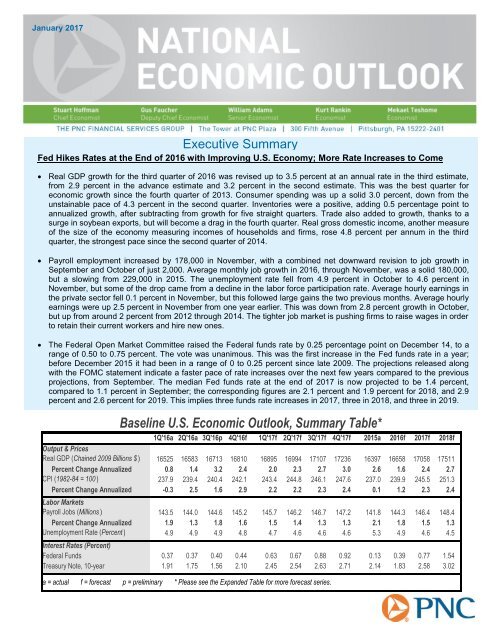
January 2017<br />
Executive <strong>Summary</strong><br />
Fed Hikes Rates at the End of 2016 with Improving U.S. Economy; More Rate Increases to Come<br />
Real GDP growth for the third quarter of 2016 was revised up to 3.5 percent at an annual rate in the third estimate,<br />
from 2.9 percent in the advance estimate and 3.2 percent in the second estimate. This was the best quarter for<br />
economic growth since the fourth quarter of 2013. Consumer spending was up a solid 3.0 percent, down from the<br />
unstainable pace of 4.3 percent in the second quarter. Inventories were a positive, adding 0.5 percentage point to<br />
annualized growth, after subtracting from growth for five straight quarters. Trade also added to growth, thanks to a<br />
surge in soybean exports, but will become a drag in the fourth quarter. Real gross domestic income, another measure<br />
of the size of the economy measuring incomes of households and firms, rose 4.8 percent per annum in the third<br />
quarter, the strongest pace since the second quarter of 2014.<br />
Payroll employment increased by 178,000 in November, with a combined net downward revision to job growth in<br />
September and October of just 2,000. Average monthly job growth in 2016, through November, was a solid 180,000,<br />
but a slowing from 229,000 in 2015. The unemployment rate fell from 4.9 percent in October to 4.6 percent in<br />
November, but some of the drop came from a decline in the labor force participation rate. Average hourly earnings in<br />
the private sector fell 0.1 percent in November, but this followed large gains the two previous months. Average hourly<br />
earnings were up 2.5 percent in November from one year earlier. This was down from 2.8 percent growth in October,<br />
but up from around 2 percent from 2012 through 2014. The tighter job market is pushing firms to raise wages in order<br />
to retain their current workers and hire new ones.<br />
The Federal Open Market Committee raised the Federal funds rate by 0.25 percentage point on December 14, to a<br />
range of 0.50 to 0.75 percent. The vote was unanimous. This was the first increase in the Fed funds rate in a year;<br />
before December 2015 it had been in a range of 0 to 0.25 percent since late 2009. The projections released along<br />
with the FOMC statement indicate a faster pace of rate increases over the next few years compared to the previous<br />
projections, from September. The median Fed funds rate at the end of 2017 is now projected to be 1.4 percent,<br />
compared to 1.1 percent in September; the corresponding figures are 2.1 percent and 1.9 percent for 2018, and 2.9<br />
percent and 2.6 percent for 2019. This implies three funds rate increases in 2017, three in 2018, and three in 2019.<br />
<strong>Baseline</strong> U.S. <strong>Economic</strong> <strong>Outlook</strong>, <strong>Summary</strong> <strong>Table*</strong><br />
1Q'16a 2Q'16a 3Q'16p 4Q'16f 1Q'17f 2Q'17f 3Q'17f 4Q'17f 2015a 2016f 2017f 2018f<br />
Output & Prices<br />
Real GDP (Chained 2009 Billions $ ) 16525 16583 16713 16810 16895 16994 17107 17236 16397 16658 17058 17511<br />
Percent Change Annualized 0.8 1.4 3.2 2.4 2.0 2.3 2.7 3.0 2.6 1.6 2.4 2.7<br />
CPI (1982-84 = 100 ) 237.9 239.4 240.4 242.1 243.4 244.8 246.1 247.6 237.0 239.9 245.5 251.3<br />
Percent Change Annualized -0.3 2.5 1.6 2.9 2.2 2.2 2.3 2.4 0.1 1.2 2.3 2.4<br />
Labor Markets<br />
Payroll Jobs (Millions ) 143.5 144.0 144.6 145.2 145.7 146.2 146.7 147.2 141.8 144.3 146.4 148.4<br />
Percent Change Annualized 1.9 1.3 1.8 1.6 1.5 1.4 1.3 1.3 2.1 1.8 1.5 1.3<br />
Unemployment Rate (Percent ) 4.9 4.9 4.9 4.8 4.7 4.6 4.6 4.6 5.3 4.9 4.6 4.5<br />
Interest Rates (Percent)<br />
Federal Funds 0.37 0.37 0.40 0.44 0.63 0.67 0.88 0.92 0.13 0.39 0.77 1.54<br />
Treasury Note, 10-year 1.91 1.75 1.56 2.10 2.45 2.54 2.63 2.71 2.14 1.83 2.58 3.02<br />
a = actual f = forecast p = preliminary * Please see the Expanded Table for more forecast series.
600<br />
500<br />
400<br />
300<br />
200<br />
100<br />
0<br />
-100<br />
-200<br />
With Solid Job Growth in 2016, Labor<br />
Market Is Approaching Full Employment<br />
Establishment Survey<br />
Household Survey<br />
Monthly Change in Employment<br />
(3-month MA, ths.)<br />
-300<br />
'12 '13 '14 '15 '16<br />
Wage Growth Slowed in November, But Still Up<br />
From a Few Years Ago as Job Market Gets Tighter<br />
1.2<br />
'07 '08 '09 '10 '11 '12 '13 '14 '15 '16<br />
Fiscal Stimulus Will Prompt Stronger <strong>Economic</strong> Growth in 2017 and 2018, But Many Question Marks Remain<br />
The U.S. economy is in solid shape at the start of this year, with the economic expansion set to continue throughout 2017 and into<br />
2018. The big changes in policies that could come from a Trump administration also have created a great deal of uncertainty about<br />
what the economy will look like in a few years, but when was the future ever known with certainty?<br />
Expansionary fiscal policy will likely add to economic growth in the latter half of 2017 and in 2018. President Trump and the<br />
Republican-controlled Congress will work together to cut personal and corporate income tax rates, increase federal spending on<br />
infrastructure and defense, and reduce regulations, starting with Obamacare. It will take some time for these policies to be enacted<br />
and then impact the economy, but by later this year these policies should be providing a noticeable boost to economic growth. PNC<br />
is forecasting real GDP growth of 2.4 percent for 2017 and 2.7 percent for 2018, up from a forecast of around 2¼ percent for both<br />
years prior to the election.<br />
Current economic conditions are favorable. Job growth in 2016 was about double the pace of underlying labor force growth,<br />
allowing for further absorption of labor market slack that has persisted since the Great Recession. The unemployment rate has<br />
moved below 5 percent, and other measures of job market slack are returning to healthy levels. The job market should be close to<br />
full employment later this year, with most people who want a job, and have the necessary skills, able to find work. With the tighter<br />
job market increased competition for workers has pushed businesses to raise pay. Job and wage gains are boosting personal<br />
income, allowing households to increase their spending; many are also benefitting from higher stock and house prices. As a result<br />
consumer spending will continue to lead economic growth in 2017. Also, the housing market will continue to gradually recover from<br />
the Great Recession. And business investment is increasing, albeit more slowly compared to previous expansions.<br />
Some drags on growth of the past few years are lifting. After adding too much inventory in 2015 and early 2016, businesses have<br />
cut orders to below sales to fix the problem. Indeed, inventory rebuilding will promote economic growth this year. With the<br />
stabilization in energy prices since mid-2016, energy production bottomed out last summer and the numbers of working oil and gas<br />
rigs are rising; this has contributed to a rebound in manufacturing. And the Federal government, which had been a weight on the<br />
economy because of spending cuts, tax increases and regulations, is now poised to promote economic and job growth.<br />
However, the risks to the outlook are now larger than they were previously. Although global economic growth is set to pick up in<br />
2017, in part due to improvement in Europe, trade disputes could threaten the global economy and weigh on U.S. exports. In<br />
addition, the dollar has strengthened since the presidential election, on top of a sizable strengthening from 2014 to early 2016. The<br />
stronger dollar will encourage imports and discourage exports, leading to a larger trade deficit that will weigh on growth.<br />
With further economic expansion in 2017 the labor market will continue to improve, with job growth of around 170,000 per month.<br />
There is little room for the unemployment rate to move lower, and it will end 2017 at around 4.5 percent. The Federal Open Market<br />
Committee will gradually increase the Federal funds rate over the next few years, with PNC expecting two 25 basis point Fed funds<br />
rate increases in 2017 (one fewer than in the latest FOMC median projection), and four 25 basis point funds rate increases in 2018<br />
(one more than in the FOMC median projection), bringing the funds rate up to a range of 2.00 to 2.25 percent by the end of 2018.<br />
Longer-term interest rates will also increase, but not by as much as short-term rates. Given solid fundamentals, including good job<br />
growth, low inflation, and few indications of overvalued asset prices, the probability of recession this year is low, about 15 percent.<br />
But the probability of recession will build in 2018 because of a fiscal stimulus with an already-tight labor market, rising interest rates,<br />
and the potential for policy disruptions to global trade flows. With the job market already near full employment and expansionary<br />
fiscal policy likely, inflation is set to pick up over the next couple of years. Higher inflation expectations have already led to<br />
increases in both short-term and long-term interest rates. So far the increases have not been enough to create a significant drag on<br />
growth, but if inflation picks up more than expected and the Federal Reserve is forced to raise rates quickly, then the economic<br />
expansion could be in trouble down the road.<br />
Visit http://www.pnc.com/economicreports to view the full listing of economic reports published by PNC’s economists.<br />
2<br />
4.0<br />
3.6<br />
3.2<br />
2.8<br />
2.4<br />
2.0<br />
1.6<br />
Unemployment rate, % (R)<br />
Avg. hourly earnings,<br />
% change year ago (L)<br />
10.5<br />
10.0<br />
9.5<br />
9.0<br />
8.5<br />
8.0<br />
7.5<br />
7.0<br />
6.5<br />
6.0<br />
5.5<br />
5.0<br />
4.5<br />
4.0
5.0<br />
4.5<br />
4.0<br />
3.5<br />
3.0<br />
2.5<br />
2.0<br />
1.5<br />
1.0<br />
0.5<br />
0.0<br />
-0.5<br />
-1.0<br />
-1.5<br />
End to Inventory Correction<br />
Boosted Third Quarter GDP<br />
Real GDP, annualized % change<br />
'12 '13 '14 '15 '16<br />
Utilities a Big Drag in November, But Industrial<br />
1.2 Production in Better Shape in Second Half of 2016 79.5<br />
1.0<br />
0.8<br />
0.6<br />
0.4<br />
0.2<br />
0.0<br />
-0.2<br />
-0.4<br />
-0.6<br />
-0.8<br />
-1.0<br />
Capacity<br />
utilization,<br />
% (R)<br />
Industrial production,<br />
% change (L)<br />
-1.2<br />
'13 A J O '14 A J O '15 A J O '16 A A N<br />
79.0<br />
78.5<br />
78.0<br />
77.5<br />
77.0<br />
76.5<br />
76.0<br />
75.5<br />
75.0<br />
74.5<br />
7<br />
6<br />
5<br />
Job Growth Has Slowed in 2016, But Still<br />
Strong Enough to Tighten Labor Market<br />
Employment, % change year ago<br />
15<br />
10<br />
With Sustainable House Price Growth,<br />
Housing Affordability in Good Shape<br />
% change year ago<br />
Case-Shiller (20-city)<br />
4<br />
5<br />
3<br />
2<br />
1<br />
0<br />
Construction<br />
-1<br />
Manufacturing<br />
-2<br />
Services, ex-government<br />
-3<br />
'11 '12 '13 '14 '15 '16<br />
0<br />
-5<br />
FHFA purchase-only<br />
-10<br />
-15<br />
-20<br />
'09 '10 '11 '12 '13 '14 '15 '16<br />
5,000<br />
4,800<br />
4,600<br />
4,400<br />
4,200<br />
4,000<br />
3,800<br />
3,600<br />
Home Sales Slowed in November, But<br />
Underlying Trend Remains Positive<br />
3,400<br />
Existing single-family home sales,<br />
3,200<br />
annual rate, ths. (L)<br />
New single-family home sales,<br />
3,000<br />
annual rate, ths. (R)<br />
'09 '10 '11 '12 '13 '14 '15 '16<br />
700<br />
650<br />
600<br />
550<br />
500<br />
450<br />
400<br />
350<br />
300<br />
250<br />
Gradual Recovery in Residential<br />
Construction Will Continue Into 2017<br />
1,400<br />
1,350<br />
Seasonally adjusted annualized rate, ths.<br />
1,300<br />
Permits Starts Completions<br />
1,250<br />
1,200<br />
1,150<br />
1,100<br />
1,050<br />
1,000<br />
950<br />
900<br />
850<br />
800<br />
750<br />
700<br />
650<br />
'13 '14 '15 '16<br />
Visit http://www.pnc.com/economicreports to view the full listing of economic reports published by PNC’s economists.<br />
3
3.5<br />
3.0<br />
2.5<br />
2.0<br />
1.5<br />
1.0<br />
0.5<br />
0.0<br />
-0.5<br />
-1.0<br />
-1.5<br />
-2.0<br />
Further Strengthening in Inflation Will<br />
Support Two Fed Funds Rate Hikes in 2017<br />
-2.5<br />
PPI<br />
-3.0<br />
CPI<br />
-3.5<br />
Core CPI<br />
-4.0<br />
% change year ago<br />
-4.5<br />
'13 '14 '15 '16<br />
OPEC Agreement on Production Cuts, Stronger<br />
140Demand Likely to Push Energy Prices Higher in 20174.25<br />
130<br />
4.00<br />
120<br />
3.75<br />
110<br />
3.50<br />
100<br />
3.25<br />
90<br />
3.00<br />
80<br />
2.75<br />
70<br />
2.50<br />
60<br />
2.25<br />
50<br />
2.00<br />
Brent Crude Oil, $/BBL (L)<br />
40<br />
1.75<br />
Unleaded Gasoline, $/gal (R)<br />
30<br />
1.50<br />
'05 '06 '07 '08 '09 '10 '11 '12 '13 '14 '15 '16<br />
After Small November Decline, Income to Bounce Back<br />
in December; Consumer Fundamentals Are Good<br />
0.9<br />
0.8<br />
0.7<br />
0.6<br />
0.5<br />
0.4<br />
0.3<br />
0.2<br />
0.1<br />
0.0<br />
-0.1<br />
-0.2<br />
-0.3<br />
Real after-tax income<br />
-0.4<br />
Real pers. consumption expenditure<br />
-0.5<br />
-6.42%<br />
% change<br />
-0.6<br />
'13 A J O '14 A J O '15 A J O '16 A J O<br />
A Solid Holiday Season, But Traditional<br />
Retailers Continue to Struggle<br />
1.6<br />
Retail sales, % change<br />
1.4<br />
1.2<br />
1.0<br />
0.8<br />
0.6<br />
0.4<br />
0.2<br />
0.0<br />
-0.2<br />
-0.4<br />
-0.6<br />
-0.8<br />
-1.0<br />
Total<br />
-1.2<br />
Ex-auto<br />
-1.4<br />
Ex-auto, gasoline<br />
-1.6<br />
'13 '14 '15 '16<br />
19<br />
18<br />
17<br />
16<br />
15<br />
14<br />
13<br />
12<br />
11<br />
10<br />
Auto Sales Should Hit 17.5 Million<br />
for Second Straight Year in 2017<br />
Auto and light truck sales (domestic & foreign)<br />
Auto and light truck assemblies (domestic only)<br />
Mil., annualized rate<br />
9<br />
'13 '14 '15 '16<br />
28<br />
24<br />
20<br />
16<br />
12<br />
8<br />
4<br />
0<br />
Low Unemployment, Low Inflation, Solid<br />
House Price Growth All Good for Households<br />
Note: PNC calculates HESI<br />
with the Case-Shiller 20-<br />
City Composite HPI<br />
Household <strong>Economic</strong> Stress Index,<br />
-4<br />
HESI = U. Rate + CPI %chya – HPI<br />
%chya<br />
-8<br />
'09 '10 '11 '12 '13 '14 '15 '16<br />
Visit http://www.pnc.com/economicreports to view the full listing of economic reports published by PNC’s economists.<br />
4
<strong>Baseline</strong> U.S. <strong>Economic</strong> <strong>Outlook</strong>, Expanded Table<br />
1Q'16a 2Q'16a 3Q'16p 4Q'16f 1Q'17f 2Q'17f 3Q'17f 4Q'17f 2015a 2016f 2017f 2018f<br />
Output<br />
Nominal GDP (Billions $ ) 18282 18450 18658 18887 19070 19272 19492 19739 18037 18569 19393 20310<br />
Percent Change Annualized 1.3 3.7 4.6 5.0 3.9 4.3 4.7 5.1 3.7 3.0 4.4 4.7<br />
Real GDP (Chained 2009 Billions $ ) 16525 16583 16713 16810 16895 16994 17107 17236 16397 16658 17058 17511<br />
Percent Change Annualized 0.8 1.4 3.2 2.4 2.0 2.3 2.7 3.0 2.6 1.6 2.4 2.7<br />
Pers. Consumption Expenditures 11365 11485 11564 11644 11713 11783 11852 11928 11215 11514 11819 12099<br />
Percent Change Annualized 1.6 4.3 2.8 2.8 2.4 2.4 2.4 2.6 3.2 2.7 2.6 2.4<br />
Nonresidential Fixed Investment 2180 2185 2186 2198 2210 2225 2242 2258 2200 2187 2234 2288<br />
Percent Change Annualized -3.4 1.0 0.1 2.3 2.2 2.7 2.9 2.9 2.1 -0.6 2.1 2.4<br />
Residential Investment 601 589 582 595 602 608 614 619 565 592 611 626<br />
Percent Change Annualized 7.8 -7.8 -4.4 9.1 4.9 3.9 4.0 3.5 11.7 4.8 3.2 2.5<br />
Change in Private Inventories 41 -10 8 20 25 32 35 45 84 15 34 48<br />
Net Exports -566 -559 -521 -552 -568 -579 -582 -586 -540 -549 -579 -587<br />
Government Expenditures 2913 2901 2903 2914 2921 2933 2955 2980 2884 2908 2947 3045<br />
Percent Change Annualized 1.6 -1.7 0.2 1.5 1.1 1.6 3.0 3.5 1.8 0.8 1.4 3.3<br />
Industrial Prod. Index (2012 = 100 ) 104.1 103.9 104.4 104.8 105.3 105.9 106.4 107.1 105.2 104.3 106.2 108.7<br />
Percent Change Annualized -1.7 -0.8 2.0 1.5 1.9 2.0 2.2 2.4 0.3 -0.8 1.8 2.4<br />
Capacity Utilization (Percent ) 75.4 75.2 75.5 75.8 76.0 76.3 76.6 77.0 76.7 75.5 76.5 77.7<br />
Prices<br />
CPI (1982-84 = 100 ) 237.9 239.4 240.4 242.1 243.4 244.8 246.1 247.6 237.0 239.9 245.5 251.3<br />
Percent Change Annualized -0.3 2.5 1.6 2.9 2.2 2.2 2.3 2.4 0.1 1.2 2.3 2.4<br />
Core CPI Index (1982-84 = 100) 245.8 247.0 248.2 249.5 250.8 252.2 253.6 255.1 242.2 247.6 252.9 258.7<br />
Percent Change Annualized 2.7 2.1 1.9 2.1 2.2 2.2 2.3 2.3 1.8 2.2 2.1 2.3<br />
PCE Price Index (2009 = 100 ) 110.0 110.5 110.9 111.6 112.1 112.6 113.1 113.7 109.5 110.7 112.9 115.2<br />
Percent Change Annualized 0.3 2.0 1.4 2.5 1.8 1.8 1.9 2.0 0.3 1.1 1.9 2.0<br />
Core PCE Price Index (2009 = 100 ) 110.7 111.2 111.6 112.1 112.6 113.1 113.6 114.2 109.5 111.4 113.4 115.6<br />
Percent Change Annualized 2.1 1.8 1.7 1.8 1.8 1.8 1.9 1.9 1.4 1.7 1.8 2.0<br />
GDP Price Index (2009 = 100 ) 110.6 111.3 111.6 112.4 112.9 113.4 114.0 114.6 110.0 111.5 113.7 116.1<br />
Percent Change Annualized 0.5 2.3 1.4 2.6 1.9 2.0 2.0 2.1 1.1 1.3 2.0 2.1<br />
Crude Oil, WTI ($/Barrel ) 33.2 45.4 44.9 48.8 49.0 49.0 49.5 50.0 48.7 43.1 49.4 53.4<br />
Labor Markets<br />
Payroll Jobs (Millions ) 143.5 144.0 144.6 145.2 145.7 146.2 146.7 147.2 141.8 144.3 146.4 148.4<br />
Percent Change Annualized 1.9 1.3 1.8 1.6 1.5 1.4 1.3 1.3 2.1 1.8 1.5 1.3<br />
Unemployment Rate (Percent ) 4.9 4.9 4.9 4.8 4.7 4.6 4.6 4.6 5.3 4.9 4.6 4.5<br />
Average Weekly Hours, Prod. Works. 33.7 33.6 33.6 33.7 33.7 33.7 33.8 33.8 33.7 33.6 33.8 33.9<br />
Personal Income<br />
Average Hourly Earnings ($ ) 21.36 21.49 21.63 21.78 21.94 22.09 22.25 22.42 21.04 21.56 22.18 22.85<br />
Percent Change Annualized 2.4 2.4 2.7 2.8 2.9 2.9 3.0 3.1 2.1 2.5 2.8 3.0<br />
Real Disp. Income (2009 Billions $ ) 12556 12647 12731 12800 12884 12971 13072 13169 12343 12683 13024 13399<br />
Percent Change Annualized 2.1 2.9 2.7 2.2 2.7 2.7 3.1 3.0 3.5 2.8 2.7 2.9<br />
Housing<br />
Housing Starts (Ths., Ann. Rate ) 1151 1159 1145 1182 1185 1194 1209 1221 1108 1160 1202 1236<br />
Ext. Home Sales (Ths., Ann Rate ) 5300 5503 5390 5556 5657 5733 5784 5816 5233 5437 5748 5941<br />
New SF Home Sales (Ths., Ann Rate ) 529 565 588 579 588 594 604 612 502 565 600 614<br />
Case/Shiller HPI (Jan. 2000 = 100 ) 178.5 179.4 181.7 183.8 185.1 186.7 188.3 189.9 172.3 180.9 187.5 193.6<br />
Percent Change Year Ago 5.2 5.0 5.2 4.4 3.7 4.1 3.6 3.3 4.6 4.9 3.7 3.3<br />
Consumer<br />
Household <strong>Economic</strong> Stress Index 0.8 0.9 0.9 2.1 3.3 2.8 3.4 3.5 0.8 1.2 3.3 3.6<br />
Auto Sales (Millions ) 17.3 17.1 17.5 17.8 17.6 17.5 17.5 17.5 17.4 17.4 17.5 17.6<br />
Consumer Credit (Billions $ ) 3585 3643 3707 3752 3795 3837 3878 3919 3459 3672 3857 4024<br />
Percent Change Annualized 5.8 6.6 7.2 4.9 4.7 4.5 4.4 4.3 6.9 6.1 5.1 4.3<br />
Interest Rates (Percent)<br />
Prime Rate 3.50 3.50 3.50 3.55 3.75 3.79 4.00 4.05 3.26 3.51 3.90 4.67<br />
Federal Funds 0.37 0.37 0.40 0.44 0.63 0.67 0.88 0.92 0.13 0.39 0.77 1.54<br />
3-Month Treasury Bill 0.29 0.26 0.30 0.43 0.68 0.83 0.97 1.10 0.05 0.32 0.89 1.60<br />
10-Year Treasury Note 1.91 1.75 1.56 2.10 2.45 2.54 2.63 2.71 2.14 1.83 2.58 3.02<br />
30-Year Fixed Mortgage 3.74 3.59 3.45 3.76 4.10 4.18 4.25 4.31 3.85 3.64 4.21 4.54<br />
a = actual f = forecast p = preliminary