

Download - Ivie

You also want an ePaper? Increase the reach of your titles
YUMPU automatically turns print PDFs into web optimized ePapers that Google loves.
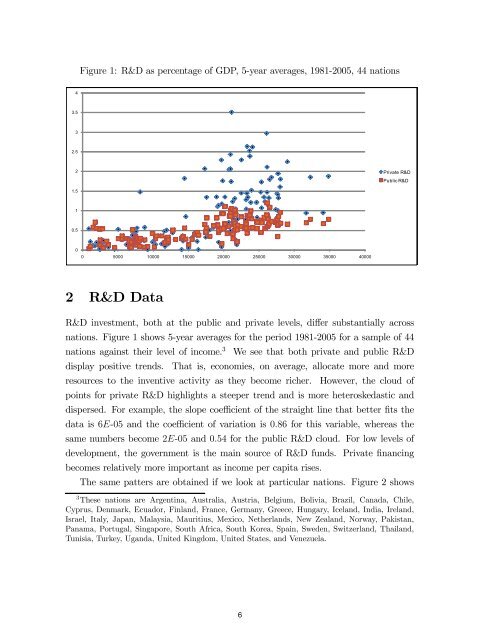
Figure 1: R&D as percentage of GDP, 5-year averages, 1981-2005, 44 nations<br />
4<br />
3.5<br />
3<br />
2.5<br />
2<br />
Private R&D<br />
Public R&D<br />
1.5<br />
1<br />
0.5<br />
0<br />
0 5000 10000 15000 20000 25000 30000 35000 40000<br />
2 R&D Data<br />
R&D investment, both at the public and private levels, differ substantially across<br />
nations. Figure 1 shows 5-year averages for the period 1981-2005 for a sample of 44<br />
nations against their level of income. 3 We see that both private and public R&D<br />
display positive trends. That is, economies, on average, allocate more and more<br />
resources to the inventive activity as they become richer. However, the cloud of<br />
points for private R&D highlights a steeper trend and is more heteroskedastic and<br />
dispersed. For example, the slope coefficient of the straight line that better fits the<br />
data is 6E-05 and the coefficient of variation is 0.86 for this variable, whereas the<br />
same numbers become 2E-05 and 0.54 for the public R&D cloud. For low levels of<br />
development, the government is the main source of R&D funds. Private financing<br />
becomes relatively more important as income per capita rises.<br />
The same patters are obtained if we look at particular nations. Figure 2 shows<br />
3 These nations are Argentina, Australia, Austria, Belgium, Bolivia, Brazil, Canada, Chile,<br />
Cyprus, Denmark, Ecuador, Finland, France, Germany, Greece, Hungary, Iceland, India, Ireland,<br />
Israel, Italy, Japan, Malaysia, Mauritius, Mexico, Netherlands, New Zealand, Norway, Pakistan,<br />
Panama, Portugal, Singapore, South Africa, South Korea, Spain, Sweden, Switzerland, Thailand,<br />
Tunisia, Turkey, Uganda, United Kingdom, United States, and Venezuela.<br />
3<br />
6


